 Zhao Wang1
 Qiang Zhang
 Zhicheng Yang
 Zhengbo Zhang
95% of researchers rate our articles as excellent or good
Learn more about the work of our research integrity team to safeguard the quality of each article we publish.
Find out more
ORIGINAL RESEARCH article
Front. Physiol. , 25 August 2022
Sec. Exercise Physiology
Volume 13 - 2022 | https://doi.org/10.3389/fphys.2022.897412
This article is part of the Research Topic New Technologies and Statistical Models Applied to Sports and Exercise Science Research: Methodological, Technical and Practical Considerations View all 6 articles
Oxygen uptake (VO2) is an important parameter in sports medicine, health assessment and clinical treatment. At present, more and more wearable devices are used in daily life, clinical treatment and health care. The parameters obtained by wearables have great research potential and application prospect. In this paper, an instantaneous VO2 estimation model based on XGBoost was proposed and verified by using data obtained from a medical-grade wearable device (Beijing SensEcho) at different posture and activity levels. Furthermore, physiological characteristics extracted from single-lead electrocardiogram, thoracic and abdominal respiration signal and tri-axial acceleration signal were studied to optimize the model. There were 29 healthy volunteers recruited for the study to collect data while stationary (lying, sitting, standing), walking, Bruce treadmill test and recuperating with SensEcho and the gas analyzer (Metalyzer 3B). The results show that the VO2 values estimated by the proposed model are in good agreement with the true values measured by the gas analyzer (R2 = 0.94 ± 0.03, n = 72,235), and the mean absolute error (MAE) is 1.83 ± 0.59 ml/kg/min. Compared with the estimation method using a separate heart rate as input, our method reduced MAE by 54.70%. At the same time, other factors affecting the performance of the model were studied, including the influence of different input signals, gender and movement intensity, which provided more enlightenment for the estimation of VO2. The results show that the proposed model based on cardio-pulmonary physiological signals as inputs can effectively improve the accuracy of instantaneous VO2 estimation in various scenarios of activities and was robust between different motion modes and state. The VO2 estimation method proposed in this paper has the potential to be used in daily life covering the scenario of stationary, walking and maximal exercise.
Assessment of the functional capacity of the cardiovascular system is essential in sports medicine and clinical settings (Kaminsky et al., 2019). Oxygen uptake (VO2), which indicates an individual’s aerobic capacity (Hill and Lupton, 1923), provides important information for monitoring exercise intensities and changes in an athlete’s fitness during training. At the same time, as Metabolic Equivalency Task (MET) (Negus et al., 1987), VO2 is a standard indicator of individual metabolic rate and subsequent physical activity. It is used to provide general medical thresholds and guidelines for people with chronic diseases such as obesity and Type 2 diabetes (Hupin et al., 2015). In addition, steady state VO2 measurements are considered to be the gold standard for estimating energy expenditure (EE) in light to moderate steady motion (Scott, 2005; Altini et al., 2015). The peak VO2 reached during incremental motion is called the maximum VO2 (as VO2max). In physical training, VO2max and its derivatives [including vVO2max (Billat, 2001) and TLim-vVO2max (Fernandes et al., 2006)] are widely used in physical training programs and have been shown to be helpful in improving athletes’ performance.
The traditional VO2 measurement methods mainly focus on direct calorimetry in metabolic chambers (Kenny et al., 2017), double-label water (Hills et al., 2014) or indirect calorimetry (Leonard, 2012) with face masks as the “gold standard”, which are not suitable for daily exercise due to the need for expensive gas analysis, ventilation equipment and medical care. Some researchers have refined existing devices such as COSMED K5 (Guidetti et al., 2018), VO2 Master (Montoye et al., 2020) and Jaeger (Díaz et al., 2008) to develop portable calorimetric systems capable of accurately measuring VO2 in outdoor conditions. However, the high cost and highly visible components such as masks and gas analyzers limit the use of portable calorimetric systems in non-laboratory settings.
Heart rate (HR) was a low-cost and non-invasive method of estimating VO2 because of its strong linear relationship with VO2 during a large amount of aerobic exercise (Livingstone, 1997). Therefore, many studies have proposed their models for predicting VO2 and VO2max using HR (Pulkkinen et al., 2004; Nevill and Cooke, 2016; Mazzoleni et al., 2018; Lanferdini et al., 2020). However, the model performance of predicting VO2 only with HR is limited due to the ambiguous relationship between HR and VO2 at rest and low intensity motion, as well as transitions between different activities (Pulkkinen et al., 2004). In addition, HR measurements are susceptible to both internal [stress, emotions, etc. (Lanferdini et al., 2020)] and external [Wrist-based Photoplethysmography assessment of HR is affected by the environment, skin, sweat, etc. (Spurr et al., 1988)] factors. The Flex-HR model is one of the most commonly used HR-based methods for VO2 estimation in the field. Considering the non-linear relationship of HR-VO2 during low intensity motion, bilinear model was used to improve accuracy (Spurr et al., 1988). Acceleration (ACC) sensors can detect postural motion information to identify the type and intensity of motion (Crouter et al., 2010; Ellis et al., 2014), which, in combination with HR, improves the accuracy of the VO2 estimation (Strath et al., 2005). Andrew et al. (Cook et al., 2018) estimated real-time VO2 using ACC, HR and demographic characteristics as inputs to a multiple linear regression model. A total of 42 subjects (including healthy, athletic and obese) were recruited in the experiment for the Bruce treadmill experiment, which showed a strong linear correlation between the predicted VO2 and the actual VO2 (r = 0.93). Respiratory signals can represent changes in lung ventilation during exercise (Gastinger et al., 2014), and a linear relationship between the pulmonary ventilation and VO2 has been found to be superior to that of HR (Gastinger et al., 2010). Andrea et al. (Nicolò et al., 2017) suggested that researchers need to focus on the potential of respiratory signal in exercise training to identify EE in subjects’ daily activities through the combination of HR and respiration rate (RR), which is more accurate than using a HR model alone. Recognizing that respiration signals are another key factor in the high correlation with VO2. Beltrame et al. (2017) considered not only HR and ACC information, but also RR and the calculated per minute ventilation (VE) based on the respiratory signals collected by the wearable shirt. However, Beltrame only considered daily routines and low-intensity exercise, and the subjects in the study did not reach the level of VO2max.
With the development of wearable devices, it has become a promising method to predict VO2 through physiological parameters obtained by devices such as smart watches or shirts. For example, sports watches like Apple watch (Falter et al., 2019) and Fitbit (Sasaki et al., 2015) can track EE in real time, which is non-intrusive and portable. A representative wearable smart shirt Hexoskin (Beltrame et al., 2017) can obtain a wide range of physiological parameters of the wearer to improve the accuracy of VO2 estimate mentioned in the previous paragraph. In addition, many researchers have used self-designed portable devices (Lu et al., 2019) to collect physiological signals for VO2 and VO2max prediction. Shandhi et al. (2020) developed a novel wearable patch that can obtain seismocardiogram (SCG), electrocardiogram (ECG) and atmospheric pressure (AP) signals, and they extracted features from these signals to estimate the VO2 with the R2 of 0.77.
So far, there have been some researches on the real-time prediction of VO2 based on easily available physiological signals. However, there are still some problems to be solved. First, VO2 still cannot be accurately estimated in rest, low-intensity exercise, and maximal exercise. Second, although some consumer-grade watches provide the function of giving VO2 in daily activities, they are probably not accurate enough for sports or health care (Murakami et al., 2019; Passler et al., 2019). In order to further solve the above issues and improve the accuracy of VO2 estimation, the specific work of this study is summarized as follows:
1) Using wearable devices to simultaneously record ECG, respiration and ACC monitoring data, and extract features, including pulmonary ventilation related parameters, to establish a machine learning model to predict dynamic VO2 regardless of the current activity type.
2) The introduction of respiration features improves the effect of the VO2 estimation model in rest and low-intensity exercise. The features extracted from ACC signals reflect the exercise intensity of the subjects and play an important role in the instantaneous VO2 estimation.
3) The training data source experiment includes a variety of rest states, continuous different exercise mode stages including low-intensity, high-intensity exercise stages and exercise recovery stages, almost covering the activity mode in daily activities.
4) The effects of input parameters, gender, exercise intensity, and individual differences on model performance were comprehensively discussed in the study, providing more insight into the accurate estimation of VO2 in daily life and exercise.
A total of 31 healthy young volunteers were recruited for this study, mainly from non-sports postgraduate students in colleges and universities, including 19 males and 12 females. Each participant in the study followed the protocol approved by the IRB review board (IRB number: S2018-095-01) and approved the written informed consent procedure. Demographic information, including age, sex, weight, and height, was collected through a questionnaire. Due to the high exercise intensity during the experiment, some subjects experienced equipment dropping or ECG leads dislocation. Therefore, the final number of subjects with complete data collected for the entire procedure was 29 (17 male, 12 female). The demographic information is summarized in Table 1.
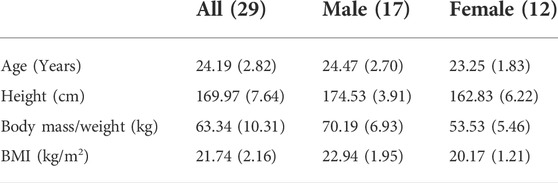
TABLE 1. The demographic information of the subjects [mean (sd)].
During the 2 hours before the experiments, participants were prohibited from drinking, eating, or performing excessive physical activity. Upon arrival at the test site, the subjects filled out a registration form and a cardiovascular risk questionnaire under the guidance of the researchers. The doctor assessed the potential exercise risk based on the results of the questionnaire, and then the subjects wore the SensEcho and Metalyzer 3B monitoring system under the supervision of a researcher, as shown in Figure 1B. The experiment includes three phases: rest, activity and recovery. During the resting period, subjects were in several postures, including standing, lying with straight legs, lying on the left side, lying on the right side, and sitting upright. In each posture, each subject performed normal breathing (1 min), deep breathing (1 min), talking (30 s), and fast breathing (30 s), with 30 s of rest and adjustment between postures. The duration of the entire phase was 17 min.

FIGURE 1. (A) SensEcho wearable device. (B) A subject configured with both the wearable vest and the gas analyzer (Metalyzer 3B). (C) Metalyzer 3B. (D) POLAR V800. (E) Representative chest acceleration response during the experiments.
After completing the resting phase, each subject walked on the treadmill to warm up for 3 min, and then followed the Bruce exercise protocol, which is widely used in treadmill-based exercise tests (Hamlin et al., 2012) and clinical examinations (Bruce et al., 1973). This is a progressive test to reach the participant’s maximum tolerable activity level. Each phase lasts for 3 min, as shown in Table 2. During the Bruce test, if the subject is exhausted, the researcher will stop the treadmill, and the subject will enter the recovery phase and walk slowly on the treadmill until VO2 returns to his/her warm-up level. The duration of this phase does not exceed 20 min. Figure 1E shows the representative acceleration of the chest response throughout the experiment.
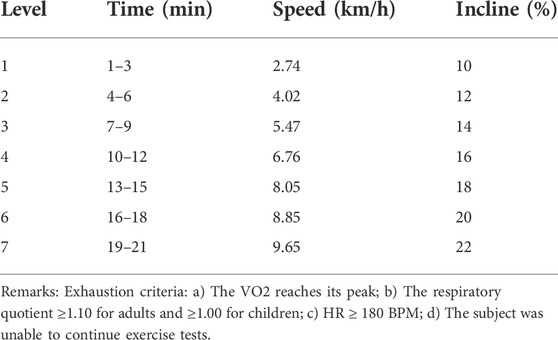
TABLE 2. The Bruce exercise protocol.
The Metalyzer 3B (Cortex, Germany) is a commonly used cardiopulmonary function testing device (Meyer et al., 2001). It uses a mixed gas or heart-to-heart testing method to collect vital signs parameters such as RR, HR, respiratory exchange rate in real time. It is widely used in the comparison of cardiopulmonary function experiments under different populations and conditions (Shieh et al., 2010; Xiong et al., 2013). The device consists of two parts: lung function detection and heart rate monitoring. We follow the “Two-Point Gas Calibration” method on Page 41 in the Operator’s Manual MetaLyzer 3B (CORTEX Biophysik, 2021). The span gas with 15% O2, 5% CO2, bal. in N2 was used to calibration the gas analyzer. The Metalyzer 3B (Cortex, Germany) shown in Figure 1C was used to collect VO2 data in seconds (fs = 1 Hz), and the POLAR V800 shown in Figure 1D was used as the gold standard to collect HR data (fs = 1 Hz). The subject is required to wear a matching face mask during the measurement.
The SensEcho (SensEcho, Beijing SensEcho Technology Co., Ltd.) we used in the experiment is a medical-grade wearable vest embedded with multiple biosensors to monitor various vital signs (Xu et al., 2020; Wang et al., 2021; Wang et al., 2022). The SensEcho system consists of three parts, namely, the sensors that collect physiological parameters, the wireless data transmission network and the central monitoring system. The ECG signals are collected through three electrode patches. Two induction belts are embedded in the chest and abdomen of the vest to collect the chest and abdomen motion signals to give an estimate of respiratory rate (RR). The errors of HR and RR measurement are both within ±2BPM. SensEcho uses ultra-low-power tri-axial accelerometer MMA7260 (Freescale Inc., TX, United States) to collect posture and motion information with an accuracy of 8 mg/LSB (Least Significant Bit). The main control chip of the system is an ultra-low-power ARM cortex-m3 MCU (EFM32GG330, Silicon Labs, United States) with a power consumption of 100 mW. Figure 1A shows SensEcho wearable vest. The system also provides local and cloud data storage solutions. When the cloud storage is unstable or unavailable, the local storage can be activated to save the original data in a 2 GB integrated flash drive. The single-lead ECG (sampling frequency fs = 200 Hz), respiratory signal (fs = 25 Hz), and tri-axial accelerometer data (fs = 25 Hz) were collected by medical-grade wearable devices, as shown in Figure 1A.
In the data preprocessing stage, this article performs filtering and noise reduction operations on each signal from SensEcho, and then extracts heart rate characteristics from SensEcho’s ECG, respiration rate and lung ventilation related characteristics from respiration signals, and exercise intensity from ACC data Features, as shown in Figure 2.
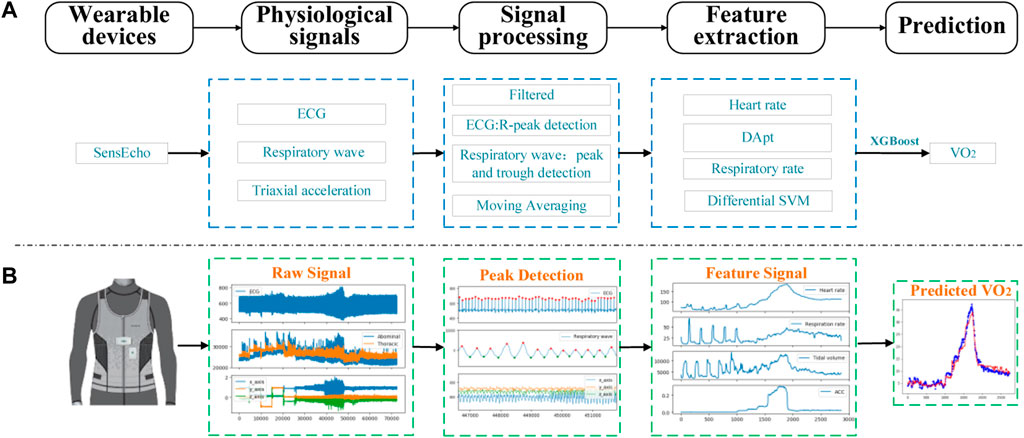
FIGURE 2. The process of signal acquisition, preprocessing and estimation with SensEcho wearable device. (A) A flow chart of the entire experiment. (B) An example of the visualization of key signal processes. (Abbreviations: ECG, Electrocardiograph; DApt, the difference between the amplitude of the wave peaks and the amplitude of the troughs, SVM, the signal vector magnitude of triaxial accelerometer).
The original ECG signal from the wearable vest was filtered by a finite impulse response (FIR) bandpass filter with cutoff frequencies of 3–45 Hz, which were selected for the ECG signal to reduce ST-band interference and to amplify the R-wave for better R-peak detection in the subsequent signal processing steps. The R-peaks detection used the classical E. P. Limited algorithm (Hamilton, 2002), the r-r interval was calculated by the difference of adjacent R peaks, and the HR with a sampling rate of 1 Hz was calculated with a time window of 4s and a moving step of 1s. The age-based maximum HR (HRmax) (Tanaka et al., 2001)and the ratio of current HR to age-based maximum HR (HR%) were got according to the following Eqs 1–3.
The wavelet decomposition technologies were applied to remove the offset effects in the breathing signals. Butterworth band-pass filter with the frequency of 0.1–0.35 Hz was applied to remove the high frequency noises. The NeuroKit (Makowski et al., 2020) program package was used to detect the respiratory wave peaks. The R-R interval was calculated by using the difference of adjacent respiratory wave peak. The difference amplitude (
The low-pass filter with 0.32 Hz was used to reduce the motion artifacts of ACC. After the filtering, the signal vector magnitude (SVM) was calculated, using the processed triaxial acceleration that had been obtained, with the formula as follows:
In the above formula, the output of the ACC refers to x_acc, y_acc, and z_acc, respectively. The mean absolute value of differential SVM (MADs) is calculated by the following formula, which represents the intensity of exercise.
In the formula, T is the time length (s) for MADs calculation, which is 1s in this paper.
Since the sampling rate of the gas analyzer is 1 Hz, to synchronize with it, we adopted monotone cubic interpolation to form the RR,
XGBoost (Extreme Gradient Boosting) (Chen et al., 2015) is a machine learning technique for regression and classification problems. It is based on the Gradient Boosting Decision Tree (GBDT), an open-source machine learning project. In XGBoost regression model, the result of the prediction is the sum of the scores predicted by K trees, as shown in the formula below:
In the above formula,
The loss function is represented by
The objective function to be optimized is given by the following formula:
The
Compared with GBDT, XGBoost has many algorithm and engineering improvements. XGBoost penalizes more complex models through LASSO (L1) and Ridge (L2) regularization to prevent overfitting (Morde, 2019). XGBoost naturally acknowledges the sparsity of the input by automatically learning to determine the maximum missing value based on training losses and to process the different types of sparse patterns in the data more efficiently (Chen et al., 2015). Therefore, it has been widely used in many machine learning competitions and achieved good results.
Firstly, the data set was divided into training set and validation set by the method of leaving one. Secondly, for each training set, the optimal parameters were selected by the method of grid search and five-fold cross-validation. Finally, the optimal parameter model was applied to the validation set to obtain the result. All steps were implemented in Python 3.6.
For convenience, we named the features of subject demographic information (including age, gender, and BMI) as SDI, and added a new feature RD, which includes
Leave-one-subject-out (LOSO) cross-validation was performed on n subjects. In each round, XGBoost regressor trained on the data from n-1 subjects, and the remaining sample is used as the test set in which the VO2 of the left-out subject was predicted. The process was repeated n-1 times with a different subject excluded each time. Performance of the different regression models and input parameters were evaluated using mean absolute error (MAE, ml/kg/min):
In the above formula, N was the numbers of
The coefficients of determination (R2) and Bland-Altman plot were used to analyze the consistency between the estimated VO2 (
Firstly, to explore the influence of different hyperparameters on the VO2 prediction accuracy of different models with the same input characteristics, 1) the accuracy of LR, RF and XGB models in VO2 prediction was compared when the input characteristics were HR%+RD + MADs + SDI, 2) the accuracy of LR and XGB for VO2 prediction was compared when the input characteristics were HR% + SDI, RD + SDI, MADs + SDI, HR% + RD + SDI, HR% + MADs + SDI, MADs + RD + SDI. Secondly, to study the influence of different hyperparameters on the model, three hyperparameters were selected. On the premise that the other two hyperparameters were fixed, the influence of the change of the other hyperparameter on the prediction VO2 error was compared. Thirdly, to investigate the importance of different input features, we compared the VO2 prediction error with and without of the input features. Fourthly, to explore the influence of gender on the prediction accuracy of the model, the MAE of VO2 prediction was compared between the same gender as the training set and different gender as the training set. Finally, to compare the stability of the proposed model and the activity-specific model, the differences of VO2 prediction between the two models in rest (Stand, Lie, Lying on the left side, Lying on the right side, Sit), Walk, Run and recovery states were compared.
Independent sample t-test was used for comparison between two groups. One-way ANOVA was used for comparison between multiple groups. Additionally, for the post-hoc testing, we applied the Tukey HSD test for comparisons between groups. The p-value for one-way ANOVA is less than 0.05 indicate that at least one of the treatment groups differs from the others. In our study, we considered that a p < 0.05 was statistically significant.
Linear regression (LR), random forest (RF), and XGBoost regression models were applied, and the XGBoost model worked best throughout the experiments with HR, RD, MADs, and SDI as model inputs. The MAE of VO2 predicted by these three models was significantly different (p < 0.05), but there was no significant difference of R2 (p > 0.05). Compared with LR and RF model, MAE of XGBoost model decreased by 0.74 ml/kg/min (p < 0.05) and 0.23 ml/kg/min (p > 0.05) respectively, and R2 increased by 0.06 (p > 0.05) and 0.02 (p > 0.05) respectively.
Further, the effects of different input signals on the accuracy of LR and XGBoost models were compared. Compared with LR, when the input signal was HR% + SDI, the MAE of XGBoost decreased by 0.20 ml/kg/min (p > 0.05), and R2 decreased by 0.01 (p > 0.05). When the input signal was RD + SDI or MADs + SDI, the MAE of XGBoost decreased by 1.03 ml/kg/min (p < 0.05) and 0.88 ml/kg/min (p > 0.05) respectively, and R2 increased by 0.11 (p < 0.05) and 0.08 (p < 0.05) respectively. When the input signal was HR%+RD + SDI, RD + MADs + SDI, or HR%+MADs + SDI, the MAE of XGBoost decreased (p < 0.05) by 0.82 ml/kg/min, 0.68 ml/kg/min, and 0.49 ml/kg/min, and R2 increased by 0.05 (p > 0.05), 0.06 (p < 0.05), and 0.05 (p < 0.05). The mean and standard deviation of MAE and R2 of different models and inputs were shown in Table 3.
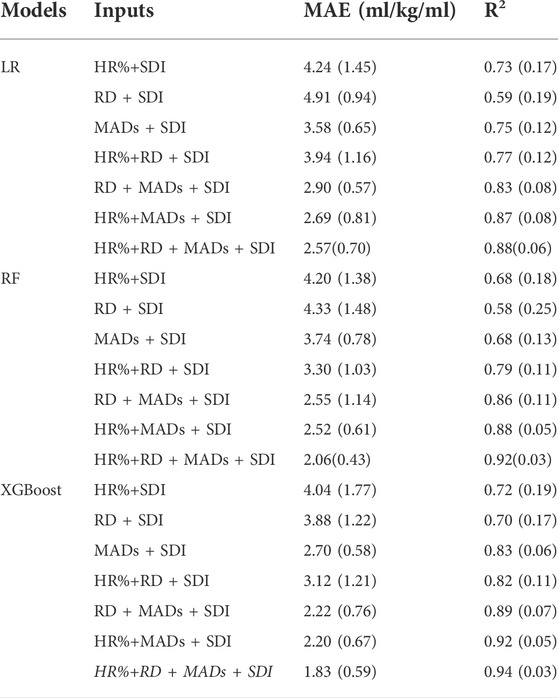
TABLE 3. The MAE and R2 of different models and different input parameters [mean (sd)].
The results show that in both LR and XGBoost models, the combination of multiple parameters reduces the MAE of estimated VO2 compared with using HR, RD, or MADs alone as inputs, while the XGBoost regression model performs better compared with the LR model either using a single feature or different combinations of multi-signal features as inputs. This is in line with expectations, as the linear relationship between individual metrics (e.g., HR, RR) and VO2 does not always hold under different states of motion, and the combination of these features is effective in reducing the VO2 prediction error compared with using HR%, RD, or MADs features alone as inputs.
To explore the influence of parameters in the XGBoost model on the result estimation error, three hyper-parameters, learning rate (Lrate), the number of trees (Ntree), and max deep (Dmax) of the model were investigated in terms of measures of MAE. For this purpose, we change one of the hyper-parameters with all the others fixed. The effect of these important parameters of XGBoost on the accuracy of
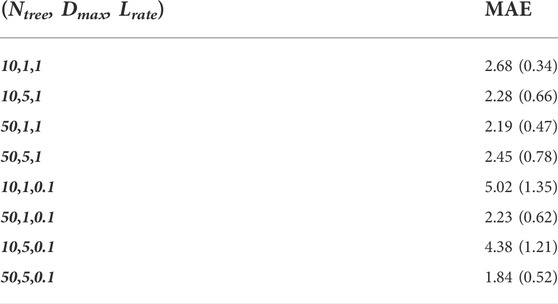
TABLE 4. The results of different parameter for XGBoost model (mean (sd)).
In this paper, further discussions have been carried upon the results of the XGBoost model, as shown in Table 5, which shows the VO2 prediction results of various types of activities under different input parameters. Due to the poor linear correlation between VO2 and HR in the rest state, it is difficult to do the accurate prediction, so several rest scenarios were designed in the experiment. The results of each scenario were analyzed to explain how the input parameters affect the accuracy of VO2 in different states. The MAE of VO2 predicted by seven combination parameters (HR%+SDI, RD + SDI, MADs + SDI, HR%+RD + SDI, RD + MADs + SDI, HR%+MADs + SDI, HR% + RD + MADs + SDI) as inputs was significant difference (p < 0.05) under various activity types (Stand, Lie, Lying on the left side, Lying on the right side, Sit, Walk, Run and recovery).
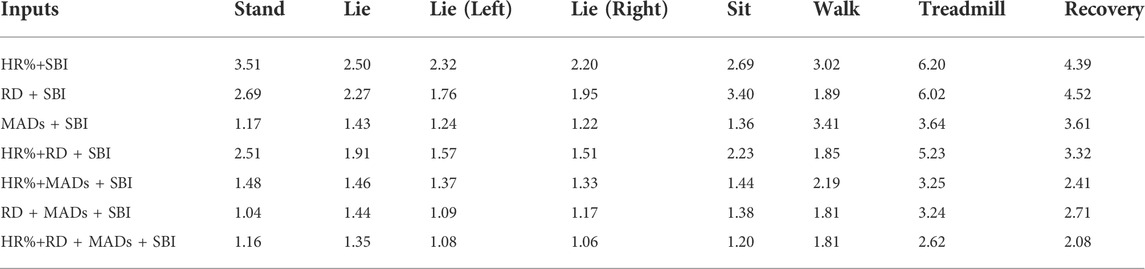
TABLE 5. The results of different input schemes for XGBoost model in various tasks.
The results in Table 5 show that MADs is an important feature of VO2 estimation because MADs + SDI performed better than HR%+SDI and RD + SDI. MADs can significantly improve the accuracy of VO2 estimation under various activity types, because HR%+MADs + SDI and RD + MADs + SDI perform better than (p < 0.05) HR%+SDI and RD + SDI, as shown in Table 5.
RD is more closely related to VO2 than HR in rest and low-intensity exercise, because the MAE of RD + SDI is lower than that of HR%+SDI in most rest scenarios and warm-up walking. When we combined HR%, RD and SDI as the inputs for VO2 estimation, the results were better than (p < 0.05) the combination of HR% + SDI or RD + SDI. Therefore, respiratory features are beneficial to VO2 estimation.
Compared with a single parameter (HR%, RD, or MADs) as input, the MAE of combining multiple parameters as input to predict VO2 was smaller, and the stability and accuracy of the estimation results were better (p < 0.05), as shown in Table 5. The MAE of HR%+RD + MADs + SDI is only 1.83 ± 0.59 ml/kg/min. Unexpectedly, in the standing state, because the subjects are not familiar with the experimental process, HR% will have a negative impact on the predicted results, making the subjects nervous, and leading to changes in HR.
In order to explore the influence of gender on VO2 estimation, we divided the subjects into two groups according to gender, and conducted a crossover experiment. In this section, the XGBoost regression model is still used, and the input scheme is HR% + RD + MADs + SDI.
Firstly, the LOSO cross-validation was used in the male group (Male-Male) and the female group (Female-Female) respectively. As shown in Table 6, the difference between the results of the two cross-validation is small, which may be caused by the difference in the number of subjects. Secondly, we also used Males’ (Females’) data as the training set for the XGBoost model, and the Females’ (Males’) data were as test set, which was named Male-Female (Female-Male) cross-validation test. The MAE of Male-Female and Female-Male tests during walking were similar (p > 0.05), as the baseline of VO2 value between male and female was not much different. However, the MAE during resting, the Bruce treadmill test, and recovery were bigger (p < 0.05) because of great difference in the muscle ratio and vital capacity between males and females.
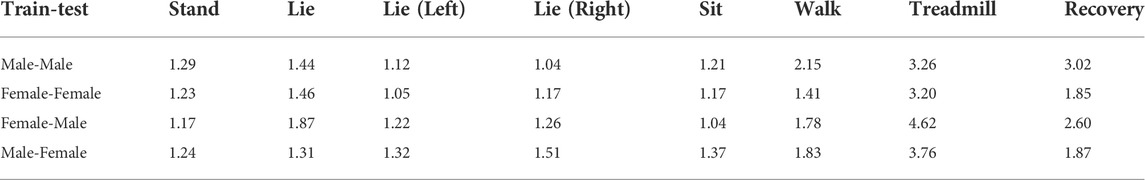
TABLE 6. The effect of gender on predicted results under various tasks.
In the Bruce treadmill test, when the input parameters were RD + MADs + SDI or HR%+RD + MADs + SDI, there was little difference in the MAE, as mentioned in Table 7. When HR% was added as an input parameter, it did not contribute to the accuracy of the VO2 estimation results. To further explore the effect of each level of Bruce treadmill test on the MAE, and to find out whether HR% has effect on the results, we have analyzed each stage of the test. The specific calculation results are shown in Table 7, which shows that compared with RD + MADs + SDI as input, when HR%+RD + MADs + SDI as input, the MAE at Level 1 to Level 5 decreased by 0.25 ml/kg/min, 0.11 ml/kg/min, 0.38 ml/kg/min, 0.98 ml/kg/min, and 3.69 ml/kg/min, respectively.
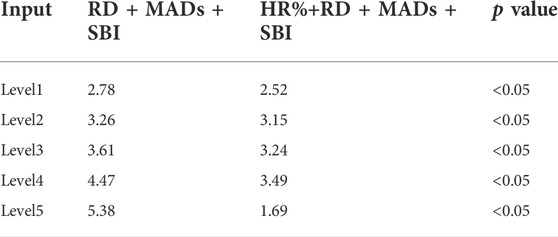
TABLE 7. Comparing the predicted result of different inputs in each level during Bruce treadmill test.
The results in Table 7 shows that the MAE have no significant difference between HR%+RD + MADs + SDI or RD + MADs + SDI as model inputs during low and moderate intensity exercise (Levels 1, Levels 2, and Levels 3) (p < 0.05). However, during the high-intensity exercise (Levels 4 and Levels 5), there was a significant difference in MAE when RD + MADS + SDI and HR%+RD + MADS + SDI were as the input (p < 0.05). The feature of HR% plays an important role in predicting the accuracy of performance. Combining with Table 4, it indicates that if we intended to achieve the real-time, accurate estimation of VO2 in a variety of tasks, a combination of HR%, RD, MADs, and SDI was necessary.
Since the XGBoost model with feature inputs of HR% + RD + MADs + SDI performs best on the dataset, we choose this model to measure the consistency between the
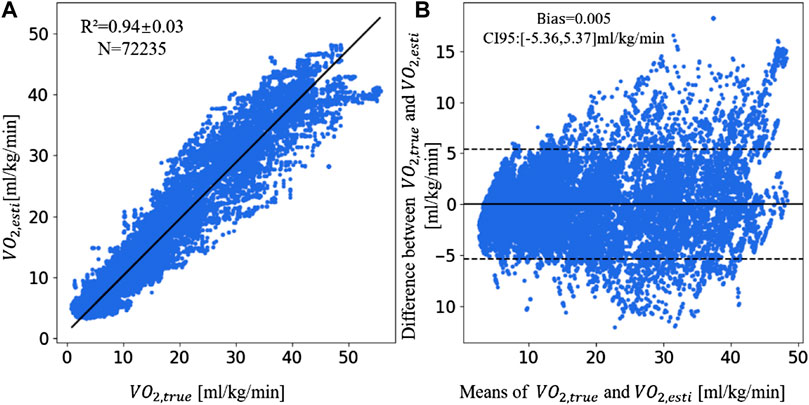
FIGURE 3. The linear correlation plot and consistency plot of
It was found that MAE was lower in the resting state than the movement state. This because the baseline VO2 values are lower in the rest period than in the movement period. The transition process between states is not considered in the experiment. Altini et al. (2015) mentioned that transition states have an impact on the estimation results. While in our experiment, the model does not need to distinguish the type of states and it shows good estimation results throughout the experiment.
In the previous paper, Altini et al. (2015) proposed activity-specific linear functions to model steady-state activities and transition-specific non-linear functions to model non-steady-state activities and transitions. The result showed that the MAE between the predicted and true results of activity-specific models based on distinguishing activity states is lower than other linear or nonlinear models.
In this section, we investigate the predicted results of our proposed model and the activity-specific model in the four states of rest, walk, run, and recovery, without considering the transition between states. The boxplot of MAE of two models in different states was shown in Figure 4. Compared with our proposed model, the mean MAE of the activity-specific model is close in rest (1.05 ± 0.29 vs. 1.10 ± 0.11, p = 0.04), walk (1.41 ± 0.15 vs. 1.40 ± 0.66, p = 0.69), run (2.46 ± 1.13 vs. 2.53 ± 0.17, p = 0.42), and recovery states (2.00 ± 0.96 vs. 2.00 ± 0.31, p = 0.82). The differences between two models of rest state was significant (p < 0.05), but that of walk, run, and recovery states were not significant (p > 0.05). However, the standard deviation of the activity-specific model was greater in the four states, and the model stability was slightly inferior compared with our proposed model.
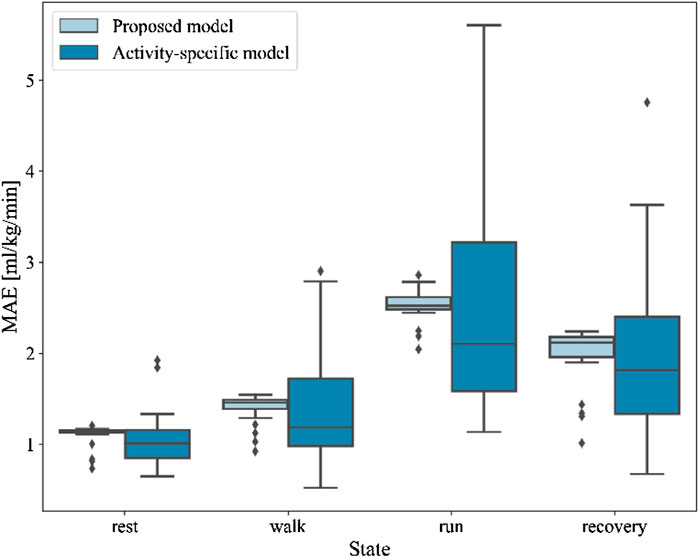
FIGURE 4. The boxplot of MAE of the proposed model and activity-specific model in different states.
In this section, we also used the XGBoost model with feature inputs of HR% + RD + MADs + SDI. Figure 5 showed two cases of better and worse results when applying this method to predict VO2. Figure 5A exhibited a strong linear correlation (R2 = 0.96) between the
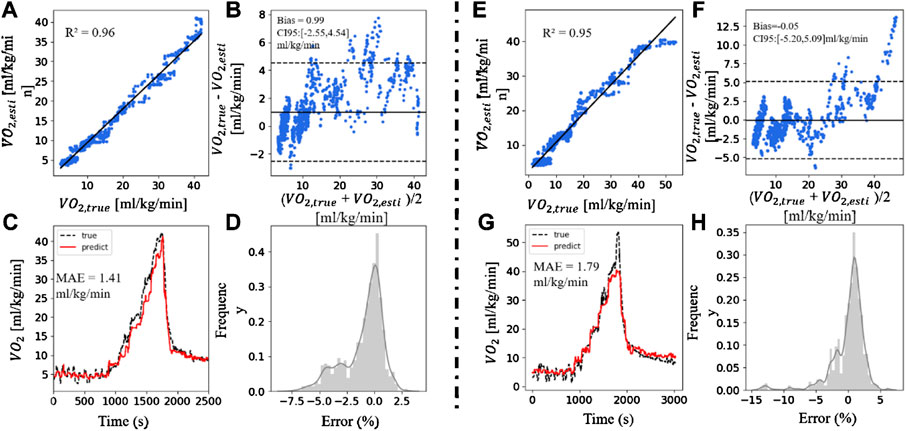
FIGURE 5. A good and a bad case. (A,E) The scatter plot of
Artificial intelligence method has great potential for predicting physiological parameters in sports medicine. Parak et al. (2017) use physiological model based on HR, running speed, and personal characteristics to estimate EE during the maximal voluntary exercise test and VO2max during the submaximal outdoor running test. Zignoli et al. (2022) proposed an artificial neural network that might be used to detect ventilatory thresholds for VT1 and VT2, respectively. In this work, we propose a model based on XGBoost, which uses cardio-pulmonary physiological signals as input to estimate instantaneous VO2 in different activity scenarios. Firstly, we explored and extracted important features from ECG, respiration, and tri-axial acceleration signals. HR%, MADs, RD and subject demography information are used as input of the XGBoost model for VO2 estimation. This method does not need to determine the type of exercise in advance. Compared with the linear regression method, our proposed model reduces the MAE of VO2 prediction by 28.79%. Secondly, the regression model trained with HR%, RD, and MADs is better than the models trained by HR%, ACC, RD, alone or in pairs. The MAE and R2 of LOSO cross-validation are 1.83 ml/kg/min and 0.94 respectively. Compared with the linear regression method of using single HR as input for estimation, the MAE is reduced by 54.70%. The input of the model proposed in this paper not only includes HR and RR, but also introduces MADs as input parameters, which make an important contribution to reducing the error of model prediction results. As shown in Figure 2B, MADs extracted from acceleration sensors placed on the chest can distinguish the exercise intensity especially in the Bruce treadmill test. At the same time, since the SensEcho can measure both thoracic and abdominal motion signals, we extracted RR and
There are limitations in our research as well. First, the number of subjects in the experiment was relatively small, the age distribution was similar, and the difference in BMI was small. The research could not investigate the influence of age, obesity, and other factors on VO2 estimation. In future studies, we will recruit more subjects of different ages and obesity levels to expand the sample size. Second, the model and analysis are all based on ordinary healthy subjects. There are no subjects with outstanding cardiopulmonary function such as athletes, and poor cardiopulmonary function such as patients with chronic obstructive pulmonary disease or heart failure etc. Therefore, the performance of our model on these people is unclear and needs to be further explored. Third, the type of activity is a little simple in our dataset. In the future research, we will design some combine tasks that represent the real-world situation.
In general, this study has proved the potential of cardio-pulmonary physiological signals for instantaneous estimation of individual oxygen uptake in various scenarios of activities. Furthermore, the model proposed in this paper shows high consistency with the gold standard method. The algorithm can be embedded in portable wearable devices, helping to more accurately estimate oxygen uptake in sports, clinical, and home environments. Through continuous monitoring and evaluation of oxygen uptake, it is possible to gain a deeper understanding of the individual’s cardiorespiratory health, help to make personalized health management recommendations, and improve the understanding of exercise rehabilitation and clinical treatment effect evaluation.
The original contributions presented in the study are included in the article/supplementary material, further inquiries can be directed to the corresponding authors.
The studies involving human participants were reviewed and approved by S2018-095-01. The patients/participants provided their written informed consent to participate in this study. Written informed consent was obtained from the individual(s) for the publication of any potentially identifiable images or data included in this article.
ZW and QZ interpreted the results and wrote the manuscript. KL developed the software algorithms for oxygen uptake estimation. ZY and AW contributed to manuscript editing. XG contributed to the patient recruitment. Study design, supervision of the work, and manuscript revisions was provided by ZZ and YX.
The work was supposed by NSF of the China (62171471 and 61701028), Beijing Municipal Science and Technology (Z181100001918023), Special Grant for Healthcare (16BJZ23), and Big Data Research and Development Project of Chinese PLA General Hospital (2018MBD-09). ZW and QZ contributed equally to this work. YX and ZZ are corresponding author.
This work was done during ZY’s internship at Beijing SensEcho Science and Technology Co., Ltd., Beijing, China, when he was a Ph.D. candidate at University of California, Davis, CA, United states, and now he works in PAII Inc., Palo Alto, CA, United States. Author KL is employed by Beijing SensEcho Science and Technology Co., Ltd.
The remaining authors declare that the research was conducted in the absence of any commercial or financial relationships that could be construed as a potential conflict of interest.
All claims expressed in this article are solely those of the authors and do not necessarily represent those of their affiliated organizations, or those of the publisher, the editors and the reviewers. Any product that may be evaluated in this article, or claim that may be made by its manufacturer, is not guaranteed or endorsed by the publisher.
Altini M., Penders J., Amft O. (2015). Estimating oxygen uptake during nonsteady-state activities and transitions using wearable sensors. IEEE J. Biomed. Health Inf. 20 (2), 469–475. doi:10.1109/JBHI.2015.2390493
Beltrame T., Amelard R., Wong A., Hughson R. L. (2017). Prediction of oxygen uptake dynamics by machine learning analysis of wearable sensors during activities of daily living[J]. Sci. Rep. 7 (1), 1–8. doi:10.1038/srep45738
Billat L. V. (2001). Interval training for performance: A scientific and empirical practice. Special recommendations for middle- and long-distance running. Part I: Aerobic interval training. Sports Med. 31 (1), 13–31. doi:10.2165/00007256-200131010-00002
Bruce R. A., Kusumi F., Hosmer D. (1973). Maximal oxygen intake and nomographic assessment of functional aerobic impairment in cardiovascular disease. Am. Heart J. 85 (4), 546–562. doi:10.1016/0002-8703(73)90502-4
Chen T., He T., Benesty M., Khotilovich V., Tang Y., Cho H., et al. (2015). Xgboost: Extreme gradient boosting. R package version 0.4-2 1 (4), 1–4.
Cook A. J., Ng B., Gargiulo G. D., Hindmarsh D., Pitney M., Lehmann T., et al. (2018). Instantaneous VO2 from a wearable device. Med. Eng. Phys. 52, 41–48. doi:10.1016/j.medengphy.2017.12.008
CORTEX Biophysik (2021). Operator’s manual MetaLyzer® 3B[EB/OL]. https://www.procarebv.nl/wp-content/uploads/2016/11/Cortex-Metalyzer-3B_-Handleiding.pdf.
Crouter S. E., Kuffel E., Haas J. D., Frongillo E. A., Bassett D. R. (2010). Refined two-regression model for the ActiGraph accelerometer. Med. Sci. Sports Exerc. 42 (5), 1029–1037. doi:10.1249/MSS.0b013e3181c37458
Díaz V., Benito P. J., Peinado A. B., Alvarez M., Martin C., Salvo V. D., et al. (2008). Validation of a new portable metabolic system during an incremental running test. J. Sports Sci. Med. 7 (4), 532–536.
Ellis K., Kerr J., Godbole S., Lanckriet G., Wing D., Marshall S. (2014). A random forest classifier for the prediction of energy expenditure and type of physical activity from wrist and hip accelerometers. Physiol. Meas. 35 (11), 2191–2203. doi:10.1088/0967-3334/35/11/2191
Falter M., Budts W., Goetschalckx K., Cornelissen V., Buys R. (2019). Accuracy of Apple watch measurements for heart rate and energy expenditure in patients with cardiovascular disease: Cross-sectional study. JMIR Mhealth Uhealth 7 (3), e11889. doi:10.2196/11889
Fernandes R., Cardoso C., Silva J., Vilar S., Colcao P., Barbosa T., et al. (2006). Assessment of time limit at lowest speed corresponding to maximal oxygen consumption in the four competitive swimming strokes[J]. Rev. Port. Ciências do Desporto 6, 128–130.
Figueiredo P., Ribeiro P., Bona R. L., Peyre-Tartaruga L. A., Ribeiro J. P. (2013). Ventilatory determinants of self-selected walking speed in chronic heart failure. Med. Sci. Sports Exerc. 45 (3), 415–419. doi:10.1249/MSS.0b013e318277968f
Fischer G., De Queiroz F. B., Berton D. C., Schons P., Oliveira H. B., Coertjens M., et al. (2021). Factors influencing self-selected walking speed in fibrotic interstitial lung disease. Sci. Rep. 11 (1), 12459–9. doi:10.1038/s41598-021-91734-x
Gastinger S., Donnelly A., Dumond R., Prioux J. (2014). A review of the evidence for the use of ventilation as a surrogate measure of energy expenditure. JPEN. J. Parenter. Enter. Nutr. 38 (8), 926–938. doi:10.1177/0148607114530432
Gastinger S., Sorel A., Nicolas G., Gratas-Delamarche A., Prioux J. (2010). A comparison between ventilation and heart rate as indicator of oxygen uptake during different intensities of exercise. J. Sports Sci. Med. 9 (1), 110–118.
Guidetti L., Meucci M., Bolletta F., Emerenziani G. P., Gallotta M. C., Baldari C. (2018). Validity, reliability and minimum detectable change of COSMED K5 portable gas exchange system in breath-by-breath mode. PloS one 13 (12), e0209925. doi:10.1371/journal.pone.0209925
Hamilton P. (2002). “Open source ECG analysis[C],” in Computers in cardiology, 101–104. doi:10.1109/CIC.2002.1166717
Hamlin M., Draper N., Blackwell G., Shearman J. P., Kimber N. E. (2012). Determination of maximal oxygen uptake using the bruce or a novel athlete-led protocol in a mixed population. J. Hum. Kinet. 31 (1), 97–104. doi:10.2478/v10078-012-0010-z
Hill A., Lupton H. (1923). Muscular exercise, lactic acid, and the supply and utilization of oxygen. QJM Int. J. Med. 97 (62), 135–171. doi:10.1093/qjmed/os-16.62.135
Hills A. P., Mokhtar N., Byrne N. M. (2014). Assessment of physical activity and energy expenditure: An overview of objective measures. Front. Nutr. 1, 5. doi:10.3389/fnut.2014.00005
Hupin D., Roche F., Gremeaux V., Chatard J. C., Oriol M., Gaspoz J. M., et al. (2015). Even a low-dose of moderate-to-vigorous physical activity reduces mortality by 22% in adults aged ≥60 years: A systematic review and meta-analysis. Br. J. Sports Med. 49 (19), 1262–1267. doi:10.1136/bjsports-2014-094306
Kaminsky L. A., Arena R., Ellingsen Ø., Harber M. P., Myers J., Ozemek C., et al. (2019). Cardiorespiratory fitness and cardiovascular disease - the past, present, and future. Prog. Cardiovasc. Dis. 62 (2), 86–93. doi:10.1016/j.pcad.2019.01.002
Kenny G. P., Notley S. R., Gagnon D. (2017). Direct calorimetry: A brief historical review of its use in the study of human metabolism and thermoregulation. Eur. J. Appl. Physiol. 117 (9), 1765–1785. doi:10.1007/s00421-017-3670-5
Lanferdini F. J., Silva E. S., Machado E., Fischer G., Peyre-Tartaruga L. A. (2020). Physiological predictors of maximal incremental running performance. Front. Physiol. 11, 979. doi:10.3389/fphys.2020.00979
Leonard W. R. (2012). Laboratory and field methods for measuring human energy expenditure. Am. J. Hum. Biol. 24 (3), 372–384. doi:10.1002/ajhb.22260
Livingstone M. (1997). Heart-rate monitoring: The answer for assessing energy expenditure and physical activity in population studies?[J]. Br. J. Nutr. 78 (6), 869–871. doi:10.1079/bjn19970205
Lu K., Yang L., Abtahi F., Lindecrantz K., Rödby K., Seoane F. (2019). “Wearable cardiorespiratory monitoring system for unobtrusive free-living energy expenditure tracking[C],” in World congress on medical physics and biomedical engineering (Singapore: Springer), 433–437.
Makowski D., Pham T., Lau Z. J., Brammer J. C., Lespinasse F., Pham H., et al. (2020). NeuroKit2: A Python toolbox for neurophysiological signal processing. Behav. Res. Methods 53 (4), 1689–1696. doi:10.3758/s13428-020-01516-y
Mazzoleni M. J., Battaglini C. L., Martin K. J., Coffman E. M., Ekaidat J. A., Wood W. A., et al. (2018). A dynamical systems approach for the submaximal prediction of maximum heart rate and maximal oxygen uptake. Sports Eng. 21 (1), 31–41. doi:10.1007/s12283-017-0242-1
Meyer T., Georg T., Becker C., Kindermann W. (2001). Reliability of gas exchange measurements from two different spiroergometry systems. Int. J. Sports Med. 22 (08), 593–597. doi:10.1055/s-2001-18523
Montoye A. H., Vondrasek J. D., James B., Hancock I. (2020). Validity and reliability of the VO2 master pro for oxygen consumption and ventilation assessment. Int. J. Exerc. Sci. 13 (4), 1382–1401.
Murakami H., Kawakami R., Nakae S., Yamada Y., Nakata Y., Ohkawara K., et al. (2019). Accuracy of 12 wearable devices for estimating physical activity energy expenditure using a metabolic chamber and the doubly labeled water method: Validation study. JMIR Mhealth Uhealth 7 (8), e13938. doi:10.2196/13938
Negus R. A., Rippe J. M., Freedson P., Michaels J. (1987). Heart rate, blood pressure, and oxygen consumption during orthopaedic rehabilitation exercise. J. Orthop. Sports Phys. Ther. 8 (7), 346–350. doi:10.2519/jospt.1987.8.7.346
Nevill A. M., Cooke C. B. (2016). The dangers of estimating V˙ O2max using linear, nonexercise prediction models[J]. Med. Sci. Sports Exerc. 49 (5), 1036–1042. doi:10.1249/MSS.0000000000001178
Nicolò A., Massaroni C., Passfield L. (2017). Respiratory frequency during exercise: The neglected physiological measure. Front. Physiol. 8, 922. doi:10.3389/fphys.2017.00922
Parak J., Uuskoski M., Machek J., Korhonen I. (2017). Estimating heart rate, energy expenditure, and physical performance with a wrist photoplethysmographic device during running. JMIR Mhealth Uhealth 5 (7), e97. doi:10.2196/mhealth.7437
Passler S., Bohrer J., Blöchinger L., Senner V. (2019). Validity of wrist-worn activity trackers for estimating VO2max and energy expenditure. Int. J. Environ. Res. Public Health 16 (17), 3037. doi:10.3390/ijerph16173037
Pulkkinen A., Kettunen J., Martinmäki K., Saalasti S., Rusko H. (2004). On- and off-dynamics and respiration rate enhance the accuracy of heart rate based VO2 estimation. Med. Sci. Sports Exerc. 36 (5), S253. doi:10.1249/00005768-200405001-01208
Sanseverino M. A., Pecchiari M., Bona R. L., Berton D. C., de Queiroz F. B., Gruet M., et al. (2018). Limiting factors in walking performance of subjects with COPD. Respir. Care 63 (3), 301–310. doi:10.4187/respcare.05768
Sasaki J. E., Hickey A., Mavilia M., Tedesco J., John D., Kozey Keadle S., et al. (2015). Validation of the Fitbit wireless activity tracker for prediction of energy expenditure. J. Phys. Act. Health 12 (2), 149–154. doi:10.1123/jpah.2012-0495
Scott C. B. (2005). Contribution of anaerobic energy expenditure to whole body thermogenesis. Nutr. Metab. 2 (1), 14. doi:10.1186/1743-7075-2-14
Shandhi M. M. H., Bartlett W. H., Heller J. A., Etemadi M., Young A., Plotz T., et al. (2020). Estimation of instantaneous oxygen uptake during exercise and daily activities using a wearable cardio-electromechanical and environmental sensor. IEEE J. Biomed. Health Inf. 25 (3), 634–646. doi:10.1109/jbhi.2020.3009903
Shieh S-C., Chou J., Kao Y. (2010). Energy expenditure and cardiorespiratory responses during training and simulated table tennis match[J]. Editor. Board 22, 186.
Spurr G., Prentice A., Murgatroyd P., Goldberg G. R., Reina J. C., Christman N. T. (1988). Energy expenditure from minute-by-minute heart-rate recording: Comparison with indirect calorimetry. Am. J. Clin. Nutr. 48 (3), 552–559. doi:10.1093/ajcn/48.3.552
Strath S. J., Brage S., Ekelund U. (2005). Integration of physiological and accelerometer data to improve physical activity assessment. Med. Sci. Sports Exerc. 37 (11), S563–S571. doi:10.1249/01.mss.0000185650.68232.3f
Tanaka H., Monahan K. D., Seals D. R. (2001). Age-predicted maximal heart rate revisited. J. Am. Coll. Cardiol. 37 (1), 153–156. doi:10.1016/s0735-1097(00)01054-8
Wang Z., Liang H., Wang J., Zang Y., Xu H., Lan K., et al. (2021). Investigation on new paradigm of clinical physiological monitoring by using wearable devices[J]. Sheng Wu Yi Xue Gong Cheng Xue Za Zhi 38 (4), 753–763. doi:10.7507/1001-5515.202010021
Wang Z., Yang Z., Lan K., Li P., Hao Y., Duan Y., et al. (2022). “Development and validation of algorithms for sleep stage classification and sleep apnea/hypopnea event detection using a medical-grade wearable physiological monitoring system[C],” in International conference on wireless mobile communication and Healthcare (Cham: Springer), 166–185.
Xiong K-Y., He H., Ni G-X. (2013). Effect of skill level on cardiorespiratory and metabolic responses during Tai Chi training. Eur. J. Sport Sci. 13 (4), 386–391. doi:10.1080/17461391.2011.635706
Xu H., Li P., Yang Z., Liu X., Wang Z., Yan W., et al. (2020). Construction and application of a medical-grade wireless monitoring system for physiological signals at general wards. J. Med. Syst. 44 (10), 182. doi:10.1007/s10916-020-01653-z
Keywords: oxygen uptake, machine learning, wearable sensor, XGBoost, heart rate, respiration
Citation: Wang Z, Zhang Q, Lan K, Yang Z, Gao X, Wu A, Xin Y and Zhang Z (2022) Enhancing instantaneous oxygen uptake estimation by non-linear model using cardio-pulmonary physiological and motion signals. Front. Physiol. 13:897412. doi: 10.3389/fphys.2022.897412
Received: 16 March 2022; Accepted: 29 July 2022;
Published: 25 August 2022.
Edited by:
Sergio José Ibáñez, University of Extremadura, SpainReviewed by:
Md. Mobashir Hasan Shandhi, Duke University, United StatesCopyright © 2022 Wang, Zhang, Lan, Yang, Gao, Wu, Xin and Zhang. This is an open-access article distributed under the terms of the Creative Commons Attribution License (CC BY). The use, distribution or reproduction in other forums is permitted, provided the original author(s) and the copyright owner(s) are credited and that the original publication in this journal is cited, in accordance with accepted academic practice. No use, distribution or reproduction is permitted which does not comply with these terms.
*Correspondence: Yi Xin, YW1la29AYml0LmVkdS5jbg==; Zhengbo Zhang, emhlbmdib3poYW5nQDEyNi5jb20=
Disclaimer: All claims expressed in this article are solely those of the authors and do not necessarily represent those of their affiliated organizations, or those of the publisher, the editors and the reviewers. Any product that may be evaluated in this article or claim that may be made by its manufacturer is not guaranteed or endorsed by the publisher.
Research integrity at Frontiers
Learn more about the work of our research integrity team to safeguard the quality of each article we publish.