 Sindhu Kaimal
 Bradley D. Farmer
 Nilima N. Renukdas
 Hisham A. Abdelrahman
 Anita M. Kelly
94% of researchers rate our articles as excellent or good
Learn more about the work of our research integrity team to safeguard the quality of each article we publish.
Find out more
ORIGINAL RESEARCH article
Front. Physiol., 11 May 2022
Sec. Aquatic Physiology
Volume 13 - 2022 | https://doi.org/10.3389/fphys.2022.886480
This article is part of the Research TopicEcophysiological Stress Response in Fish and Stress Mitigation: In Support of Food and Environment SustainabilityView all 4 articles
Flavobacterium covae (columnaris) is a microbial pathogen of the Golden Shiner (Notemigonus crysoleucas), a principal bait species. We investigated the effects of density and water temperature on the survival of fish subjected to a columnaris challenge and whether flow cytometry (FCM) could be a fast and reliable method to distinguish and enumerate F. covae populations from water and fish in experimental tanks. Juvenile Golden Shiners averaging 2.62 (±0.78 S.D.) g (negative for F. covae) were used in simultaneous trials at 22°C and 28°C in two ultra-low flow-through systems: each consisting of four treatments and five replicates per treatment. Treatments were fish stocked at either 600 fish/m3 or 2,400 fish/m3 and either challenged with F. covae or not; survival was observed for 48 h after challenge. Samples of water and fish tissue were obtained for FCM enumerations and validation by qPCR. No significant differences in survival were recorded between density treatments; however, high temperature and columnaris challenge treatments showed significantly higher mortality. Bacterial enumeration (number/mL) by FCM highly correlated with bacterial counts r = 0.81 (p = 0.001) in the water samples. Higher water temperatures may have increased columnaris infections and mortality in Golden Shiners. Flow cytometry is a reliable method of enumerating F. covae from experimental tank water samples.
Flavobacterium covae (previously F. columnare genomovar II; LaFrentz et al., 2022), a pathogenic, gram-negative bacterium, is the causative agent of columnaris disease in wild and cultured fish (see review by Loch and Faisal 2015). Although F. covae can act as a primary pathogen (Plumb 1999; Soto et al., 2008), it is considered a secondary or an opportunistic pathogen, causing heavy mortalities in stressed fish (Durborow et al., 1998).
Intensive aquaculture practices include rearing fish in high densities (Wedemeyer 1996), which can impose a chronic stressful environment. Stressful environments result in suppressed immunocompetence and a compromised ability to defend against pathogens like F. covae, a ubiquitous pathogen in aquatic environments (Durborow et al., 1998). Further exposure to acute stressors such as fluctuations in water temperature (Durborow et al., 1998) or handling during transportation can result in sudden disease outbreaks (Wakabayashi and Egusa 1972; Kumar et al., 1986; Wakabayashi 1991).
Infections caused by F. covae may result in skin lesions, fin erosion, and gill necrosis. As the disease progresses, more organs are infected, ultimately resulting in mortality. F. covae is identified by characteristic long, slender rod-shaped bodies without a flagellum. Strains vary from 0.3 to 0.7 μm in width and 3–10 μm in length. In selective agar, they form flat, yellow, rhizoid, and strongly adherent colonies and spread across the surface, forming irregular margins. Scrapings from infected gill tissues show bacterial cells forming characteristic columnar lumps known as “haystacks.” Columnaris is known by several names such as “saddleback”, “fin rot”, or “cotton wool disease” based on where the infection forms. As the infection proceeds, external tissues, especially the gills, show necrosis and noticeable damage (Davis 1922; Beck et al., 2012).
Although morphologically indistinguishable, four species of F. covae have been identified (LaFrentz et al., 2022). Not all species of the bacterium are equally virulent (Shoemaker et al., 2008; LaFrentz et al., 2012). A strain is considered highly virulent if it kills the entire population of fish within a 24 h period and less virulent if 100% mortality is achieved only 96 h after exposure (Thomas-Jinu and Goodwin 2004; Declercq et al., 2013).
Quick detection of bacteria is essential for disease prevention and treatment. To determine the possible severity of an infection, it may be necessary to detect bacteria from fish and the surrounding water. Enumerations help assess the infection status, determine control measures, and whether the control measures used have been effective. Traditionally, fish health professionals use the plate count method for bacterial enumerations. This method is time-consuming, requiring at least 24–48 h for colonies to develop, an essential factor when treating a potential outbreak on a commercial farm. An additional concern is most media used in the bacterial plates are not exclusive to F. covae; often, other bacteria associated with the fish and the environment are also cultured with the target bacteria making counts inaccurate. More recent methods of microbial pathogen identification and enumeration include immunofluorescence antibody technique (IFAT), quantitative polymerase chain reaction (qPCR; Gibbs et al., 2020), and immunomagnetic separation (Fujiwara-Nagata and Eguchi 2009). These methods have been more accurate in detecting F. covae. However, one major drawback is that these methods contain several procedural steps and take up to 48–56 h, which is a long time to respond to prevent a potential outbreak or treat an ongoing costly epizootic on a farm.
One objective of this study was to develop a rapid method to detect F. covae with flow cytometry (FCM). Flow cytometry has become a routine method for the microbiological analysis of freshwater and marine water samples (Gasol and Del Giorgio 2000; Cellamare et al., 2010). Fish pathogens and immune response have also been studied using FCM (Díaz-Rosales et al., 2006; Havixbeck et al., 2016). Flow cytometry can process multiple samples within minutes, making it preferable to other methods for enumeration studies. The FCM method uses light scattering and fluorescent properties of cells to make cell size and complexity measurements at population levels. Typically, in an FCM experiment, cells conjugated with a fluorochrome-labeled antibody are used to distinguish a cell population among many others in a sample. The enumeration procedure is completed within minutes. In this regard, FCM may prove to be a fast and reliable technique to characterize and enumerate F. covae populations from aquatic samples.
Bacterial disease outbreaks associated with intensive culture systems and environmental stressors pose a significant threat to freshwater aquaculture. As producers seek to incorporate intensive farming technologies such as split-pond systems (SPS; Stone et al., 2016), it becomes pertinent to investigate occurrences of stress-mediated pathogenesis in baitfish. Current investigation methods remain limited to the external examination of clinical signs and some time-consuming diagnostic laboratory procedures. A study was conducted to elicit pathophysiological responses of Golden Shiners held at two densities and two temperatures to an F. covae challenge. Also, an FCM protocol was developed for the rapid identification and enumeration of F. covae from aquatic samples.
The study was conducted in 40, 18-L Ultra-Low-Flow (ULF; Mitchell and Farmer 2010) tanks at the United States Department of Agriculture, Agricultural Research Service, Harry K. Dupree Stuttgart National Aquaculture Research Center, Stuttgart, Arkansas. Golden Shiners, mean weight (±S.D.) of 2.62 (±0.78) g each (observed negative for F. covae) were obtained from a commercial farm in Lonoke, Arkansas, United States.
Two trials were simultaneously conducted at 22°C and 28°C water temperature, each consisting of four treatments and five replicates per treatment. Fish were held at two densities (600 fish/m3 or 2,400 fish/m3) and subject to an F. covae challenge or not (control). The groups were: 600 fish/m3 and no F. covae challenge (6 fish/tank), 600 fish/m3 and F. covae challenge (6 fish/tank), 2,400 fish/m3 and no F. covae challenge (24 fish/tank), and 2,400 fish/m3 and F. covae challenge (24 fish/tank). Both studies followed the same procedure. Golden Shiners were held in a 400-L flow-through tank for acclimation to laboratory conditions. Fish were fed a commercial catfish diet to satiation once a day. After a 3-day acclimation period in the 400-L flow-through tank, fish were stocked into 40, 18-L ULF tanks containing 10 L of water. Aeration was provided to each tank with air stones. The tanks received filtered well water at about four exchanges per day or 30 ml/min from a ULF water delivery system (Mitchell and Farmer 2010). The water temperature in all tanks was maintained at either 22°C or 28°C. These temperatures were chosen to depict a temperature below the optimal range and one temperature within the optimum temperature range (25–30°C) for F. covae growth (Durborow et al., 1998; Plumb 1999; Roberts 2012). The water in the high-temperature treatment ULF tanks was heated using 50 W electric heaters (HPA-50), maintaining temperatures between 27.4°C and 28.5°C. The fish were no longer fed once moved to the challenge system.
After 3 days in the ULF-tanks, fish were subject to an F. covae challenge with the isolate MS-94-081 (genomovar II; Tekedar et al., 2012; Kumru et al., 2016). The frozen isolate was retrieved from the −80°C freezer and streaked on Ordal’s medium (Anacker and Ordal 1955). After 48 h, the isolate was dislodged from the Ordal’s medium with a sterile cotton swab and inoculated into 15 ml F. covae Growth Medium (FCGM; Farmer 2004). The inoculum suspension was incubated at 28°C for 24 h. The starter culture was then inoculated in 3 L of FCGM in three 1-L flasks. The flasks were incubated for 24 h at 28°C in an orbital shaker incubator at 200 rpm. The optical density of the isolate measured at 550 nm was 0.70, which equates nominally to 4.0 × 10¹⁰ CFU/ml. To allow full exposure of the fish to the bacteria, water flow was stopped to all tanks for 1 h after 100 ml of the cultured isolate was added to the tanks containing fish in the columnaris challenge groups. Water flow was then restored, and fish were observed for external clinical signs of columnaris. Mortalities were observed, counted, and removed 24 and 48 h post-challenge. Fish were considered moribund if they were unable to maintain neutral buoyancy. The study was ended 48 h after 50% mortality was achieved in at least one of the tanks. The remaining fish in tanks were euthanized using a lethal dose of MS-222 (250 mg/L), and F. covae samples were collected from tank water and fish tissue as described below.
Water flow into each tank was measured on day 1 and 3. Water temperature and dissolved oxygen were measured daily in the tanks. Once daily in one tank for each treatment, total ammonia nitrogen, pH, and unionized ammonia were measured. Total ammonia nitrogen was measured using the salicylate method (Hach Co., Loveland, Colarado), pH was measured with a pH meter 49 (Denver Instrument, Denver, Colorado; Model UP-5), and unionized ammonia was measured following the method of Trussell (1972).
Genomic DNA was extracted from gills, kidney, and spleen samples of two fish from each tank using the QIAcube DNA Purification System (QIAGEN, Valencia, CA, United States). Extraction was performed according to the manufacturer’s instructions. The extracted DNA was stored at −80°C until analysis by qPCR.
Water samples from tanks were collected in 50 ml tubes and centrifuged at 4,136 × g for 10 min. After 48 ml of the supernatant was decanted from the tubes, the pellets were re-suspended in the same water and transferred to 2 ml centrifuge tubes. The samples were stored at 4°C until further analysis by qPCR or FCM.
Extracted DNA from fish gill, spleen, and kidney tissue (2.5 μl) and tank water (2.5 μl) were used for qPCR amplification with oligonucleotide primers targeting a 113-bp nucleotide region of the chondroitin A. C. lyase gene of F. covae (Panangala et al., 2007). The primer sequence was as follows FcFd (forward) CCTGTACCTAATTGGGGAAAAGAGG, FcRs (reverse) GCGGTTATGGCCTTGTTTATCATAGA and probe ACAACAATGATTTTGCAGGAGGAGTATCTGATGGG. This procedure confirmed the identity of isolates as F. covae and quantified bacterial DNA from the samples. The TaqMan-based real-time PCR amplification reaction mixture consisted of 1X TaqMan™ Universal PCR Master Mix containing AmpliTaq Gold DNA polymerase, each dNTP, a passive reference dye (ROX) and optimizing buffer components (Applied Biosystems, Foster City, CA, United States), 400 nM each of forward (FcFp) and reverse (FcRp) primers, 200 nM labeled probe, 5 µL template DNA and sterile molecular grade water to make a final reaction volume of 25 µL. The reactions were performed in triplicate with the cycling parameters set as follows: an initial DNA denaturation and AmpliTaq activation at 95°C for 10 min, followed by 45 cycles of 95°C for 15 s and 60°C for 1 min (Applied Biosystems, StepOne Plus real-time PCR Thermo Scientific).
Anti-F. covae, IgG fraction monoclonal antibodies, (clone 4H10/F12), (Austral Biologicals, San Ramon, CA, United States; Catalog # FM-070AZ-5) were labeled with Fluorescein (Lightning-Link® Fluorescein Conjugation Kit, Innova Biosciences, Catalog # 707-0015) according to the manufacturer’s standard protocols. The resulting fluorescein-labeled antibody conjugate (2 μl) was then mixed with centrifuged tank water samples (100 μl) and vortexed for 30 s before being analyzed with a BD Accuri Flow Cytometer (Becton, Dickinson, and Company, Franklin Lakes, NJ, United States). Using the FCM to enumerate bacteria, 100 µL samples were analyzed at the “high” rate (100 µL/min) in triplicate. The threshold was set on the green fluorescence (FL1-H). Count data and fluorescence measurements were obtained with BD Accuri C6 software and FlowJo (FlowJo LLC, Becton, Dickinson, and Company, Franklin Lakes, NJ, United States) to generate cytograms. Populations of F. covae were identified on cytograms obtained from forward scatter (FSC-H) vs. side scatter (SSC-H) and confirmed by FL1-H vs. SSC-H density plots.
At the end of the study, two fish from each treatment group were euthanized with MS-222 and stored at −80°C for cortisol analysis. A whole-body cortisol analysis was conducted on a pooled sample of two individuals per treatment, according to Sink et al. (2007b).
Gill tissue samples from fish subject to columnaris challenge and control treatments were fixed, sectioned, and stained according to standard hematoxylin and eosin protocol (Bancroft and Stevens 1995) for determining the pathological changes in gill structure from columnaris infection.
To determine differences in water quality parameters among treatments, a generalized linear model (GLM) was used for each water quality parameter. Based on normality testing, the conducted GLMs were either parametric (analysis of variance; ANOVA) or non-parametric (Kruskal-Wallis test). To test for the main effects of challenge (control and bacteria), temperature (22°C and 28°C), and density (600 and 2,400 fish/m3); and their interactions on each tested variable, a generalized linear mixed model (GLMM) was used. When normality assumption was violated, GLMMs were applied on rank transformed data. In all linear model analyses, if there were significant differences, post-hoc analyses were performed using the Tukey’s Studentized Range—HSD [or Dwass-Steel-Critchlow-Fligner (DSCF) for rank data].
Kaplan-Meier survival analyses were performed for estimation of median survival times and survival probabilities of Golden Shiners 48 h after challenge based on the challenge, temperature, and density. Log-rank tests were used to compare the survival probability between challenge groups (control versus bacteria), temperatures, and densities.
Counts of F. covae in water samples determined by FCM and qPCR were compared using paired sample t-test if the data were normally distributed and Wilcoxon signed-rank test if the data were not normally distributed. The relationship between both counts was examined using Spearman’s rank-order correlation test (data did not exhibit a normal distribution). Moreover, Bland–Altman analysis was performed to assess the agreement in cell counts determined by the two quantitative detection methods (FCM and qPCR) in the same water samples.
Statistical significance was set at p < 0.05. Levene’s test was used to evaluate the homogeneity of variances (homoscedasticity), and the Shapiro–Wilk test was utilized for normality analysis of the variables. Bacterial counts were logarithmic transformed (base 10) and presented as log (count of F. covae + 1)/ml. All normally distributed data were presented as the mean ± standard error of the mean (SE) while non-normally distributed data were presented as median ± interquartile range (IQR = percentile 75%−percentile 25%). Data management and all statistical analyses were performed with SAS® version 9.4 (SAS 2013). All graphs were constructed in SigmaPlot® software (version 14.5; Systat Software Inc., San Jose, CA, United States).
Weight of Golden Shiners used in this study ranged from 1.16 to 5.78 g (2.62 ± 0.11 g; n = 50). While their body length ranged between 5.10 and 8.40 cm (6.64 ± 0.08 cm). After 24 h of exposure, fish in the challenged groups started displaying clinical signs typical of columnaris disease, which included depigmentation, caudal and dorsal fin margins erosions, and characteristic “saddleback” lesions (Noga, 1996). As the disease progressed, infected tissues became necrotic and eventually resulted in fish mortality.
Concentrations of unionized ammonia (NH3) and pH did not differ among treatments (Table 1). Significant differences occurred in water flow rates, the percentage of NH3, total ammonia nitrogen (NH4), water temperature, and dissolved oxygen (DO; Table 1). Flow rates for the control group at 22°C stocked with 2,400 fish/m3 were significantly lower than the control groups of 600 and 2,400 fish/m3 at 28°C, the bacterial group of 600 fish/m3 at 22°C and 2,400 fish/m3 at 28°C (Table 1). The percent of unionized ammonia in the control tanks stocked at 2,400 fish/m3 was significantly lower than the NH3 in the control tanks stocked at 2,400 fish/m3 and the bacterial tank stocked at 600 fish/m3, both of which were at 28°C (Table 1). Concentrations of NH4 of fish stocked in control tanks and bacterial tanks stocked at 600 fish/m3 at 22°C were significantly lower than all tanks stocked at 2,400 fish/m3 (Table 1). As expected, the lower water temperature was significantly different within control and bacterial groups stocked at both densities compared to those maintained at the higher temperature (Table 1). Similarly, DO was higher at the lower temperature compared to the higher temperatures for all groups (Table 1).
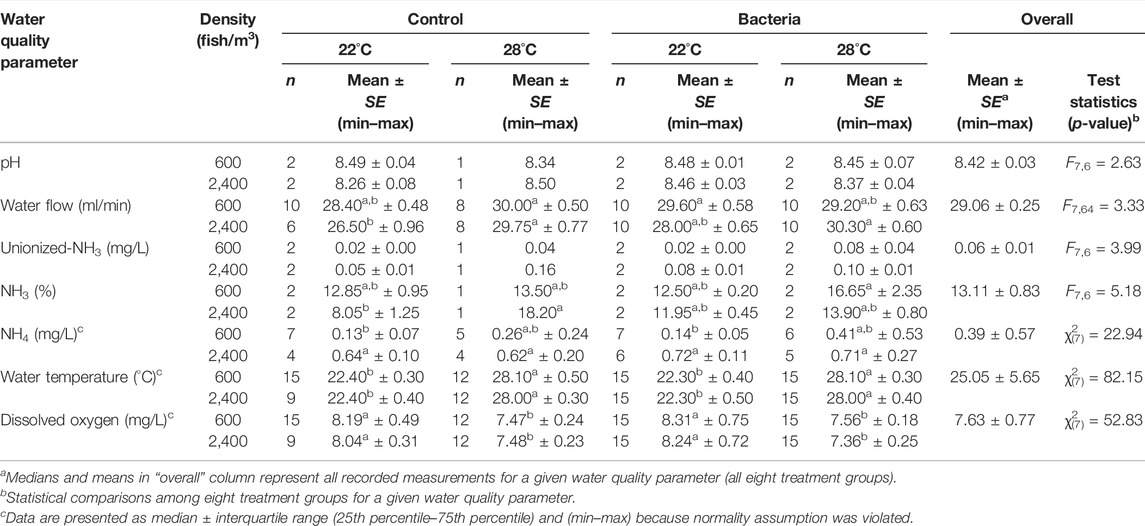
TABLE 1. Water quality [number of measurements (n), mean, standard error of the mean (SE), minimum measurement (min), and maximum measurement (max)] measured in tanks of eight treatments. Golden Shiners were subjected to low (600 fish/m3) or high (2,400 fish/m3) densities at low (22°C) or high (28°C) temperature treatments. Treatments included challenge with F. covae (Bacteria) or no exposure to F. covae (Control). Based on normality testing, tests used were either analysis of variance (test statistics = Fdf1,df2) or Kruskal-Wallis [test statistics = χ2(df)]. Within each parameter, means with different lowercase superscript letters are significantly different at p < 0.05 if bold.
Comparison of Kaplan-Meier survival curves (Figure 1) demonstrated that survival probability of Golden Shiners challenged with F. covae (bacteria) were significantly lower than those without exposure (control; Figure 1A). Golden Shiners held at 22°C had significantly higher survival as compared to those held at 28°C (Figure 1B) while both fish densities (600 and 2,400 fish/m3) did not differ in survival (Figure 1C).
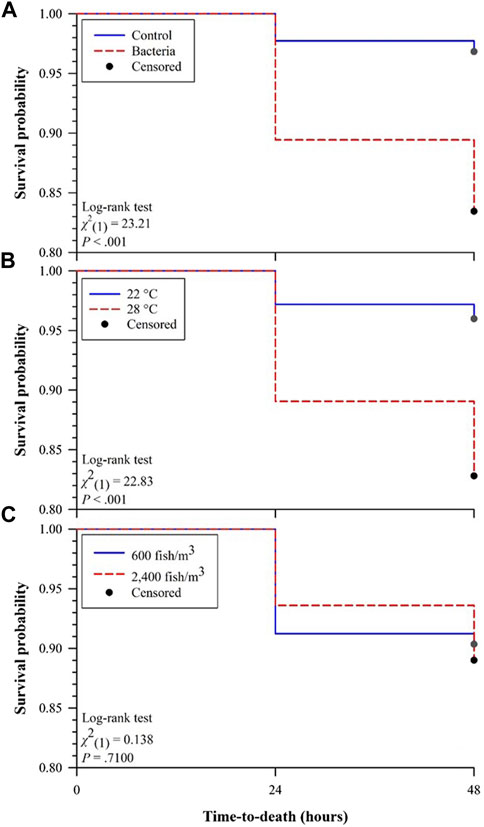
FIGURE 1. Kaplan-Meier survival curves for effects of (A) challenge (control versus bacteria), (B) water temperature (22°C versus 28°C), and (C) fish density (600 versus 2,400 fish/m3) on survival probabilities of Golden Shiners 48 h after challenge.
Examination of the two-way interaction of challenge × density, survival percent across the study was significantly different, but did not differ in the other interactions (Table 2). Survival percent of control tanks stocked with 600 fish/m3 were significantly higher than those of bacterial tanks stocked with 2,400 fish/m3 (Table 3). Survival percent after the 48 h challenge study, showed a significant difference in the challenge × temperature, but did not differ in the other interactions (Table 2). Survival of the control groups at 22°C was significantly higher than the bacterial groups at 28°C (Table 3).

TABLE 2. Statistical analysis results (test statistics, degrees of freedom, and p-value) of two-way interactions (groups = 4) and three-way interactions (groups = 8) between the three main effect variables (challenge, temperature, and density) for survival, fish qPCR, water qPCR, and flow cytometer bacterial count of F. covae in water. Significant results at p < 0.05 if bold.
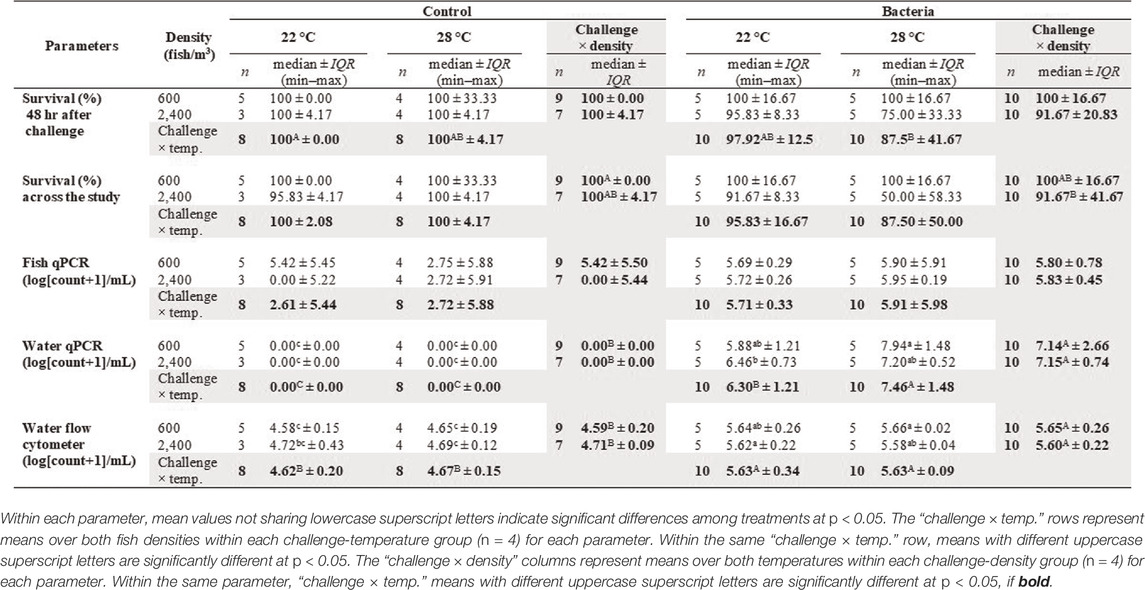
TABLE 3. Median, interquartile range (IQR), minimum measurement (min), and maximum measurement (max) of survival % and log (count of F. covae + 1)/ml of fish qPCR, water qPCR, and flow cytometer bacterial count in water for challenge-temperature-density treatment groups (n = 8).
There was a significant difference in mortality before the challenge with tanks stocked at 600 fish/m3 significantly lower than those stocked at 2,400 fish/m3 (Figure 2A). Mortality percentages 48 h after bacterial challenge were lower in the control groups vs. the bacterial groups (Figure 2B).
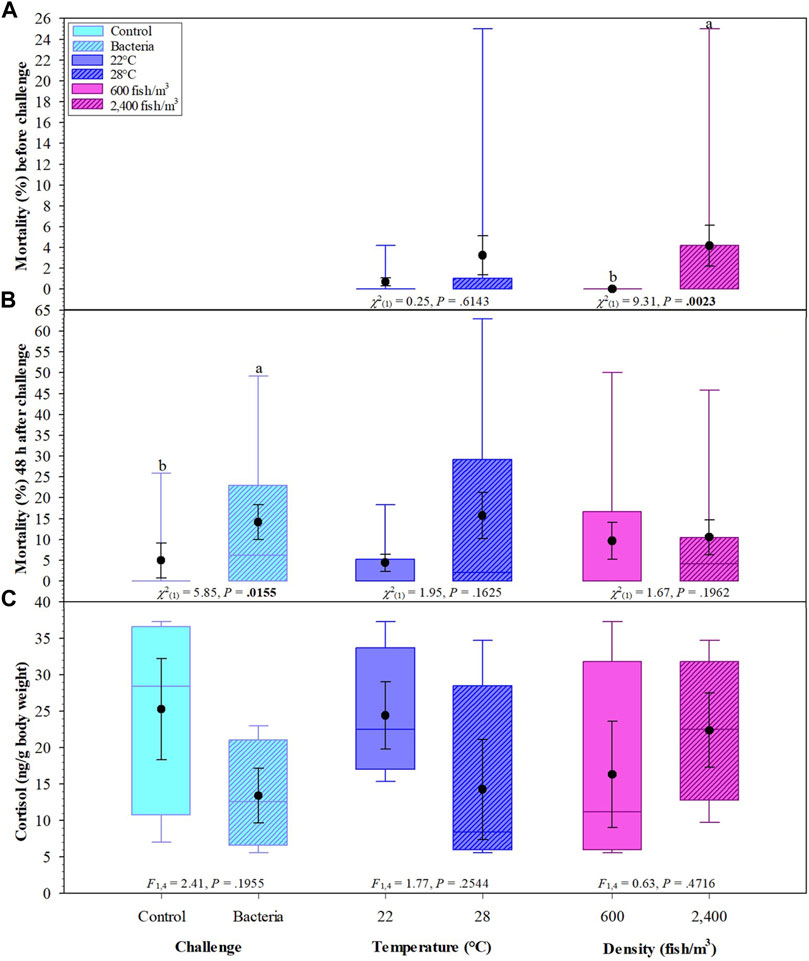
FIGURE 2. Effects of challenge, temperatures, and fish density of Golden Shiners on mortality (%) before challenge (A), after challenge (B) and whole-body cortisol (ng/g body weight) (C). Golden Shiners were subjected to low (600 fish/m3) or high (2,400 fish/m3) densities at low (22°C) or high (28°C) water temperature treatments. Treatments included challenge with F. covae (Bacteria) or no exposure to F. covae (Control). Within each box plot, vertical line indicates the median, black dot indicates the mean, and error bars around the black dot represent standard error of the mean.
Over 90% of the events enumerated in the water samples were F. covae cells, as evidenced by the SSC-H histograms (Figure 3) and FL1-H density plots (Figure 4). Density plots obtained from fluorescein-labeled antibody conjugated F. covae cells showed a right shift in fluorescence in the FL1 region (530 ± 15 nm) compared to the unconjugated cells (Figure 4).
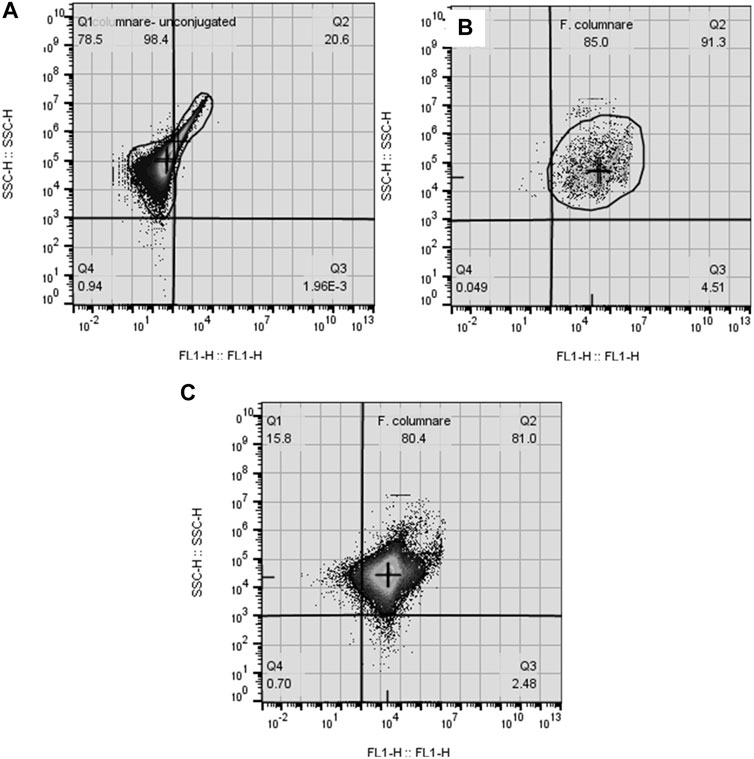
FIGURE 3. Cytograms depicting fluorescence density plot (FL1-H vs. SSC-H) of (A) unconjugated F. covae cells obtained from bacterial cell culture and F. covae cell samples conjugated with fluorescein labelled antibodies from (B) control tanks containing well water and (C) columnaris challenge tanks where fish were exposed to F. covae. Plots (B,C) show a shift in fluorescence to the right side of the plot indicating fluorescence of the conjugated antibody attached to F. covae cells.

FIGURE 4. Histogram plots of F. covae cell counts obtained from (A) control tank water samples and (B) tanks exposed to F. covae challenge. Note the scale on the y-axis in (B) is an order of magnitude higher than (A).
Overall, F. covae counts obtained by FCM were significantly higher in the columnaris challenge treatments than in the control treatments (Figure 5A). There were no significant differences in bacterial counts in the density or temperature treatments.
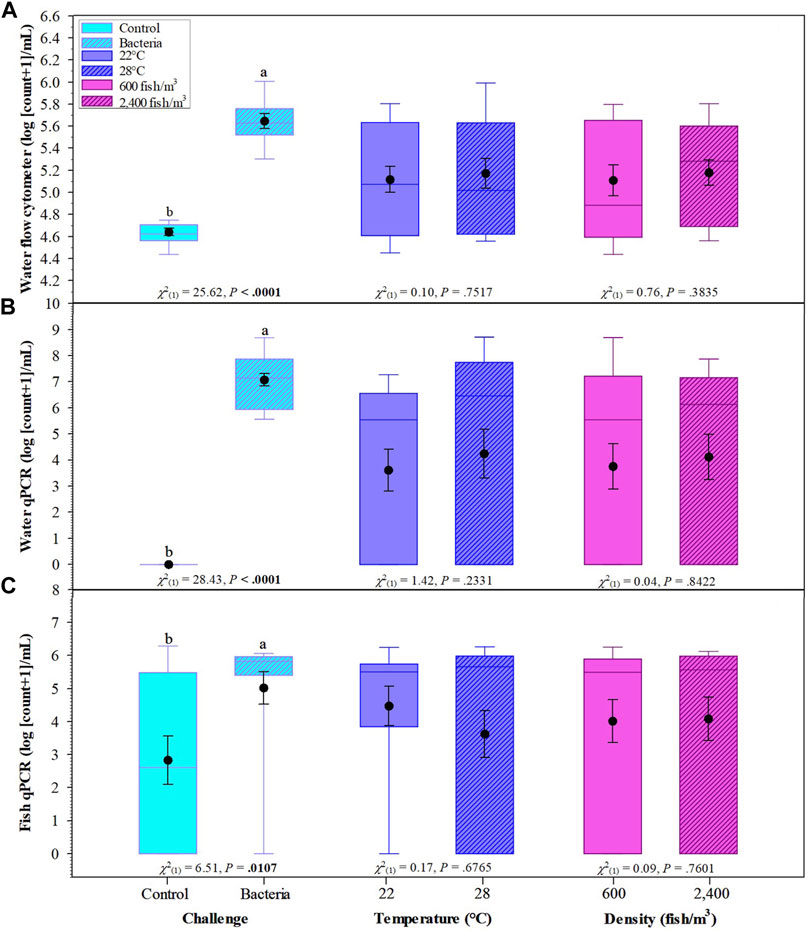
FIGURE 5. Effects of challenge, temperatures, and fish density of Golden Shiners on flow cytometer bacterial count in water (A), water qPCR (B), and fish qPCR (C). Golden Shiners were subjected to low (600 fish/m3) or high (2,400 fish/m3) densities at low (22°C) or high (28°C) temperature treatments. Treatments included challenge with F. covae (Bacteria) or no exposure to F. covae (Control). Within each box plot, vertical line indicates the median, black dot indicates the mean, and error bars around the black dot represent standard error of the mean. Data with different lowercase letters within same variable differ significantly at p < 0.05 if bold.
Bacterial counts/ml obtained from water samples determined by qPCR were significantly higher in the columnaris challenge treatment groups than the control treatments. There were no significant differences between bacterial counts/ml obtained from water samples in the density or temperature treatments (Figure 5B). Similar results were obtained for fish bacterial counts via qPCR with control fish having lower bacterial counts compared to fish challenged with F. covae (Figure 5C).
There were significant differences between water bacterial counts determined by FCM when examining the interaction of challenge × temperature and challenge × density as well as the three-way interaction of challenge × temperature × density (Tables 2 and 3).
There was a significant positive correlation between bacterial counts determined by qPCR and those determined by FCM in all tanks (Spearman’s rank-order: rs(36) = 0.88, p < 0.0001) and challenge tanks (Spearman’s rank-order: rs(20) = 0.60, p = 0.0063). The Bland–Altman plots support these strong correlations, however, there were differences between the counts determined by qPCR and FCM as shown in the Bland–Altman difference plots (Figure 6). In control tanks, limits of agreement (LOA) did not include the Bland–Altman identity line (difference = 0.0; Figure 6A). All Bland–Altman plots show that most points fall within LOA and show a proportional constant error hence the variability of differences between both determination methods increased as the magnitude of the measure increased (Figure 6).
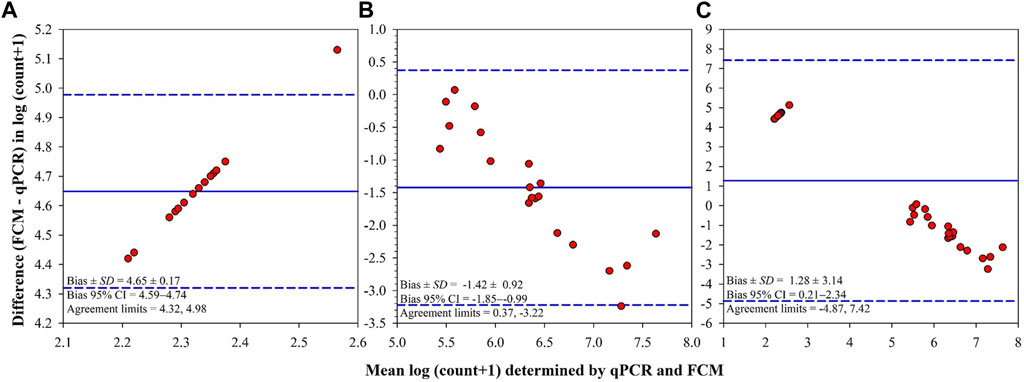
FIGURE 6. Bland-Altman summaries for F. covae cell counts determined by quantitative PCR (qPCR) and flow cytometry (FCM) in the same water samples obtained from control tanks (A), tanks exposed to F. covae challenge (B), and all tanks (C). The Bland-Altman summaries plot the difference in the measure [log (count of F. covae + 1)] between two determination methods (FCM–qPCR; y-axis) versus the mean of the measure determined by the two methods for each subject (x-axis). The overall mean differences (bias; solid lines) and limits of agreement (mean difference ±1.96 standard deviation of the differences; dashed lines) are also shown on the plots.
The comparison of bacterial counts determined by qPCR and FCM in control tanks indicates a significant difference in the counts, with the FCM count higher than the qPCR counts (Z = 3.52, p < 0.001; Figure 7A). However, in the challenge tanks, the results are reversed with higher bacterial counts determined by qPCR [t(19) = 6.94, p < 0.0001; Figure 7B]. The overall counts in all tanks show no difference in the counts obtained, but the range obtained with qPCR is greater, although not significantly (Figure 7C).
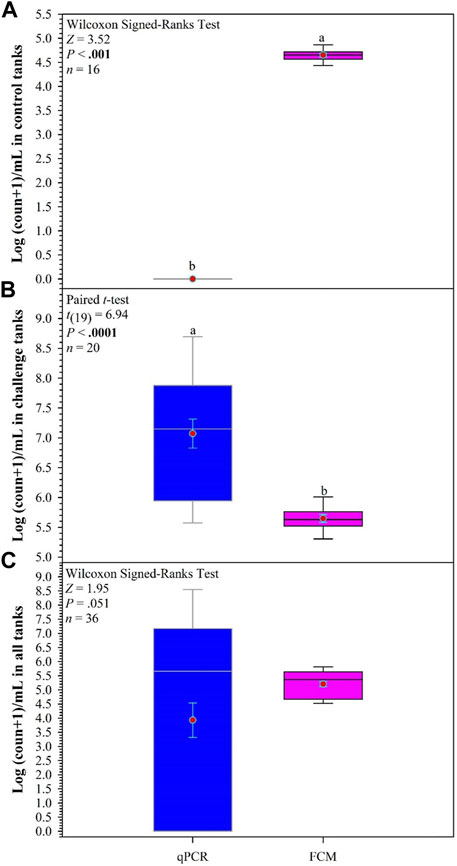
FIGURE 7. Comparisons between quantitative PCR (qPCR) and flow cytometry (FCM) to determine count of F. covae in water samples obtained from control tanks (A), challenge tanks (B), and all tanks (C). Within each box plot, vertical line indicates the median, red dot indicates the mean, and error bars around the red dot represent standard error of the mean. Data with different lowercase letters within same variable differ significantly at p < 0.05 if bold.
Across all treatments, whole-body cortisol ranged from 5.60 to 37.30 ng/g body weight with no significant differences in fish cortisol concentrations between challenge, temperature, or density groups (Figure 2C).
Microscopic examination of the affected gill tissue revealed characteristic columnaris infection signs—the disappearance of the typical structure and clubbing of primary and secondary filaments in fish exposed to the bacterial challenge. Samples from control groups revealed a typical gill structure (Figure 8).
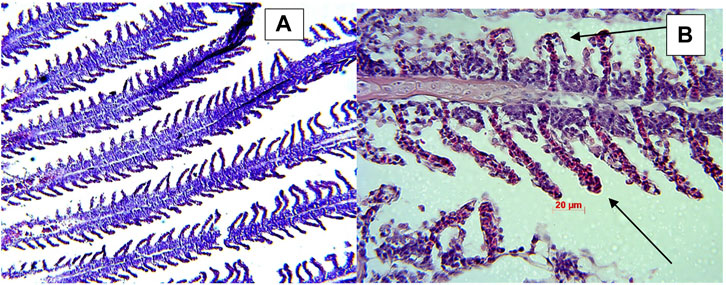
FIGURE 8. Histology samples of gill tissue showing retention of normal gill structure in control fish (A) and clubbed gills indicated by black arrows columnaris infected fish (B).
Although significant differences occurred in some of the water quality parameters (NH3, NH4, DO and temperature) the values obtained were within acceptable limits for culture of the Golden Shiner (Stone et al., 2016) and was likely not a cause of the mortality observed in this study.
Survival in Golden Shiners was not affected by rearing density (6,00,000–24,00,000 fish/ha). Golden Shiners are gregarious and a shoaling species (Pitcher 1983) that can tolerate high densities and therefore, is the reason higher densities did not affect survival. However, survival was significantly impacted in high-density groups exposed to the challenge. This result supports the view that higher rearing densities can lead to increased transmission of disease. A 6°C increase in temperature from 22°C to 28°C led to a significant decrease in survival when fish were challenged. Suomalainen et al. (2005) noted that high temperature (+23°C) and high rearing density increased mortality in rainbow trout. As Golden Shiners are a warm water species, higher water temperatures within the culture range may not affect Golden Shiners survival, but it could increase infection severity, as evidenced by the significantly higher bacterial count by qPCR from gill tissue.
Cortisol measurements showed no variation among the treatment groups suggesting the densities and temperature treatments in the study were well within the range used for rearing Golden Shiners. The average cortisol measurement (19.3 ng/g) were comparable to those observed by Melandri et al. (2008) 12–15 ng/g for Golden Shiners under non-stressed conditions. Stressed Golden Shiners show elevated cortisol measurements as observed with handling stress (46.5 ng/g; Sink et al., 2007a) and acute 30-min confinement stress (51.2 ng/g; Sink et al., 2008).
It is essential to note the difference in virulence among isolates of F. covae bacteria (Pulkkinen et al., 2010; Kumru et al., 2017) to different species. The isolate MS-94-081 is a highly virulent obligate pathogen in catfish (Soto et al., 2008; Kumru et al., 2017). However, this isolate is not as virulent in Golden Shiners, as it did not result in 100% mortality even at the end of 48 h challenge. Additionally, Golden Shiners were held in ULF flow-through tanks, which may have reduced the contact time between the pathogen and the host tissue. An earlier study noted that mortality rates of elvers (Order Anguilliformes) were reduced by half in tanks with running water compared with those held in static water (Kuo et al., 1981).
Although it appears that bacterial enumerations by FCM were comparable to counts by qPCR, it is important to examine the bias produced in the Bland-Altman plots. In this study the bias was significant because the line of equity (line at y = 0) is not within the confidence intervals of the mean difference. However, clinically, if the presence or absence of bacteria is the acceptable criteria then the FCM and qPCR methods could be used interchangeably. Bacterial counts by PCR were higher than the FCM enumerations. This was expected as counts by PCR are estimated by DNA concentrations in the form of live and dead cells. Furthermore, qPCR is highly sensitive; as few as three bacteria/ml can be detected from samples (Panagala et al., 2007). On the other hand, to obtain meaningful data, FCM samples had to be concentrated. FCM measurements are affected quantitatively and qualitatively by the fluorochrome used and storage temperature (Jacquet et al., 2013). This could explain the discrepancy between the counts obtained by the two methods. FCM and qPCR produced strongly correlated results; this was expected as both quantify target populations.
Golden Shiners raised at increased densities and temperatures in intensive rearing aquaculture systems, even within the normal range for growth of this species does not effect the stress response. Higher temperatures increase the mortality rate in fish maintained at 2,400 fish/m3 and challenged with F. covae. To obtain counts by FCM, a fluorescein labelled monoclonal antibody was conjugated with the bacterial cells and analyzed in a flow cytometer. Bacterial counts by FCM showed a strong correlation with bacterial DNA numbers by PCR in the water samples. FCM is a fast and reliable method for counting F. covae from experimental tank water samples. However, the reliability of the method needs to be tested for pond water samples containing other flora.
The raw data supporting the conclusion of this article will be made available by the authors, without undue reservation.
The animal study was reviewed and approved by The University of Arkansas at Pine Bluff Institutional Animal Care and Use Committee.
SK, BF, NR, and AK contributed to the experimental design, data analyses, and manuscript writing. HA contributed to data analyses and writing of the manuscript.
Funding for this research was provided by the State of Arkansas; Extension Services, USDA National Institute of Food and Agriculture Evans-Allen, Grant/Award Number: ARK05040; Southern Regional Aquaculture Center, Grant/Award Numbers: 2014-38500-22308, 2012-38500-19665. The Southern Regional Aquaculture Center (Grant Nos 2012-38500-19665 and 2014-38500-22308) from the United States Department of Agriculture Cooperative States Research, Education, and Extension Services, USDA National Institute of Food and Agriculture Evans-Allen project ARK05040, and the State of Arkansas provided funding for this research.
The authors declare that the research was conducted in the absence of any commercial or financial relationships that could be construed as a potential conflict of interest.
All claims expressed in this article are solely those of the authors and do not necessarily represent those of their affiliated organizations, or those of the publisher, the editors and the reviewers. Any product that may be evaluated in this article, or claim that may be made by its manufacturer, is not guaranteed or endorsed by the publisher.
This paper is based, in part, on research conducted by the senior author for the Doctor of Philosophy degree in the Department of Aquaculture and Fisheries, the University of Arkansas at Pine Bluff. The authors thank Nathan Stone for assistance with funding and experimental design.
Anacker R. L., Ordal E. J. (1955). Study of a Bacteriophage Infecting the Myxobacterium Chondrococcus columnaris. J. Bacteriol. 70, 738–741. doi:10.1128/jb.70.6.738-741.1955
Bancroft J. D., Stevens A. (1995). Theory and Practice of Histological Techniques. 4th Ed. New York: Churchill Livingstone.
Beck B. H., Farmer B. D., Straus D. L., Li C., Peatman E. (2012). Putative Roles for a Rhamnose Binding Lectin in Flavobacterium columnare Pathogenesis in Channel Catfish Ictalurus punctatus. Fish Shellfish Immunol. 33, 1008–1015. doi:10.1016/j.fsi.2012.08.018
Cellamare M., Rolland A., Jacquet S. (2010). Flow Cytometry Sorting of Freshwater Phytoplankton. J. Appl. Phycol. 22, 87–100. doi:10.1007/s10811-009-9439-4
Davis H. S. (1922). A New Bacterial Disease of Freshwater Fishes. Bull. U.S. Bur. Fish. 38, 261–280. doi:10.5962/bhl.title.49773
Declercq A. M., Haesebrouck F., Van den Broeck W., Bossier P., Decostere A. (2013). Columnaris Disease in Fish: A Review with Emphasis on Bacterium-Host Interactions. Vet. Res. 44, 27–17. doi:10.1186/1297-9716-44-27
Díaz-Rosales P., Salinas I., Rodríguez A., Cuesta A., Chabrillón M., Balebona M. C., et al. (2006). Gilthead Seabream (Sparus aurata L.) Innate Immune Response after Dietary Administration of Heat-Inactivated Potential Probiotics. Fish Shellfish Immunol. 20, 482–492. doi:10.1016/j.fsi.2005.06.007
Durborow R. M., Thune R. L., Hawke J. P., Camus A. C. (1998). Columnaris Disease: A Bacterial Infection Caused by Flavobacterium Columnare. Stoneville, Mississippi: Southern Regional Aquaculture Center U.S. Department of Agriculture.
Farmer B. D. (2004). Improved Methods for the Isolation and Characterization of Flavobacterium Columnare. Master’s Thesis. Baton Rouge, Louisiana: Louisiana State University.
Fujiwara‐Nagata E., Eguchi M. (2009). Development and Evaluation of a Loop‐Mediated Isothermal Amplification Assay for Rapid and Simple Detection of Flavobacterium psychrophilum. J. Fish. Dis. 32, 873–881. doi:10.1111/j.1365-2761.2009.01066.x
Gasol J. M., Del Giorgio P. A. (2000). Using Flow Cytometry for Counting Natural Planktonic Bacteria and Understanding the Structure of Planktonic Bacterial Communities. Sci. Mar. 64, 197–224. doi:10.3989/scimar.2000.64n2197
Gibbs G. D., Griffin M. J., Mauel M. J., Lawrence M. L. (2020). Validation of a Quantitative PCR Assay for the Detection of 2 Flavobacterium columnare Genomovars. J. VET. Diagn. Invest. 32, 356–362. doi:10.1177/1040638720915760
Havixbeck J. J., Rieger A. M., Wong M. E., Hodgkinson J. W., Barreda D. R. (2016). Neutrophil Contributions to the Induction and Regulation of the Acute Inflammatory Response in Teleost Fish. J. Leukoc. Biol. 99, 241–252. doi:10.1189/jlb.3hi0215-064r
Jacquet S., Dorigo U., Personnic S. (2013). “A Few Tests Prior to Flow Cytometry and Epifluorescence Analyses of Freshwater Bacterio-And Virioplankton Communities,” in Flow Cytometry, Stefanos papandreou (Hauppauge, New York: Nova Science Publishers, Inc), 1–30.
Kumar D., Suresh K., Dey R. K., Mishra B. K. (1986). Stress-Mediated Columnaris Disease in Rohu, Labeo Rohita (Hamilton). J. Fish. Dis. 9, 87–89. doi:10.1111/j.1365-2761.1986.tb00985.x
Kumru S., Tekedar H. C., Waldbieser G. C., Karsi A., Lawrence M. L. (2016). Genome Sequence of the Fish Pathogen Flavobacterium columnare Genomovar II Strain 94-081. Genome Announc. 4 (3), e00430–16. doi:10.1128/genomeA.00430-16
Kumru S., Tekedar H. C., Gulsoy N., Waldbieser G. C., Lawrence M. L., Karsi A. (2017). Comparative Analysis of the Flavobacterium columnare Genomovar I and II Genomes. Front. Microbiol. 8, 1375. doi:10.3389/fmicb.2017.01375
Kuo S.-C., Chung H.-Y., Kou G.-H. (1981). Studies on Artificial Infection of the Gliding Bacteria in Cultured Fishes. Fish. Pathol. 15, 309–314. doi:10.3147/jsfp.15.309
LaFrentz B. R., Králová S., Burbick C. R., Alexander T. L., Phillips C. W., Griffin M. J., et al. (2022). The Fish Pathogen Flavobacterium columnare Represents Four Distinct Species: Flavobacterium columnare, Flavobacterium covae Sp. nov., Flavobacterium davisii Sp. Nov. And Flavobacterium oreochromis Sp. nov., and Emended Description of Flavobacterium columnare. Syst. Appl. Microbiol. 45, 126293. doi:10.1016/j.syapm.2021.126293
LaFrentz B. R., Shoemaker C. A., Booth N. J., Peterson B. C., Ourth D. D. (2012). Spleen Index and Mannose-Binding Lectin Levels in Four Channel Catfish Families Exhibiting Different Susceptibilities to Flavobacterium columnare and Edwardsiella ictaluri. J. Aquat. Anim. Health 24, 141–147. doi:10.1080/08997659.2012.675936
Loch T. P., Faisal M. (2015). Emerging Flavobacterial Infections in Fish: A Review. J. Adv. Res. 6, 283–300. doi:10.1016/j.jare.2014.10.009
Melandri M., Stone N., Lochmann R. (2008). Effects of Temperature on the Growth of Golden Shiners in Aquaria. N. Am. J. Aqua. 70, 452–458. doi:10.1080/08997659.2012.675932
Mitchell A., Farmer B. (2010). Evaluation of an Ultra-Low-Flow Water Delivery System for Small Experimental Tanks. North Am. J. Aquac. 72, 195–200. doi:10.1577/a09-061.1
Panangala V. S., Shoemaker C. A., Klesius P. H. (2007). TaqMan Real-Time Polymerase Chain Reaction Assay for Rapid Detection of Flavobacterium columnare. Aquaculture Res 38, 508–517. doi:10.1111/j.1365-2109.2007.01695.x
Pitcher T. J. (1983). Heuristic Definitions of Fish Shoaling Behaviour. Anim. Behav. 31, 611–613. doi:10.1016/S0003-3472(83)80087-6
Plumb J. A., Hanson L. A. (2010). Health Maintenance and Principal Microbial Diseases of Cultured Fishes. Ames, Iowa: Iowa State University Press. doi:10.1002/9780470958353
Pulkkinen K., Suomalainen L.-R., Read A. F., Ebert D., Rintamäki P., Valtonen E. T. (2010). Intensive Fish Farming and the Evolution of Pathogen Virulence: The Case of Columnaris Disease in Finland. Proc. R. Soc. B. 277 (1681), 593–600. doi:10.1098/rspb.2009.1659
SAS (2013). Statistical Analysis System for Windows: Release. Cary, North Carolina, USA: SAS Institute Inc.
Shoemaker C. A., Olivares-Fuster O., Arias C. R., Klesius P. H. (2008). Flavobacterium columnare Genomovar Influences Mortality in Channel Catfish (Ictalurus punctatus). Vet. Microbiol. 127, 353–359. doi:10.1016/j.vetmic.2007.09.003
Sink T. D., Kumaran S., Lochmann R. T. (2007b). Development of a Whole-Body Cortisol Extraction Procedure for Determination of Stress in Golden Shiners, Notemigonus crysoleucas. Fish. Physiol. Biochem. 33, 189–193. doi:10.1007/s10695-007-9130-0
Sink T. D., Lochmann R. T., Fecteau K. A. (2008). Validation, Use, and Disadvantages of Enzyme-Linked Immunosorbent Assay Kits for Detection of Cortisol in Channel Catfish, Largemouth Bass, Red Pacu, and Golden Shiners. Fish. Physiol. Biochem. 34, 95–101. doi:10.1007/s10695-007-9150-9
Sink T. D., Lochmann R. T., Goodwin A. E., Marecaux E. (2007a). Mortality Rates in Golden Shiners Fed High-Fat Diets with or without a Dairy-Yeast Prebiotic Before Challenge with Flavobacterium columnare. North Am. J. Aquac. 69, 305–308. doi:10.1577/a06-078.1
Soto E., Mauel M. J., Karsi A., Lawrence M. L. (2008). Genetic and Virulence Characterization of Flavobacterium columnare from Channel Catfish (Ictalurus punctatus). J. Appl. Microbiol. 104, 1302–1310. doi:10.1111/j.1365-2672.2007.03632.x
Stone N. M., Kelly A. M., Roy L. A. (2016). A Fish of Weedy Waters: Golden Shiner Biology and Culture. J. World Aquacult Soc. 47, 152–200. doi:10.1111/jwas.12269
Suomalainen L.-R., Tiirola M. A., Valtonen E. T. (2005). Influence of Rearing Conditions on Flavobacterium columnare Infection of Rainbow Trout, Oncorhynchus mykiss (Walbaum). J. Fish. Dis. 28, 271–277. doi:10.1111/j.1365-2761.2005.00631.x
Tekedar H. C., Karsi A., Gillaspy A. F., Dyer D. W., Benton N. R., Zaitshik J., et al. (2012). Genome Sequence of the Fish Pathogen Flavobacterium columnare ATCC 49512. J. Bacteriol. 194, 2763–2764. doi:10.1128/jb.00281-12
Thomas‐Jinu S., Goodwin A. E. (2004). Morphological and Genetic Characteristics of Flavobacterium columnare Isolates: Correlations with Virulence in Fish. J. Fish. Dis. 27, 29–35. doi:10.1046/j.1365-2761.2003.00507.x
Trussell R. P. (1972). The Percent Un-ionized Ammonia in Aqueous Ammonia Solutions at Different pH Levels and Temperatures. J. Fish. Res. Bd. Can. 29, 1505–1507. doi:10.1139/f72-236
Wakabayashi H. (1991). Effect of Environmental Conditions on the Infectivity of Flexibacter columnaris to Fish. J. Fish. Dis. 14, 279–290. doi:10.1111/j.1365-2761.1991.tb00825.x
Wakabayashi H., Egusa S. (1972). Preliminary Experiments on Environmental Factors Influencing the Prevalence of Columnaris Disease. Fish. Pathol. 7 (1), 58–63. doi:10.3147/jsfp.7.58
Keywords: Golden Shiner, flow cytometry, stress, water temperature, columnaris disease, Flavobacterium covae
Citation: Kaimal S, Farmer BD, Renukdas NN, Abdelrahman HA and Kelly AM (2022) Evaluating Stress-Mediated Microbial Pathogenesis in Golden Shiners, Notemigonus crysoleucas. Front. Physiol. 13:886480. doi: 10.3389/fphys.2022.886480
Received: 28 February 2022; Accepted: 11 April 2022;
Published: 11 May 2022.
Edited by:
Shivendra Kumar, Dr. Rajendra Prasad Central Agricultural University, IndiaReviewed by:
Kavita Kumari, Central Inland Fisheries Research Institute (ICAR), IndiaCopyright © 2022 Kaimal, Farmer, Renukdas, Abdelrahman and Kelly. This is an open-access article distributed under the terms of the Creative Commons Attribution License (CC BY). The use, distribution or reproduction in other forums is permitted, provided the original author(s) and the copyright owner(s) are credited and that the original publication in this journal is cited, in accordance with accepted academic practice. No use, distribution or reproduction is permitted which does not comply with these terms.
*Correspondence: Anita M. Kelly, YW1rMDEwNUBhdWJ1cm4uZWR1
†Present addresses: Sindhu Kaimal, Zuni Public School District, Zuni, NM, United States
Nilima N. Renukdas, Arkansas Agriculture Department, Little Rock, AR, United States
Anita M. Kelly, Alabama Fish Farming Center, Auburn University, Greensboro, AL, United States
Disclaimer: All claims expressed in this article are solely those of the authors and do not necessarily represent those of their affiliated organizations, or those of the publisher, the editors and the reviewers. Any product that may be evaluated in this article or claim that may be made by its manufacturer is not guaranteed or endorsed by the publisher.
Research integrity at Frontiers
Learn more about the work of our research integrity team to safeguard the quality of each article we publish.