 Jorge E. Morais
 Tiago M. Barbosa
 Alan M. Nevill
 Stephen Cobley
 Daniel A. Marinho
- 1Department of Sport Sciences, Instituto Politécnico de Bragança, Bragança, Portugal
- 2Research Center in Sports Health and Human Development (CIDESD), University of Beira Interior, Covilhã, Portugal
- 3Faculty of Education, Health, and Wellbeing, University of Wolverhampton, Wolverhampton, United Kingdom
- 4Discipline of Exercise and Sport Science, Faculty of Health Sciences, The University of Sydney, Sydney, NSW, Australia
- 5Department of Sport Sciences, University of Beira Interior, Covilhã, Portugal
Introduction: This study aimed to: 1) determine swimming velocity based on a set of anthropometric, kinematic, and kinetic variables, and; 2) understand the stroke frequency (SF)–stroke length (SL) combinations associated with swimming velocity and propulsion in young sprint swimmers.
Methods: 38 swimmers (22 males: 15.92 ± 0.75 years; 16 females: 14.99 ± 1.06 years) participated and underwent anthropometric, kinematic, and kinetic variables assessment. Exploratory associations between SL and SF on swimming velocity were explored using two two-way ANOVA (independent for males and females). Swimming velocity was determined using multilevel modeling.
Results: The prediction of swimming velocity revealed a significant sex effect. Height, underwater stroke time, and mean propulsion of the dominant limb were predictors of swimming velocity. For both sexes, swimming velocity suggested that SL presented a significant variation (males: F = 8.20, p < 0.001, η2 = 0.40; females: F = 18.23, p < 0.001, η2 = 0.39), as well as SF (males: F = 38.20, p < 0.001, η2 = 0.47; females: F = 83.04, p < 0.001, η2 = 0.51). The interaction between SL and SF was significant for females (F = 8.00, p = 0.001, η2 = 0.05), but not for males (F = 1.60, p = 0.172, η2 = 0.04). The optimal SF–SL combination suggested a SF of 0.80 Hz and a SL of 2.20 m (swimming velocity: 1.75 m s−1), and a SF of 0.80 Hz and a SL of 1.90 m (swimming velocity: 1.56 m s−1) for males and females, respectively. The propulsion in both sexes showed the same trend in SL, but not in SF (i.e., non-significant variation). Also, a non-significant interaction between SL and SF was observed (males: F = 0.77, p = 0.601, η2 = 0.05; females: F = 1.48, p = 0.242, η2 = 0.05).
Conclusion: Swimming velocity was predicted by an interaction of anthropometrics, kinematics, and kinetics. Faster velocities in young sprinters of both sexes were achieved by an optimal combination of SF–SL. The same trend was shown by the propulsion data. The highest propulsion was not necessarily associated with higher velocity achievement.
Introduction
Competitive swimming is a time-based sport where the athlete must travel a given distance at maximum velocity (Seifert et al., 2007). Power input and transport energy cost are the two main underlying factors that allow faster velocities to be achieved:
in which v is the swimming velocity (in m·s−1),
Predicting swimming velocity is the main goal of researchers and coaches (Morais et al., 2012; Abbes et al., 2018). Swimming velocity is highly dependent from anthropometric variables (Nevill et al., 2020; Oliveira et al., 2021), kinematics and motor control (Morais et al., 2012; Figueiredo et al., 2016; Silva et al., 2019), energetics/efficiency (Figueiredo et al., 2016; Barbosa et al., 2019), and dry-land strength and power (Girold et al., 2012; Strzala et al., 2019). However, most recent research trends highlighted swimming performance as a holistic phenomenon that is strongly dependent from the interaction between several variables of different scientific fields (Figueiredo et al., 2016; Morais et al., 2021). The potential interaction between swimming performance determinants (i.e., scientific fields, domains, and variables that may determine or predict swimming performance) provides the platform for different and multiple patterns of behavior to emerge on an individual basis. There is an interplay among several variables that ultimately will affect the swimming velocity (Morais et al., 2012; Figueiredo et al., 2016). Therefore, small gains by each variable can trigger a change in the interplay among the components of the system which will ultimately “affect” the variable being determine (in this case swimming velocity). It has been indicated, both experimentally (Tsunokawa et al., 2019; Morais et al., 2020a) and numerically (Bilinauskaite et al., 2013; Cohen et al., 2018), that a greater propulsion is related to faster swimming velocity. A study conducted by Santos et al. (2021) reviewed the state of the art about human propulsion in competitive swimming. Propulsion in swimming refers to the force generated by the swimmer through the actions of upper and lower limbs to promote forward motion (Barbosa et al., 2020). However, there is little awareness of the role that propulsion can play when it interacts with other variables. Thus, being propulsion a key-factor for the swimming velocity improvement, it seems of major importance understanding the magnitude of its influence when interacted with other key-factors.
As with any other cyclic phenomena, the mean swimming velocity depends on the frequency and length of the stroke:
In which
Overall, in all swimming events (i.e., strokes and distances), swimmers can use two main pacing strategies: 1) higher SF and shorter SL, or 2) lower SF and longer SL (Maglischo, 2003; Hellard et al., 2008). Swimmers can even trade-off SF and SL during an event. Whenever an increase in SF is observed, there is often a consequential tendency for SL to decrease (Seifert et al., 2010). Contrastingly, if SF decreases, SL tends to increase (Psycharakis et al., 2008). This happens because swimmers take more time to complete the full stroke cycle (Alberty et al., 2011). In the specific case of freestyle sprinters racing the 50 m event, it was shown that elite swimmers (participating in major competitions such as European and World championships) present an all-out strategy (Simbaña-Escobar et al., 2018; Morais et al., 2022). That is, swimmers exhibit a positive pacing–swimming velocity decrease over time, with a SF decrease and a SL increase over time (Morais et al., 2022). Nonetheless, it was suggested that swimmers may needed to change the SF–SL combination to maintain a given pace (Dekerle et al., 2005). Moreover, whenever swimmers fail to maintain SF, they are often advised to maintain SL to minimize the decrease in swim velocity (Seifert et al., 2005).
Besides the spatial-temporal factors mentioned above, one can argue that other factors can account for dynamics in the SF–SL relationship. For instance, upper limb propulsion may also play an influential role. Overall, it was experimentally shown that propulsion presents a significant and positive relationship with swim velocity (Morais et al., 2020a; Koga et al., 2020). That is, higher propulsion by the upper limbs leads to faster swim velocities. Notwithstanding, it must be pointed out that propulsion generated by the upper limbs account for 90% of the swim velocity (lower limbs actions are responsible for remaining 10%) (Deschodt et al., 1999). Regarding the influence that propulsion may have on SF and SL, it was suggested that the capability to keep a given propulsion intensity throughout the in-water phase of the stroke cycle (i.e., pull and push motion–propulsion) can explain reductions in SF, subsequently leading to a longer SL. Alternatively, a shorter SL can be associated with a lower capability to generate sufficient propulsion necessary to overcome drag (Craig et al., 1985). Others verified that after 4 years of high-velocity training, the participants of their study were able to swim at a given submaximal velocity with a slower SF (i.e., with a longer SL) (Termin and Pendergast, 2000). One can speculate that at least one key-factor for this was the increase of propulsion generated by the swimmers that allowed to swim at faster velocities with slower SF. However, beside such assumptions, one cannot find in the literature evidence about the role that propulsion plays in this SF–SL relationship. As a result, it is logical that understanding the role that propulsion may have on the SF–SL relationship is of paramount importance for swimmers and coaches to support practitioners in designing and developing training programs. This will allow to identify SF–SL combinations that might elicit better performances.
The purposes of the present study were to (1): predict swimming velocity based on a set of anthropometric, kinematic, and kinetic variables, and; 2) understand the SF–SL combinations associated with swimming velocity and propulsion in young sprint swimmers. It was hypothesized that: 1) kinetic variables would be retained as swimming velocity predictors, interacted with anthropometrics and kinematics (all of them with a positive and significant effect), and; 2) the fastest swims are characterized by the highest SF but not the lowest SL, and propulsion plays a determinant and positive role in the SF–SL ratio and swimming velocity.
Methods
Participants
The participants were 38 swimmers (22 males: 15.92 ± 0.75 years-old, FINA points: 566.77 ± 56.82 in the 100 m freestyle event–short course meter swimming pool; 16 females: 14.99 ± 1.06 years-old, FINA points: 602.25 ± 77.35 in the 100 m freestyle event–short course meter swimming pool). Swimmers were recruited from a national squad that competed at international championships and contained age-group national champions and record holders, i.e., Tier 3 (McKay et al., 2022). The inclusion criteria for the participants were: 1) being male and female sprint specialists in their age-group in freestyle sprinting events, and; 2) having participated in daily training sessions from the beginning of the season and without injuries. Participants had more than 5 years of competitive experience; trained six to seven swimming sessions per week; and, had at least one dry-land strength and conditioning session per week. Swimmers were informed about the study procedures as well as the possible risks that could arise from the study. Parents or guardians as well as the swimmers themselves provided informed consent. All procedures were in accordance with the Declaration of Helsinki regarding human research, and the University Ethics Board approved the research design.
Experimental Design
This was a cross-sectional study. After a standardized 1,000 m warm-up, swimmers completed three all-out trials of 25 m freestyle with a push-off start, the fastest trial being used for analysis. Swimmers were instructed to hold their breath during such intermediate distance to avoid modifications in coordination due to breathing. Rest time between trials was 30 min. In-water warm-up and trial performance took place in a 25 m indoor swimming pool (water temperature: 27.5°C; air temperature: 26.0°C; relative humidity: 67% prior to the swimming performance assessment). As part of the trial performance, kinematic and kinetic variables were measured.
Anthropometric Assessment
Participants initially underwent an anthropometric assessment. At this time, the swimmers’ hand dominancy was assessed by self-report as suggested elsewhere (Morais et al., 2020b). Height (H, in cm) was measured as the distance between the vertex to the floor (with the swimmers in the orthostatic position) using a digital stadiometer (SECA, 242, Hamburg, Germany). Body mass (BM, in kg) was measured on a digital scale (TANITA, BC-730, Amsterdam, Netherlands). The swimmer’s arm span (AS, in cm) was measured using digital photogrammetry. Swimmers were placed in an orthostatic position, with both arms in lateral abduction at a 90° angle with the trunk. Both arms and fingers were fully extended. The distance between the tip of each third finger was measured with a dedicated software (Udruler, AVPSoft, United States) (Morais et al., 2020b). For hand surface area (HSA, in cm2), swimmers placed their hands onto a copy machine for surface area scanning. Each HSA was determined using the digital scan by a dedicated software (Udruler, AVPSoft, United States) (Morais et al., 2012).
Stroke Kinematic Assessment
To determine maximum velocity, a speedometer apparatus (Swim speedo-meter, Swimsportec, Hildesheim, Germany) was attached to the swimmers’ hip (Barbosa et al., 2019). In-house built software (LabVIEW®, v. 2010), previously acquired (f = 50 Hz), displayed velocity-time data across each swimmer’s trial (Barbosa et al., 2011). Data was exported to an interface by a 12-bit resolution acquisition card (USB-6008, National Instruments, Austin, Texas, United States). Afterwards, data was imported into signal processing software (AcqKnowledge v. 3.9.0, Biopac Systems, Santa Barbara, United States). Signals were handled using a Butterworth fourth order low-pass filter (cut-off: 5Hz, based on the analysis of the residual error vs cut-off frequency output) (Barbosa et al., 2019). A video camera (Sony FDR-X3,000, Japan) was also attached to a rail at the edge of the swimming pool and recorded swimmers in the sagittal plane. The camera was synchronized with the velocity-time software by a light signal. When the speedo-meter starts acquiring data, a light is enhanced in the software. The camera filmed this moment so that afterwards the velocity-time curve can be synchronized with the video.
The following stroke kinematic variables were determined via assessment of three consecutive stroke cycles during the intermediate 15 m of the swimming pool. The in-water phase of the stroke cycle was considered to start at the hand’s entry and finishes at the hand’s exit. Swimming velocity (v, in m·s−1) was retrieved from the velocity-time curve. Based on video recording assessment, stroke frequency (SF, in Hz) was calculated by the number of cycles per unit of time, specifically the time required to complete a full cycle (f = 1/P; where P is the period), later converted to Hz. The stroke length (SL, in m) was calculated as SL = v/SF (Craig and Pendergast, 1979). The intra-cyclic variation of the horizontal swimming velocity (dv, in %) was computed as the coefficient of variation (CV): CV = one standard deviation/mean * 100 (Barbosa et al., 2010). The underwater stroke time of each upper limb (USTdominant and USTnon-dominant, in s) was computed as the time spent between the entry of the hand in the water and its exit. Then, the mean of both upper limbs was calculated (USTstroke cycle, in s).
Propulsion Assessment
Kinetic data were acquired simultaneously with kinematic data. Thus, the same three consecutive stroke cycles were analyzed. Pressure sensors (Swimming Technology Research, United States; https://swimmingtechnology.com/aquanexanalysis/) were used to measure propulsion (f = 100 Hz) (Havriluk, 2013). This system is based on sensors that estimate in-water pressure (Havriluk, 1988; Barbosa et al., 2020). The sensors were placed between the third and fourth metacarpals to measure the pressure differential between the palmar and dorsal surfaces. This location is assumed as being a good proxy for the application point of propulsion vector on the hand (Gourgoulis et al., 2013). The application of additional sensors on each hand was avoided as it can affect technique, due to cabling surrounding the upper limb. Additional sensors may change the geometry and volume of the hand, impacting the ecological validity of the propulsion data. At the beginning of each performance trial, swimmers were asked to keep their hands immersed at a depth of 0.50 m for 10 s to calibrate the system. The pressure sensor data were transferred to the Aquanex software (Aquanex v. 4.2 C1211, Richmond, United States) by an A/D converter (Morais et al., 2020b). Afterwards, time-force series were imported into a signal processing software (AcqKnowledge v. 3.9.0, Biopac Systems, Santa Barbara, United States). Signals were again handled using a Butterworth fourth order low-pass filter (cut-off: 5 Hz). For each dominant and non-dominant in-water phase of the stroke cycle, the mean propulsion (Fmean_dominant and Fmean_non-dominant, in N) and peak force (Fpeak_dominant and Fpeak_non-dominant, in N) were determined. Afterwards, the Fmean_stroke cycle (the mean force produced in one full stroke cycle, in N) was calculated. The intra-cyclic variation of the propulsion of each upper limb (dFdominant and dFnon-dominant, in %) was computed based on equation 3. Then, the mean across both upper limbs was calculated (dFmean_stroke cycle, in %).
Statistical Analysis
Initially, the Kolmogorov-Smirnov and the Levene tests were used to assess normality and homoscedasticity, respectively. Descriptive statistics means and one standard deviation (±1SD) were calculated. Exploratory associations between SL and SF on swimming velocity were explored using the two-way ANOVA (independent for males and females) (p < 0.05). Swimming velocity was entered as the dependent variable with both SL and SF categorized (rounded) as independent variables (males: 13 categories for SL and 4 for SF; females: 8 categories for SL and 3 for SF). “Rounding” consists of converting continuous variables (in this case SF and SL) into categories. Later, a similar analysis was performed on the propulsion to verify which values corresponded to a given swimming velocity rounded by SL and SF. For both swimming velocity and propulsion non-estimable means were not considered. Thus, only the combinations observed for both males and females were analyzed. Eta square (η2) was used as an effect size index and interpreted as: 1) without effect if 0 < η2 ≤ 0.04; 2) minimum if 0.04 < η2 ≤ 0.25; 3) moderate if 0.25 < η2 ≤ 0.64 and; 4) strong if η2 > 0.64 (Ferguson, 2009).
To calculate the swimming velocity, multilevel modeling was used. Swimming velocity was defined as the dependent variable. The remaining anthropometric, kinematic (except SF and SL), and kinetic variables were defined as independent or predictor variables (p < 0.05). The analysis was performed using the MLwiN multilevel modeling software (Bristol, United Kingdom). Multilevel modeling is an extension of ordinary multiple regression in which data have a hierarchical or clustered structure. The hierarchy consists of units or measurements grouped at different levels. In the current study, it is assumed that the swimmers are a random sample, representing the level 2 units, and the swimmers’ repeated measurements (three consecutive stroke cycles), the level 1 units (Morais et al., 2020a). The 95% confidence intervals (95CI) were computed. A multicollinearity phenomenon was not detected since the independent variables were all computed independently from the dependent one. Differential calculus was used to estimate the point at which the dependent variables peaked when a significant quadratic association was identified (i.e., H and Fmean_dominant) (Alcock, 2016).
Results
Table 1 presents the descriptive statistics (mean ± 1SD) for all measured variables. Males presented higher anthropometrics and larger kinematics and kinetics than their female counterparts (Table 1).
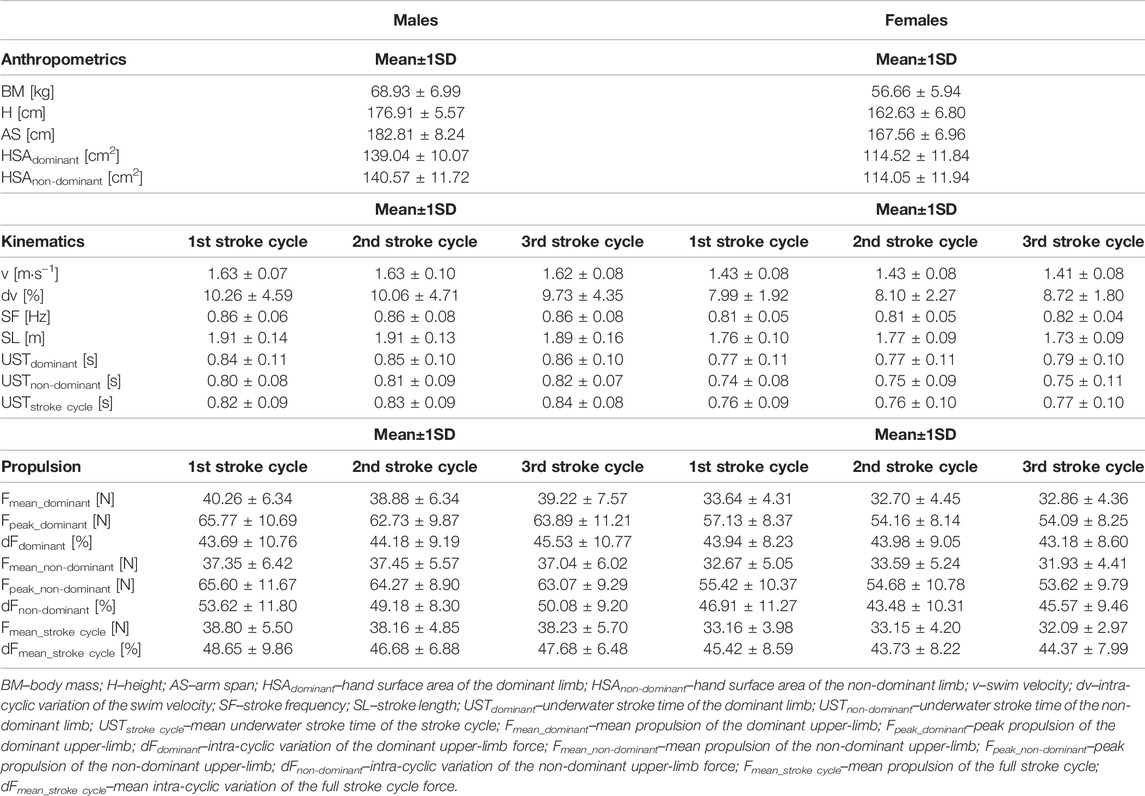
TABLE 1. Descriptive data for all the variables assessed by sex. In-water variables include the data from the three stroke cycles measured.
The results of the multilevel regression analysis that predict swimming velocity are reported in Table 2. A significant sex effect was verified (estimate = 0.2003, 95CI: 0.1309 to 0.2697, p < 0.001) (Table 2). The USTdominant was the independent variable that presented the highest effect (estimate = -0.1787, 95CI: 0.3504 to -0.0070, p = 0.0207). Differential calculus showed that the optimal value for the Fmean_dominant was 34.75 N and for the H was 174.67 cm. From those values onwards the swimming velocity decreased.
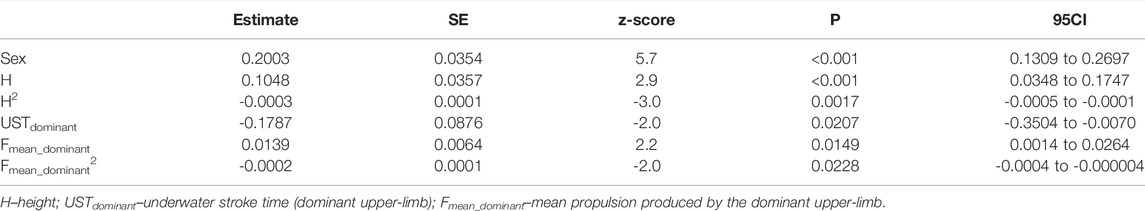
TABLE 2. Fixed effects of the final swimming velocity model computed with standard errors (SE), 95% confidence intervals (95CI), test-score (z-score), and significance value (p).
Table 3 shows the swimming velocity and propulsion categorization by SL round, SF round, and its interaction. Regarding swimming velocity for both sexes, SL (males: F = 8.20, p < 0.001, η2 = 0.40; females: F = 18.23, p < 0.001, η2 = 0.39) and SF (males: F = 38.20, p < 0.001, η2 = 0.47; females: F = 83.04, p < 0.001, η2 = 0.51) presented significant effects. The interaction between SL and SF was significant for females (F = 8.00, p = 0.001, η2 = 0.05), but not for males (F = 1.60, p = 0.172, η2 = 0.04). Regarding the propulsion for both sexes, the same trend was verified in SL (males: F = 2.54, p = 0.013, η2 = 0.32; females: F = 3.07, p < 0.012, η2 = 0.34), but not in SF (males: F = 1.91, p = 0.144, η2 = 0.06; females: F = 0.78, p = 0.466, η2 = 0.02). The interaction between SL and SF was non-significant for both sexes (males: F = 0.77, p = 0.601, η2 = 0.05; females: F = 1.48, p = 0.242, η2 = 0.05) (Table 3).
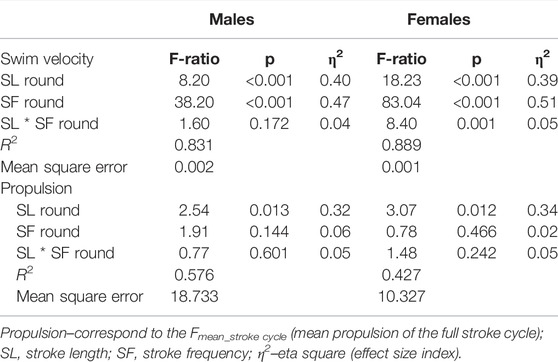
TABLE 3. Male and female two-way ANOVAs considering swimming velocity and propulsion by SL round, SF round, and their interaction (see Figure 1).
Figure 1 depicts the swimming velocity categorized by SL and SF (Panel A–males; Panel B–females). In males (Figure 1–panel A) the SF–SL combination corresponding to the fastest swimming velocity suggested a SF of 0.80 Hz and a SL of 2.20 m (swimming velocity: 1.75 m s−1). For females (Figure 1–panel B), the SF–SL combination indicated a SF of 0.80 Hz and a SL of 1.90 m (swimming velocity: 1.56 m s−1). Figure 1 also depicts the propulsion categorized by SL and SF (Panel C–males; Panel D–females). The highest propulsion in males (44.28 N) was observed with a combination of 0.90 Hz (SF) and 1.75 m (SL), and in females (42.94 N) by combining a SF of 0.80 Hz with a SL of 1.95 m. Considering the swimming velocity against SL, and taking into account the propulsion delivered at each SF (Panel E–males; Panel F–females), it is possible to observe that the SF–SL combination to achieve the fastest velocity was not the one providing the highest propulsion (Figure 1).
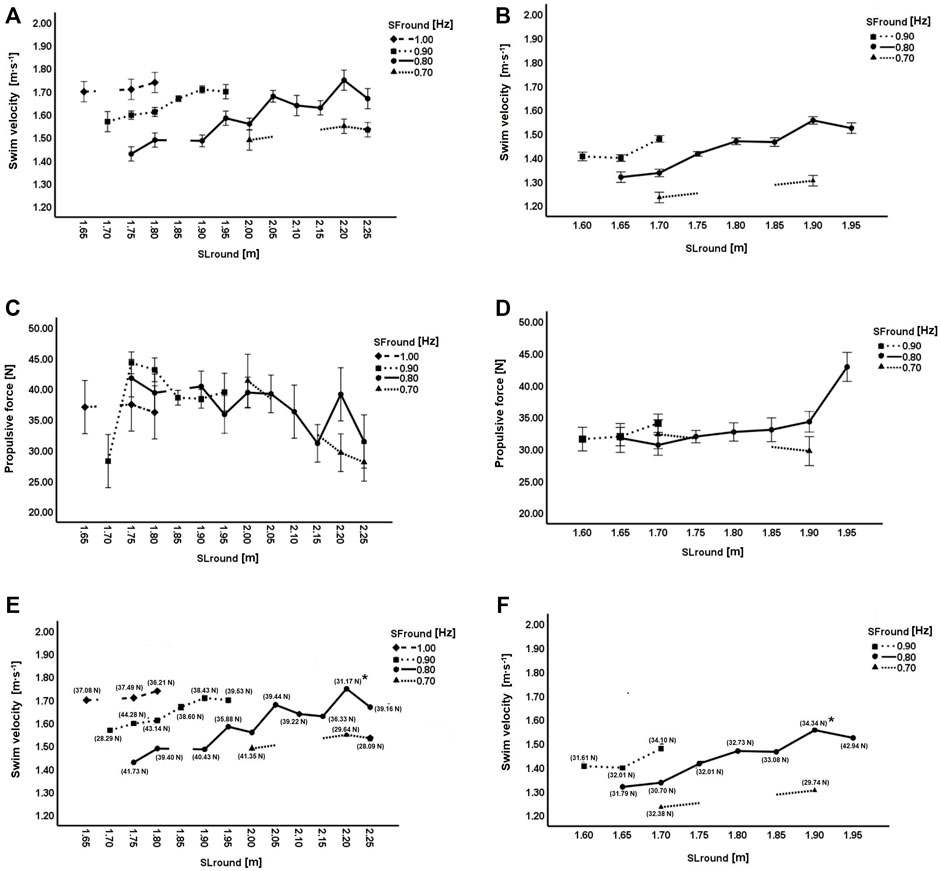
FIGURE 1. Swimming velocity rounded by SF and SL: Panel (A) males; Panel (B) females. Propulsion rounded by SF and SL: Panel (C) males; Panel (D) females. Swim velocity rounded by SF and SL, with correspondent propulsion (Fmean_stroke cycle) in each SL–SF combination: Panel (E) males; Panel (F) females. * - Panel (E): highest swimming velocity achieved by male swimmers (1.75 m s−1); Panel (F): highest swimming velocity achieved by female swimmers (1.56 m s−1). Error bars represent one standard deviation.
Discussion
The aim of this study was to predict swimming velocity based on a set of anthropometric, kinematic, and kinetic variables, and understand the SF–SL combinations associated with swimming velocity and propulsion in young sprint swimmers. The main findings are that swimming velocity model produced a significant sex effect (being males fastest than females) and retained as predictors the anthropometrics (H), kinematics (USTdominant), and kinetics (Fmean_dominant). The fastest swimming velocity for both sexes was not achieved either at the highest SF or SL. Moreover, the highest propulsion was not responsible for delivering the fastest swimming velocity.
Swimming velocity retained as significant predictors sex, H, H2, USTdominant, Fmean_dominant, and Fmean_dominant2. Since the sample included post-pubertal swimmers (males: 15.92 ± 0.75 years-old; females: 14.99 ± 1.06 years-old) a sex effect was expected. Thus, unsurprisingly, males were faster than females. Height was the best predictor retained by the model. The literature demonstrates that the fastest swimmers are taller and have a wider arm span and larger body dimensions in relation to the upper body (Nevill et al., 2015; Figueiredo et al., 2016). The USTdominant and the Fmean_dominant (kinematics and kinetics, respectively) were also retained. The USTdominant had a negative relationship with swimming velocity (i.e., less time performing the in-water phase of the stroke cycle led to a faster velocity), whereas a larger Fmean_dominant led to a faster velocity. Imbalances in the swimming velocity achieved by each upper limb were observed at these ages and competitive levels (Morais et al., 2020a). The motion performed by the dominant limb allowed the swimmers to reach faster velocities, taking less time to perform the in-water phase of the stroke cycle (UST) and producing more propulsion (Morais et al., 2020a). Moreover, it has been shown that when under task constraint, as the SF increases, the UST becomes shorter, leading to the production of more propulsion and thus speeding up (Cohen et al., 2018). It was shown that even during all-out bouts (i.e., maximum velocity), both upper limbs have different partial contributions to swimming velocity (Morais et al., 2020a). That said, the dominant upper limb plays a key role in the swimming velocity achieved.
Besides H and Fmean_dominant, H2 and Fmean_dominant2 were also retained by the model. This showed that swimming velocity increased with H and Fmean_dominant, but only up to a given extend. In this particular set of participants, the maximum velocity was achieved if H = 174.67 cm and if Fmean_dominant = 34.75 N. Literature clearly acknowledges the positive relationship between height and the upper limbs length for general population (Fairbanks and Fairbanks, 2005), and swimmers in particular (Kjendlie and Stallman, 2011). A study that focused on the importance of anthropometry in swimming velocity observed that the advantage of longer upper limbs could potentially be mechanically disadvantageous in some respects, as it requires muscles to apply greater force (Nevill et al., 2015). Having longer upper limbs can only be seen as an advantage if a concomitant increase in strength in the upper limbs happens. The Fmean_dominant peaked at 34.75 N. From this force magnitude onwards, swimming velocity decreased. Swimming velocity is characterized by a periodically accelerated motion based on the net balance between thrust (i.e., propulsion) and drag forces acting on the swimmer’s body (Barbosa et al., 2010). That is, during swimming, accelerations and deaccelerations of the swimmer’s body occur, leading to changes in velocity (known as intra-cyclic variation of the swim velocity) (Barbosa et al., 2010). Thus, swimmers can achieve faster swimming velocities when they are able to generate propulsion while reducing drag force (resistance to forward motion) (Toussaint and Beek, 1992). However, to generate higher propulsion, swimmers may suffer misalignments along their longitudinal axis which can lead to a larger frontal surface area and consequently to a higher drag (Morais et al., 2020c). Thus, despite generating higher propulsion they can be under a higher drag immediately after which will promote a decrease in their swimming velocity. Moreover, the amount of fluid that is accelerated during propulsion depends on the shape of the body and the pattern of the water flow around the body. Therefore, a heavier swimmer needs to apply a higher propulsion just to overcome inertia and dislocate added mass (Caspersen et al., 2010). This enhances the meaningful relationship between propulsion and the swimmers’ anthropometric features. Another reason can be related to the pitching and sweepback angles of the hand. Numerical studies reported that such angles have a meaningful effect on the propulsion generated by the swimmer’s hands (Bilinauskaite et al., 2013; Cohen et al., 2020). There may be specific moments of the in-water phase of the stroke cycle in which the propulsion vector is not oriented in the opposite direction of the displacement, as noted previously. In our study, swimmers were asked to perform all-out trials at maximum velocity without any constraint in their stroke mechanics. Therefore, it can be argued that greater propulsion does not always lead to faster swimming performances. This is depicted in Figure 1 (Panel E–males; Panel F–females) in which swimming velocity was analyzed against SL and considered the propulsion delivered at each SF. As such, coaches must be advised to this phenomenon to better understand that it is not “enough” to increase propulsion if swimmers do not adopt an ideal hydrodynamic profile and consequently decrease drag.
In adult/elite (Seifert et al., 2007), and youth swimming (Silva et al., 2019) it has been shown that the fastest swimmers (males and females) were characterized by a faster velocity, higher SF and longer SL compared to their slower counterparts. Moreover, the literature reports considerable insights on the practice of monitoring SF, noting the potential to determine submaximal swimming velocities above which SL will begin to drop (Barden and Kell, 2009; Koga et al., 2020). However, scarce information can be found on the combinations between the two main variables of stroke mechanics (i.e., SF and SL) that are responsible for swimming velocity in both adult/elite and young swimmers. A study by Craig and Pendergast (1979) observed an “optimal” SF–SL combination in adult/elite sprint swimmers, suggesting this to be adopted in competition. For young swimmers, our data revealed a significant effect of SL and SF for both sexes when adopting velocity as the dependent variable (SL and SF were rounded as the independent or predictor variables). Studies have reported that increases in swimming velocity in both sexes are associated with faster SF (Seifert et al., 2007; Morris et al., 2016). The improvement of SF can happen in a relatively short period of time within a training program (Girold et al., 2006). Bio-feedback training programs have been reported to be conducive to such improvements (Hermann et al., 2012). On the other hand, increasing swimming velocity based on a longer SL requires a higher training period, despite promoting energy savings (Wakayoshi et al., 1993; Barbosa et al., 2008).
Overall, there are interactions between SF–SL and swimming velocity. Figure 1 suggests that swimming velocity tends to increase with greater SL and SF, even though more evidently in females. It should be noted that the fastest swimming velocity was not achieved at the fastest SF nor at the longest SL. The fastest velocity was achieved at an “optimal” SF–SL combination. Indeed, previous research has suggested that attempts should be made to determine at what velocity and to what extend SL and SF change (Dekerle, 2006). A study by Koga et al. (2020) reported the effect of exceeding the SF at maximum swimming velocity. Swimmers were instructed to perform a SF faster than the one delivered at maximum velocity. The authors observed that swimming velocity did not significantly increase when the SF exceeded the SF at maximum velocity. However, a significant decrease in SL was noted whenever a faster SF was performed (Koga et al., 2020). Notwithstanding, our data based on a categorized SL and SF as the independent or predictor variables revealed that this relationship is not always negative (i.e., whenever SF increases, the SL decreases, and vice-versa). Rather than a clear inverse relationship, a sinusoidal profile was observed between SF and SL. That is, several SF–SL combinations can be observed. It was argued that maximum swimming velocity could not be achieved during long stroke cycles (i.e., slower SF), and that each swimmer should choose the “optimal” SF to increase his/her swimming velocity (Nakashima and Ono, 2014). The same authors reported that maximum joint torque by the upper limbs was responsible for a longer SL at the same SF. This suggests that kinetics (i.e., propulsion) might play a key role in the SF–SL relationship.
In adult/elite swimmers (Tsunokawa et al., 2019) and young swimmers (Morais et al., 2020a) it has been observed a positive association between propulsion and swimming velocity. The increase in propulsion led to an increase in swimming velocity. However, when rounding SL and SF by propulsion, a significant effect was noted in both sexes for SL. It was demonstrated that specific technique instructions allowed an increase in swimming velocity and SL with an increase in propulsion (Havriluk, 2009). However, a non-significant effect was verified on SF and on the SL-SF interaction. Indeed, the fastest swimming velocity was not achieved by the highest propulsion when rounding by SL–SF. The literature about propulsion in swimming reports that the in-water force produced by the swimmer is not always in the direction of the body’s center of mass displacement (Bilinauskaite et al., 2013; Soh and Sanders, 2021). In this case, the increase in the magnitude of the propulsion does not produce an increase in swimming velocity (Havriluk, 2009). On the other hand, it has been shown that faster SF promoted increases in propulsion and, consequently, in swimming velocity (Cohen et al., 2018). The latter study conducted a numerical simulation based on a scan of a female swimmer. The upper limbs’ motion was the same in all strokes and optimized conditions (e.g., hands’ orientation). Even though numerical simulations provide insightful information, they do not allow us to understand how different constraints can impose significant variability in motor behavior. The SF exceeding the SF at maximum velocity was shown to reduce the propulsion of the hand during the push phase, caused by the decrease in the angle of attack (Koga et al., 2020). If sprinters are instructed to perform at a very fast SF, this can result in rushing the catch phase and producing less force or a poorly space-oriented vector force. Moreover, faster SF’s are promoted by an increase in hand velocity, which could be related to more propulsion by the hand but also a reduction in the propulsion duration (i.e., impulse). It is also influenced by the ability of the swimmer to generate propulsion. If the swimmer is not “strong” enough, he/she can change the movement pattern to find less resistance in the hand, and consequently reducing the propulsion. Thus, the effective propulsion (force in the direction of the displacement) is diminished.
Overall, swimming velocity prediction retained a significant sex effect, and was determined by anthropometric, kinematic, and kinetic variables. Even though, H and Fmean_dominant presented a positive and significant effect, it was shown that swimming velocity started to decrease after reaching a given H and Fmean_dominant. Coaches should be aware that longer leverages can only be an advantage if swimmers are able to produce an amount of strength that can be transferred to water (i.e., propulsion). Moreover, generating higher propulsion may not present the desired effect (i.e., fastest swimming velocity). If swimmers do not maintain a streamlined position by avoiding longitudinal misalignments, this may increase their frontal surface area and consequently drag. It was shown that maximum swimming velocity was not achieved at the highest SF or longest SL. Rather, it was achieved by an “optimal” SF–SL combination. The fastest velocity was not achieved at the highest propulsion. This may be related to the pitching and sweepback angles of the hand, which during the entire in-water phase of the stroke cycle may not be properly oriented in the opposite direction of the swimmer’s displacement. Thus, despite exerting higher amount of propulsion, it may not be mechanically advantageous if not well oriented. One must be aware that an increase in propulsion by itself may not directly lead to an increase in swimming velocity. As such, age-group coaches, and swimmers, rather than focusing exclusively on increasing SF, should find the “optimal” SF–SL combination. They must also pay attention to the swimmer’s hand orientation.
As main limitations, it can be considered that: 1) the SF–SL combinations reported in this study are only representative of the stroke mechanics of age-group sprinters without breathing actions; 2) the restrictive number of swimmers and stroke cycles included in the study, that may affect the results in an objective of generalization to a race or training performed in a 50 m swimming pool; 3) only the propulsion of the upper limbs was measured (nonetheless it accounts 90% of the total swimming velocity), and; 4) other variables than force may testify from the kinetics of the swimming motion, for instance impulse. One can suggest that future studies: 1) assess the role of propulsion in the SF–SL combination in different age-groups; 2) assess the role of propulsion in the SF–SL combination at different race paces or incremental tests, and; 3) include the kinematics of the hand to have insight on the amount of propulsion oriented in the direction of the displacement. Hand kinematics will allow us to obtain information about the amount of effective propulsion and swimming efficiency.
Conclusion
It can be concluded that swimming velocity was predicted by an interplay of variables related to anthropometry, kinematics, and kinetics. Swimming velocity increases up to a given H and Fmean_dominant. Upon that, anthropometric features can only play a positive and significant role on swimming velocity if swimmer’s also increase in muscle strength. Higher propulsion also plays a key-role on swimming velocity but if well orientated. Moreover, in age-group sprinters of both sexes, the fastest swimming velocity was not achieved with the fastest SF nor with the shortest SL. The fastest velocity was achieved by an “optimal” SF–SL combination. Likewise, the fastest velocity was not reached while delivering the highest propulsion. Thus, coaches must be aware that an increase by the SF may not promote a velocity increase. Same rational for the propulsion. A substantial focus must be put in the SF–SL combinations, to understand which one delivers better performance in an individual way.
Data Availability Statement
The original contributions presented in the study are included in the article/Supplementary Material, further inquiries can be directed to the corresponding author.
Ethics Statement
The studies involving human participants were reviewed and approved by University of Beira Interior Review Board. Written informed consent to participate in this study was provided by the participants’ legal guardian/next of kin.
Author Contributions
JM, TB, and DM conceived and designed the study. JM and AN performed the data analysis. JM, TB, SC and DM carried out the drafting of the manuscript. All authors reviewed the manuscript and approved the submitted version.
Funding
This work is supported by national funds (FCT -Portuguese Foundation for Science and Technology) under the project UIBD/DTP/04045/2020.
Conflict of Interest
The authors declare that the research was conducted in the absence of any commercial or financial relationships that could be construed as a potential conflict of interest.
The reviewer MCM declared a shared affiliation with the author DM to the handling editor at the time of review.
Publisher’s Note
All claims expressed in this article are solely those of the authors and do not necessarily represent those of their affiliated organizations, or those of the publisher, the editors and the reviewers. Any product that may be evaluated in this article, or claim that may be made by its manufacturer, is not guaranteed or endorsed by the publisher.
References
Abbes Z., Chamari K., Mujika I., Tabben M., Bibi K. W., Hussein A. M., et al. (2018). Do Thirty-Second Post-Activation Potentiation Exercises Improve the 50-m Freestyle Sprint Performance in Adolescent Swimmers? Front. Physiol. 9, 1464. doi:10.3389/fphys.2018.01464
Alberty M. R., Potdevin F. P., Dekerle J., Pelayo P. P., Sidney M. C. (2011). Effect of Stroke Rate Reduction on Swimming Technique during Paced Exercise. J. Strength. Cond. Res. 25 (2), 392–397. doi:10.1519/jsc.0b013e3181b94a51
Barbosa T. M., Yam J. W., Lum D., Balasekaran G., Marinho D. A. (2020). Arm-Pull Thrust in Human Swimming and the Effect of Post-Activation Potentiation. Sci. Rep. 10 (1), 8464. doi:10.1038/s41598-020-65494-z
Barbosa T. M., Bartolomeu R., Morais J. E., Costa M. J. (2019). Skillful Swimming in Age-Groups Is Determined by Anthropometrics, Biomechanics and Energetics. Front. Physiol. 10, 73. doi:10.3389/fphys.2019.00073
Barbosa T. M., Bragada J. A., Reis V. M., Marinho D. A., Carvalho C., Silva A. J. (2010). Energetics and Biomechanics as Determining Factors of Swimming Performance: Updating the State of the Art. J. Sci. Med. Sport 13 (2), 262–269. doi:10.1016/j.jsams.2009.01.003
Barbosa T. M., Costa M. J., Morais J. E., Jesus S., Silva A. J., Batista J., et al. (2011). Validation with Videometry of an Integrated System to Assess Horizontal Intra-Cyclic Velocity with a Mechanical Speedo-Meter. Port. J. Sport Sci., 833–835.
Barbosa T. M., Fernandes R. J., Keskinen K. L., Vilas-Boas J. P. (2008). The Influence of Stroke Mechanics into Energy Cost of Elite Swimmers. Eur. J. Appl. Physiol. 103 (2), 139–149. doi:10.1007/s00421-008-0676-z
Barden J. M., Kell R. T. (2009). Relationships between Stroke Parameters and Critical Swimming Speed in a Sprint Interval Training Set. J. Sports Sci. 27 (3), 227–235. doi:10.1080/02640410802475205
Bilinauskaite M., Mantha V. R., Rouboa A. I., Ziliukas P., Silva A. J. (2013). Computational Fluid Dynamics Study of Swimmer's Hand Velocity, Orientation, and Shape: Contributions to Hydrodynamics. Biomed. Res. Int. 2013, 140487. doi:10.1155/2013/140487
Caspersen C., Berthelsen P. A., Eik M., Pâkozdi C., Kjendlie P.-L. (2010). Added Mass in Human Swimmers: Age and Gender Differences. J. Biomech. 43 (12), 2369–2373. doi:10.1016/j.jbiomech.2010.04.022
Cohen R. C. Z., Cleary P. W., Mason B. R., Pease D. L. (2018). Forces during Front Crawl Swimming at Different Stroke Rates. Sports Eng. 21 (1), 63–73. doi:10.1007/s12283-017-0246-x
Cohen R. C. Z., Cleary P. W., Mason B. R., Pease D. L. (2020). Studying the Effects of Asymmetry on Freestyle Swimming Using Smoothed Particle Hydrodynamics. Comput. Methods Biomech. Biomed. Engin. 23 (7), 271–284. doi:10.1080/10255842.2020.1718663
Craig A. B., Pendergast D. R. (1979). Relationships of Stroke Rate, Distance Per Stroke, and Velocity in Competitive Swimming. Med. Sci. Sports 11 (3), 278–283. doi:10.1249/00005768-197901130-00011
Craig A. B., Skehan P. L., Pawelczyk J. A., Boomer W. L. (1985). Velocity, Stroke Rate, and Distance Per Stroke during Elite Swimming Competition. Med. Sci. Sports Exerc. 17 (6), 625–634. doi:10.1249/00005768-198512000-00001
Dekerle J., Nesi X., Lefevre T., Depretz S., Sidney M., Marchand F. H., et al. (2005). Stroking Parameters in Front Crawl Swimming and Maximal Lactate Steady State Speed. Int. J. Sports Med. 26 (01), 53–58. doi:10.1055/s-2004-817854
Dekerle J. (2006). The Use of Critical Velocity in Swimming. A Place for Critical Stroke Rate. Port. J. Sport Sci. 6 (Suppl. 2), 201–205.
Deschodt V. J., Arsac L. M., Rouard A. H. (1999). Relative Contribution of Arms and Legs in Humans to Propulsion in 25-m Sprint Front-Crawl Swimming. Eur. J. Appl. Physiol. Occup. Physiol. 80 (3), 192–199. doi:10.1007/s004210050581
Dormehl S., Osborough C. (2015). Effect of Age, Sex, and Race Distance on Front Crawl Stroke Parameters in Subelite Adolescent Swimmers during Competition. Pediatr. Exerc. Sci. 27 (3), 334–344. doi:10.1123/pes.2014-0114
Fairbanks A. T., Fairbanks E. F. (2005). Human Proportions for Artists. Salt Lake City, Utah. Fairbanks Art and Books.
Ferguson C. J. (2009). An Effect Size Primer: A Guide for Clinicians and Researchers. Prof. Psychol. Res. Pract. 40 (5), 532–538. doi:10.1037/a0015808
Figueiredo P., Silva A., Sampaio A., Vilas-Boas J. P., Fernandes R. J. (2016). Front Crawl Sprint Performance: A Cluster Analysis of Biomechanics, Energetics, Coordinative, and Anthropometric Determinants in Young Swimmers. Mot. Control. 20 (3), 209–221. doi:10.1123/mc.2014-0050
Girold S., Calmels P., Maurin D., Milhau N., Chatard J.-C. (2006). Assisted and Resisted Sprint Training in Swimming. J. Strength. Cond. Res. 20 (3), 547–554. doi:10.1519/r-16754.1
Girold S., Jalab C., Bernard O., Carette P., Kemoun G., Dugué B. (2012). Dry-land Strength Training vs. Electrical Stimulation in Sprint Swimming Performance. J. Strength. Cond. Res. 26 (2), 497–505. doi:10.1519/jsc.0b013e318220e6e4
Gourgoulis V., Aggeloussis N., Mavridis G., Boli A., Kasimatis P., Vezos N., et al. (2013). Acute Effect of Front Crawl Sprint Resisted Swimming on the Propulsive Forces of the Hand. J. Appl. Biomech. 29 (1), 98–104. doi:10.1123/jab.29.1.98
Havriluk R. (2009). Analyzing Hand Force in Swimming, Three Typical Limiting Factors. ASCA. Newsl. 5, 22–26.
Havriluk R. (2013). Seasonal Variations in Swimming Force and Training Adaptation. J. Swim. Res. 21 (1), 8.
Havriluk R. (1988). Validation of a Criterion Measure for Swimming Technique. J. Swim. Res. 4 (4), 11–16.
Hellard P., Dekerle J., Avalos M., Caudal N., Knopp M., Hausswirth C. (2008). Kinematic Measures and Stroke Rate Variability in Elite Female 200-m Swimmers in the Four Swimming Techniques: Athens 2004 Olympic Semi-finalists and French National 2004 Championship Semi-finalists. J. Sports Sci. 26 (1), 35–46. doi:10.1080/02640410701332515
Hermann T., Ungerechts B., Toussaint H., Grote M. (2012). “Sonification of Pressure Changes in Swimming for Analysis and Optimization,” in Proceedings of the 18th International Conference on Auditory Display, Atlanta, GA, United States, June 18–21, 2012. Editors M. A. Nees, B. N. Walker, and J. Freeman (Atlanta, USA: International Conference), 60–67.
Kjendlie P. L., Stallman R. (2011). “Morphology and Swimming Performance,” in World Book of Swimming. From Science to Performance. Editors L. Seifert, and D. Chollet (New York: Nova Science Publishers), 203–222.
Koga D., Gonjo T., Kawai E., Tsunokawa T., Sakai S., Sengoku Y., et al. (2020). Effects of Exceeding Stroke Frequency of Maximal Effort on Hand Kinematics and Hand Propulsive Force in Front Crawl. Sports Biomech., 1–13. [Epub ahead of print]. doi:10.1080/14763141.2020.1814852
Komar J., Leprêtre P. M., Alberty M., Vantorre J., Fernandes R. J., Hellard P., et al. (2012). Effect of Increasing Energy Cost on Arm Coordination in Elite Sprint Swimmers. Hum. Mov. Sci. 31 (3), 620–629. doi:10.1016/j.humov.2011.07.011
McKay A. K. A., Stellingwerff T., Smith E. S., Martin D. T., Mujika I., Goosey-Tolfrey V. L., et al. (2022). Defining Training and Performance Caliber: A Participant Classification Framework. Int. J. Sports Physiol. Perform. 17 (2), 317–331. doi:10.1123/ijspp.2021-0451
Morais J. E., Barbosa T. M., Forte P., Silva A. J., Marinho D. A. (2021). Young Swimmers' Anthropometrics, Biomechanics, Energetics, and Efficiency as Underlying Performance Factors: A Systematic Narrative Review. Front. Physiol. 12, 691919. doi:10.3389/fphys.2021.691919
Morais J. E., Barbosa T. M., Silva A. J., Veiga S., Marinho D. A. (2022). Profiling of Elite Male Junior 50 M Freestyle Sprinters: Understanding the Speed‐Time Relationship. Scand. J. Med. Sci. Sports 32 (1), 60–68. doi:10.1111/sms.14058
Morais J. E., Forte P., Nevill A. M., Barbosa T. M., Marinho D. A. (2020a). Upper-Limb Kinematics and Kinetics Imbalances in the Determinants of Front-Crawl Swimming at Maximal Speed in Young International Level Swimmers. Sci. Rep. 10 (1), 11683. doi:10.1038/s41598-020-68581-3
Morais J. E., Jesus S., Lopes V., Garrido N., Silva A., Marinho D., et al. (2012). Linking Selected Kinematic, Anthropometric and Hydrodynamic Variables to Young Swimmer Performance. Pediatr. Exerc. Sci. 24 (4), 649–664. doi:10.1123/pes.24.4.649
Morais J. E., Marques M. C., Rodríguez-Rosell D., Barbosa T. M., Marinho D. A. (2020b). Relationship between Thrust, Anthropometrics, and Dry-Land Strength in a National Junior Swimming Team. Phys. Sportsmed. 48 (3), 304–311. doi:10.1080/00913847.2019.1693240
Morais J. E., Sanders R. H., Papic C., Barbosa T. M., Marinho D. A. (2020c). The Influence of the Frontal Surface Area and Swim Velocity Variation in Front Crawl Active Drag. Med. Sci. Sports Exerc. 52 (11), 2357–2364. doi:10.1249/mss.0000000000002400
Morris K. S., Osborne M. A., Shephard M. E., Skinner T. L., Jenkins D. G. (2016). Velocity, Aerobic Power and Metabolic Cost of Whole Body and Arms Only Front Crawl Swimming at Various Stroke Rates. Eur. J. Appl. Physiol. 116 (5), 1075–1085. doi:10.1007/s00421-016-3372-4
Nakashima M., Ono A. (2014). Maximum Joint Torque Dependency of the Crawl Swimming with Optimized Arm Stroke. J. Biomech. Sci. Engin. 9 (1), JBSE0001. doi:10.1299/jbse.2014jbse0001
Nevill A. M., Negra Y., Myers T. D., Sammoud S., Chaabene H. (2020). Key Somatic Variables Associated with, and Differences between the 4 Swimming Strokes. J. Sports Sci. 38 (7), 787–794. doi:10.1080/02640414.2020.1734311
Nevill A. M., Oxford S. W., Duncan M. J. (2015). Optimal Body Size and Limb Length Ratios Associated with 100-m Personal-Best Swim Speeds. Med. Sci. Sports Exerc. 47 (8), 1714–1718. doi:10.1249/mss.0000000000000586
Oliveira M., Henrique R. S., Queiroz D. R., Salvina M., Melo W. V., Moura dos Santos M. A. (2021). Anthropometric Variables, Propulsive Force and Biological Maturation: A Mediation Analysis in Young Swimmers. Eur. J. Sport Sci. 21 (4), 507–514. doi:10.1080/17461391.2020.1754468
Psycharakis S. G., Cooke C. B., Paradisis G. P., O'Hara J., Phillips G. (2008). Analysis of Selected Kinematic and Physiological Performance Determinants during Incremental Testing in Elite Swimmers. J. Strength. Cond. Res. 22 (3), 951–957. doi:10.1519/jsc.0b013e31816a6364
Santos C. C., Marinho D. A., Neiva H. P., Costa M. J. (2021). Propulsive Forces in Human Competitive Swimming: A Systematic Review on Direct Assessment Methods: Propulsive Forces in Competitive Swimming. Sports Biomech., 1–21. [Epub ahead of print]. doi:10.1080/14763141.2021.1953574
Seifert L., Boulesteix L., Carter M., Chollet D. (2005). The Spatial-Temporal and Coordinative Structures in Elite Male 100-m Front Crawl Swimmers. Int. J. Sports Med. 26 (04), 286–293. doi:10.1055/s-2004-821010
Seifert L., Chollet D., Chatard J. C. (2007). Kinematic Changes during a 100-m Front Crawl: Effects of Performance Level and Gender. Med. Sci. Sports Exerc. 39 (10), 1784–1793. doi:10.1249/mss.0b013e3180f62f38
Seifert L., Leblanc H., Chollet D., Delignières D. (2010). Inter-Limb Coordination in Swimming: Effect of Speed and Skill Level. Hum. Mov. Sci. 29 (1), 103–113. doi:10.1016/j.humov.2009.05.003
Silva A. F., Figueiredo P., Ribeiro J., Alves F., Vilas-Boas J. P., Seifert L., et al. (2019). Integrated Analysis of Young Swimmers' Sprint Performance. Mot. Control. 23 (3), 354–364. doi:10.1123/mc.2018-0014
Simbaña-Escobar D., Hellard P., Seifert L. (2018). Modelling Stroking Parameters in Competitive Sprint Swimming: Understanding Inter-and Intra-lap Variability to Assess Pacing Management. Hum. Mov. Sci. 61, 219–230. doi:10.1016/j.humov.2018.08.002
Soh J., Sanders R. (2021). The Clues Are in the Flow: How Swim Propulsion Should Be Interpreted. Sports Biomech. 20 (7), 798–814. doi:10.1080/14763141.2019.1602162
Strzala M., Stanula A., Krezalek P., Ostrowski A., Kaca M., Glab G. (2019). Influence of Morphology and Strength on Front Crawl Swimming Speed in Junior and Youth Age-Group Swimmers. J. Strength. Cond. Res. 33 (10), 2836–2845. doi:10.1519/JSC.0000000000002084
Termin B., Pendergast D. R. (2000). Training Using the Stroke Frequency-Velocity Relationship to Combine Biomechanical and Metabolic Paradigms. J. Swim. Res. 14, 9–17.
Toussaint H. M., Beek P. J. (1992). Biomechanics of Competitive Front Crawl Swimming. Sports Med. 13 (01), 8–24. doi:10.2165/00007256-199213010-00002
Tsunokawa T., Mankyu H., Takagi H., Ogita F. (2019). The Effect of Using Paddles on Hand Propulsive Forces and Froude Efficiency in Arm-Stroke-Only Front-Crawl Swimming at Various Velocities. Hum. Mov Sci. 64, 378–388. doi:10.1016/j.humov.2019.03.007
Keywords: youth, swimming, technique, performance, stroke parameters
Citation: Morais JE, Barbosa TM, Nevill AM, Cobley S and Marinho DA (2022) Understanding the Role of Propulsion in the Prediction of Front-Crawl Swimming Velocity and in the Relationship Between Stroke Frequency and Stroke Length. Front. Physiol. 13:876838. doi: 10.3389/fphys.2022.876838
Received: 15 February 2022; Accepted: 12 April 2022;
Published: 27 April 2022.
Edited by:
Beat Knechtle, University of Zurich, SwitzerlandReviewed by:
Mário C. Marques, University of Beira Interior, PortugalPetros G Botonis, National and Kapodistrian University of Athens, Greece
Santiago Veiga, Universidad Politécnica de Madrid, Spain
Marek Rejman, Marek Rejman, Poland
Brice Guignard, Université de Rouen, France
Copyright © 2022 Morais, Barbosa, Nevill, Cobley and Marinho. This is an open-access article distributed under the terms of the Creative Commons Attribution License (CC BY). The use, distribution or reproduction in other forums is permitted, provided the original author(s) and the copyright owner(s) are credited and that the original publication in this journal is cited, in accordance with accepted academic practice. No use, distribution or reproduction is permitted which does not comply with these terms.
*Correspondence: Jorge E. Morais, morais.jorgestrela@gmail.com