 Sanja V. Mirković1
 Saša Đurić2
 Vedrana Sember3*Olivera M. Knezevic4Maja Pajek3Milan M. Mirković4Dragan M. Mirkov1
- 1University of Belgrade, Faculty of Sport and Physical Education, Belgrade, Serbia
- 2Liberal Arts Department—General Education, American University of the Middle East, Kuwait City, Kuwait
- 3Faculty of Sport, University of Ljubljana, Ljubljana, Slovenia
- 4University of Belgrade, Faculty of Medicine, Institute for Orthopaedic Surgery “Banjica”, Belgrade, Serbia
The main objective of present study was to evaluate inter-rater reliability and concurrent validity of Side Hop Test stopwatch vs. force plates timing, and to determine the number of sessions and trials required to minimize the effects of learning on Side Hop Test total time and limb symmetry index. Fifteen healthy male physical education students (mean ± SD: age, 23 ± 3 years; height, 181 ± 9 cm; and weight 72 ± 6 kg) participated. Side Hop Test total time (stopwatch and force plates) of left and right leg, and limb symmetry index (force plates) were obtained over seven sessions conducted 5–7 days apart. Time recordings of two raters were similar (t = −0.56, p > 0.05) with high reliability (all ICC >0.99 and CV% <0.1) and no systematic bias when compared to force plate data (p > 0.05; for rater 1 and 2, respectively). Total time improved across the Sessions (F = 25.87, p < 0.01, ω2 = 0.18) and Trials (F = 68.15, p < 0.01, ω2 = 0.10), with no significant interaction between factors. No between-leg differences were detected (F = 0.52, p > 0.05, ω2 = 0.001). Limb symmetry index ranged from 0.999 to 1.055 across all sessions and trials (all p > 0.05 and ω2 < 0.00). Due to low coefficient of correlation, high interclass correlation coefficient, and the lack in heteroscedasticity, stopwatch measurements are valid to measure total time in the Side Hop Test. Moreover, stopwatch measurements could be reliably used to measure total time in the Side Hop Test, while the test could be administrated with only one experienced rater. Unlike total times, findings on limb symmetry index suggest it could be reliably assessed after seven familiarization sessions.
Introduction
Functional asymmetries in the lower limbs are defined as a consistent task discrepancy between dominant and nondominant limbs (Sadeghi et al., 2000). They are determined by strength deficits between the two limbs (Fousekis et al., 2010) and are distinct from muscular imbalances, which represent a change in the force relationship between agonist and antagonist muscle pairs (Schlumberger et al., 2006; Jones and Bampouras, 2010). Functional asymmetries in the lower limbs have been the subject of numerous recent studies in many different contact, limited-contact and non-contact sports aimed at understanding the role of training in performance and in injury prevention (Lawson et al., 2006; Impellizzeri et al., 2007; Fousekis et al., 2010). Various classifications have been established for quantifying lower limb asymmetries including dominant opposed to non-dominant (Rouissi et al., 2016), stronger or weaker (Sato and Heise, 2012), left or right (Atkins et al., 2016), resulting in inconsistent methods for quantifying lower limb asymmetries with the exception of reporting these asymmetries as a percentage difference from one limb in respect to the other (Bishop et al., 2018). Thus, improving our understanding about the lower limb asymmetries might contribute to reducing the likelihood of getting injured (Croisier et al., 2008; Kiesel et al., 2014) and the related performance loss (Coratella et al., 2018; Maloney, 2019).
A functional performance test, classified as a performance-based measurement (Fitzgerald et al., 2001), is a useful measure in rehabilitation or condition assessment (Yoshida et al., 2011). One of the useful functional performance tests to assess lower limb function is the Side Hop Test (SHT), which can be used in both clinical and research settings in healthy and injured subjects (Kamonseki et al., 2018). In research settings, it has been mainly used to identify functional changes in patients with ankle instability (Martin et al., 2013; Scinicarelli et al., 2021; Wang et al., 2021) or after lower limb injuries (Ortiz et al., 2011).
Although the SHT is one of the most widely used functional test to assess ankle stability and has undergone the most research (Ortiz et al., 2005) in relation to lower limb functional performance (Gustavsson et al., 2006), there is still a lack of knowledge addressing the issue of the measurement characteristics of SHT. Stopwatches are up to date the most commonly used to measure the SHT performance (Docherty et al., 2005; Ortiz et al., 2005; Ortiz et al., 2011; Yoshida et al., 2011; Yoshida et al., 2018; Kamonseki et al., 2018), the measurement characteristics of mentioned test could be questionable. Alternative to stopwatch could be the contact matt which allows not only more reliable measures (Garcia-Lopez et al., 2005) but also the measurement of duration of every single phase of SHT, i.e., medial and lateral contact and “flight” times. To date, only six studies have investigated the reliability of SHT, four of which were conducted in adults (Caffrey et al., 2009; Wikstrom et al., 2009; Kockum and Heijne, 2015; Markström et al., 2018), one in young adult women (Ortiz et al., 2005), and one in children (Kamonseki et al., 2018). Markström with colleagues evaluated the within-session, test-retest reliability and agreement in trunk, hip, knee moments and ligament reconstructed persons and healthy-knee controls. They found excellent within-session reliability for angles in both groups (ICC >0.90) and excellent-to-good within-session reliability for moments (ICC >0.80), poor reliability for knee rotation (ICC <0.40) and excellent to fair test-retest reliability results for all angles and moments (ICC 0.47–0.91). Only Kockum and Heijne (2015) used a modified protocol that also assessed the number of repetitions for a given time, where all commonly used hop tests, including SHT, showed good to excellent intra-class correlation (0.84 < ICC >0.98), whereas Ortiz et al. (2005) applied inter-rater reliability measured with the stopwatch in a female population. The SHT showed good trial-to-trial and inter-rater reliability (ICC ≥0.87) but lower day-to-day reliability (ICC = 0.48), indicating consistency in a single session and inconsistency over time (Ortiz et al., 2005). However, the procedure they used had several limitations. All athletes were tested during the first week of training; therefore, training-related changes may have occurred. In addition, the authors (Ortiz et al., 2005) suggest re-measuring SHT with shorter time intervals between sessions to reduce the possibility of a learning effect. Moreover, Chan et al. (2020) established that for strength testing the number of familiarization sessions required for dominant and non-dominant limb required a similar number of sets (3). To our knowledge, none of the studies have examined the inter-rater reliability, concurrent validity, and number of familiarization sessions to minimize the learning effect of SHT in adult males.
Therefore, the main aim of the present study was to evaluate: 1) inter-rater reliability (two experienced raters) and concurrent validity [stopwatch SHT total time (TT) measurements, compared to TT derived from force plate measurements]; 2) determination of the number of familiarization sessions and trials required to minimize the effects of learning on SHT TT and limb symmetry index (LSI). We believe that our methodologically improved study will confirm the assumptions made in previous studies that stopwatch measurements could be a valid and reliable measure of both TT and LSI index. In addition, we hypothesized that although the complexity of the task in the side hop test would result in prolonged familiarization through multiple sessions and trials, the derived limb symmetry index would be stable across sessions and trials.
Materials and Methods
Participants
A sample of 15 male subjects (mean ± SD: age, 23 ± 3 years; height, 181 ± 9 cm; and weight 72 ± 6 kg) were physical education students. They were active during their normal academic curriculum, which included six to eight activity classes per week, with both low- and high-intensity exercises that did not include strenuous lower-body and leg exercises. They were excluded from the study if they were active athletes, had chronic medical conditions, cardiac problems, mechanical instability of the ankle joint, a history of orthopaedic surgery, a fracture of a lower extremity, or a history of an ankle sprain within 6 months. Lower limb dominance was determined as the side of preference to kick a ball (Seeley et al., 2008; Kamonseki et al., 2016). Subjects were instructed to avoid any strenuous exercise during the study. They were informed of potential risks and the purpose of the study and signed a written informed consent form that was in accordance with the Declaration of Helsinki and was approved by Institutional Review Board (02 No. 1307-2).
Testing Procedure
The main task was to perform the side-hop test, which was performed as described earlier (Itoh et al., 1998) but with some modifications. The definition of the side-hop test was also similar to previous studies (Itoh et al., 1998; Demeritt et al., 2002; Gustavsson et al., 2006). The subject stood on the test leg and then jumped from side to side as quickly as possible between two parallel lines 30 cm apart, a total of 28 times or 14 cycles. A cycle is when the participant jumps laterally and medially back to the starting position. The first session was performed with the right leg and the first jump was always performed to the lateral side. The participants performed the side-hop test wearing athletic shoes.
Experimental Protocol
Each participant completed seven sessions separated by a rest period of at least 5–7 days. The first three sessions were familiarization sessions and were measured with stopwatches only (SW; see Figure 1 for illustration). Two experienced researchers simultaneously measured the TT of the test. Each session was preceded by a standard warm-up procedure (5 min of cycling and 5 min of callisthenic and dynamic stretching). Prior to data collection, participants were instructed on how to perform the side-hop test and were allowed to practice the test twice (once with each leg). The trial was recorded as successful if subjects were able to complete the 28-jump repetitions, stepping on the line or having their untested leg touching the floor less than 3 times. Each subject made four trials with the right leg and four trials with the left leg, and if there were unsuccessful trials, the tests were cancelled and the subject retried. Subjects were allowed to rest for at least 3–5 min between all trials to avoid fatigue. Note that of the 28 jumps performed within each trial, the time was measured between the 4th and 24th jump (10 cycles), excluding the first four and last four jumps to prevent the effect of a poor start or finish to the trial.
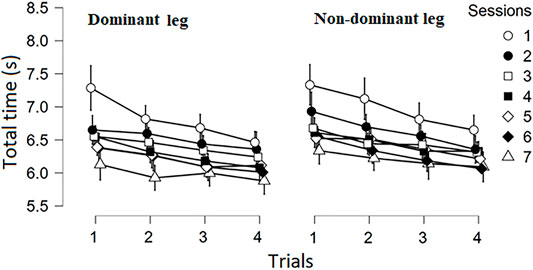
FIGURE 1. Flowchart of the experimental protocol.
Experimental Procedures
Body height was measured using a standard anthropometer while body mass and percent body fat were assessed by a bioelectric impedance method scale (In Body 720; United States).
The time required to perform each trial was measured to the nearest 0.01 s using two handheld stopwatches (SW) and two synchronized force plates (FP; AMTI, BP600400; United States; see Figure 2 for illustration). Prior to data collection, subjects were instructed on how to perform the test and were allowed to perform the test as practice.
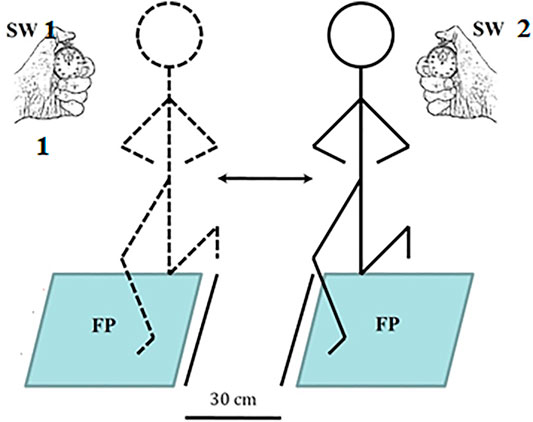
FIGURE 2. Illustration of the side-hop test performance and measurement of total time with FP and SW.
Data Processing and Analyses
The force plate (AMTI, Inc., Newton, MA, United States; sampling frequency 1,000 Hz) was mounted and calibrated according to the manufacturer’s instructions. Custom-developed software (LabVIEW, National Instruments, version 10.0, Austin, TX, United States) was used for off-line processing of the vertical component of the ground reaction force (F). The data were low-pass filtered with a recursive second-order Butterworth filter with a cut-off frequency of 10 Hz. The total time from the beginning of the force signal in the 4th jump (landing medially) to the end of the 24th jump (landing in the starting position also medially and completing the 10th cycle) was measured.
Statistical Analyses
The degree of agreement between total time measured by the raters (TTR1 and TTR2) and total time (TTFP) derived from force plate measurements was assessed through the measures of absolute [Coefficient of Variation–CV (%)] and relative (Intra-Class Correlation Coefficient—ICC) reliability (Hopkins, 2000). The systematic bias between the measurements was assessed through t-test for dependent samples. Also, limits of agreement- LoA = 95% using the Bland-Altman method were calculated and graphically presented (plotting the differences between each rater, and between each rater and the force plate, against the corresponding mean values (Martin Bland and Altman, 1986).
To explore the potential between sessions and trials’ learning effects on TT achieved with dominant/non-dominant leg, a three-way ANOVA (Leg as a between factor and Sessions and Trials as within factors) was applied. Two-way (Sessions and Trials as within factors) ANOVA on LSI was applied. When significant effects and their interactions were obtained, contrast analysis was applied. In addition, effect size was used to estimate the magnitude of differences of main effects, their interactions and contrast differences [ω2 for ANOVA and Cohens’ d for Contrasts; (Field, 2018)]. The differences were considered as either small (ω2 = 0.01; d = 0.2), moderate (ω2 = 0.06; d = 0.5), or large [ω2 = 0.14; d = 0.8; (Cohen, 1992; Kirk, 1996)]. The level of confidence (alfa) was set to 0.05.
Results
Interrater Reliability and Concurrent Validity of the Total Time Measures
Components of inter-rater reliability of the TT measures, presented in Table 1 and in Figure 3A revealed high reliability, whereas the t-test revealed no differences in time recordings (i.e., no systematic bias) between rater one and two [t (29) = −0.56, p > 0.05].
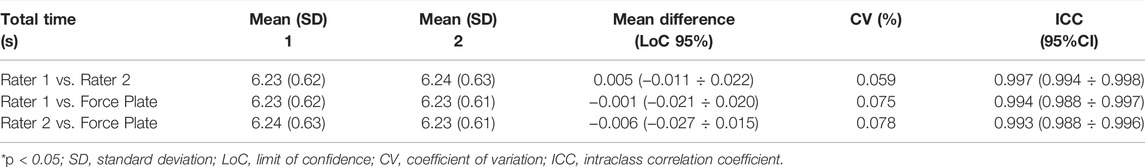
TABLE 1. Inter-rater reliability (Rater 1 vs. Rater 2) and concurrent Validity (Rater 1 vs. Force Plate and Rater 2 vs. Force Plate) of time measures (total time in s) statistics for Side-hop test.
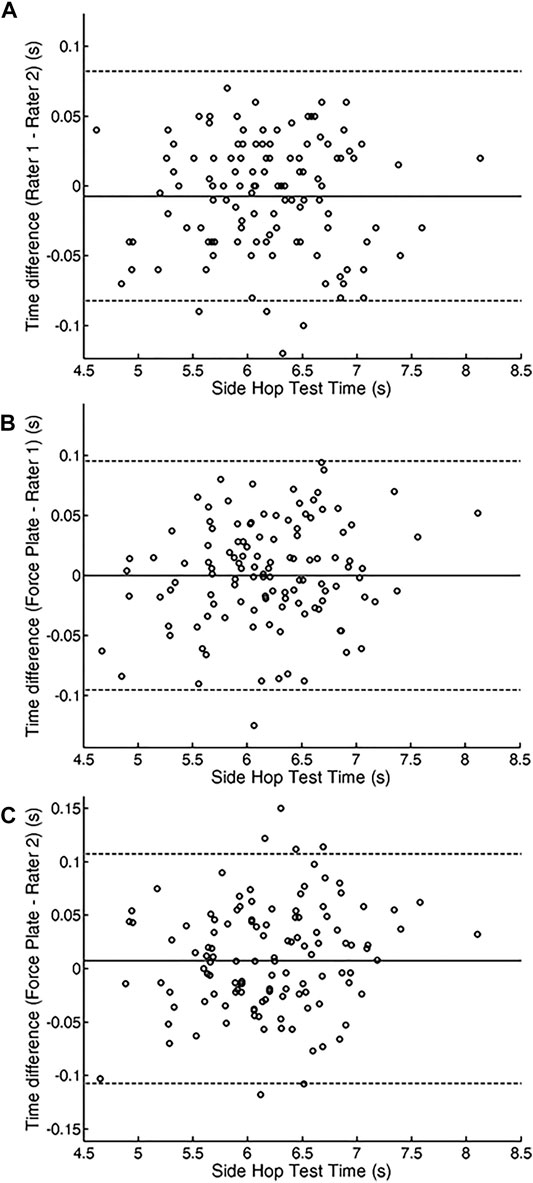
FIGURE 3. Bland–Altman plots for (A) interrater reliability showing the mean difference between raters rater (rater 2–rater 1). (B) Time measurement validity in rater 1 and (C) Time measurement validity in rater 2. The central solid line represents the mean differences (systematic error). The upper and lower dotted lines represent the upper and lower 95% limits of agreement (mean differences 6 1.96 SDs of the differences), respectively.
The validity of the TT measures in the SHT when simultaneously measured by the two experienced raters and using force plate are shown in Table 1 and Figures 3B,C. CV and ICC revealed high reliability with no systematic bias when measurement outcomes of both raters were compared with corresponding data derived from force plate recordings [t (29) = −0.56, p > 0.05; t (29) = 0.47, p > 0.05; for rater one and two, respectively].
Between-Session and Between-Trial Differences in Total Time Measurements and Limb Symmetry Index From Side Hop Test
Descriptive statistics for TT obtained across the sessions and trials for both legs are depicted in the Figure 4 (means presented as dots and SD as vertical error bars).
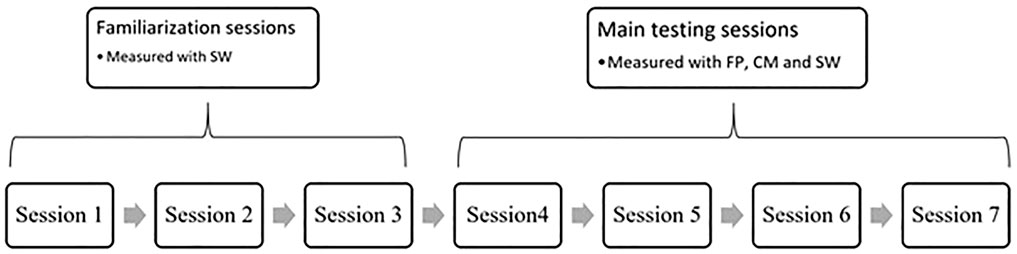
FIGURE 4. Strength assessed through 1RM (in kg).
The Tree-way ANOVA revealed significant main effects of Sessions [F (3.6, 72.6) = 25.87, p < 0.01, ω2 = 0.18] and Trials [F (3, 60) = 68.15, p < 0.01, ω2 = 0.10], but not interactions. No between leg differences were detected [F (1, 20) = 0.52, p > 0.05, ω2 = 0.001]. Further investigation of the change in TT between consecutive sessions (averaged for legs and trials) and between trials (averaged for legs and sessions) revealed that decrease in TT across the Sessions ended after second session (Table 2). However, regardless of the session and leg, contrast analysis for repeated measures, indicated high differences between all consecutive trials (Table 2).
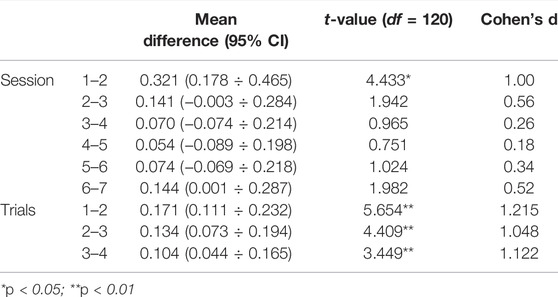
TABLE 2. Results of Contrast analysis for repeated measures of total time (between-sessions and between trial differences).
Descriptive statistics for LSI [Mean (SD)] calculated across the sessions and trials are presented in Table 3. LSI ranged from 0.999 to 1.055 across all sessions and trials. The Two-way ANOVA revealed no significant main effects of Sessions [F (6, 60) = 0.712, p > 0.05, ω2 = 0.001] and Trials [F (3, 20) = 0.263, p > 0.05, ω2 = 0.001].
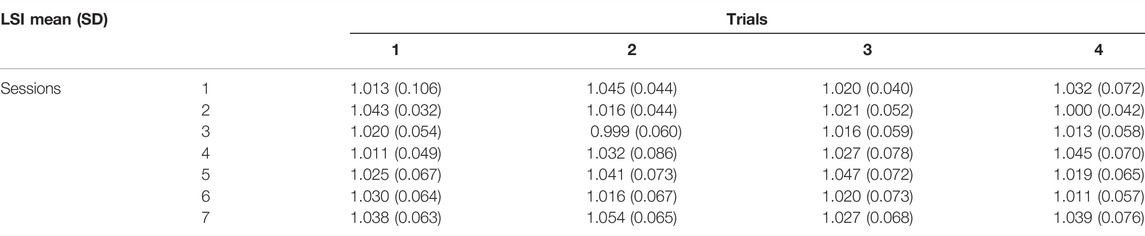
TABLE 3. Descriptive statistics for Limb symmetry index—LSI [Mean (SD)] calculated across the sessions and trials.
Discussion
Within the current study we have evaluated the inter-rater reliability and the concurrent validity of the TT measurements obtained from SHT when measurements were taken using stop watch and force plates. Furthermore, we aimed to determine minimum number of familiarization sessions and trials required to minimize the effects of learning on SHT, TT, and LSI. Our findings confirmed that SW measurements could be a valid and reliable measure of both TT and LSI index. In addition, we confirmed our hypothesis that complexity of the task in the side hop test results in prolonged familiarization through multiple sessions and trials. However, in contrast to the TT, the derived LSI was stable across both sessions and trials.
The first finding of the study indicated almost identical measures recorded by both raters and the records derived from the platform. In addition, exceptionally low CV, high ICC, and the lack in heteroscedasticity indicated high inter-rater reliability and concurrent validity of time measures, revealing that after a familiarization with the test protocol and with the measurement procedure, practitioners should be capable to make a reliable assessment of SHT. Although inter-rater reliability presents and important practical issue in applying test in praxis, surprisingly, this is the first study exploring the precision of SW measures of time needed to complete given number of jumps in the SHT. In their study aimed to evaluate reliability, measurement error, and construct validity of the SHT in male children and adolescents Kamonseki et al. (2018) have reported comparison of measurements obtained from two raters each recording one trial. As these two measurements were affected with both between-rater and between-trials variability, conclusion regarding the mutual comparison of raters outcome within the same session was not possible. Other studies on reliability and validity of stopwatch measures in some running field tests (Hetzler et al., 2008; Mann et al., 2015) or balance tests (Botolfsen et al., 2008) indicated that SW measures could be successfully applied but could lead to some disagreements when they are compared with more precise measurement solutions, suggesting that for reliable outcome two experienced raters should be involved in test administration. However, findings in our study revealed that SHT total time could be precisely measured by only one examiner, with sufficient familiarisation with the test procedure.
Our second finding is related to the minimum number of familiarisation trials necessary to obtain stable test outcome. It is well known that the number of familiarisation trials depends on a variety of factors where task complexity presents an important one (Moir et al., 2004; Moir et al., 2005; Glaister et al., 2007). In addition, possible strength gains may be a bias depending on the nature of task performed during the familiarisation process (Semmler, 2002; Kamen and Knight, 2004). Although contrast analysis revealed no significant differences between consecutive trials the differences in total time between the first and the last session clearly showed that the subjects tend to improve their results even after seven sessions. In addition, the trend within each session showed that the subjects are constantly improving their results, trial after trial. The differences between trials may be explained by neural adaptations, such as increasement in recruitment, firing rates, and synchronicity of motor units in agonist muscles, leading to strength gains (Semmler, 2002; Kamen and Knight, 2004). These adaptations occur particularly during the early phases of resistance training (Ritti-Dias et al., 2011; Nascimento et al., 2013). However, the differences between sessions could be related to the dependence of the adaptation rate on muscle size, with a larger muscle group requiring more sessions for familiarisation compared to a smaller group (Chan et al., 2020). Considering that SHT is a complex multi-joint task, large muscle groups are involved in performing the task. Due to the task complexity, prolonged familiarization is necessary to stabilize the results, i.e., the test should be performed with caution, when the aim is to assess the subject’s skill to perform consecutive medio-lateral jumps as fast as possible. However, there were no between leg differences in TT, indicating that in the healthy subjects, familiarization affects both legs similarly. This is in line with the finding of Itoh et al. (1998) who reported that more than 95% of the healthy subjects had normal between-leg differences. Other studies, reporting results for different variations of SHT in both legs of healthy patients also haven’t identified any notable between-leg differences (Docherty et al., 2005; Reid et al., 2007; Wikstrom et al., 2009; Kockum and Heijne, 2015). Further, LSI between dominant and nondominant leg calculated from total time was stable across both trials and sessions. This finding is particularly important, since the side hop test has been primarily introduced as a test aimed to detect potential asymmetries in lower leg function, particularly in patients recovering from ankle or knee injuries (Tegner et al., 1986; Risberg and Ekeland, 1994; Gustavsson et al., 2006; Caffrey et al., 2009; Wikstrom et al., 2009; Thomeé et al., 2011; Xergia et al., 2013). Consequently, these findings suggest that even within first session and few familiarizations’ trials, LSI could be assessed with consistency.
Limitations
Present article has possible limitations that should be acknowledged: 1) although our sample size appear to be relatively small, but in fact, it was sufficient for the number of planned repetitions per subject (k = 7). For the alpha level of 0.05, power of 0.80, and 10% dropout rate, 12–14 subjects were required. 2) Only males were included into present study, therefore we cannot generalize results to both genders; 3) the resting time between sets could have also influenced the changes observed.
Conclusion
Stopwatch measurements could be reliably used to measure total time in the SHT, while the test could be administrated with only one experienced rater. Although prolong familiarization is necessary for the subjects to stabilize the total time taken to perform given number of jumps as fast as possible, regardless of the leg, asymmetries assessed through the limb symmetry index are even within the first session. From the practical point of view, our findings confirmed that SHT could be easily administered by the practitioners without profound familiarization, while the potential asymmetries could be reliably assessed after only few familiarization trails.
Data Availability Statement
The original contributions presented in the study are included in the article/supplementary material, further inquiries can be directed to the corresponding author.
Author Contributions
All authors listed have made a substantial, direct and intellectual contribution to the work, and approved it for publication.
Funding
This work was funded by the Serbian Scientific Research Fund grant no. 451-03-68/2022-14/200154 and by Slovenian Research Agency under the research programme Bio-Psycho-social context of kinesiology and Kinesiology of monostructural, polystructural and conventional sports (Number P5-0142 and P5-0147).
Conflict of Interest
The authors declare that the research was conducted in the absence of any commercial or financial relationships that could be construed as a potential conflict of interest.
Publisher’s Note
All claims expressed in this article are solely those of the authors and do not necessarily represent those of their affiliated organizations, or those of the publisher, the editors and the reviewers. Any product that may be evaluated in this article, or claim that may be made by its manufacturer, is not guaranteed or endorsed by the publisher.
Acknowledgments
We thank to Miloš Dakić for his assistance with data collection.
References
Atkins S. J., Bentley I., Hurst H. T., Sinclair J. K., Hesketh C. (2016). The Presence of Bilateral Imbalance of the Lower Limbs in Elite Youth Soccer Players of Different Ages. J. Strength Cond. Res. 30, 1007–1013. doi:10.1519/jsc.0b013e3182987044
Bishop C., Turner A., Read P. (2018). Effects of Inter-limb Asymmetries on Physical and Sports Performance: a Systematic Review. J. Sports Sci. 36, 1135–1144. doi:10.1080/02640414.2017.1361894
Botolfsen P., Helbostad J. L., Moe-nilssen R., Wall J. C. (2008). Reliability and Concurrent Validity of the Expanded Timed Up-And-Go Test in Older People with Impaired Mobility. Physiother. Res. Int. 13, 94–106. doi:10.1002/pri.394
Caffrey E., Docherty C. L., Schrader J., Klossnner J. (2009). The Ability of 4 Single-Limb Hopping Tests to Detect Functional Performance Deficits in Individuals with Functional Ankle Instability. J. Orthop. Sports Phys. Ther. 39, 799–806. doi:10.2519/jospt.2009.3042
Chan J. P. Y., Krisnan L., Yusof A., Selvanayagam V. S. (2020). Maximum Isokinetic Familiarization of the Knee: Implication on Bilateral Assessment. Hum. Mov. Sci. 71, 102629. doi:10.1016/j.humov.2020.102629
Coratella G., Beato M., Schena F. (2018). Correlation between Quadriceps and Hamstrings Inter-limb Strength Asymmetry with Change of Direction and Sprint in U21 Elite Soccer-Players. Hum. Mov. Sci. 59, 81–87. doi:10.1016/j.humov.2018.03.016
Croisier J.-L., Ganteaume S., Binet J., Genty M., Ferret J.-M. (2008). Strength Imbalances and Prevention of Hamstring Injury in Professional Soccer Players. Am. J. Sports Med. 36, 1469–1475. doi:10.1177/0363546508316764
Demeritt K. M., Shultz S. J., Docherty C. L., Gansneder B. M., Perrin D. H. (2002). Chronic Ankle Instability Does Not Affect Lower Extremity Functional Performance. J. Athl. Train. 37, 507–511.
Docherty C. L., Arnold B. L., Gansneder B. M., Hurwitz S., Gieck J. (2005). Functional-performance Deficits in Volunteers with Functional Ankle Instability. J. Athl. Train. 40, 30–34.
Fitzgerald G. K., Lephart S. M., Hwang J. H., Wainner M. R. S. (2001). Hop Tests as Predictors of Dynamic Knee Stability. J. Orthop. Sports Phys. Ther. 31, 588–597. doi:10.2519/jospt.2001.31.10.588
Fousekis K., Tsepis E., Vagenas G. (2010). Lower Limb Strength in Professional Soccer Players: Profile, Asymmetry, and Training Age. J. Sports Sci. Med. 9, 364–373.
García-López J., Peleteiro J., Rodgríguez-Marroyo J. A., Morante J. C., Herrero J. A., Villa J. G. (2005). The Validation of a New Method that Measures Contact and Flight Times during Vertical Jump. Int. J. Sports Med. 26, 294–302. doi:10.1055/s-2004-820962
Glaister M., Howatson G., Lockey R. A., Abraham C. S., Goodwin J. E., McInnes G. (2007). Familiarization and Reliability of Multiple Sprint Running Performance Indices. J. Strength Cond. Res. 21, 857–859. doi:10.1519/R-20336.1
Gustavsson A., Neeter C., Thomeé P., Grävare Silbernagel K., Augustsson J., Thomeé R., et al. (2006). A Test Battery for Evaluating Hop Performance in Patients with an ACL Injury and Patients Who Have Undergone ACL Reconstruction. Knee Surg. Sports Traumatol. Arthr 14, 778–788. doi:10.1007/s00167-006-0045-6
Hetzler R. K., Stickley C. D., Lundquist K. M., Kimura I. F. (2008). Reliability and Accuracy of Handheld Stopwatches Compared with Electronic Timing in Measuring Sprint Performance. J. Strength Cond. Res. 22, 1969–1976. doi:10.1519/JSC.0b013e318185f36c
Hopkins W. G. (2000). Measures of Reliability in Sports Medicine and Science. Sports Med. 30, 1–15. doi:10.2165/00007256-200030010-00001
Impellizzeri F. M., Rampinini E., Maffiuletti N., Marcora S. M. (2007). A Vertical Jump Force Test for Assessing Bilateral Strength Asymmetry in Athletes. Med. Sci. Sport. Exerc. 39, 2044–2050. doi:10.1249/mss.0b013e31814fb55c
Itoh H., Kurosaka M., Yoshiya S., Ichihashi N., Mizuno K. (1998). Evaluation of Functional Deficits Determined by Four Different Hop Tests in Patients with Anterior Cruciate Ligament Deficiency. Knee Surg. Sports Traumatol. Arthrosc. 6, 241–245. doi:10.1007/s001670050106
Jones P. A., Bampouras T. M. (2010). A Comparison of Isokinetic and Functional Methods of Assessing Bilateral Strength Imbalance. J. Strength Cond. Res. 24, 1553–1558. doi:10.1519/jsc.0b013e3181dc4392
Kamen G., Knight C. A. (2004). Training-Related Adaptations in Motor Unit Discharge Rate in Young and Older Adults. J. Gerontol. Ser. A Biol. Sci. Med. Sci. 59, 1334–1338.
Kamonseki D. H., Cedin L., Tavares-Preto J., Calixtre L. B. (2018). Reliability, Validity, and Minimal Detectable Change of Side Hop Test in Male Children and Adolescents. Phys. Ther. Sport 34, 141–147. doi:10.1016/j.ptsp.2018.09.009
Kamonseki D. H., Gonçalves G. A., Yi L. C., Júnior I. L. (2016). Effect of Stretching with and without Muscle Strengthening Exercises for the Foot and Hip in Patients with Plantar Fasciitis: a Randomized Controlled Single-Blind Clinical Trial. Man. Ther. 23, 76–82. doi:10.1016/j.math.2015.10.006
Kiesel K. B., Butler R. J., Plisky P. J. (2014). Prediction of Injury by Limited and Asymmetrical Fundamental Movement Patterns in American Football Players. J. Sport Rehabil. 23, 88–94. doi:10.1123/jsr.2012-0130
Kirk R. E. (1996). Practical Significance: A Concept Whose Time Has Come. Educ. Psychol. Meas. 56, 746–759. doi:10.1177/0013164496056005002
Kockum B., Heijne A. I.-L. M. (2015). Hop Performance and Leg Muscle Power in Athletes: Reliability of a Test Battery. Phys. Ther. Sport 16, 222–227. doi:10.1016/j.ptsp.2014.09.002
Lawson B. R., Stephens T. M., DeVoe D. E., Reiser R. F. (2006). Lower-extremity Bilateral Differences during Step-Close and No-step Countermovement Jumps with Concern for Gender. J. strength Cond. Res. 20, 608. doi:10.1519/r-18265.1
Maloney S. J. (2019). The Relationship between Asymmetry and Athletic Performance: A Critical Review. J. Strength Cond. Res. 33, 2579–2593. doi:10.1519/jsc.0000000000002608
Mann J. B., Ivey P. J., Brechue W. F., Mayhew J. L. (2015). Validity and Reliability of Hand and Electronic Timing for 40-yd Sprint in College Football Players. J. Strength Cond. Res. 29, 1509–1514. doi:10.1519/JSC.0000000000000941
Markström J. L., Schelin L., Häger C. K. (2018). A Novel Standardised Side Hop Test Reliably Evaluates Landing Mechanics for Anterior Cruciate Ligament Reconstructed Persons and Controls. Sport. Biomech. 20 (2), 213–229. doi:10.1080/14763141.2018.1538385
Martin Bland J., Altman D. (1986). STATISTICAL METHODS FOR ASSESSING AGREEMENT BETWEEN TWO METHODS OF CLINICAL MEASUREMENT. Lancet 327, 307–310. doi:10.1016/S0140-6736(86)90837-8
Martin R. L., Davenport T. E., Paulseth S., Wukich D. K., Godges J. J., Altman R. D., et al. (2013). Ankle Stability and Movement Coordination Impairments: Ankle Ligament Sprains. J. Orthop. Sports Phys. Ther. 43, A1–A40. doi:10.2519/jospt.2013.0305
Moir G., Button C., Glaister M., Stone M. H. (2004). Influence of Familiarization on the Reliability of Vertical Jump and Acceleration Sprinting Performance in Physically Active Men. J. Strength Cond. Res. 18, 276–280. doi:10.1519/R-13093.1
Moir G., Sanders R., Button C., Glaister M. (2005). The Influence of Familiarization on the Reliability of Force Variables Measured during Unloaded and Loaded Vertical Jumps. J. Strength Cond. Res. 19, 140–145. doi:10.1519/14803.1
Nascimento I. A., Marques S. S. I., Cabanelas I. T. D., Pereira S. A., Druzian J. I., de Souza C. O., et al. (2013). Screening Microalgae Strains for Biodiesel Production: Lipid Productivity and Estimation of Fuel Quality Based on Fatty Acids Profiles as Selective Criteria. Bioener. Res. 6, 1–13.
Ortiz A., Olson S. L., Roddey T. S., Morales J. (2005). Reliability of Selected Physical Performance Tests in Young Adult Women. J. Strength Cond. Res. 19, 39–44. doi:10.1519/14163.1
Ortiz A., Olson S., Trudelle-Jackson E., Rosario M., Venegas H. L. (2011). Landing Mechanics during Side Hopping and Crossover Hopping Maneuvers in Noninjured Women and Women with Anterior Cruciate Ligament Reconstruction. PM&R 3, 13–20. doi:10.1016/j.pmrj.2010.10.018
Reid A., Birmingham T. B., Stratford P. W., Alcock G. K., Giffin J. R. (2007). Hop Testing Provides a Reliable and Valid Outcome Measure during Rehabilitation after Anterior Cruciate Ligament Reconstruction. Phys. Ther. 87, 337–349. doi:10.2522/ptj.20060143
Risberg M. A., Ekeland A. (1994). Assessment of Functional Tests after Anterior Cruciate Ligament Surgery. J. Orthop. Sports Phys. Ther. 19, 212–217. doi:10.2519/jospt.1994.19.4.212
Rouissi M., Chtara M., Owen A., Chaalali A., Chaouachi A., Gabbett T., et al. (2016). Effect of Leg Dominance on Change of Direction Ability Amongst Young Elite Soccer Players. J. Sports Sci. 34, 542–548. doi:10.1080/02640414.2015.1129432
Ritti-Dias R. M., Avelar A., Salvador E. P., Cyrino E. S. (2011). Influence of Previous Experience on Resistance Training on Reliability of One-Repetition Maximum Test. J. Stren. Cond. Res. 25, 1418–1422.
Sadeghi H., Allard P., Prince F., Labelle H. (2000). Symmetry and Limb Dominance in Able-Bodied Gait: a Review. Gait Posture 12, 34–45. doi:10.1016/s0966-6362(00)00070-9
Sato K., Heise G. D. (2012). Influence of Weight Distribution Asymmetry on the Biomechanics of a Barbell Back Squat. J. Strength Cond. Res. 26, 342–349. doi:10.1519/jsc.0b013e318220e0a3
Schlumberger A., Laube W., Bruhn S., Herbeck B., Dahlinger M., Fenkart G., et al. (2006). Muscle Imbalances - Fact or Fiction? Ies 14, 3–11. doi:10.3233/ies-2006-0229
Scinicarelli G., Trofenik M., Froböse I., Wilke C. (2021). The Reliability of Common Functional Performance Tests within an Experimental Test Battery for the Lower Extremities. Sports 9, 100. doi:10.3390/sports9070100
Seeley M. K., Umberger B. R., Shapiro R. (2008). A Test of the Functional Asymmetry Hypothesis in Walking. Gait Posture 28, 24–28. doi:10.1016/j.gaitpost.2007.09.006
Semmler J. G. (2002). Motor Unit Synchronization and Neuromuscular Performance. Exerc. Sport Sci. Rev. 30, 8–14.
Tegner Y., Lysholm J., Lysholm M., Gillquist J. (1986). A Performance Test to Monitor Rehabilitation and Evaluate Anterior Cruciate Ligament Injuries. Am. J. Sports Med. 14, 156–159. doi:10.1177/036354658601400212
Thomeé R., Kaplan Y., Kvist J., Myklebust G., Risberg M. A., Theisen D., et al. (2011). Muscle Strength and Hop Performance Criteria Prior to Return to Sports after ACL Reconstruction. Knee Surg. Sports Traumatol. Arthrosc. 19, 1798–1805. doi:10.1007/s00167-011-1669-8
Wang H., Yu H., Kim Y. H., Kan W. (2021). Comparison of the Effect of Resistance and Balance Training on Isokinetic Eversion Strength, Dynamic Balance, Hop Test, and Ankle Score in Ankle Sprain. Life 11, 307. doi:10.3390/life11040307
Wikstrom E. A., Tillman M. D., Chmielewski T. L., Cauraugh J. H., Naugle K. E., Borsa P. A. (2009). Self-assessed Disability and Functional Performance in Individuals with and without Ankle Instability: a Case Control Study. J. Orthop. Sports Phys. Ther. 39, 458–467. doi:10.2519/jospt.2009.2989
Xergia S. A., Pappas E., Zampeli F., Georgiou S., Georgoulis A. D. (2013). Asymmetries in Functional Hop Tests, Lower Extremity Kinematics, and Isokinetic Strength Persist 6 to 9 Months Following Anterior Cruciate Ligament Reconstruction. J. Orthop. Sports Phys. Ther. 43, 154–162. doi:10.2519/jospt.2013.3967
Yoshida M., Aoki N., Taniguchi K., Yoshida M., Katayose M. (2018). Kinematic Analysis of the Ankle Joint on the Side-Hop Test in Subjects with Ankle Sprains. Transl. Sports Med. 1, 265–272. doi:10.1002/tsm2.44
Keywords: side hop test, reliability, concurrent validity, limb symmetry index, stopwatch
Citation: Mirković SV, Đurić S, Sember V, Knezevic OM, Pajek M, Mirković MM and Mirkov DM (2022) Evaluation of the Limb Symmetry Index: The Side Hop Test. Front. Physiol. 13:874632. doi: 10.3389/fphys.2022.874632
Received: 12 February 2022; Accepted: 27 May 2022;
Published: 17 June 2022.
Edited by:
Julien Louis, Liverpool John Moores University, United KingdomReviewed by:
Luiz H. Palucci Vieira, São Paulo State University, BrazilAshril Yusof, University of Malaya, Malaysia
Copyright © 2022 Mirković, Đurić, Sember, Knezevic, Pajek, Mirković and Mirkov. This is an open-access article distributed under the terms of the Creative Commons Attribution License (CC BY). The use, distribution or reproduction in other forums is permitted, provided the original author(s) and the copyright owner(s) are credited and that the original publication in this journal is cited, in accordance with accepted academic practice. No use, distribution or reproduction is permitted which does not comply with these terms.
*Correspondence: Vedrana Sember, dmVkcmFuYS5zZW1iZXJAZnNwLnVuaS1sai5zaQ==