 Adam L. Balogh
 Roberta Sudy1
 Ferenc Petak
 Andre Dos Santos Rocha
- 1Unit for Anaesthesiological Investigations, Department of Acute Medicine, University of Geneva, Geneva, Switzerland
- 2Department of Medical Physics and Informatics, University of Szeged, Szeged, Hungary
Background: Although spontaneous breathing is known to exhibit substantial physiological fluctuation that contributes to alveolar recruitment, changes in the variability of the respiratory pattern following inhalation of carbon dioxide (CO2) and volatile anesthetics have not been characterized. Therefore, we aimed at comparing the indices of breathing variability under wakefulness, sleep, hypercapnia and sedative and anesthetic concentrations of sevoflurane.
Methods: Spontaneous breathing pattern was recorded on two consecutive days in six rabbits using open whole-body plethysmography under wakefulness and spontaneous sleep and following inhalation of 5% CO2, 2% sevoflurane (0.5 MAC) and 4% (1 MAC) sevoflurane. Tidal volume (VT), respiratory rate (RR), minute ventilation (MV), inspiratory time (TI) and mean inspiratory flow (VT/TI) were calculated from the pressure fluctuations in the plethysmograph. Means and coefficients of variation were calculated for each measured variable. Autoregressive model fitting was applied to estimate the relative contributions of random, correlated, and oscillatory behavior to the total variance.
Results: Physiological sleep decreased MV by lowering RR without affecting VT. Hypercapnia increased MV by elevating VT. Sedative and anesthetic concentrations of sevoflurane increased VT but decreased MV due to a decrease in RR. Compared to the awake stage, CO2 had no effect on VT/TI while sevoflurane depressed significantly the mean inspiratory flow. Compared to wakefulness, the variability in VT, RR, MV, TI and VT/TI were not affected by sleep but were all significantly decreased by CO2 and sevoflurane. The variance of TI originating from correlated behavior was significantly decreased by both concentrations of sevoflurane compared to the awake and asleep conditions.
Conclusions: The variability of spontaneous breathing during physiological sleep and sevoflurane-induced anesthesia differed fundamentally, with the volatile agent diminishing markedly the fluctuations in respiratory volume, inspiratory airflow and breathing frequency. These findings may suggest the increased risk of lung derecruitment during procedures under sevoflurane in which spontaneous breathing is maintained.
BackGround
The respiratory system demonstrates appreciable tidal variation in rate and volume, even at rest and in steady-state conditions (Dejours et al., 1966; Frey et al., 1998). Aside from the constant adjustment to internal and external conditions, these fluctuations in the breathing pattern are beneficial for structural and functional reasons, given the nonlinear behavior of the lungs (Suki et al., 1998). Accordingly, variability in tidal volume (VT) and respiratory rate (RR) promotes alveolar recruitment and optimizes ventilation-perfusion matching (Ma et al., 2011; Huhle et al., 2016). Thus, the loss or diminishment of breathing variability may lead to atelectasis and increased shunt resulting in deterioration of respiratory mechanics and gas exchange.
Spontaneous breathing is often maintained during procedures performed under sedation in anesthesia and intensive care settings. However, the variability of spontaneous breathing is affected by various sedative drugs (Klimathianaki et al., 2010; Bradley et al., 2013), which may impact gas exchange and post-procedural outcomes. In addition, sedation may lead to hypercapnia, the major contributor of the control of breathing, which by itself influences the variability of spontaneous breathing (Fiamma et al., 2007). In children sevoflurane is commonly used (Brioni et al., 2017) thanks to its tolerable odor and advantageous pharmacokinetic profile to provide sedation or anesthesia for longer diagnostic procedures or certain surgical interventions. Although the effects of different anesthetic agents and hypercapnia on the mean values of respiratory variables measured during spontaneous breathing have been well characterized (Doi and Ikeda, 1987; Goodman et al., 1987), there is still a lack of knowledge on the effects of these interventions on the variability of spontaneous breathing outcomes, in particular under inhalation anesthesia.
Therefore, the aim of this experimental study was to reveal the changes in the variability of spontaneous breathing under hypercapnia and sevoflurane at concentrations used routinely for sedation and anesthesia. We hypothesized that the significant changes in the spontaneous breathing parameters occurring under hypercapnia and sevoflurane will also manifest as altered variability. Furthermore, we aimed at identifying the contribution of the random and correlated components to the total variance of spontaneous breathing indices.
Methods
Ethical Approval
Approval was obtained from the Experimental Ethics Committee of the University of Geneva and the Animal Welfare Committee of the Canton of Geneva, Switzerland (No.GE17/151). Procedures were performed in compliance with all current animal protection laws of Switzerland (LPA, RS455) and reported according to the ARRIVE (Animal Research: Reporting of in vivo Experiments) guidelines.
Experimental Animals
Six adult female New Zealand White rabbits (mean weight 2.60 kg, range 2.40–2.85 kg) were purchased from the farm of the University of Geneva (Arare, Geneva, Switzerland). Food and water were provided ad libitum before the experiment, and welfare of the animals was ensured according to the current animal protection laws of Switzerland.
Open Barometric Whole-Body Plethysmography Measurements
Spontaneous breathing was recorded using a custom-made plexiglass chamber as an open barometric whole-body plethysmograph (WBP). The external measures of the chamber were 300 × 300 × 500 mm, with a wall thickness of 10 mm, resulting in an internal volume of 37.63 L. The chamber pressure was continuously measured with a pressure transducer (Honeywell Differential Pressure Sensor model 24PCEFA6D, Charlotte, North Carolina, United States). The WBP chamber was continuously flushed with a fresh supply of gases to prevent carbon dioxide (CO2) accumulation. Humidity and temperature were continuously recorded using a hygrometer and temperature probe (Harvard Apparatus Homeothermic system 230 VAC, Les Ulis, France). The movement of the animals was constantly monitored by a camera. All signals were continuously recorded at a sampling rate of 1 kHz (ADInstruments, Powerlab model 8/35 and LabChart 7, Dunedin, New Zealand).
Data Analysis
The Peak Analysis extension of the LabChart software was used to identify each breath. Segments with pressure artefacts related to animal movement were excluded from the analysis. Thus, the chamber pressure was analyzed during motionless periods for each condition. Respiratory cycles were defined as segments between two consecutive peak values identified as local maxima in chamber pressure greater than 1.5 times the standard deviation of the entire signal. RR was calculated by identifying peak maxima and minima in chamber pressure corresponding to end-inspiratory and end-expiratory states, respectively. Inspiratory time (TI) was defined as the time elapsed from end-expiration to the subsequent end-inspiration. Expiratory time (TE) was calculated by subtracting TI from the total length of the respiratory cycle. Expiratory VT was obtained by multiplying the amplitude of chamber pressure by the calibration factor (see below). Mean inspiratory flow was calculated as VT/TI. Minute volume (MV) was obtained as the product of VT and RR.
Calculation of Respiratory Volumes
To estimate VT using WBP, tracheal airflow and chamber pressure were measured simultaneously in one representative rabbit. Following anesthesia with intramuscular xylazine (3 mg/kg) and ketamine (25 mg/kg) and supplemental analgesia with subcutaneous lidocaine (1 ml, 0.5%), surgical tracheostomy was performed, and a 3.5 mm internal diameter uncuffed tube was placed in the trachea. A pneumotachograph (Hans Rudolph 8410A, Kansas, United States) was connected to the tracheal tube and the spontaneously breathing rabbit was placed inside the WBP chamber. Expiratory VT was calculated by integration of the expiratory tracheal flow. The calibration factor used to estimate the expiratory VT, was determined from 20 consecutive breaths by dividing the measured VT of each breath by the amplitude of the change in the corresponding chamber pressure.
Study Protocol
Animals were allowed to acclimatize to the measurement environment for one week. Data collection of the breathing pattern was then performed on two consecutive days. On each experimental day, the rabbits were placed in the WBP chamber for 1.5 h in the same order. Five periods of 15 min were sequentially recorded without human presence in the measurement room, with lights off and absence of noise stimuli. During the first 30 min, the box was filled with air (21% oxygen) and measurements were made while the animals were awake (stage Awake). Left alone and unstimulated during this period, all animals progressively adopted a motionless, lay down or sphinx-like posture, depression of the ears and ceased nostril movements. According to rabbit behavioural studies (Pivik et al., 1986; Aguilar-Roblero and González-Mariscal, 2020), this stage likely corresponds to physiological sleep (stage Asleep) and was analyzed separately from the Awake stage. The box was then filled with 5% carbon dioxide and 95% air (stage CO2) for 15 min. Finally, after the CO2 was removed, 2% sevoflurane corresponding to approximately 0.5 minimum alveolar concentration (MAC) (stage Sev 2%) followed by 4% sevoflurane corresponding to approximately 1 MAC (stage Sev 4%) (Scheller et al., 1988) was introduced into the WBP chamber for 15 min each. These concentrations of sevoflurane were chosen as they induce two measurably different depths of anesthesia, sedation, and general anesthesia in rabbits, respectively (Terada et al., 2014). At concentrations significantly below 0.5 MAC, awakening is expected, while concentrations above 1.3 MAC are rarely used in the clinical environment due to hemodynamic side effects and lack of additional anesthetic effect. All gases were delivered at a flow rate of 1.5 L/min into the chamber, and the gas composition was continuously measured by side-stream gas monitoring (Dräger Vamos, Liebefeld, Switzerland). The rabbits were returned to the housing facility after regaining consciousness.
Coefficients of Variation, Autocorrelation, and Spectral Analyses
Coefficients of variation (CV) of VT, RR, TI, TE, MV and VT/TI were calculated for each protocol stage as the ratio of the standard deviation and the mean for each animal.
For the autocorrelation and spectral analyses, series containing equal number of consecutive breaths were selected for each animal for all stages, and VT, TI, TE and VT/TI were calculated for each breath within the sequence. Since outliers can introduce a substantial bias into the correlogram, values were clamped at ± 2 standard deviations from the mean of each series (Pack et al., 1988). The stationarity of the data series was ensured by third degree polynomial detrending (Jubran et al., 1997). Subsequently, autocorrelation coefficients at a lag of one breath were calculated for each series.
To assess the relative contribution of different components, the gross variance of breath-by-breath data series of VT, TI, TE and VT/TI was partitioned into correlated, random and oscillatory behavior by fitting a previously validated autoregressive model to the data series (Modarreszadeh et al., 1990). Briefly, autoregressive models were fitted to the clamped, detrended data series. The models included a random noise component and a first order autoregressive component if the lag of one breath autocorrelation coefficient was non-significant. If the first order autocorrelation coefficient was significant, a second order autoregressive component was included in the model. If any significant peaks (higher than mean + 2 standard deviations, separately for frequencies below 0.2/breath and above 0.2/breath) were identified in the power spectra of VT, TI, TE and VT/TI data series obtained by fast Fourier transform, an oscillatory component was also included in the model as an external regressor. The autocorrelation coefficients at a lag of one breath of each measurement were categorized as positive or negative. Autocorrelations and spectral analyses were performed in the R environment, and the forecast package (Hyndman and Khandakar, 2008) was used for the autoregressive model fitting.
Statistical Analysis
All data are presented as mean [95% confidence interval of the mean], unless otherwise stated. No difference was observed in any of the parameters obtained between the two experimental days, and thus pooled data sets were used in the statistical analysis. One-way repeated measures analyses of variance (ANOVA) were performed for continuous variables to compare means at the five protocol stages with a composite of subject and day as the repeating factor. In case of normality, post hoc pairwise comparisons were performed using Student’s t-tests with Holm–Sidak correction to compare means of absolute values of the parameters and their CVs between the protocol stages. Subsequently, chi-square tests followed by corrected pairwise comparisons were used to analyze the differences in the frequencies of the categorized autocorrelation coefficients. Sample size analysis was based on considering a 20% change in the primary outcome variable (CV of VT) as clinically significant. This analysis revealed the need for a minimum of six rabbits to detect statistically significant differences using repeated measures ANOVA on the main outcome variable and assuming a standard deviation of 20%, a power of 0.9 and an alpha level of 0.05. p values < 0.05 were considered significant. Statistical analyses were performed with SigmaPlot 13.0 (Systat Software, San Jose, CA) and in the R statistical environment.
Results
Measurements of chamber pressure did not require correction for changes in chamber temperature [19°C (18.9–19.2°C)] or humidity [33% (32.4–33.7%)], as these were negligible between and within animals during the 1.5-h recordings. Representative tracings of plethysmography chamber pressure in each protocol stage are presented in Figure 1.
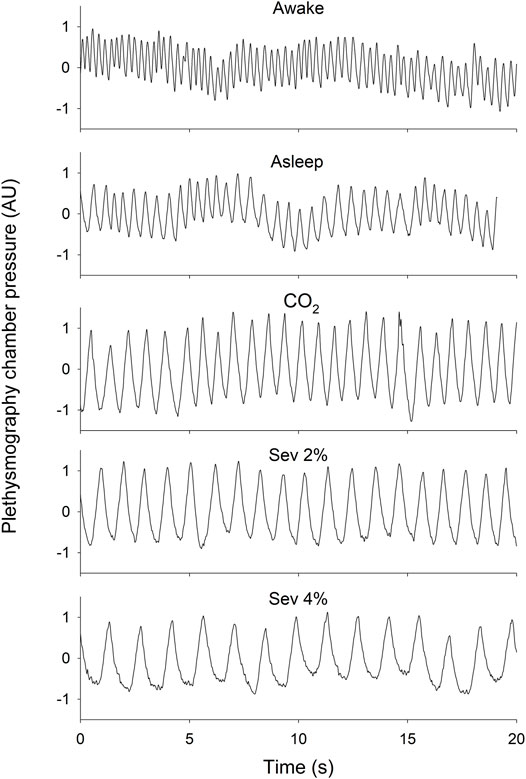
FIGURE 1. Representative 20-s tracings of plethysmography chamber pressure in wakeful (Awake) and sleeping (Asleep) states, and during the inhalation of 5% CO2 (CO2), 2% sevoflurane (Sev 2%) or 4% sevoflurane (Sev 4%) with the baseline pressure adjusted to 0. Scaling of the y-axes are identical.
Changes in Tidal Volume and Inspiratory Time
Changes in the mean values of VT, TI and VT/TI and their CVs are presented in Figure 2. After transitioning from the Awake to the Asleep stage, VT did not change significantly, while TI increased, resulting in a decreased VT/TI (p < 0.005 for both). Compared to the Awake stage, hypercapnia increased VT and TI (p < 0.005 for both) without significant effects on VT/TI. Sevoflurane inhalation elevated VT and TI compared to the Awake and Asleep stages (p < 0.001 for all). A significantly lower VT/TI was observed under both concentrations of sevoflurane compared to the Awake stage; however, only the Sev 4% stage differed significantly from the Asleep stage (p < 0.001). Similar tendencies were observed for the changes in the coefficients of variation of VT, TI and VT/TI, with significantly lower values measured during hypercapnia and sevoflurane inhalation (p < 0.05 for all).
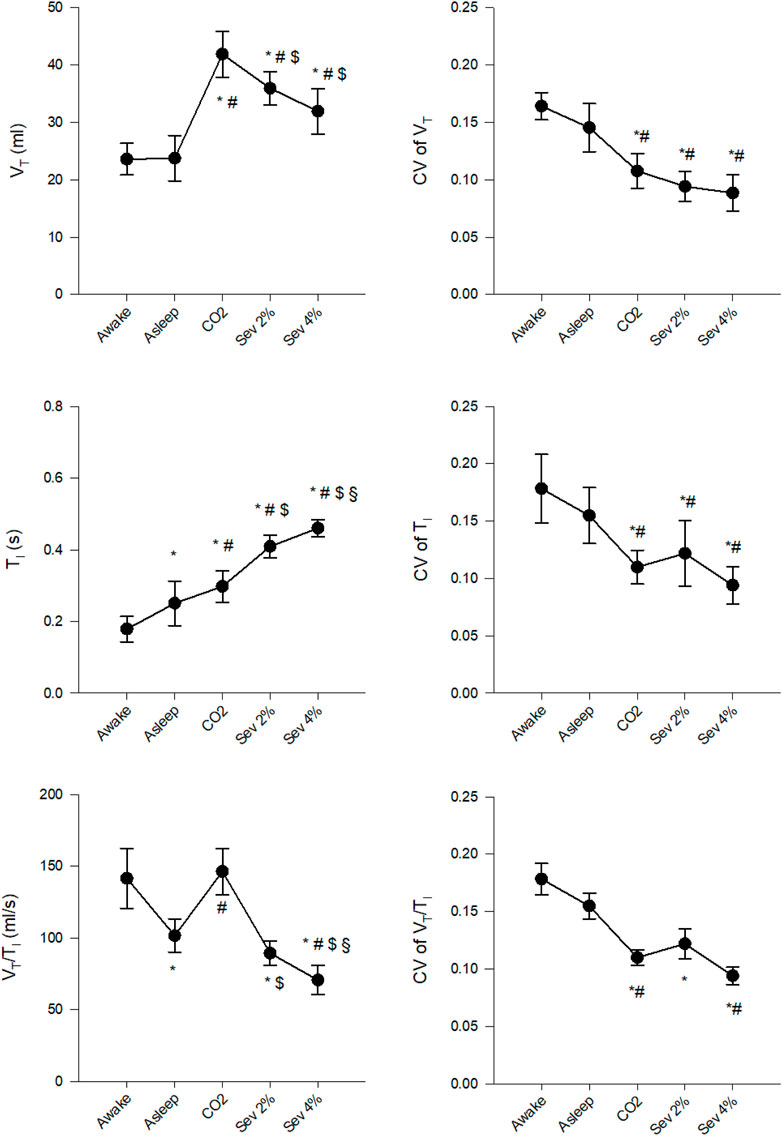
FIGURE 2. Changes in the absolute values and coefficients of variation (CV) of tidal volume (VT), inspiratory time (TI) and their ratio (VT/TI) in wakeful (Awake) and sleeping (Asleep) rabbits and during the inhalation of 5% CO2 (CO2), 2% sevoflurane (Sev 2%) or 4% sevoflurane (Sev 4%), presented as mean ± 95% confidence interval of the mean. *p < 0.05 vs. Awake, #p < 0.05 vs. Asleep, $p < 0.05 vs. CO2, §p < 0.05 vs. Sev 2%.
Figure 3 demonstrates changes in the mean values of RR, TE and MV and their CVs. Significant decreases were observed in RR and MV (p < 0.005 for both), but not in TE following the transition from the Awake to the Asleep stage. Hypercapnia decreased RR compared to the Awake stage and increased MV compared to both the Awake and Asleep stages (p < 0.002 for all) without significantly affecting TE. Sevoflurane inhalation decreased RR and MV and increased TE compared to all previous stages (p < 0.002 for all). The CVs of RR, TE and MV did not differ between the Awake and Asleep stages. Both hypercapnia and sevoflurane inhalation significantly decreased CVs of RR and MV compared to the Awake and Asleep stages (p < 0.001 for all), whereas, for the CV of TE, only the CO2 stage differed from the other four stages (p < 0.005).
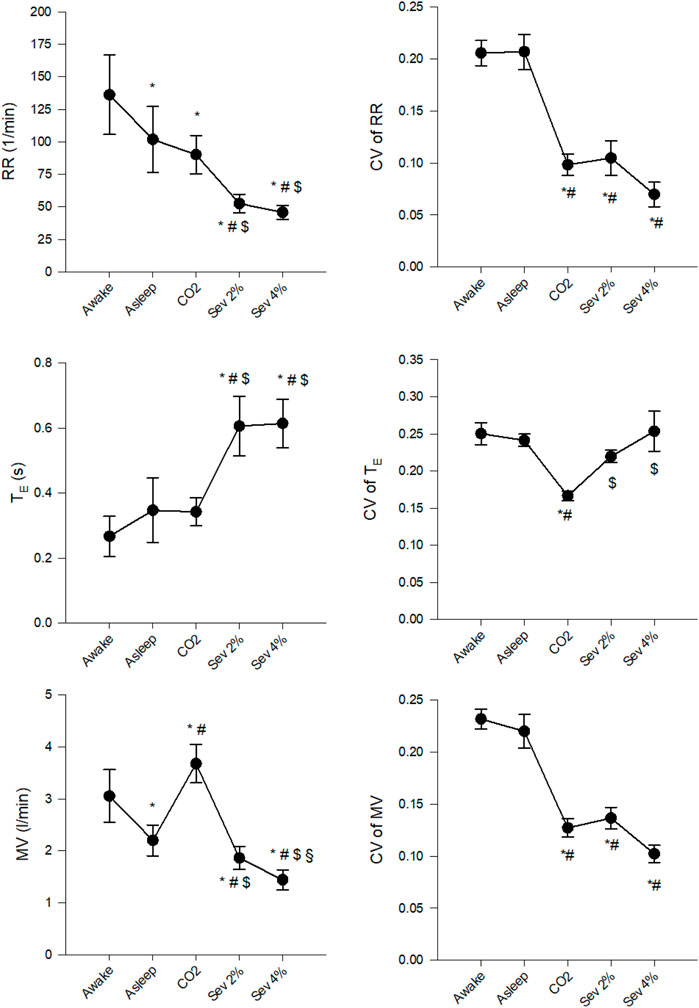
FIGURE 3. Changes in the absolute values and coefficients of variation (CV) of respiratory rate (RR), expiratory time (TE) and minute volume (MV) in wakeful (Awake) and sleeping (Asleep) rabbits and during the inhalation of 5% CO2 (CO2) or 2% sevoflurane (Sev 2%) or 4% sevoflurane (Sev 4%). *p < 0.05 vs. Awake, #p < 0.05 vs. Asleep, $p < 0.05 vs. CO2, §p < 0.05 vs. Sev 2%.
Autocorrelation Analyses
The 12 data series for each respiratory variable in each stage were categorized based on the sign (positive or negative) of their first order autocorrelation coefficients. For those variables for which the distribution of autocorrelation coefficients was dependent on protocol stage (VT and TI), the numbers of these categorized data series are presented in Table 1. For VT, positive autocorrelations were less frequent in Sev 4% than in the Awake and CO2 stages (p < 0.05 for both). Furthermore, the higher concentration of sevoflurane significantly reduced the frequency of positive autocorrelation coefficients compared to the Asleep stage for TI (p < 0.05).
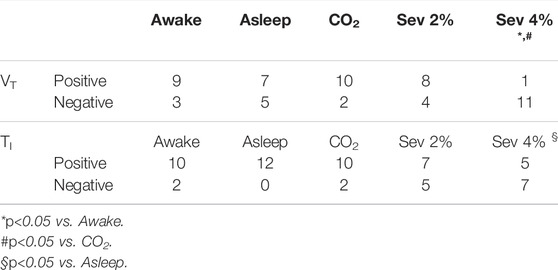
TABLE 1. Number of data series of tidal volume (VT) and inspiratory time (TI) with positive or negative autocorrelation coefficients at lag one breath. (Sev: sevoflurane).
Partitioning of Total Variance Into Noise, Correlated Behavior, and Oscillatory Behavior
The relative contributions of noise, correlated behavior, and oscillatory behavior to the total variance of VT and TITI as primary outcome variables are demonstrated in Table 2. No significant difference was found in the relative contributions of noise, correlated behavior, and oscillatory behavior to the total variance of VT, TE or VT/TI between the protocol stages. In comparison to the Awake and Asleep conditions, both 2 and 4% sevoflurane significantly decreased the relative contribution of correlated behavior to the variance of TI (p < 0.05 for all). The variance attributed to oscillatory behavior did not differ between the protocol stages in any of the analyzed variables.
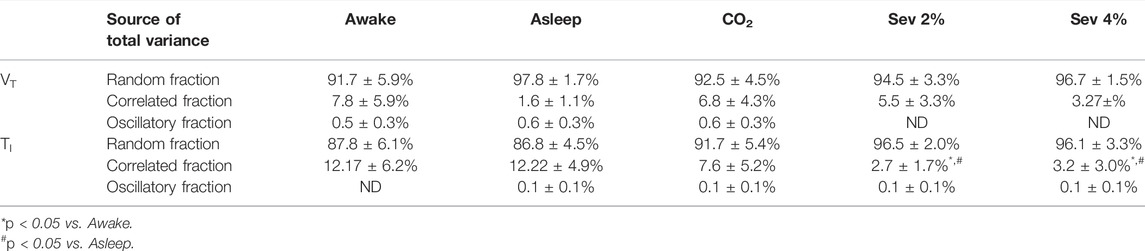
TABLE 2. Fractions of total variance of tidal volume (VT) and inspiratory time (TI) attributed to random, correlated, and oscillatory components under the different protocol stages (Sev: sevoflurane, ND: not detectable). Data are presented as mean ± 95% confidence interval of the mean.
Discussion
In the present experimental study, we investigated the changes in the variability of spontaneous breathing occurring under hypercapnia and sevoflurane. Whereas our results using the absolute values confirmed the effect of CO2 and sevoflurane on ventilation parameters, both interventions significantly diminished the physiological variability of VT, TI and RR. Our data analysis revealed that an anesthetic concentration of sevoflurane decreased the frequency of occurrence of positive first order autocorrelations in VT and TI. Furthermore, both sedative and anesthetic concentrations of sevoflurane diminished the contribution of correlated behavior to the total variance of TI.
Methodological Considerations
The experiments were designed in an attempt to mimic clinical conditions encountered under sedation with hypoventilation and subsequent hypercapnia. To identify the effect of CO2 independent of respiratory depression caused by sedation, we administered 5% CO2 to the inspired gas in awake rabbits. A non-invasive measurement method was used in the present study to minimize any interference with the spontaneous breathing, since invasive measurements such as repeated arterial blood sampling, end-tidal CO2, electroencephalography or other monitoring apparatus would have biased the recordings of spontaneous breathing patterns. Therefore, the sleeping state achieved spontaneously after the awake condition could only be verified by visual inspection. Despite the lack of electroencephalography confirmation of the sleeping activity, several behavioral aspects of sleep in rabbits were verified through the camera feed, including body posture, depression of the ears, extension of the hindlimbs, cessation of nostril movements (Pivik et al., 1986; Aguilar-Roblero and González-Mariscal, 2020). Additionally, in accordance with 3R (Replacement, Reduction, Refinement) principles, respiratory volume calibration involving invasive ventilation was performed for only one of the rabbits, and the obtained calibration factor was applied to all animals since the box properties were constant. Thus, the results on VT, MV and VT/TI were estimated with the constant calibration factor for all rabbits. It is important to note, however, that within-subject changes and indices of variability were the focus of interest in the present study, and these are not affected by the calibration factor.
The order of protocol stages was not randomized, instead, it was set so that each stage had minimal influence on the following. Sevoflurane was applied last to avoid post-anesthetic effects in the following stages. Moreover, since CO2 5% stage preceded sevoflurane, the effects of hypercapnia and CO2 rebreathing could potentially interfere with the breathing pattern under anesthesia. To avoid such interference, a continuous fresh gas flow in the box environment was ensured and the CO2 concentration was continuously monitored. Even during sevoflurane stages, the CO2 content of the box gas was <0.3%. Thus, CO2 rebreathing did not affect the minute ventilation during sevoflurane stages.
Changes in Absolute Values of Respiratory Variables
Our results for the mean absolute values obtained under spontaneous breathing are in accordance with well-established observations concerning the effects of sleep (Douglas et al., 1982a), sedation and hypercapnia on VT, respiratory times and rate. While VT was similar between awake and asleep stages, the RR was lower during sleep. A possible explanation for these observations is anxiety-related hyperpnea of rabbits during the awake stage (Schroeder and Smith, 2011; Atalan et al., 2019) and its cessation during sleep. Furthermore, a lower metabolic rate and chemosensitivity to both oxygen (Douglas et al., 1982b) and carbon dioxide during sleep (Douglas et al., 1982c) might explain a diminished RR and MV.
Regarding the effect of hypercapnia, the significant increases in MV resulted from an altered breathing pattern, in which the markedly increased VT outweighed the decreases in RR. The decreased RR is somewhat contradictory to previous results demonstrating that hypercapnia increased MV via simultaneous elevations in VT and RR in humans, cats, and rats (Eckenhoff and Helrich, 1958; Read, 1967; Clark and von Euler, 1972; Peever and Stephenson, 1997; Seifert and Mortola, 2002). However, previous reports in rabbits (as well as in cats, dogs, and sheep) demonstrated that respiratory frequency can also decrease with CO2 concentration rising in the inspired air (Hoover et al., 1970; Jennings and Macklin, 1972; Romo-Salas et al., 1978; Maskrey and Nicol, 1980; Szlyk and Jennings, 1987). In these reports, the respiratory frequency is described to shift towards an optimal value that results in maximum CO2 elimination, depending on the CO2 concentration and the initial frequency. In our study, the respiratory rate in the Awake stage may be attributed to the initial anxiety of the animal elicited by the laboratory setting despite the 1-week acclimatization period (Schroeder and Smith, 2011; Atalan et al., 2019). The respiratory rates were comparable to those reported in a previous study in rabbits (Shafford and Schadt, 2008), in which a similarly observed rapid breathing was accompanied by normal arterial CO2 partial pressure (PaCO2, 36 mmHg). Despite this behavioral aspect, the rabbit is considered to be an excellent model for respiratory research (Keir and Page, 2008), at least with several advantages over rodents, with anatomy-physiology features that are close to humans. As such, we consider that our findings are possible to extrapolate to humans, at least in terms of the variability indices and trends.
Sevoflurane inhalation led to a dose-dependent decrease in MV, which is in agreement with experimental (Wallin et al., 1975) and clinical observations (Doi and Ikeda, 1987; Brown et al., 1998). Nevertheless, there is a discrepancy between clinical and experimental studies on the contribution of VT and RR to the sevoflurane-induced changes in MV. The dominating effect of the decreased RR over the somewhat increased VT observed in the present study are in accordance with previous observations in mice and dogs (Wallin et al., 1975). In contrast, sevoflurane in human subjects causes a dose-dependent decrease in VT that outweighs the compensatory increase in RR (Doi and Ikeda, 1987).
Changes in Coefficients of Variation of Respiratory Variables
As the main finding of the present study, we observed significant changes in the indices of variability of spontaneous breathing following CO2 and sevoflurane inhalation. In agreement with previous reports in neonates (Hathorn, 1974) and adults (Tobin et al., 1995), VT and RR exhibited normal distributions, with coefficients of variation ranging between 5 and 30%, depending on the experimental stage.
Even though respiratory variability has a random component (noise) arising from external or internal sources, periodic fluctuations in RR and VT do occur. Briefly, an incidental change in PaCO2 can be overcorrected due to the temporal delays in both the afferent and efferent limbs of the chemoreceptor feedback loop, resulting in an even greater excursion of PaCO2. On one hand, if the magnitude at which changes in ventilation are translated into changes in PaCO2 (plant gain) or the strength of the chemoreceptor response (controller gain) are high enough, sustained oscillations in ventilation can develop (Khoo, 2000). On the other hand, decrements in either gain mechanism in the feedback loop can result in a less variable breathing pattern. For instance, administration of hypercapnic gas mixtures has been shown to abolish periodic breathing (Cherniack et al., 1979) by reducing plant gain via decreasing the relative amplitude of variations in alveolar CO2 tension (Farhi and Rahn, 1955). This mechanism explains the significantly lower variability in all measured variables observed during the CO2 stage in the current study.
Attenuation of loop gain might also be responsible for the decreased CVs of all measured variables under sevoflurane. Although the effect of sevoflurane on loop gain (the product of plant gain and controller gain) has not yet been investigated, a previous study demonstrated the ability of another general anesthetic acting on GABAA receptors, propofol, to decrease loop gain in patients with brain damage (Klimathianaki et al., 2010).
Changes in Correlated Behavior of Respiratory Variables
Whereas first order autocorrelation was the most frequent during hypercapnia, significantly lower CVs were observed for each respiratory variable. This finding is in accordance with the enhanced positive autocorrelations in VT reported in rats under hypercapnia (Khatib et al., 1991). The increased occurrence of negative autocorrelations observed under sevoflurane can be explained by the dominance of the peripheral chemoreceptor feedback loop over the central chemoreflex (Khatib et al., 1991). This imbalance between the two control mechanisms can result from the attenuation of the central chemoreflex by sevoflurane, which has been suggested to occur at deeper levels of sedation (van den Elsen et al., 1998).
Conclusion
In summary, fundamental differences were observed in the variability of spontaneous breathing between physiological sleep and sevoflurane-induced anesthesia. While physiological sleep had no effect on the breathing variability, sevoflurane diminished markedly the fluctuations in respiratory volume, inspiratory airflow and breathing frequency. Since natural variability in tidal volume and respiratory rate facilitate alveolar recruitment and ventilation-perfusion matching, reduced breathing variability may increase the risk of atelectasis development during procedures under sevoflurane in which spontaneous breathing is maintained.
Data Availability Statement
The raw data supporting the conclusions of this article will be made available by the authors, without undue reservation.
Ethics Statement
The animal study was reviewed and approved by Animal Welfare Committee of the Canton of Geneva Experimental Ethics Committee of the University of Geneva, Switzerland.
Author Contributions
AB: data collection, data analysis, statistical evaluation and drafting the manuscript. RS: study design, data collection and drafting the manuscript. FP: study design, statistical evaluation and drafting the manuscript. WH: study design and drafting the manuscript. AR: study design, data collection, data analysis and drafting the manuscript.
Funding
This study was funded through a scientific grant attributed to WH from the Swiss National Science Foundation (FNRS 32003B_169334).
Conflict of Interest
The authors declare that the research was conducted in the absence of any commercial or financial relationships that could be construed as a potential conflict of interest.
Publisher’s Note
All claims expressed in this article are solely those of the authors and do not necessarily represent those of their affiliated organizations, or those of the publisher, the editors and the reviewers. Any product that may be evaluated in this article, or claim that may be made by its manufacturer, is not guaranteed or endorsed by the publisher.
Acknowledgments
The authors would like to thank Xavier Belin and Sylvie Roulet for their technical assistance in animal handling, housing and study preparations.
Abbreviations
ANOVA, analysis of variance; CO2, carbon dioxide; CV, coefficient of variation (ratio of the standard deviation and the mean); GABAA, gamma-aminobutyric acid type a; MV, minute volume; PaCO2, CO2 partial pressure; RR, respiratory rate; Sev 2% and Sev 4%: 2% sevoflurane and 4% sevoflurane in room air, respectively; TI, inspiratory time; TE, expiratory time; VT, tidal volume; WBP, whole-body plethysmography.
References
Aguilar-Roblero R., González-Mariscal G. (2020). Behavioral, Neuroendocrine and Physiological Indicators of the Circadian Biology of Male and Female Rabbits. Eur. J. Neurosci. 51 (1), 429–453. doi:10.1111/ejn.14265
Atalan G., Atalan G., Erol H., Erol M., Atasever A., Doğan Z., et al. (2019). Comparison of Systemic Effects of Midazolam, Ketamine, and Isoflurane Anaesthesia in Rabbits. J. Vet. Res. 63 (2), 275–283. doi:10.2478/jvetres-2019-0035
Bradley B. D., Green G., Ramsay T., Seely A. J. E. (2013). Impact of Sedation and Organ Failure on Continuous Heart and Respiratory Rate Variability Monitoring in Critically Ill Patients. Crit. Care Med. 41 (2), 433–444. doi:10.1097/ccm.0b013e31826a47de
Brioni J. D., Varughese S., Ahmed R., Bein B. (2017). A Clinical Review of Inhalation Anesthesia with Sevoflurane: from Early Research to Emerging Topics. J. Anesth. 31 (5), 764–778. doi:10.1007/s00540-017-2375-6
Brown K., Aun C., Stocks J., Jackson E., Mackersie A., Hatch D. (1998). A Comparison of the Respiratory Effects of Sevoflurane and Halothane in Infants and Young Children. Anesthesiology 89 (1), 86–92. doi:10.1097/00000542-199807000-00015
Cherniack N. S., von Euler C., Homma I., Kao F. F. (1979). Experimentally Induced Cheyne-Stokes Breathing. Respiration Physiol. 37 (2), 185–200. doi:10.1016/0034-5687(79)90070-7
Clark F. J., von Euler C. (1972). On the Regulation of Depth and Rate of Breathing. J. Physiol. 222 (2), 267–295. doi:10.1113/jphysiol.1972.sp009797
Dejours P., Puccinelli† R., Armand J., Dicharry M. (1966). Breath-to-breath Variations of Pulmonary Gas Exchange in Resting Man. Respiration Physiol. 1 (3), 265–280. doi:10.1016/0034-5687(66)90046-6
Doi M., Ikeda K. (1987). Respiratory Effects of Sevoflurane. Anesth. Analgesia 66 (3), 241–244. doi:10.1213/00000539-198703000-00007
Douglas N. J., White D. P., Weil J. V., Pickett C. K., Martin R. J., Hudgel D. W., et al. (1982). Hypoxic Ventilatory Response Decreases during Sleep in normal Men. Am. Rev. Respir. Dis. 125 (3), 286–289. doi:10.1164/arrd.1982.125.3.286
Douglas N. J., White D. P., Weil J. V., Pickett C. K., Zwillich C. W. (1982). Hypercapnic Ventilatory Response in Sleeping Adults. Am. Rev. Respir. Dis. 126 (5), 758–762. doi:10.1164/arrd.1982.126.5.758
Douglas N. J., White D. P., Pickett C. K., Weil J. V., Zwillich C. W. (1982). Respiration during Sleep in normal Man. Thorax 37 (11), 840–844. doi:10.1136/thx.37.11.840
Eckenhoff J. E., Helrich M. (1958). The Effect of Narcotics, Thiopental and Nitrous Oxide upon Meeting Abstracts and Respiratory Response to Hypercapnia. Anesthesiology 19 (2), 240–253. doi:10.1097/00000542-195803000-00012
Farhi L. E., Rahn H. (1955). Gas Stores of the Body and the Unsteady State. J. Appl. Physiol. 7 (5), 472–484. doi:10.1152/jappl.1955.7.5.472
Fiamma M.-N., Straus C., Thibault S., Wysocki M., Baconnier P., Similowski T. (2007). Effects of Hypercapnia and Hypocapnia on Ventilatory Variability and the Chaotic Dynamics of Ventilatory Flow in Humans. Am. J. Physiology-Regulatory, Integr. Comp. Physiol. 292 (5), R1985–R1993. doi:10.1152/ajpregu.00792.2006
Frey U., Silverman M., Barabási A. L., Suki B. (1998). Irregularities and Power Law Distributions in the Breathing Pattern in Preterm and Term Infants. J. Appl. Physiol. 85 (3), 789–797. doi:10.1152/jappl.1998.85.3.789
Goodman N. W., Black A. M. S., Carter J. A. (1987). Some Ventilatory Effects of Propofol as Sole Anaesthetic Agent. Br. J. Anaesth. 59 (12), 1497–1503. doi:10.1093/bja/59.12.1497
Hathorn M. K. S. (1974). The Rate and Depth of Breathing in New-Born Infants in Different Sleep States. J. Physiol. 243 (1), 101–113. doi:10.1113/jphysiol.1974.sp010744
Hoover W. H., Young P. J., Sawyer M. S., Apgar W. P. (1970). Ovine Physiological Responses to Elevated Ambient Carbon Dioxide. J. Appl. Physiol. 29 (1), 32–35. doi:10.1152/jappl.1970.29.1.32
Huhle R., Pelosi P., de Abreu M. G. (2016). Variable Ventilation from Bench to Bedside. Crit. Care 20, 62. doi:10.1186/s13054-016-1216-6
Hyndman R. J., Khandakar Y. (2008). Automatic Time Series Forecasting: TheforecastPackage forR. J. Stat. Softw. 27 (3), 1–22. doi:10.18637/jss.v027.i03
Jennings D. B., Macklin R. D. (1972). The Effects of O2 and CO2 and of Ambient Temperature on Ventilatory Patterns of Dogs. Respiration Physiol. 16 (1), 79–91. doi:10.1016/0034-5687(72)90090-4
Jubran A., Grant B. J., Tobin M. J. (1997). Effect of Hyperoxic Hypercapnia on Variational Activity of Breathing. Am. J. Respir. Crit. Care Med. 156 (4 Pt 1), 1129–1139. doi:10.1164/ajrccm.156.4.97-01080
Keir S., Page C. (2008). The Rabbit as a Model to Study Asthma and Other Lung Diseases. Pulm. Pharmacol. Ther. 21 (5), 721–730. doi:10.1016/j.pupt.2008.01.005
Khatib M. F., Oku Y., Bruce E. N. (1991). Contribution of Chemical Feedback Loops to Breath-To-Breath Variability of Tidal Volume. Respiration Physiol. 83 (1), 115–127. doi:10.1016/0034-5687(91)90097-3
Khoo M. C. (2000). Determinants of Ventilatory Instability and Variability. Respir. Physiol. 122 (2-3), 167–182. doi:10.1016/s0034-5687(00)00157-2
Klimathianaki M., Kondili E., Alexopoulou C., Prinianakis G., Georgopoulos D. (2010). Effect of Propofol on Breathing Stability in Adult ICU Patients with Brain Damage. Respir. Physiol. Neurobiol. 171 (3), 232–238. doi:10.1016/j.resp.2010.03.011
Ma B., Suki B., Bates J. H. T. (2011). Effects of Recruitment/derecruitment Dynamics on the Efficacy of Variable Ventilation. J. Appl. Physiol. 110 (5), 1319–1326. doi:10.1152/japplphysiol.01364.2010
Maskrey M., Nicol S. C. (1980). The Respiratory Frequency Response to Carbon Dioxide Inhalation in Conscious Rabbits. J. Physiol. 301, 49–58. doi:10.1113/jphysiol.1980.sp013187
Modarreszadeh M., Bruce E. N., Gothe B. (1990). Nonrandom Variability in Respiratory Cycle Parameters of Humans during Stage 2 Sleep. J. Appl. Physiol. 69 (2), 630–639. doi:10.1152/jappl.1990.69.2.630
Pack A. I., Silage D. A., Millman R. P., Knight H., Shore E. T., Chung D. C. (1988). Spectral Analysis of Ventilation in Elderly Subjects Awake and Asleep. J. Appl. Physiol. 64 (3), 1257–1267. doi:10.1152/jappl.1988.64.3.1257
Peever J. H., Stephenson R. (1997). Day-night Differences in the Respiratory Response to Hypercapnia in Awake Adult Rats. Respiration Physiol. 109 (3), 241–248. doi:10.1016/s0034-5687(97)00056-x
Pivik R. T., Bylsma F. W., Cooper P. (1986). Sleep-wakefulness Rhythms in the Rabbit. Behav. Neural Biol. 45 (3), 275–286. doi:10.1016/s0163-1047(86)80016-4
Read D. C. (1967). A Clinical Method for Assessing the Ventilatory Response to Carbon Dioxide. Australas. Ann. Med. 16 (1), 20–32. doi:10.1111/imj.1967.16.1.20
Romo-Salas F., Aquin L., Searles, jr. J. M., Banchero N. (1978). Oxygen Cost of Breathing in Dogs. Respiration 35 (4), 186–191. doi:10.1159/000193877
Scheller M. S., Saidman L. J., Partridge B. L. (1988). MAC of Sevoflurane in Humans and the New Zealand white Rabbit. Can. J. Anaesth. 35 (2), 153–156. doi:10.1007/bf03010656
Schroeder C. A., Smith L. J. (2011). Respiratory Rates and Arterial Blood-Gas Tensions in Healthy Rabbits Given Buprenorphine, Butorphanol, Midazolam, or Their Combinations. J. Am. Assoc. Lab. Anim. 50 (2), 205–211.
Seifert E. L., Mortola J. P. (2002). Circadian Pattern of Ventilation during Acute and Chronic Hypercapnia in Conscious Adult Rats. Am. J. Physiology-Regulatory, Integr. Comp. Physiol. 282 (1), R244–R251. doi:10.1152/ajpregu.00290.2001
Shafford H. L., Schadt J. C. (2008). Respiratory and Cardiovascular Effects of Buprenorphine in Conscious Rabbits. Vet. Anaesth. Analgesia 35 (4), 326–332. doi:10.1111/j.1467-2995.2007.00383.x
Suki B., Alencar A. M., Sujeer M. K., Lutchen K. R., Collins J. J., Andrade J. S., et al. (1998). Life-support System Benefits from Noise. Nature 393 (6681), 127–128. doi:10.1038/30130
Szlyk P. C., Jennings D. B. (1987). Effects of Hypercapnia on Variability of normal Respiratory Behavior in Awake Cats. Am. J. Physiol. 252 (3 Pt 2), R538–R547. doi:10.1152/ajpregu.1987.252.3.R538
Terada Y., Ishiyama T., Asano N., Kotoda M., Ikemoto K., Shintani N., et al. (2014). Optimal Doses of Sevoflurane and Propofol in Rabbits. BMC Res. Notes 7 (1), 820. doi:10.1186/1756-0500-7-820
Tobin M. J., Yang K. L., Jubran A., Lodato R. F. (1995). Interrelationship of Breath Components in Neighboring Breaths of normal Eupneic Subjects. Am. J. Respir. Crit. Care Med. 152 (6 Pt 1), 1967–1976. doi:10.1164/ajrccm.152.6.8520764
van den Elsen M., Sarton E., Teppema L., Berkenbosch A., Dahan A. (1998). Influence of 0.1 Minimum Alveolar Concentration of Sevoflurane, Desflurane and Isoflurane on Dynamic Ventilatory Response to Hypercapnia in Humans. Br. J. Anaesth. 80 (2), 174–182. doi:10.1093/bja/80.2.174
Keywords: breathing variability, rabbit, wakefulness, sleep, sedation, whole-body plethysmography, tidal volume, inspiratory time
Citation: Balogh AL, Sudy R, Petak F, Habre W and Dos Santos Rocha A (2022) Sevoflurane and Hypercapnia Blunt the Physiological Variability of Spontaneous Breathing: A Comparative Interventional Study. Front. Physiol. 13:871070. doi: 10.3389/fphys.2022.871070
Received: 07 February 2022; Accepted: 25 March 2022;
Published: 11 April 2022.
Edited by:
Peter Markus Spieth, University Hospital Carl Gustav Carus, GermanyReviewed by:
Thomas Bluth, University Hospital Carl Gustav Carus, GermanySophie Lindgren, University of Gothenburg, Sweden
Copyright © 2022 Balogh, Sudy, Petak, Habre and Dos Santos Rocha. This is an open-access article distributed under the terms of the Creative Commons Attribution License (CC BY). The use, distribution or reproduction in other forums is permitted, provided the original author(s) and the copyright owner(s) are credited and that the original publication in this journal is cited, in accordance with accepted academic practice. No use, distribution or reproduction is permitted which does not comply with these terms.
*Correspondence: Adam L. Balogh, YWRhbS5iYWxvZ2hAdW5pZ2UuY2g=