 Alexander V. Maltsev
 Michael D. Stern
 Edward G. Lakatta
 Victor A. Maltsev
94% of researchers rate our articles as excellent or good
Learn more about the work of our research integrity team to safeguard the quality of each article we publish.
Find out more
ORIGINAL RESEARCH article
Front. Physiol., 27 April 2022
Sec. Cardiac Electrophysiology
Volume 13 - 2022 | https://doi.org/10.3389/fphys.2022.845634
Each heartbeat is initiated by specialized pacemaker cells operating within the sinoatrial node (SAN). While individual cells within SAN tissue exhibit substantial heterogeneity of their electrophysiological parameters and Ca cycling, the role of this heterogeneity for cardiac pacemaker function remains mainly unknown. Here we investigated the problem numerically in a 25 × 25 square grid of connected coupled-clock Maltsev-Lakatta cell models. The tissue models were populated by cells with different degree of heterogeneity of the two key model parameters, maximum L-type Ca current conductance (gCaL) and sarcoplasmic reticulum Ca pumping rate (Pup). Our simulations showed that in the areas of Pup-gCaL parametric space at the edge of the system stability, where action potential (AP) firing is absent or dysrhythmic in SAN tissue models populated with identical cells, rhythmic AP firing can be rescued by populating the tissues with heterogeneous cells. This robust SAN function is synergistic with respect to heterogeneity in gCaL and Pup and can be further strengthened by clustering of cells with similar properties. The effect of cell heterogeneity is not due to a simple summation of activity of intrinsically firing cells naturally present in heterogeneous SAN; rather AP firing cells locally and critically interact with non-firing/dormant cells. When firing cells prevail, they recruit many dormant cells to fire, strongly enhancing overall SAN function; and vice versa, prevailing dormant cells suppress AP firing in cells with intrinsic automaticity and halt SAN function. The transitions between firing and non-firing states of the system are sharp, resembling phase transitions in statistical physics. Furthermore, robust function of heterogeneous SAN tissue requires weak cell coupling, a known property of the central area of SAN where cardiac impulse emerges; stronger cell coupling reduces AP firing rate and ultimately halts SAN automaticity at the edge of stability.
Non-firing zone—the area of Pup–gCaL parametric space where individual SAN cells lack automaticity
Chaotic firing zone—the area of Pup–gCaL parametric space where individual SAN cells generate chaotic (dysrhythmic) AP firing
Rhythmic firing zone—the area of Pup–gCaL parametric space where individual SAN cells generate rhythmic AP firing
The bifurcation line—the border line in Pup–gCaL parametric space separating firing, non-firing, and chaotic firing zones
Robustness—ability of SAN tissue to generate rhythmic APs in a wide range of model parameters: the larger rhythmic firing zone, the higher robustness of the tissue model
The coupled-clock system: a coupled system of ion current oscillator in the cell membrane and intracellular Ca oscillator of the SR inside a SAN cell. According to the coupled-clock theory, the oscillators critically interact via multiple Ca- and voltage-dependent mechanisms to generate normal SAN cell automaticity.
The sinoatrial node (SAN) of the right atrium is the heart’s primary pacemaker, providing both robust and flexible automatic electrical depolarizations that capture the surrounding atrial myocardium and drive the heartbeat. These electrical depolarizations are caused by concurrent operation of pacemaker cells residing in SAN tissue. These cells are electrical oscillators that spontaneously generate rhythmic changes of their membrane potential (Vm), producing relatively periodic spontaneous action potentials (APs) (reviews (Mangoni and Nargeot, 2008; Maltsev et al., 2014)). The SAN was discovered in 1907 (Keith and Flack, 1907). However, despite enormous amount of experimental data, numerical modeling, and plausible theories, the SAN operation remains still mysterious after all these years (Weiss and Qu, 2020).
The enigma of SAN function stems from the fact that the SAN is an extremely complex heterogeneous tissue regarding individual cell properties and their connections within the tissue (Boyett et al., 2000). Furthermore, at the cellular level, individual SAN cells operate via a complex coupled-clock paradigm (Maltsev and Lakatta, 2009; Lakatta et al., 2010), i.e. they possess not only an electrical oscillator within their cell surface membranes, but also an intracellular oscillator, sarcoplasmic reticulum (SR) that cycles Ca in-and-out via SR Ca pump (SERCA2a) and release channels, ryanodine receptors (RyRs). Ca releases via RyRs interact with Na/Ca exchanger and L-type Ca current (ICaL), and together they drive diastolic depolarization via a positive feedback mechanism (dubbed ignition (Lyashkov et al., 2018)). The synchronization of molecular actions, in turn, is driven by enhanced enzymatic activity of Ca-activated adenylate cyclases (AC1 and AC8) (Mattick et al., 2007; Younes et al., 2008) and protein kinases (PKA and CaMKII) (Vinogradova and Lakatta, 2009; Lakatta et al., 2010) that modulate respective ion channel properties and accelerate Ca pumping.
The expression of Ca cycling proteins, and membrane ion channels vary substantially among individual SAN cells (Honjo et al., 1996; Honjo et al., 1999; Lei et al., 2001; Musa et al., 2002; Monfredi et al., 2017). For example, ICaL density varies by an order of magnitude (Monfredi et al., 2017) (Figure 1A, red squares). This results in a large degree of functional heterogeneity among individual cells, ranging from frequently and rhythmic AP firing to infrequently and dysrhythmic firing, to nonfiring cells (recently dubbed “dormant” cells) (Kim et al., 2018; Tsutsui et al., 2018; Tsutsui et al., 2021). The SAN cell population is also extremely heterogeneous with respect to the AP firing rate increase in response to β-adrenergic stimulation (Kim et al., 2021).
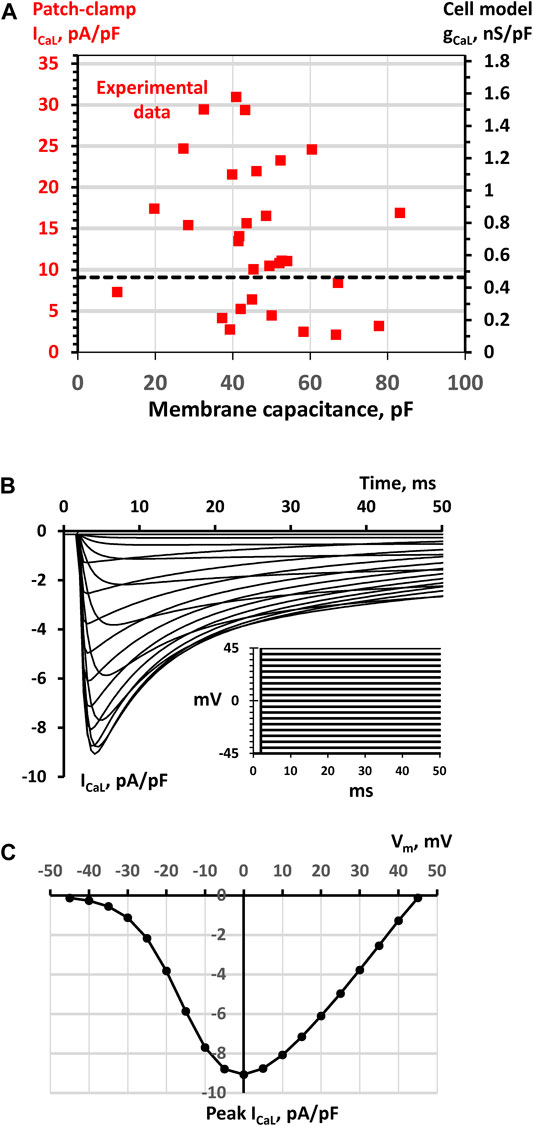
FIGURE 1. SAN cell model simulations to match model parameter gCaL to ICaL density measured experimentally (A) A double Y scale plot of experimental data points of ICaL densities measured by whole-cell patch clamp in a large population of SAN cells (red squares, left Y axis, replotted from (Monfredi et al., 2018)) and respective model gCaL parameter values (right Y axis) (B) Traces of ICaL/Vm relationship simulated in Maltsev-Lakatta single cell model with the basal state value of gCaL = 0.464 nS/pF using voltage clamp protocol (inset) and conditions similar to those in experimental study of (Monfredi et al., 2018). The family of ICaL traces was simulated by applying a series of square voltage pulses from a holding potential of -45 mV with a step of 5 mV up to 45 mV (inset). Before each stimulation, ICaL activation and inactivation gating variables fL and dL were set to their steady-state values. To closely simulate experimental whole-cell patch clamp conditions in (Monfredi et al., 2018), 5 mM EGTA (equilibrated to 100 nM of free Ca) was added to Ca formulations of cell submembrane space and cytoplasm (C) Respective ICaL/Vm relationship calculated for peak ICaL. The ICaL peak of 9.068 pA/pF at 0 mV was set as a bridge between experimental data and model gCaL = 0.464 nS/pF (black dash line in panel A).
At the SAN tissue level, it was initially thought that a “master” pacemaker cell or a leading pacemaker center dictates the excitation rate and rhythm of other SAN pacemaker cells (Sano et al., 1978; Bleeker et al., 1980). Subsequent studies suggested that individual cells mutually entrain each other to fire APs with a common period (dubbed “democratic” process) (Jalife, 1984; Michaels et al., 1987). More recent high-resolution imaging of intact SAN tissue at a single cell level, however, demonstrated that while majority of SAN cells indeed fire synchronously with a common period, many cells fire “at will”, i.e. at various rates and irregularly, or remain silent, generating only local Ca releases (Bychkov et al., 2020; Fenske et al., 2020). Thus, how structural and functional heterogeneities within and among SAN cells give rise to synchronized AP firing at the SAN exits remains a mystery at the frontier of pacemaker research (Clancy and Santana, 2020; Weiss and Qu, 2020).
Numerical modeling is a powerful approach to study complex cell interactions. Here we used a modified 2-dimensional model of SAN tissue developed by Campana (Campana, 2015), featuring faster parallel computing via graphics processing unit (GPU) to test the hypothesis that functional heterogeneity of cells within SAN tissue increases robustness of its pacemaker function. To this end, we adapted the model of SAN tissue to include diverse cell populations with respect to maximum SR Ca pumping rate (Pup) and ICaL conductance (gCaL) as observed experimentally (Honjo et al., 1996; Monfredi et al., 2017) (Figure 1A; Table 1) and examined SAN function at the edge of the system stability at different cell-to-cell coupling strength.
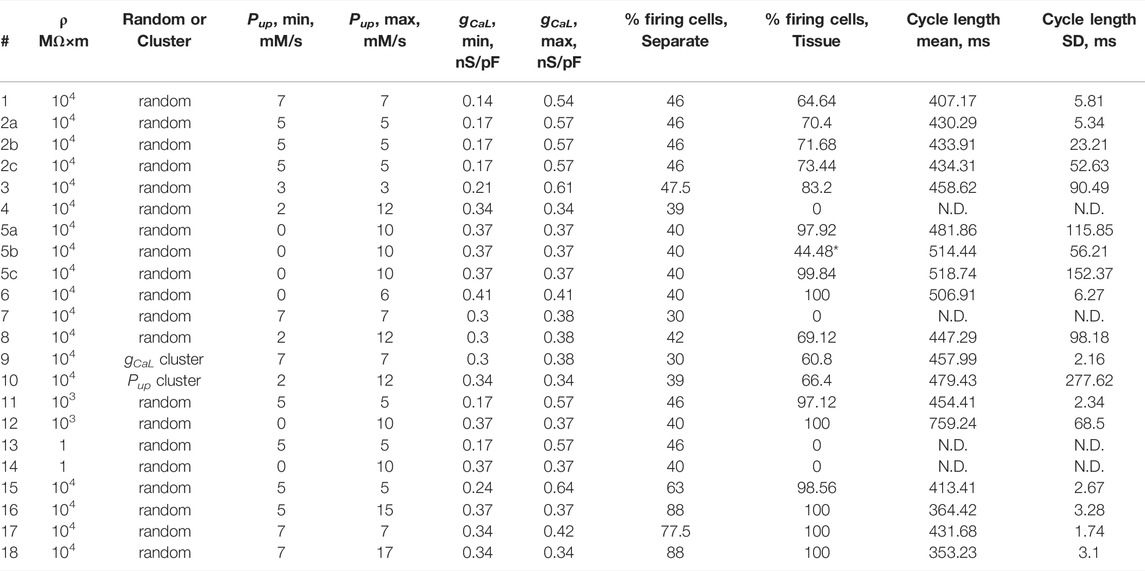
TABLE 1. Parameter values in each model simulation scenario (column #) and results of our simulations during evaluation time interval from 5 to 7.5 s after simulation onset: the percentage of AP firing cells in tissue, the percentage of cells firing APs in isolation, and AP cycle length average with its standard deviation (SD) calculated for all AP firing cells populating SAN tissue model (25 × 25 square grid) in each scenario. N.D. means “Not Defined” in scenarios, in which SAN tissue did not fire APs. Numerical simulations for the two sets of scenarios (2a, 2b, and 2c) or (5a, 5b, and 5c) were performed with different seed values for random number generator to create different cells populations with respect to gCaL or Pup, respectively. *44.48% of AP firing cells reflects firing only during initial part of the evaluation time interval in scenario 5b; the tissue model ceased firing at about 6 s (see Supplementary Movies S5B).
Our SAN tissue model is comprised of single cell models developed by Maltsev and Lakatta in 2009 (Maltsev and Lakatta, 2009). Each model encompasses a system of 29 first order differential equations (see state variables y1-y29 in Table 2). This was the first SAN cell numerical model featuring coupled operation of Ca and membrane clocks. The model predicted the contribution of spontaneous Ca release during diastolic depolarization via activation of inward Na/Ca exchanger current that explained numerous experimental data. The computer code for the original model can be freely downloaded in CellML format (maltsev_2009_paper.cellml) at http://models.cellml.org/workspace/maltsev_2009 and executed using the Cellular Open Resource (COR) software developed at the University of Oxford by Garny et al. (Garny et al., 2009) (for recent development of the COR see http://www.opencor.ws/).
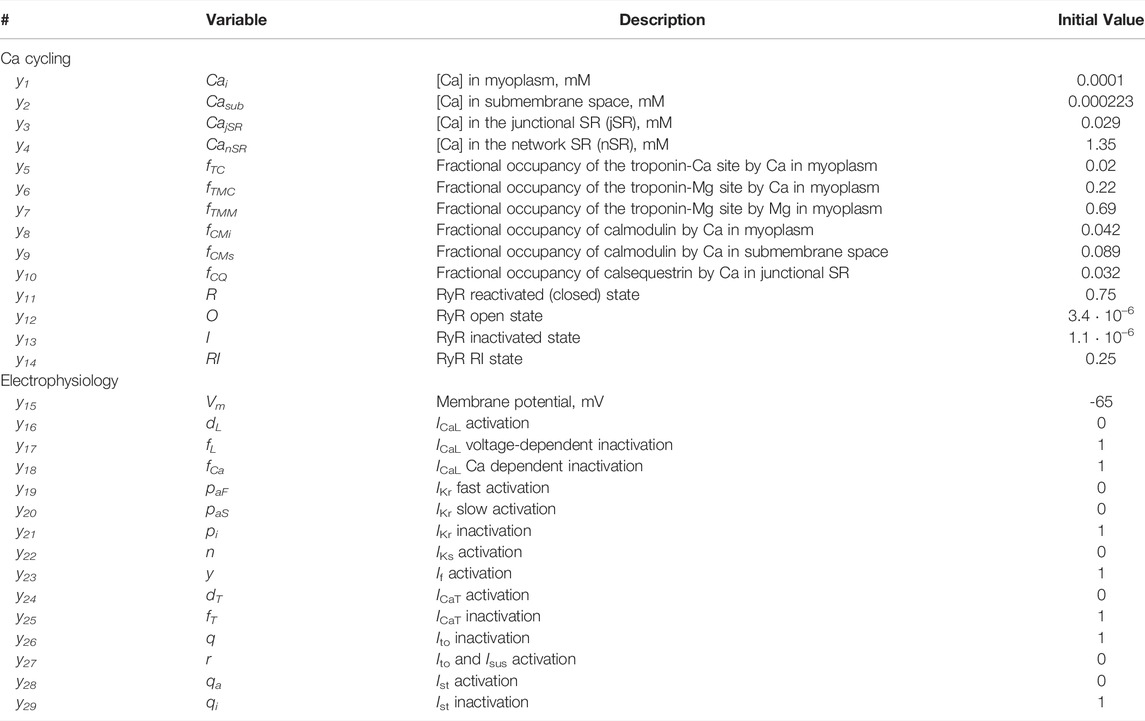
TABLE 2. State variables y1-y29 with their descriptions and initial values assigned to all cells in our SAN tissue model simulations.
Since 2009, the model has been tested, modified and used in numerous applications (Maltsev and Lakatta, 2010; Kurata et al., 2012; Severi et al., 2012; Maltsev and Lakatta, 2013; Campana, 2015; Sirenko et al., 2016; Kim et al., 2018; Lyashkov et al., 2018; Yang et al., 2021). According to the coupled-clock theory, a coupled system of Ca and surface membrane “clocks” can provide the robustness and flexibility required for normal pacemaker cell function. A simple numerical release-pumping-delay Ca oscillator is capable of generating any frequency between 1.3 and 6.1 Hz, but cannot generate high-amplitude signals without the assistance of membrane clocks (Maltsev and Lakatta, 2009). The coupled-clock system utilizes the greater flexibility of the SR Ca clock while simultaneously accounting for the large Ca oscillation amplitudes fueled via sarcolemmal Ca influx associated with ICaL. A modern interpretation of the coupled-clock function is that Ca clock operates via a criticality mechanism, whereas the membrane clock operates as a limited cycle oscillator, comprising a highly efficient, synergistic pacemaker cell system (Weiss and Qu, 2020).
The present study examined performance of SAN tissue that was modelled as a square grid of 25 by 25 of Maltsev-Lakatta cell models (Maltsev and Lakatta, 2009), with each cell being connected to its four neighbors (except those on the border). Our model was an adapted version of the tissue model originally developed by Campana (Campana, 2015). The final numerical approximation of reaction-diffusion equation to compute voltage in a 2-dimensional network of SAN cells was as follows (Equation (2.7) in (Campana, 2015)):
Where Vm[m] is Vm of the cell with index m within the cellular network represented by a vector (1..number of cells); x is the state variable array; for each time step, m and n denote the same cell, only in two different vectors and x[n] represents the value assumed by Vm[m] at the previous time step; Vnet is the sum of voltages from the four neighboring cells (right, left, up, and down): Vnet = Vnet_R + Vnet_L + Vnet_U + Vnet_D (Figure 2); step is the model integration time step of 0.005 ms; rad is the cell radius of 4 μm; ρ is the intracellular resistivity of 104 MΩ·m; Cm is the electrical membrane capacitance of 32 pF; deltx is the cell length of 70 μm; Iion is the sum of all ion currents; stim is stimulus current (stim = 0 in our study).
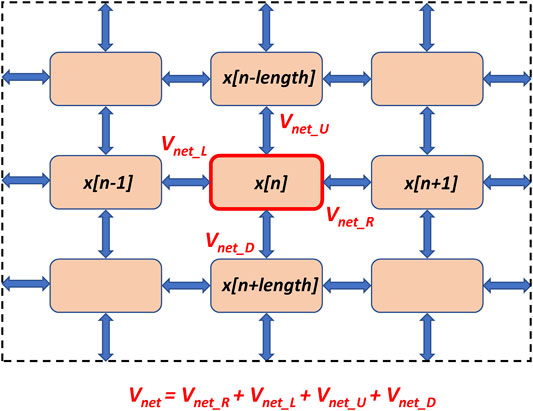
FIGURE 2. A schematic illustration of SAN tissue structure and calculation of the network voltage (Vnet) for a cell with index n in Campana model (Campana, 2015). Pink squares denote individual SAN cells (Maltsev-Lakatta models) located at the nodes of a square grid. The cells interact via intercellular conductances placed uniformly at the grid’s edges (shown by blue double-headed arrows). Vnet is the sum of voltages from the four neighboring cells (right, left, up, and down). Shown is only a 3 × 3 section the network; the tissue continues beyond the dash lines to form the entire 25 × 25 cell network used in our simulations.
Tissue heterogeneity was introduced in the model by varying Pup and gCaL, the two key parameters of the coupled-clock system (Maltsev and Lakatta, 2009). Pup determines the rate at which Ca is pumped into the SR by SERCA2a to reach a threshold of Ca load required for activation of Ca release, i.e. a central part in the timing mechanism of the coupled-clock system (Maltsev and Lakatta, 2009; Imtiaz et al., 2010; Vinogradova et al., 2010; Stern et al., 2014; Maltsev et al., 2017b). Our cell model approximated Ca uptake flux jup to the network SR compartment as a function of cytoplasmic [Ca] (Cai) as suggested originally by Luo and Rudy (Luo and Rudy, 1994) in ventricular cells and subsequently used in SAN cell models, e.g. (Kurata et al., 2002; Maltsev and Lakatta, 2009; Severi et al., 2012):
where Kup = 0.6 · 10–3 mM is Cai for a half-maximal Ca uptake to the network SR. Some early studies suggested that phospholamban phosphorylation increases the apparent affinity of the Ca-ATPase for Ca (Tada and Inui, 1983), i.e. Kup in our formulation. But further studies suggested that dephosphorylated phospholamban acts as an inhibitor of the Ca-ATPase and that phosphorylation releases the inhibition (Inui et al., 1986), i.e. Pup. Phospholamban can also operate as an oligomer (Glaves et al., 2019) pointing to a complex regulation of SERCA function. Because our study is not focused on SERCA regulation, we chose only one parameter Pup representing the performance of the Ca clock in our simulations of the coupled clock system (Maltsev and Lakatta, 2009).
There is an additional reason to examine specifically Pup in our tissue models: Pup and gCaL and their combinations are the most examined parameters in previous theoretical studies with respect to SAN cell function (Maltsev and Lakatta, 2009, 2010; Kurata et al., 2012; Severi et al., 2012; Maltsev and Lakatta, 2013), including 2-dimensional parametric sensitivity analysis, i.e. Pup-gCaL bifurcation diagram (Maltsev and Lakatta, 2009) that is used in the present study. This approach allowed us to plan and interpret our simulations not only for variations of either Pup or gCaL, but importantly for simultaneous variations of Pup and gCaL, i.e. interactions of the clocks, providing new insights into the system function.
ICaL as a function of Vm, submembrane [Ca] (Casub), and time (t) was approximated as follows (for more details, see (Maltsev and Lakatta, 2009)):
where, υι = dL, fL, fCa are respective channel gating variables of Hodgkin-Huxley type (state variables y16, y17, y18 in Table 2) with steady-state probabilities dL,∞, fL,∞, fCa,∞ and gating time constants τdL, τfL, τfCa. ECaL = 45 mV is an apparent reversal potential of ICaL and Cm = 32 pF is electric capacitance of the cell membrane.
We simulated ICaL heterogeneity of SAN tissue by varying only gCaL, maintaining all other parameters unchanged. In other terms, only number of functional channels in each cell was varied, but channel gating kinetics remained the same in all cells. We directly linked gCaL to ICaL density measured experimentally by whole patch-clamp technique under volage clamp conditions (Figure 1, see details in Results). Once we bridged our model to experimental data, we used a Pup - gCaL bifurcation diagram previously reported in single cell models (Maltsev and Lakatta, 2009) to guide our selection of Pup and gCaL distributions for cell populations that fell into parameter-dependent areas of rhythmic firing, chaotic firing, or no firing, bordering at a bifurcation line (split yellow line in Figure 3A). Since our study was focused on the system robustness, we examined the tissue operation in the areas of no firing or chaotic firing (dubbed non-firing zone and chaotic firing zone, respectively) in which individual cells lack normal automaticity but normal pacemaker function is possible in heterogeneous tissue models. The parameters for cell populations were set via a uniformly random distribution within specified ranges (Table 1).
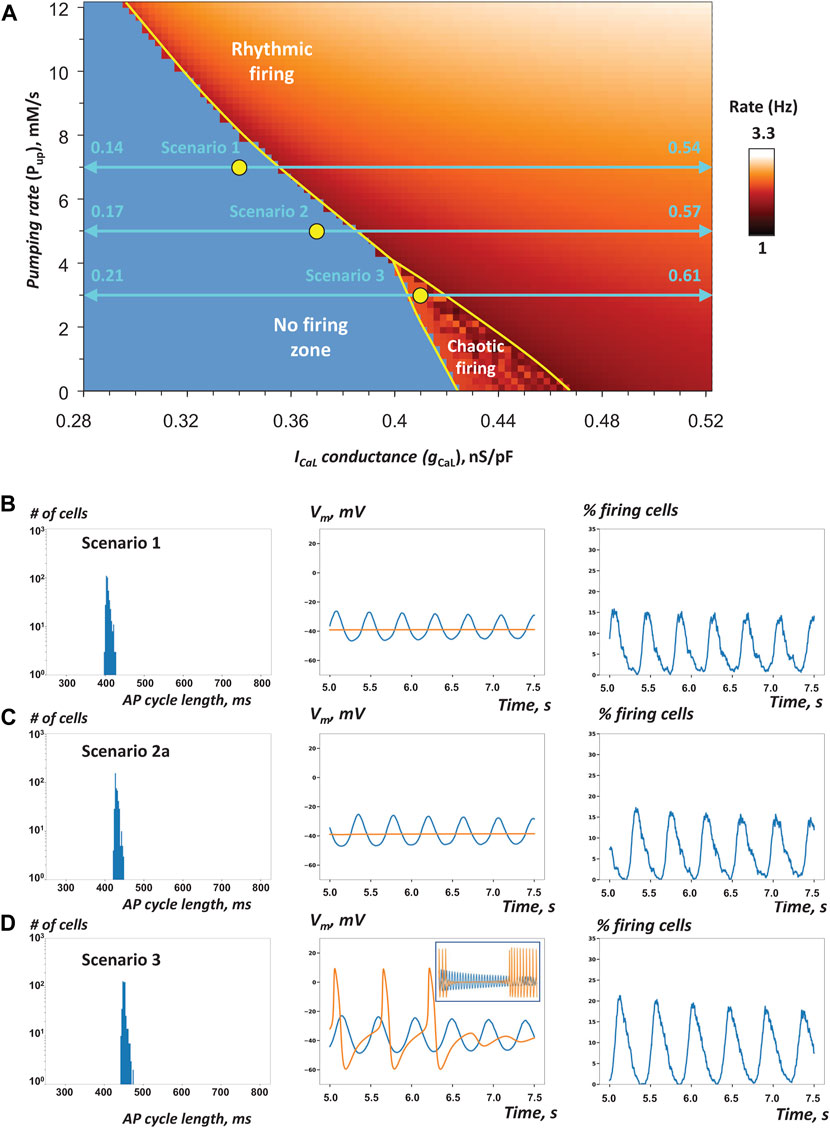
FIGURE 3. Heterogeneity in gCaL increases robustness of AP firing in SAN tissue models close to the edge of stability (A) Pup-gCaL bifurcation diagram previously reported for single SAN cell model (modified from (Maltsev and Lakatta, 2009)) shows the parametric space for rhythmic AP firing, no firing, and chaotic firing (white labels). Yellow circles show coordinates for fixed Pup and gCaL mean values (all in the non-firing zone) in cell populations used in our simulations of SAN tissue function in three specific scenarios 1, 2, and 3 (Table 1) close to the bifurcation line (yellow line). Double-headed aqua arrows show the gCaL ranges for each scenario (Note: the ranges extend beyond the diagram, with the labels showing the extensions). All three tissue models fired rhythmic APs (Supplementary Movies S1–3). B–D: Each panel shows the results of simulations in each scenario: histograms of AP cycle length distribution, space-average Vm vs time, and the percentage of firing cells (Vm > 0) vs time (from 5 to 7.5 s). In scenario 3, we extended the simulation run to 25 s. Inset in panel D (middle) shows average Vm from 5 to 25 s. Orange traces show space-average Vm vs time for the control SAN tissue model populated by identical cells with average Pup and gCaL values of the respective heterogeneous model.
In some model scenarios, we also examined effects of cell clustering within the SAN grid. In each such scenario, one simulation was performed with uniformly random distribution of cells, but the other simulation was performed with the same cell population arranged in a cluster (computer algorithm is provided in Supplementary Material). The algorithm placed the cell with the highest parameter value (Pup or gCaL) exactly at the grid center; the rest of the cell population was sorted in a descending order with respect to each cell parameter value; and the sorted cells were placed spiral-wise around the center. Thus, the last cell with the lowest parameter value was placed at the very periphery. As a result, the algorithm created a cell cluster with smooth decline of the parameter value from center to the periphery.
Our simulations of SAN tissue function were performed using a new computational approach suggested by Campana (Campana, 2015) based on CUDA technology (Compute Unified Device Architecture). A major advantage of this approach is its parallel processing via GPU that is critical to perform simulations of hundreds or even thousands cell models within SAN tissue within a reasonable time.
The model was originally written in CUDA C programming language for a GPU that featured 64 CUDA cores and 768 MB RAM (Nvidia Quadro FX 1800) (Campana, 2015). Aside from various code optimizations, we adapted the code to modern, high-performance GPUs such as the TITAN RTX graphics card (NVIDIA corp. CA, USA) featuring 4608 CUDA cores and 24 GB RAM used in the present study. One specific important improvement was that we arranged CUDA blocks in a grid, rather than in a one-dimensional array in the original code. Furthermore, random numbers were properly initialized in the main function of Central Processing Unit and copied to GPU memory to generate random values for gCaL and Pup for each cell. On average, one 7.5 s simulation of SAN tissue function took about 15 min of computation time.
All simulations began with the same initial conditions, near to the maximum diastolic potential (Table 2). In nearly all simulations, the system reached a steady pattern of AP firing (or no firing) in about 5 s. Thus, our standard simulations lasted 7.5 s, and we examined the system behaviors in the last 2.5 s. Some simulations were run longer, for 25s, when the system required more time to reach its steady AP firing pattern. The data analysis and visualizations (including movies of Vm in the tissue) were performed using in-house written programs in Python 3.10.1 (Python Software Foundation, www.python.org) and Delphi 10.4. (Embarcadero, Austin, TX). AP cycles were detected by a modified algorithm of Python library SciPy: scipy.signal.find_peaks https://docs.scipy.org/doc/scipy-1.1.0/reference/generated/scipy.signal.find_peaks.html.
All histograms of AP cycle length were shown on a semi-logarithmic scale to better illustrate and compare AP firing synchronization in various contexts.
To bridge realistic ICaL densities (measured in pA/pF by patch clamp (Monfredi et al., 2018), Figure 1A) and the model parameter, gCaL (in nS/pF), we performed voltage-clamp simulations of our single cell model (Figure 1B) with the voltage step protocol (see inset) similar to that used in experimental studies (Honjo et al., 1996; Monfredi et al., 2017). The ICaL - Vm relationship for the peak values of the simulated ICaL traces (Figure 1C) revealed a maximum peak ICaL current of 9.068 pA/pF at 0 mV with a basal state conductance of 0.464 nS/pA, bridging experimental and model data via black dash line in the dual Y scale plot in Figure 1A. In our tissue model scenarios involving a large variety of gCaL values in individual cell models, we always referred to Figure 1A to make sure that gCaL remained within the respective range of ICaL densities measured experimentally.
First, we tested the hypothesis that reported heterogeneity in ICaL density among SAN cells (i.e. gCaL in the model terms) adds robustness to AP firing within SAN tissue. We constructed scenarios in which the mean gCaL values were in the non-firing zone along the bifurcation line (yellow circles in Figure 3A), but with a substantial spread of individual gCaL values (horizontal double-headed aqua arrows). Three scenarios with different gCaL distributions were tested to ensure robustness of the simulation results. Our specific choice of gCaL range in each scenario is given in Table 1 (scenarios 1–3).
While each cell in the tissue is represented by a deterministic model of ordinary differential equations, gCaL in each cell was assigned by a random number generator within a specified range to mimic tissue heterogeneity. Therefore, we addressed possible effects of randomness in gCaL distribution by running three simulations for scenario 2 with the same model parameters, but with different seed values for random number generator (2a, 2b, 2c in Table 1).
Our simulation results for scenarios one to three are presented in Figure 3B–D and Table 1, and visualized in Supplementary Movies S1–3. The percentage of AP firing cells within the time interval from 5 to 7.5 s after simulation onset was the most important parameter, by which SAN tissue performance was evaluated (columns “% firing cells” tissue vs separate in Table 1).
In all three scenarios, rhythmic AP firing was indeed observed in our simulations of SAN heterogeneous models (Figure 3B–D, blue lines), whereas all models populated with identical cells failed to generate APs (Figure 3B–D, orange lines in middle panels). It is also important to note that percentage of firing cells in heterogenous tissue was higher than percentage of firing cells firing separately (Table 1). In scenarios 1 and 2, impulses originating within multiple areas in the grid spread in a wave-like fashion to other areas involving the majority of cells (Supplementary Movies S1, S2A–C). In scenario 3, rhythmic wave-like AP propagation recruited almost all cells (83.2%, histogram in Figure 3D, Supplementary Movies S3), despite mean values of Pup and gCaL fell into the chaotic firing zone (Figure 3A). For scenario 3, we extended our simulation to 25 s to ensure that the control model populated with identical cells indeed generated chaotic firing (orange line in Figure 3D, middle panel inset), rather than just ceased firing after 7.5 s in our shorter standard simulation run. Thus, scenario 3 explicitly shows that adding heterogeneity to gCaL can have antiarrhythmic effect: dysrhythmic (chaotic) firing in SAN tissue model populated by identical cells is shifted to rhythmic firing in the heterogeneous SAN model.
Histograms of AP firing length distribution calculated for all three scenarios (Figure 3B-D, left panels) exhibited sharp peaks between 400 and 500 ms with a relatively small standard deviation of about 10 ms (Table 1). Synchronization of AP firing among cells is also evident from grid-average Vm, oscillation amplitude (about 25 mV, middle panels) and the percentage of firing cells (Vm > 0) that oscillated with an amplitude of 15–20% (right panels).
All three simulation runs (2a, 2b, 2c in Table 1) for gCaL distribution with different seeds of random number generator exhibited, in general, well synchronized AP firing with approximately the same percentage of firing cells and average cycle length, although with substantially different standard deviations. A closer inspection of AP firing within the tissue revealed a minor population of cells in runs 2b and 2c that generated substantially longer cycle lengths that caused this difference. These cells formed clusters of chaotically firing cells (Figure 4A), whereas the same cells in isolation (Figure 4B) exhibited only rhythmic firing or no firing. Thus, the new chaotic firing behavior emerges within the cell cluster from complex interactions of cells with intrinsic automaticity and dormant cells.
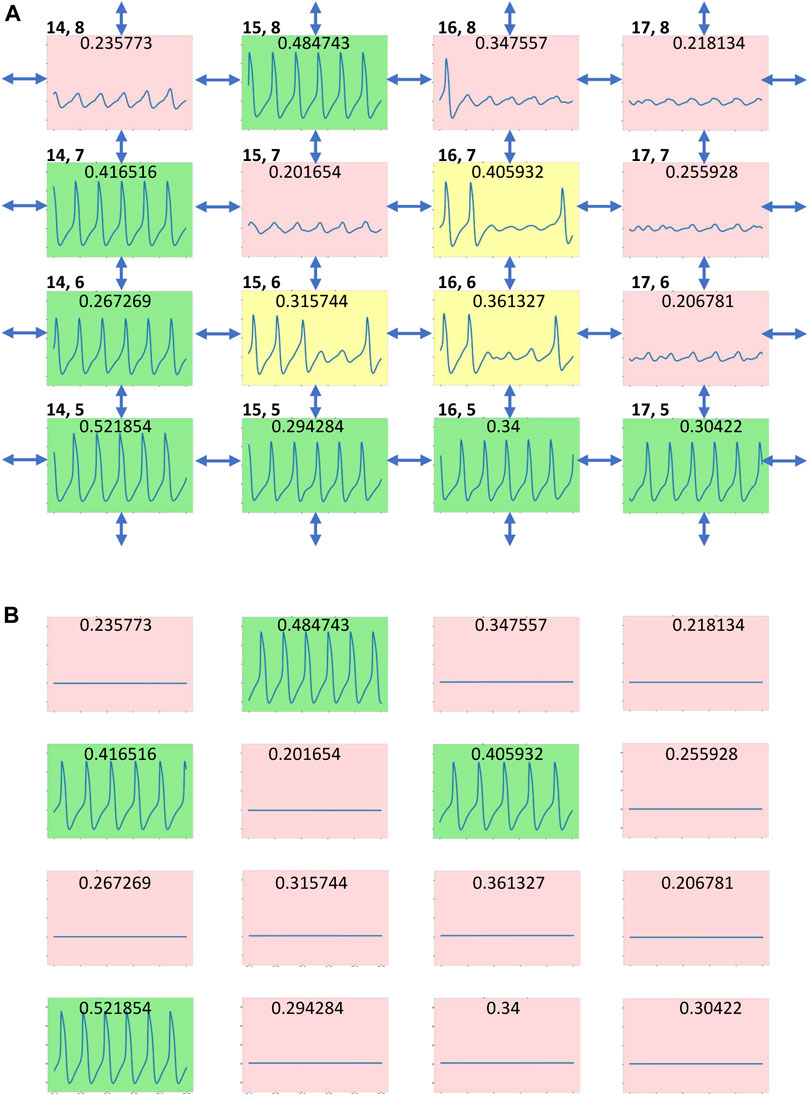
FIGURE 4. Emergence of chaotic firing in cell tissue with heterogenous gCaL distribution (A) AP firing in a tissue fragment with a local community of three chaotically firing cells in scenario 2c (Table 1, Supplementary Movies S2C) (B) the same tissue fragment when cells are not connected. Each cell is presented by its 2.5 s Vm time series (from 5 to 7.5 s after simulation onset) in a multicolor box designating cell operation mode: green - rhythmic AP firing; pink—no firing (subthreshold Vm oscillations); and yellow—chaotic firing. Double headed arrows designate cell connections. gCaL value of each cell model (in nS/pF) is shown at the top of its time series. Cell coordinates (x,y) within the tissue grid are shown in the left top corner of each subpanel. The coordinates (1,1) are set for the cell in the left bottom corner in Supplementary Movies S2C. The Vm scale in each subpanel is from -70 to 30 mV.
Next, we examined three model scenarios (4, 5, 6 in Table 1) in which Pup was uniformly randomly distributed, but gCaL was fixed to a certain value in each scenario. The Pup value in a given cell mimics the functional effect of phospholamban phosphorylation to regulate SR Ca pumping via SERCA2a. The mean values of Pup and fixed gCaL (yellow circles in Figure 5A) were chosen to move along and close to the bifurcation line, still remaining within the non-firing zone. Here we tested the specific hypothesis that adding heterogeneity to Pup in cell populating SAN tissue increases its robustness to generate rhythmic AP firing.
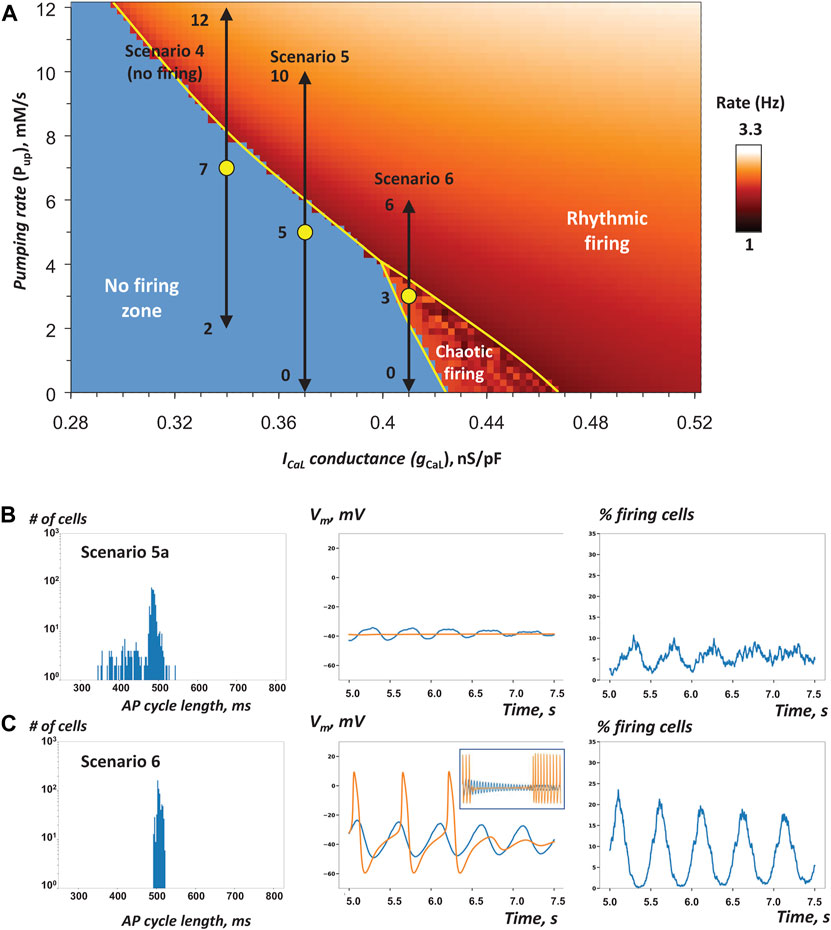
FIGURE 5. Heterogeneity in Pup increases robustness of AP firing in SAN tissue models close to the edge of stability (A) Pup-gCaL bifurcation diagram illustrating cell populations in simulations of SAN tissue function in scenarios 4, 5, and 6 (Table 1) similar to Figure 3A. Yellow circles show coordinates for mean Pup and fixed gCaL values (in non-firing and the chaotic firing zones). Black double-headed arrows show the exact Pup ranges for each scenario. The tissue model with low gCaL in scenario 4 failed to generate AP firing despite a higher average Pup value (Supplementary Movie S4), but scenarios 5a and 6 with higher gCaL values fired rhythmic AP (Supplementary Movies S5A, S6). B–C: the results of simulations in scenarios 5a and 6. In scenario 6, we extended the simulation run to 25 s. Inset in panel C (middle) shows average Vm from 5 to 25 s.
A substantial cell-to-cell variability in phospholamban phosphorylation is expected based on a substantial variability of both basal AP firing rates and responses to β-adrenergic stimulation among isolated SAN cells (Kim et al., 2021). However, in contrast to gCaL, there is no single-cell data in the literature to set up cell populations in the model within an exact Pup range. To get an idea of what to expect for physiologically relevant lower limit in Pup variations in individual cells (when testing model stability), one can refer, for example, to how low Pup can descend during the physiological responses to cholinergic receptor stimulation. Within physiologic range of acetylcholine concentrations up to 1 μM, the Pup values can decrease on average from 12 mM/s to as low as 4 mM/s (Maltsev and Lakatta, 2010), indicating that Pup can actually be very flexible in each SAN cell during its normal operation. Thus, we constructed and tested three model scenarios with substantial variability of Pup (Figure 5; Table 1, scenarios 4–6; Supplementary Movies S4–6). Similar to simulations with gCaL, we also addressed possible effects of randomness in Pup distribution by running three simulations for scenario 5 with the same model parameters, but with different seed values for random number generator (5a, 5b, 5c in Table 1).
Our model simulations in scenarios 5a, 5c, and 6 demonstrated that Pup heterogeneity can indeed restore SAN tissue operation within the non-firing zone, thus supporting our hypothesis. In scenario 4, however, gCaL (and hence cell excitability) were set so low, that none of the 625 cells in the entire grid continued to generate APs after about 4 s (Supplementary Movie S4). As gCaL increased in scenarios 5 and 6, the tissue generated APs, despite the decreasing average of Pup values (Table 1). This indicates importance of gCaL and clock coupling in this mechanism of robustness. Surprisingly and in contrast to simulations involving the gCaL spread in the previous section, all or almost all cells fired rhythmic APs (Table 1). However, the tissue-wide AP firing occurred in a less synchronized manner, especially in scenario 5 (runs 5a, 5b, 5c), manifested by a larger spread in AP cycle lengths among cells (histogram in Figure 5B, large SD values in Table 1, Supplementary Movies S5A–C). The percentage of firing cells at a given time was extremely noisy. Some cells formed local communities with unsynchronized AP firing, including chaotically firing cells and low amplitude sub-threshold oscillations (Supplementary Figure S1). Moreover, scenario 5b ceased firing at about 6 s, yielding only about half cells firing (44.8%) during evaluation period (from 5 to 7.5s), while scenarios 5a and 5c showed almost all cells firing APs (97.9 and 99.8%), indicating that a particular distribution (at a given seed value) is indeed important when the system operates at the edge of stability.
It is important to emphasize that in all above scenarios rescuing AP firing required a substantial spread of gCaL or Pup values. In other terms, in the non-firing zone at each Pup value, the spread of gCaL must reach a critical value in order to rescue AP firing. While the spread of 0.4 nS/pF is indeed substantial, it was realistic, because assigned gCaL values remained within experimentally measured range of ICaL as shown in our bridging dual Y plot in Figure 1A. We tested several additional scenarios with narrower gCaL distribution spreads <0.4 nS/pF, but those non-realistic SAN tissue models were unable to converge to steady AP firing. One such failed tissue model is shown in Figure 6A (scenario 7, no firing) by aqua double-headed arrow (see also Supplementary Movie S7).
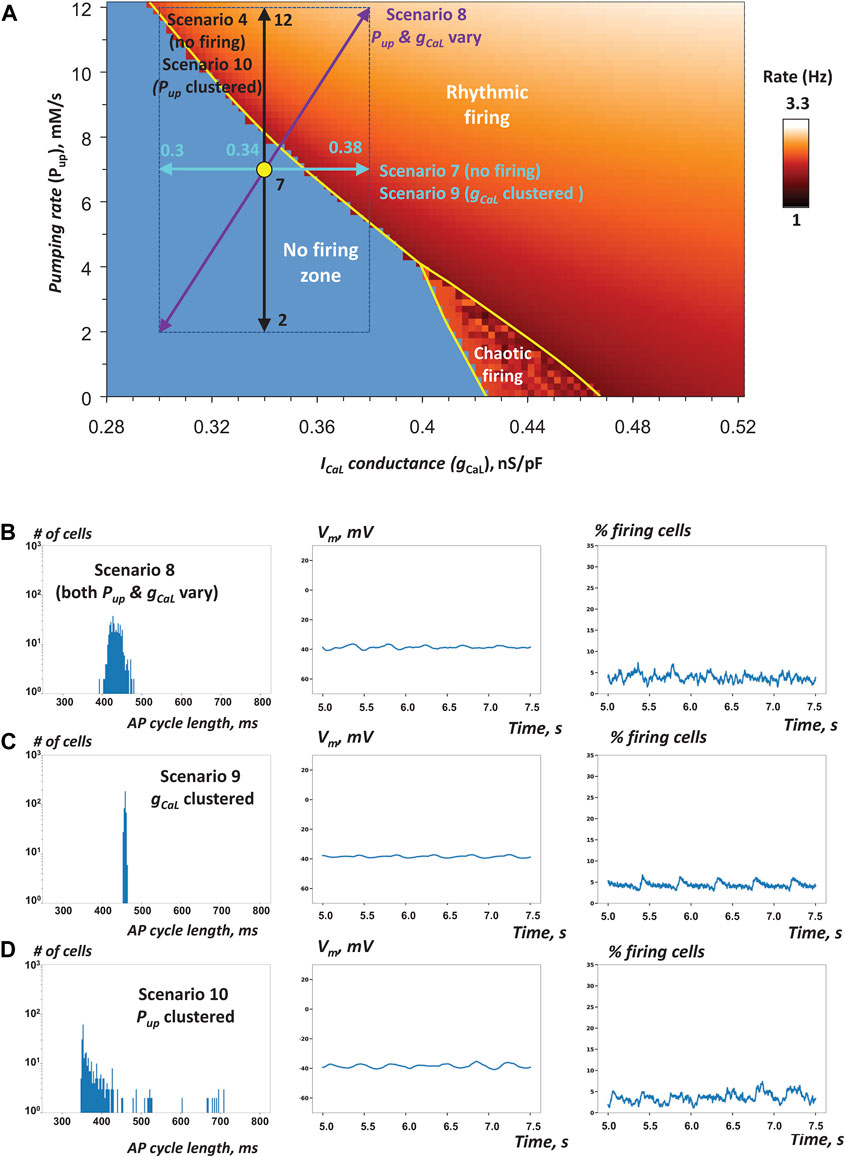
FIGURE 6. Robustness of SAN operation is increased via combined Pup and gCaL heterogeneities and their clustering (A) Pup-gCaL bifurcation diagram illustrating cell populations in simulations of SAN tissue function in scenarios 7–10 (Table 1) similar to Figures 3A, 5A. Yellow circle shows coordinates for mean Pup and mean gCaL values (in the non-firing zone). Double-headed arrows show Pup and gCaL ranges in these scenarios. The tissue models with heterogeneity in either single parameter failed to generate rhythmic APs (Supplementary Movies S4, 7). However, when both parameters fluctuated, the tissue model fired rhythmic APs (Supplementary Movie S8). Furthermore, when either parameter (gCaL or Pup) was clustered, the tissue also generated APs in scenarios 9 or 10 (Supplementary Movies S9, 10), respectively. B–D: the results of simulations in scenarios 8–10.
To gain further insights into SAN tissue operation, we tested the hypothesis that heterogeneity of cell populations with respect to both Ca clock and membrane clock would act synergistically to increase robustness of the pacemaker function. When Pup or gCaL were distributed separately in scenarios 4 and 7 (described above), the respective SAN tissue models lacked automaticity (Supplementary Movies S4, S7). Thus, we simulated and examined an additional special scenario 8 that included the distributions of both gCaL and Pup assigned in scenarios 4 and 7 (purple diagonal double-headed arrow in Figure 6A and Table 1). Our simulations showed that such a system with dual parameter distribution generated APs (Figure 6B, Supplementary Movie S8), indicating that heterogeneities in gCaL and Pup act indeed synergistically in rescuing normal system operation within the non-firing zone. Remarkably, the percentage of firing cells in the tissue increased to 69% from 42% for the same cell population when cells are not connected to each other, indicating ongoing recruitment of dormant cells to fire APs when cells were connected. AP firing in this scenario, however, was poorly synchronized among cells with such narrow distribution of gCaL values around a low mean value of only 0.34 nS/pF. Desynchronized cells included chaotically firing cells and low amplitude sub-threshold oscillations (Supplementary Figure S2).
In all previous scenarios gCaL and Pup were uniformly randomly distributed within a specific range. Experimental studies, however, indicate that the SAN features clusters of cells with different types of activity (Figure 4 in Bychkov et al., 2020). Thus, we tested the hypothesis that the natural cell clustering provides an additional “gear” to enhance robustness of AP firing in SAN tissue. To test this hypothesis, we attempted to rescue automaticity in scenario 7 in which cells had heterogeneous gCaL within an extremely narrow range from 0.3 to 0.38 nS/pF. Indeed, when cells were uniformly randomly distributed over the tissue, the modelled system of cells lacked automaticity However, the system was able to achieve rhythmic AP firing when the same heterogenous cell population was locally redistributed with higher gCaL clustering towards the grid center (Figure 6C; Table 1, scenario 9; Supplementary Movie S9). Finally, we tested the hypothesis that, similar to gCaL, increased heterogeneity in Pup can also add robustness to the system of interacting cells. Indeed, while the tissue model in scenario 4 lacked automaticity with uniformly random Pup distribution among cells within the tissue (Supplementary Movie S4), clustering cells with higher Pup towards the tissue center rescued the system automaticity (scenario 10, Figure 6D and Table 1, Supplementary Movie S10). It is important to note that in both simulations with gCaL and Pup clustering the AP firing was limited to grid center and lacked at the grid border. Chaotically firing cells and low amplitude sub-threshold oscillations were observed at the cluster periphery (at the border of firing and non-firing cells) in simulations with Pup distribution (Supplementary Figure S3).
The model parameter determining cell-to-cell coupling strength is ρ that is the intracellular resistivity (the lower resistivity, the stronger coupling). In our simulations thus far, ρ was set to the highest value of 104 MΩ·m of the original Campana model (Campana, 2015) to reflect low cell coupling known for the central part of the SAN where the cardiac impulse originates (Boyett et al., 2006). Campana examined heterogeneous SAN tissue with average parameter values exactly as in original Maltsev-Lakatta model with gCaL = 0.464 nS/pF and Pup = 12 mM/s, i.e. in rhythmic firing zone, very far from the bifurcation line, and found notable effects of cell coupling when ρ changed by orders of magnitude, i.e. 104, 103, 102, 10, and 1 MΩ·m. Campana’s studies showed that the mean AP cycle length increased (i.e. the rate decreased) as the coupling strength increased and when coupling was extremely strong (ρ = 1 MΩ·m) the AP cycle length approached the average cycle length of isolated cells, i.e. ∼333 ms of the original Maltsev-Lakatta model. In contrast to Campana’s simulations, our scenarios were chosen in non-firing zone, and what may happen with such system operating at the edge of stability at different coupling strength is not obvious and may provide insights into robust operation of SAN.
To this end, here we performed additional simulations with new settings of ρ for scenario two featuring gCaL heterogeneity and scenario 5 featuring Pup heterogeneity. We set ρ to intermediate coupling (ρ = 103 MΩ·m, scenarios 11 and 12) and very strong coupling (ρ = 1 MΩ·m, scenarios 13 and 14). In scenarios 11 and 12 with intermediate coupling, the average AP cycle length substantially increased (Figure 7; Table 1, Supplementary Movies S11, 12) vs respective scenarios 2 and 5 with weakly connected cells at ρ = 104 MΩ·m (Figures 3C, 5B) consistent with Campana’s results. However, in contrast to Campana’s results, in scenarios with strong coupling, the SAN did not settle at an average cycle length of isolated cells, but ceased function (Table 1, scenarios 13 and 14, Supplementary Movies S13, 14).
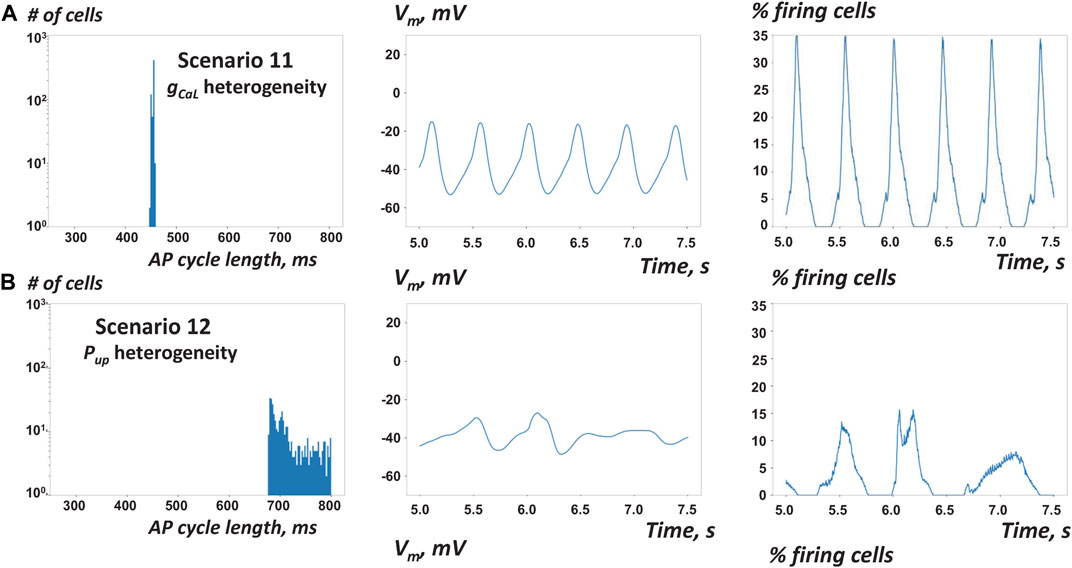
FIGURE 7. Results of simulations of SAN tissue function with stronger cell-to-cell coupling (A) With stronger cell coupling at ρ = 103 MΩ·m vs 104 MΩ·m (scenario 11 vs 2) AP firing in tissue with heterogeneous gCaL became slightly slower, but more synchronized (almost metronomic, Supplementary Movie S11) (B) With stronger cell coupling in tissue with heterogeneous Pup (scenario 12 vs 5) AP firing in tissue with heterogeneous Pup became substantially slower and remained notably unsynchronized.
All our previously tested scenarios were performed within the “no firing” zone to examine the system robustness at the border of system stability. However, for accurate comparison, it is also important to run control simulations and examine how the system behaves on the other side of the bifurcation line, in the rhythmic zone. These control simulations ought to exclude possibility that dormant cells (still present in the heterogeneous cell population in the firing zone) do not halt SAN automaticity. To this aim, we constructed four additional model scenarios, in which we shifted either gCaL or Pup towards rhythmic zone. (Table 1, Scenarios 15–18, Supplementary Movies S15–18).
These control simulations showed that the SAN tissue populated by cells with their average parameter values in rhythmic zone indeed generates rhythmic APs as expected. An important result of these simulations was that the system of interacting heterogeneous cells operates differently (in a more robust way) vs. the population of same cells with no interactions: the percentage of firing cells within the system is higher than the percentage of cells with intrinsic automaticity (Table 1). In other words, intrinsically firing cells recruit to fire many dormant cells within the functional SAN tissue.
Heterogeneity of SAN cells has been known and well-documented for a long time (Boyett et al., 2000), but its importance for SAN function remains unclear. Numerical model simulations performed in the present study revealed an interesting and counterintuitive aspects of the problem: While noise and heterogeneity are usually associated with undesirable disturbances or fluctuations, SAN cell heterogeneity can increase robustness of cardiac pacemaker function. Furthermore, while stronger cell connections seem to lead to higher synchronization and better function, robust function of heterogeneous SAN tissue actually requires weak cell coupling but stronger cell coupling at the edge of stability leads to SAN failure. Our work took advantage of well-described properties of single isolated SAN cells in numerous previous experimental and theoretical studies. Specifically, the intrinsic behaviors of individual cells have been characterized by parametric sensitivity analyses (Maltsev and Lakatta, 2009; Kurata et al., 2012) that revealed synergistic contributions of the two key parameters Pup and gCaL to generate normal automaticity in individual SAN cells as depicted in Pup - gCaL diagram (panel A in Figures 3,5,6). This diagram was helpful to guide the model simulations (Table 1) and interpret our results. We investigated how the SAN tissue behaves when it is populated by a large variety of individual cells with known intrinsic properties (i.e. the systems approach). On the other hand, our consideration was limited to only two key model parameters gCaL and Pup and their combinations (i.e. we combined reductionist and systems approaches).
A plethora of numerical models of SAN tissue function have been developed previously, including models in one dimension (Zhang et al., 2001; Huang et al., 2011; Glynn et al., 2014; Li et al., 2018), two dimensions (Michaels et al., 1987; Oren and Clancy, 2010; Campana, 2015; Gratz et al., 2018; Karpaev et al., 2018), and full-scale SAN models in three dimensions (Munoz et al., 2011; Li et al., 2013; Li et al., 2014; Kharche et al., 2017; Mata et al., 2019). These models examined effects of cell-to-cell coupling (Li et al., 2013; Campana, 2015; Gratz et al., 2018; Mata et al., 2019), inter-cellular variability (Campana, 2015; Mata et al., 2019), coupling to other cell types (fibroblasts) (Oren and Clancy, 2010; Karpaev et al., 2018), and normal and abnormal impulse propagation in three dimensions (Munoz et al., 2011; Li et al., 2014; Kharche et al., 2017).
To our knowledge only two numerical studies (Campana, 2015; Mata et al., 2019) have investigated the impact of heterogeneity of cell parameters on SAN tissue function. However, in both studies cell heterogeneity was limited to only surface membrane clock parameters and mimicked by a simultaneous randomization of all membrane conductances with respect to their basal values within a fixed percentage range (dubbed sigma). Mata et al. (Mata et al., 2019) reported time course of synchronization of AP firing vs sigma. Campana (Campana, 2015) reported that the cell population synchronizes on a rate slightly higher than the one of the isolated cells, but it does not equal the rate of the fastest cell. Here we investigated importance of heterogeneity not only with respect to ion currents, but also Ca clock function. Furthermore, we examined the effects of tissue heterogeneity at the edge of the system stability in the non-firing zone, critical for robust function of SAN tissue.
Examining Ca signals in addition and together with membrane clock parameters is vital in studies of pacemaker function because each SAN cell operates as a coupled-clock system, i.e. actions of ICaL and Pup are intertwined in a synergistic manner in numerical models of both isolated cells (Maltsev and Lakatta, 2009; Kurata et al., 2012) and SAN tissue (Figure 6A,B). Among membrane currents, we chose ICaL for our analysis because it is involved not only in membrane clock function (it generates AP upstroke (Mangoni and Nargeot, 2008), but also in clock coupling by providing influx of Ca (coupled clock’s oscillatory substrate) (Maltsev and Lakatta, 2009; Lakatta et al., 2010) and via positive feedback mechanisms among local Ca releases, Na/Ca exchanger, and ICaL during diastolic depolarization (Torrente et al., 2016; Lyashkov et al., 2018). Distributions of ICaL among individual SAN cells have been reported in previous experimental studies (Honjo et al., 1996; Musa et al., 2002; Monfredi et al., 2017) and thus permitted realistic choices for our ICaL modeling (Figure 1A).
Recent theoretical studies have demonstrated that the presence of a Ca clock in addition to a membrane clock protects the SAN from annihilation, associated with sinus node arrest (Li et al., 2018); and that random parameter heterogeneity among oscillators can consistently rescue the system from losing synchrony (Zhang et al., 2021). These prior reports and the results of the present study support a novel SAN structure/function paradigm (resembling neuronal networks) that was proposed based on high-resolution imaging of SAN tissue (Bychkov et al., 2020): in the new paradigm, interactions of Ca signals and APs play a central role in generation of rhythmic cardiac impulses that emanate from the SAN.
The coupled-clock theory (Maltsev and Lakatta, 2009) postulates that the intrinsic cell automaticity is defined by a combined and synergistic action of the Ca and membrane clocks as depicted in the Pup-gCaL diagram (Maltsev and Lakatta, 2009) (panels A in Figures 3,5,6). Also, perturbation of ether clock inevitably affects the other clock and the entire coupled-clock system (Yaniv et al., 2013), explaining, in part, our result that the robustness of AP firing in SAN tissue can be enhanced when either gCaL or Pup varies among the cells (Figures 3, 5; Table 1).
More specifically, by allowing Pup and/or gCaL to substantially deviate from their mean values, we actually create a sub-population of cells that have intrinsic automaticity in addition to the sub-population of intrinsically non-firing cells (dubbed dormant cells (Kim et al., 2018; Tsutsui et al., 2018; Tsutsui et al., 2021). The two sub-populations of cells intimately interact, determining the ultimate performance (or failure) of the SAN tissue they comprise. Thus, the coupled-clock theory explains, in part, another important result of our study that gCaL and Pup heterogeneities act synergistically in rescuing SAN from failure. When the SAN system featured heterogeneity in both gCaL and Pup, almost all cells (∼70%, scenario 8) generated APs in marked contrast to SAN tissue with heterogeneity in either gCaL or Pup, in which all cells remain non-firing (scenarios 4 and 7). Furthermore, the fact that the SR Ca pumping is a key timing mechanism in the coupled-clock theory can also explain the differences in rescuing tissue automaticity via Pup or gCaL: AP cycle length substantially varied in tissues with Pup heterogeneity (scenario 5), whereas only slight AP cycle length variability was observed in tissues with gCaL heterogeneity (scenarios 1–3).
While the coupled-clock theory can explain, in part, some results of the present study, its application to tissue function is limited, because it predicts only intrinsic cell properties, i.e. cell operation in isolation. Cell tissue, however, operates at a higher level of organization and its automaticity emerges from interactions of numerous cells with different intrinsic properties within local cell communities. These interactions go beyond the coupled-clock theory (at least in its present form). Let’s classify intrinsic properties of the cells and examine how they operate within the system (Figure 8A).
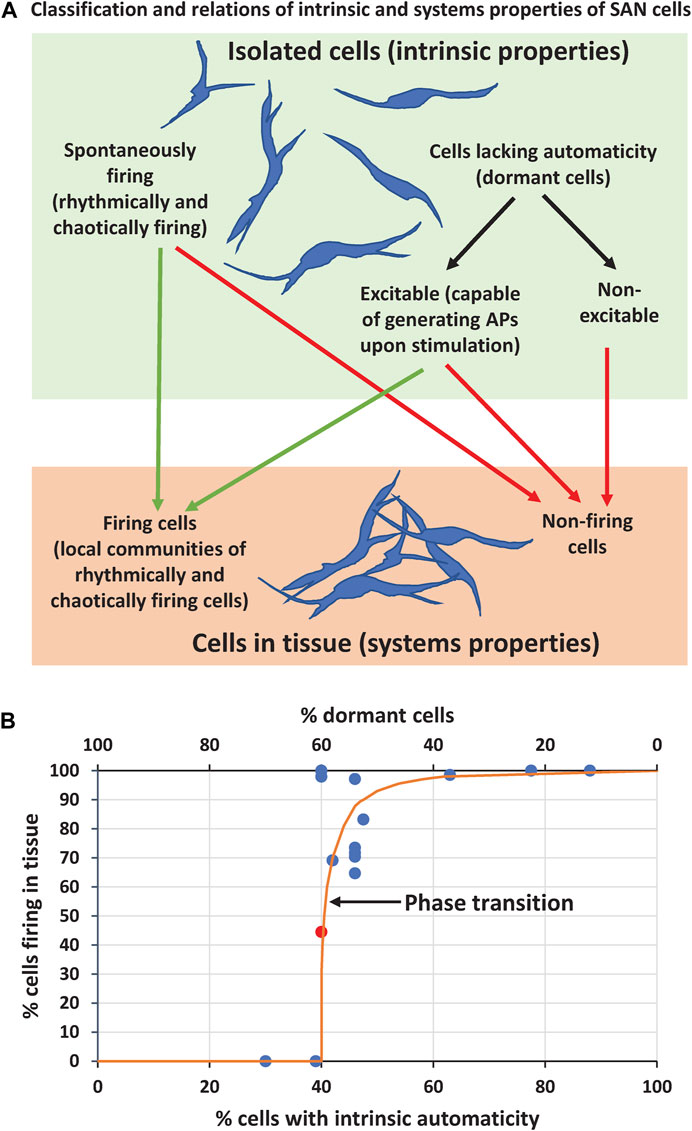
FIGURE 8. Results summary and interpretation (A) Classification of intrinsic properties of individual SAN cells and their relation to properties of SAN cells within tissue (B) A summary graph based on data in Table 1 (except scenarios 9, 10, 13, 14) showing relation of the percentage of firing cells in tissue model as the function of percentage of intrinsically firing cells (bottom x axis) or dormant cells (top x axis). Orange line illustrates a hypothetical phase transition (free-hand line with no theoretical value). Note that cell tissue can function with the percentage of intrinsically firing cells as low as 40% (i.e. 60% of dormant cells). Red circle in the middle of the plot shows the data point for scenario 5b reflecting an “intermediate” system performance during its phase transition from firing to non-firing state (AP firing ceased at about 6 s, see Supplementary Movie S5B).
Parameter gCaL is critical for cell excitability because ICaL generates AP upstroke. Therefore, in our scenarios with substantial gCaL spread (including very low values, like in real SAN cells, Figure 1A), the entire cell population can be split into two major sub-populations with respect to cell intrinsic properties: 1) spontaneously firing APs and 2) cells lacking automaticity (dormant cells). In turn, each sub-population can be further split into two categories: spontaneously firing cells can be rhythmically firing or chaotically firing; cells lacking automaticity can be excitable (capable of generating APs upon stimulation) or non-excitable if gCaL is too low to generate an AP. This classification helps to understand and interpret our simulation results with respect to emergence of automaticity in SAN tissue. For example, non-excitable cells will always remain non-firing either in isolation or in tissue, whereas excitable cells can be recruited to fire APs, but spontaneously firing cells can cease firing in the tissue (Figure 8A).
One important result of our study is that the percentage of firing cells in tissue in all scenarios involving either Pup or gCaL (except scenarios lacking automaticity) was much larger than that when the same cells operated in isolation (Table 1), indicating that some excitable cells lacking automaticity were indeed recruited to fire APs by their neighboring cells in local cell communities to increase overall performance of the SAN tissue. And vice versa, the SAN tissue surprisingly lacked automaticity in scenarios 4 or 7, despite a major fraction of cells (39% or 30%, respectively, Table 1) was capable of generating rhythmic APs, according to the coupled-clock theory, but did not fire APs in the tissue.
Thus, our simulations at the edge of the system stability discovered strong amplification (i.e. self-organization) of either AP firing or strong suppression of AP firing among the cells within SAN tissue. In other terms, whether the system gains automaticity or fails, seems to be a critical phenomenon that depends on intimate interactions of intrinsically firing and dormant cells. When intrinsically firing cells reach a critical number, they prevail: they not only fire AP themself, but also recruit a fraction of excitable dormant cells to fire APs. And, vice versa, as the sub-population of firing cells decreases, these cells become surrounded by a critical number of dormant cells, and these dormant cells suppress the entire system automaticity (for example, in scenarios 4 and 7). At the criticality, the transition from the firing state to non-firing state in SAN tissue is extremely abrupt, like a phase transition in statistical physics (Figure 8B). For example, in scenarios 4, 5b, and 7, the AP generation suddenly ceased at about 3.5, 6, and 4.5 s after simulation onset, respectively, when the system reached a criticality, and the suppressing effect of non-firing cells prevailed (see Supplementary Movies S4, 5B, 7 and Figure 8B, red circle).
The presence of non-excitable cells accounts for a substantial fraction of non-firing cells in tissue in scenarios 1 to 3 featuring substantial gCaL spread (Table 1). In contrast to scenarios with gCaL distributions, all cells in scenarios with Pup distributions and fixed gCaL were excitable (albeit variously, depending on gCaL). This makes possible for the system to evolve to the state when all cells fire APs and, as a result, scenarios with Pup distributions (4,5, 6, 8, 12, 16, 18) tended to exhibit all-or-none firing (Table 1). An interesting result was that, despite the lack of cells with intrinsically chaotic firing, in many different scenarios some cells self-organized into local communities of desynchronized firing, including chaotical firing APs and low amplitude sub-threshold oscillations (Figure 4, Supplementary Figures S1–S3). This result indicates that complex patterns of AP firing (similar to that observed in SAN tissue, Figure 4 in Bychkov et al., 2020) can emerge as a new system property when cells interact within the tissue.
Because we distributed cells uniformly randomly, the critical phenomenon of the emerging automaticity in our tissue model can be interpreted in terms of Poisson clumping (Aldous, 1989), a phenomenon wherein random events (in space and/or time) have a tendency to occur in clusters, clumps, or bursts. In other words, forming cell clusters with high gCaL and/or Pup could be a natural consequence of the random distribution. When these natural clusters of intrinsically firing cells are rare and small, their automaticity is suppressed by surrounding dormant cells (which, in turn, also tend to form clusters via Poisson clumping). The emergence of local communities of chaotically firing cells (Figure 4, Supplementary Figures S1–3), can also be attributed Poisson clumping.
A recent study (Fenske et al., 2020) showed that a mutual interaction process between firing and nonfiring cells can slow down the overall rhythm of the SAN, but the percentage of firing cells can be increased by cAMP-dependent regulation and thereby oppose enhanced responses to vagal activity. Our results are in accord with this report and provide further insights into this new phenomenon. Indeed, it is well-known that cAMP signaling enhances both ICaL and SERCA pumping (i.e. gCaL and Pup in our study). Thus, the critical nature of interactions revealed in the present study could be interpreted to indicate that increased cAMP-dependent regulation of SAN function shifts the system operation away from the critical border, deeper towards rhythmic firing area characterized by a strong recruitment of dormant cells (Scenarios 15–18, Table 1). And vice-versa, a perturbation that increases the fraction of dormant cells would slow down the system automaticity and brings it closer to the critical border.
While forming functional clusters via Poisson clumping in our model is a matter of chance (albeit predictable via statistical methods (Aldous, 1989)), the real SAN tissue, as any biological tissue, can direct cell locations to optimize its function. Indeed, high resolution imaging studies in intact SAN detected clusters of cells with various types of functional activity (Figure 4 in Bychkov et al., 2020). Based on this logic, we rescued SAN tissue function in the “hopeless” scenarios 4 and 7 (Supplementary Movies S4, 7) just by reorganizing the cell locations within the tissue models (scenarios 9 and 10, Supplementary Movies S9, 10). Dormant cells were “kicked” to SAN periphery, while intrinsically firing cells (clustered in the grid center) supported AP firing of each other. As a result, the tissue automaticity was not only rescued, but a substantial fraction of dormant cells (at the border of the firing/non-firing cells) was recruited to fire APs, as evident from the increase of the percentage of firing cells (scenarios 9 and 10 in Table 1). Thus, cell clustering (e.g. with respect to gCaL, Pup, and perhaps other parameters) may represent an additional mechanism by which SAN tissue can enhance its robust function at the edge of stability. A large number of local oscillators detected in intact SAN (Bychkov et al., 2020) may reflect cell clustering due to heterogeneity in ICaL (yielding non-excitable cells, besides excitable cells, as described above, see also Figure 1A), but the fact that the cell clusters operate at different frequencies point to (among perhaps other interpretations) cell heterogeneity in SR Ca pumping determined by various levels of phospholamban phosphorylation among cells or cell clusters (mimicked by Pup heterogeneity in our model). Indeed, heterogeneity in Pup created numerous oscillators operating at various frequencies in our tissue models (wide histograms in Figures 5B, 6B).
An apparent downside of cell clustering, however, is that the isolated clusters of automaticity lack physiological importance until their signals overcome the non-firing cell “barriers” to interact with other clusters and/or the rest of the SAN to ultimately deliver synchronized, rhythmic (but not metronomic) APs to atria. While this appears to be a problem in our simple 2-dimensional model of SAN tissue, the real SAN tissue is a 3-dimensional, multi-layer meshwork of long and highly branched, intertwined cells (Bychkov et al., 2020). Such tight meshwork of HCN4+/Conexin43- cells is structured for signal transfer within and among the functional clusters, regardless of the specific nature of cell interactions that remains unknown.
Another important result of our study is that heterogeneity in gCaL or Pup has antiarrhythmic effect. Indeed, while the tissue models (scenarios 3 and 6) with identical cells generated chaotic firing, allowing gCaL or Pup values to spread (but keeping same averages over the cellular network) shifted the system towards normal, rhythmic operation (Figure 3D, Supplementary Movie S3 and Figure 5C, Supplementary Movie S6). This result is remarkable and counterintuitive: when the noise of an intrinsically chaotic oscillatory system is combined with the noise of random distribution of its key parameter (gCaL or Pup) within a SAN network, it is hard to expect that such “double-noisy” system would generate normal rhythmic automaticity; but it does. However, it is important to note that such an antiarrhythmic mechanism and related potential improvement of heart function may be specific to the SAN. In cardiac muscle, excessive cell heterogeneity contributes to the induction of reentrant arrhythmia. In the case of triggered activity, the robustness by heterogeneity presented in this study may cause a robust ectopic firing. In either case, abnormal impulse initiation in atria or ventricles is proarrhythmic (rather than antiarrhythmic) and can be life-threatening.
Our simulations with different coupling strength show that weak cell coupling is required for the robust operation in our heterogeneous SAN tissue model operating at the edge of stability. Our SAN model was set as a community of loosely coupled cells with very high resistivity of cell-to-cell contacts of ρ = 104 MΩ·m (Campana, 2015), and in many scenarios, we were able to revive SAN function in the non-firing zone by adding heterogeneity to gCaL or Pup (Table 1). When we increased cell coupling to an intermediate setting with ρ = 103 MΩ·m, the system notably increased the average AP cycle length (scenarios 11 and 12, Table 1) and the velocity of an apparent AP propagation (Supplementary Movie S11 vs. Supplementary Movie S2, Supplementary Movie S12 vs. Supplementary Movie S5); but when the coupling was increased further to ρ = 1 MΩ·m, i.e. whole tissue became almost instantly synchronized, SAN ceased operation (scenarios 13 and 14, Supplementary Movies S13, 14). This result may explain, in part, why cells are weakly connected (no CX43 was found (Boyett et al., 2006)) in the central part of the SAN, where the cardiac impulse emerges: the system of loosely coupled cells is more robust, when it operates at the edge of stability. The mechanism of this phenomenon could be linked to the same critical behavior of the system discussed above, i.e. the critical interactions of dormant and intrinsically firing cells. Indeed, dormant cells represent >50% of the cell populations in our scenarios 1–14 (Table 1), and their effect to halt SAN automaticity becomes prevailing at stronger coupling. In other terms, in loosely connected SAN tissue the intrinsically firing cells can operate when they represent a minority (and even recruit to fire dormant cells), whereas in strongly connected SAN tissue their individual behaviors are suppressed by dominating dormant cells, and the dormant cells halt the system function. Our simulations also showed that at the intermediate cell coupling, i.e. in the transition from AP firing at weak coupling towards SAN failure at strong coupling, the tissue AP firing was well-organized into cell-wide, fast-propagating waves (Supplementary Movies S11, 12). Interestingly, while such almost metronomic AP firing of SAN tissue may appear as an almost perfect operation, it actually heralds SAN failure at stronger cell coupling (Supplementary Movies S13, 14).
Our simulations showed that system transition from firing to non-firing state seems to be a critical phenomenon, i.e. either firing cells prevail and recruit dormant cells to fire or dormant cells prevail and halt automaticity. The question then arises: what is the minimal percentage of firing cells that is enough for SAN function? In theory, the exact border between SAN life and death in our model could be found via a parametric sensitivity analysis. However, tissue modeling is associated with high computational demand and, therefore, detailed sampling of parametric space, like we did for single cell models (Figure 3A), is infeasible. Our simulations were limited to 1) 7.5 s or 25 s of tissue function; 2) two specific key parameters of the cell coupled clock-system, gCaL and Pup; 3) a simple model of SAN tissue of a square grid of 25 × 25 cells; 4) only 1 cell size in the tissue (i.e. same cell electric capacitance); 5) only 1 cell model type (Maltsev and Lakatta, 2009); 6) only 3 cases of cell coupling strength; 7) model scenarios close to the bifurcation line; 8) only two types of cell distribution: uniformly random and spiral clustering.
Although entire parametric space of Pup - gCaL have not been examined, our results show that the SAN can operate with the percentage of intrinsically firing cells as low as 40%. Based on our data in Table 1, we constructed a summary graph showing the margin between “firing” and “non-firing” SAN for tissue simulations scenarios with uniformly random distribution of Pup and gCaL (Figure 8B). Orange line shows a hypothetical phase transition between the two states. This is, of course, a rough estimate, formally based on simulations presented here with all aforementioned limitations.
To precisely answer the question of the SAN life-or-death border, however, is difficult. The SAN may engage protective mechanisms to avoid failure, such as complex neuronal control (Hanna et al., 2021), areas that are unresponsive to acetylcholine (Opthof, 2007), complex morphological structures including cell clustering (discussed above), etc. For example, while SAN lacks automaticity with 30% of functional cells in scenario 7, its function can be rescued by rearranging (clustering) the same cells within the grid in scenario 9 (Figure 6). Thus, the exact border of the critical interactions between firing and dormant cells was not fully characterized in the present study and merits further, more detailed numerical and analytical studies, including bifurcation analysis (Kurata et al., 2012) and statistical physics approaches to describe phase transition-like behaviors in heart cells and tissues (Maltsev et al., 2017a; Ashikaga and Asgari-Targhi, 2018). One specific theoretical approach to describe such behaviors could be via Ising model, because firing cells favor firing states of their neighbors, whereas silent cells favor silent sates of their neighbors, like opposite spin orientations in ferromagnetism (Onsager, 1944).
Future theoretical studies can also explore contributions of other ion currents such as INa (Lei et al., 2004), ICaT (Ono and Iijima, 2005; Tanaka et al., 2008), and funny current (Honjo et al., 1996; Monfredi et al., 2017), phosphorylation of Ca cycling proteins (phospholamban and RyRs), autonomic modulation, cell network structure, including cell connectivity and interactions in three dimensions, interactions with other cell types (e.g. fibroblasts (Camelliti et al., 2004) and telocytes (Mitrofanova et al., 2018)), mechano-sensitivity (Quinn and Kohl, 2012), endogenous Ca buffers, pathological conditions, aging, etc. Another important aspect for future studies is a very high collagen content in SAN compared to other regions of the heart, and this is thought to have important impacts on how many SAN cells couple to each other and in what pattern (MacDonald et al., 2020). SAN cells exhibit diverse morphology, including elongated spindle shape cells and spider shape cells with varying number of irregularly shaped branches (Verheijck et al., 1998). How the number of connected neighboring cells alter the system behavior remains to be determined.
Natural heterogeneity of pacemaker cells increases robustness of cardiac pacemaker function, i.e. the SAN tissue populated by heterogeneous cells can generate normal automaticity within the cell parameter ranges, whereas SAN populated by identical cells would exhibit either dysrhythmic AP firing or complete lack of automaticity. This effect to enhance pacemaker function at the edge of the system stability is synergistic with respect to heterogeneity of Ca and membrane clocks, and it is not due to a simple summation of activity of intrinsically firing cells that are naturally present in heterogeneous SAN. These firing cells critically interact with intrinsically non-firing cells (dormant cells) and either recruit many of them to fire, granting SAN automaticity, or non-firing cells suppress firing cells and abruptly halt SAN tissue automaticity (Figure 8). Clustering cells with specific cell parameters provides an additional mechanism to enhance robustness of SAN function. Robust operation of heterogeneous SAN tissue requires weak cell coupling, a known property of the central area of SAN where cardiac impulse emerges; stronger cell coupling reduces AP firing rate and ultimately halts SAN automaticity at the edge of stability. Our results provide new insights for SAN operation that can be helpful to understanding normal SAN function especially at low rates (near criticality) and in HCN4+/Conexin43- cell communities (Bychkov et al., 2020; Fenske et al., 2020), as well as with respect to SAN function in normal aging (linked to deficient cAMP-PKA-Ca signaling (Liu et al., 2014)) and pathological conditions, such as sick sinus syndrome and SAN arrhythmias (Dobrzynski et al., 2007; John and Kumar, 2016).
The raw data supporting the conclusions of this article will be made available by the authors, without undue reservation.
AVM wrote computer program code, performed model simulations and data analysis. AVM and VAM wrote the first draft of the manuscript. MDS, EGL wrote sections of the manuscript. All authors contributed to conception, design of the study, manuscript revision, read, and approved the submitted version.
This research was supported by the Intramural Research Program of the National Institutes of Health, National Institute on Aging.
The authors declare that the research was conducted in the absence of any commercial or financial relationships that could be construed as a potential conflict of interest.
All claims expressed in this article are solely those of the authors and do not necessarily represent those of their affiliated organizations, or those of the publisher, the editors and the reviewers. Any product that may be evaluated in this article, or claim that may be made by its manufacturer, is not guaranteed or endorsed by the publisher.
The Supplementary Material for this article can be found online at: https://www.frontiersin.org/articles/10.3389/fphys.2022.845634/full#supplementary-material
Supplementary Material Guide | It includes supplementary computer code, supplemental figures S1, S2, and S3 and 22 supplemental movies. Each movie illustrates the result of numerical simulation of SAN tissue (25x25 cells) lasted 7.5 s in the respective model scenario described in Table 1. Vm dynamics in each cell in the grid was color-coded via red shade from −60 mV (pure black) to 20 mV (pure red). Simulation time is displayed in the upper left corner. The movies were distributed in 10 supplementary Power Point files as follows: Presentation 1.PPTX: Movie 1. Presentation 2.PPTX: Movie 2a, Movie 2b, Movie 2c. Presentation 3.PPTX: Movie 3. Presentation 4.PPTX: Movie 4. Presentation 5.PPTX: Movie 5a, Movie 5b, Movie 5c. Presentation 6.PPTX: Movie 6. Presentation 7.PPTX: Movie 7, Movie 8. Presentation 8.PPTX: Movie 9, Movie 10. Presentation 9.PPTX: Movie 11, Movie 12, Movie 13, Movie 14. Presentation 10.PPTX: Movie 15, Movie 16, Movie 17, Movie 18. Specific model parameters in each movie are given in respective movie legends in the Power Point files.
AP, action potential; CaMKII, Ca/calmodulin-dependent protein kinase II; CUDA, Compute Unified Device Architecture; ICaL, L-type Ca current; gCaL, maximum conductance of L-type Ca current; SR, sarcoplasmic reticulum; RyR, ryanodine receptor (Ca release channel); SAN, sinoatrial node; SERCA2a, SR Ca pump; Pup, maximum rate of SR Ca pumping by SERCA2a; PKA, protein kinase A; GPU, graphics processing unit; Vm, membrane potential.
Aldous D. (1989). “Probability Approximations via the Poisson Clumping Heuristic,” in Applied Mathematical Sciences (Springer), 7. doi:10.1007/978-1-4757-6283-9
Ashikaga H., Asgari-Targhi A. (2018). Locating Order-Disorder Phase Transition in a Cardiac System. Sci. Rep. 8, 1967. doi:10.1038/s41598-018-20109-6
Bleeker W. K., Mackaay A. J., Masson-Pévet M., Bouman L. N., Becker A. E. (1980). Functional and Morphological Organization of the Rabbit Sinus Node. Circ. Res. 46, 11–22. doi:10.1161/01.res.46.1.11
Boyett M., Honjo H., Kodama I. (2000). The Sinoatrial Node, a Heterogeneous Pacemaker Structure. Cardiovasc. Res. 47, 658–687. doi:10.1016/s0008-6363(00)00135-8
Boyett M. R., Inada S., Yoo S., Li J., Liu J., Tellez J., et al. (2006). Connexins in the Sinoatrial and Atrioventricular Nodes. Adv. Cardiol. 42, 175–197. doi:10.1159/000092569
Bychkov R., Juhaszova M., Tsutsui K., Coletta C., Stern M. D., Maltsev V. A., et al. (2020). Synchronized Cardiac Impulses Emerge from Heterogeneous Local Calcium Signals within and Among Cells of Pacemaker Tissue. JACC: Clin. Electrophysiol. 6, 907–931. doi:10.1016/j.jacep.2020.06.022
Camelliti P., Green C. R., Legrice I., Kohl P. (2004). Fibroblast Network in Rabbit Sinoatrial Node. Circ. Res. 94, 828–835. doi:10.1161/01.RES.0000122382.19400.14
Campana C. A. (2015). 2-Dimensional Computational Model to Analyze the Effects of Cellular Heterogeinity on Cardiac Pacemaking. Bologna, Italy: Universita di Bologna, Corso di Studio in Ingegneria Biomedical. PhD thesis.
Clancy C. E., Santana L. F. (2020). Evolving Discovery of the Origin of the Heartbeat. JACC: Clin. Electrophysiol. 6, 932–934. doi:10.1016/j.jacep.2020.07.002
Dobrzynski H., Boyett M. R., Anderson R. H. (2007). New Insights into Pacemaker Activity. Circulation 115, 1921–1932. doi:10.1161/circulationaha.106.616011
Fenske S., Hennis K., Rötzer R. D., Brox V. F., Becirovic E., Scharr A., et al. (2020). cAMP-dependent Regulation of HCN4 Controls the Tonic Entrainment Process in Sinoatrial Node Pacemaker Cells. Nat. Commun. 11, 5555. doi:10.1038/s41467-020-19304-9
Garny A., Noble D., Hunter P. J., Kohl P. (2009). CELLULAR OPEN RESOURCE (COR): Current Status and Future Directions. Phil. Trans. R. Soc. A. 367, 1885–1905. doi:10.1098/rsta.2008.0289
Glaves J. P., Primeau J. O., Espinoza-Fonseca L. M., Lemieux M. J., Young H. S. (2019). The Phospholamban Pentamer Alters Function of the Sarcoplasmic Reticulum Calcium Pump SERCA. Biophysical J. 116, 633–647. doi:10.1016/j.bpj.2019.01.013
Glynn P., Onal B., Hund T. J. (2014). Cycle Length Restitution in Sinoatrial Node Cells: a Theory for Understanding Spontaneous Action Potential Dynamics. PLoS One 9, e89049. doi:10.1371/journal.pone.0089049
Gratz D., Onal B., Dalic A., Hund T. J. (2018). Synchronization of Pacemaking in the Sinoatrial Node: a Mathematical Modeling Study. Front. Phys. 6, 63. doi:10.3389/fphy.2018.00063
Hanna P., Dacey M. J., Brennan J., Moss A., Robbins S., Achanta S., et al. (2021). Innervation and Neuronal Control of the Mammalian Sinoatrial Node a Comprehensive Atlas. Circ. Res. 128, 1279–1296. doi:10.1161/CIRCRESAHA.120.318458
Honjo H., Boyett M. R., Kodama I., Toyama J. (1996). Correlation between Electrical Activity and the Size of Rabbit Sino-Atrial Node Cells. J. Physiol. 496 (Pt 3), 795–808. doi:10.1113/jphysiol.1996.sp021728
Honjo H., Lei M., Boyett M. R., Kodama I. (1999). Heterogeneity of 4-Aminopyridine-Sensitive Current in Rabbit Sinoatrial Node Cells. Am. J. Physiology-Heart Circulatory Physiol. 276, H1295–H1304. doi:10.1152/ajpheart.1999.276.4.h1295
Huang X., Mi Y., Qian Y., Hu G. (2011). Phase-locking Behaviors in an Ionic Model of Sinoatrial Node Cell and Tissue. Phys. Rev. E 83, 061917. doi:10.1103/PhysRevE.83.061917
Imtiaz M. S., Von Der Weid P.-Y., Laver D. R., Van Helden D. F. (2010). SR Ca2+ Store Refill-A Key Factor in Cardiac Pacemaking. J. Mol. Cell Cardiol. 49, 412–426. doi:10.1016/j.yjmcc.2010.03.015
Inui M., Chamberlain B. K., Saito A., Fleischer S. (1986). The Nature of the Modulation of Ca2+ Transport as Studied by Reconstitution of Cardiac Sarcoplasmic Reticulum. J. Biol. Chem. 261, 1794–1800. doi:10.1016/s0021-9258(17)36010-6
Jalife J. (1984). Mutual Entrainment and Electrical Coupling as Mechanisms for Synchronous Firing of Rabbit Sino-Atrial Pace-Maker Cells. J. Physiol. 356, 221–243. doi:10.1113/jphysiol.1984.sp015461
John R. M., Kumar S. (2016). Sinus Node and Atrial Arrhythmias. Circulation 133, 1892–1900. doi:10.1161/CIRCULATIONAHA.116.018011
Karpaev A. A., Syunyaev R. A., Aliev R. R. (2018). Effects of Fibroblast-Myocyte Coupling on the Sinoatrial Node Activity: A Computational Study. Int. J. Numer. Meth Biomed. Engng 34, e2966. doi:10.1002/cnm.2966
Keith A., Flack M. (1907). The Form and Nature of the Muscular Connections between the Primary Divisions of the Vertebrate Heart. J. Anat. Physiol. 41, 172–189.
Kharche S. R., Vigmond E., Efimov I. R., Dobrzynski H. (2017). Computational Assessment of the Functional Role of Sinoatrial Node Exit Pathways in the Human Heart. PLoS One 12, e0183727. doi:10.1371/journal.pone.0183727
Kim M. S., Maltsev A. V., Monfredi O., Maltseva L. A., Wirth A., Florio M. C., et al. (2018). Heterogeneity of Calcium Clock Functions in Dormant, Dysrhythmically and Rhythmically Firing Single Pacemaker Cells Isolated from SA Node. Cell Calcium 74, 168–179. doi:10.1016/j.ceca.2018.07.002
Kim M. S., Monfredi O., Maltseva L. A., Lakatta E. G., Maltsev V. A. (2021). β-Adrenergic Stimulation Synchronizes a Broad Spectrum of Action Potential Firing Rates of Cardiac Pacemaker Cells toward a Higher Population Average. Cells 10, 2124. doi:10.3390/cells10082124
Kurata Y., Hisatome I., Imanishi S., Shibamoto T. (2002). Dynamical Description of Sinoatrial Node Pacemaking: Improved Mathematical Model for Primary Pacemaker Cell. Am. J. Physiology-Heart Circulatory Physiol. 283, H2074–H2101. doi:10.1152/ajpheart.00900.2001
Kurata Y., Hisatome I., Shibamoto T. (2012). Roles of Sarcoplasmic Reticulum Ca2+ Cycling and Na+/Ca2+ Exchanger in Sinoatrial Node Pacemaking: Insights from Bifurcation Analysis of Mathematical Models. Am. J. Physiology-Heart Circulatory Physiol. 302, H2285–H2300. doi:10.1152/ajpheart.00221.2011
Lakatta E. G., Maltsev V. A., Vinogradova T. M. (2010). A Coupled SYSTEM of Intracellular Ca2+ Clocks and Surface Membrane Voltage Clocks Controls the Timekeeping Mechanism of the Heart's Pacemaker. Circ. Res. 106, 659–673. doi:10.1161/circresaha.109.206078
Lei M., Honjo H., Kodama I., Boyett M. R. (2001). Heterogeneous Expression of the Delayed‐rectifier K + Currents I K,r and I K,s in Rabbit Sinoatrial Node Cells. J. Physiol. 535, 703–714. doi:10.1111/j.1469-7793.2001.t01-1-00703.x
Lei M., Jones S. A., Liu J., Lancaster M. K., Fung S. S.-M., Dobrzynski H., et al. (2004). Requirement of Neuronal- and Cardiac-type Sodium Channels for Murine Sinoatrial Node Pacemaking. J. Physiol. 559, 835–848. doi:10.1113/jphysiol.2004.068643
Li J., Inada S., Schneider J. E., Zhang H., Dobrzynski H., Boyett M. R. (2014). Three-dimensional Computer Model of the Right Atrium Including the Sinoatrial and Atrioventricular Nodes Predicts Classical Nodal Behaviours. PLoS One 9, e112547. doi:10.1371/journal.pone.0112547
Li K., Chu Z., Huang X. (2018). Annihilation of the Pacemaking Activity in the Sinoatrial Node Cell and Tissue. AIP Adv. 8, 125319. doi:10.1063/1.5051509
Li P., Lines G. T., Maleckar M. M., Tveito A. (2013). Mathematical Models of Cardiac Pacemaking Function. Front. Phys. 1, 1. doi:10.3389/fphy.2013.00020
Liu J., Sirenko S., Juhaszova M., Sollott S. J., Shukla S., Yaniv Y., et al. (2014). Age-associated Abnormalities of Intrinsic Automaticity of Sinoatrial Nodal Cells Are Linked to Deficient cAMP-PKA-Ca2+signaling. Am. J. Physiology-Heart Circulatory Physiol. 306, H1385–H1397. doi:10.1152/ajpheart.00088.2014
Luo C. H., Rudy Y. (1994). A Dynamic Model of the Cardiac Ventricular Action Potential. I. Simulations of Ionic Currents and Concentration Changes. Circ. Res. 74, 1071–1096. doi:10.1161/01.res.74.6.1071
Lyashkov A. E., Behar J., Lakatta E. G., Yaniv Y., Maltsev V. A. (2018). Positive Feedback Mechanisms Among Local Ca Releases, NCX, and ICaL Ignite Pacemaker Action Potentials. Biophysical J. 114, 1176–1189. doi:10.1016/j.bpj.2017.12.043
MacDonald E. A., Rose R. A., Quinn T. A. (2020). Neurohumoral Control of Sinoatrial Node Activity and Heart Rate: Insight from Experimental Models and Findings from Humans. Front. Physiol. 11, 170. doi:10.3389/fphys.2020.00170
Maltsev A. V., Maltsev V. A., Stern M. D. (2017a). Clusters of Calcium Release Channels Harness the Ising Phase Transition to Confine Their Elementary Intracellular Signals. Proc. Natl. Acad. Sci. U.S.A. 114, 7525–7530. doi:10.1073/pnas.1701409114
Maltsev A. V., Maltsev V. A., Stern M. D. (2017b). Stabilization of Diastolic Calcium Signal via Calcium Pump Regulation of Complex Local Calcium Releases and Transient Decay in a Computational Model of Cardiac Pacemaker Cell with Individual Release Channels. Plos Comput. Biol. 13, e1005675. doi:10.1371/journal.pcbi.1005675
Maltsev V. A., Lakatta E. G. (2010). A Novel Quantitative Explanation for the Autonomic Modulation of Cardiac Pacemaker Cell Automaticity via a Dynamic System of Sarcolemmal and Intracellular Proteins. Am. J. Physiology-Heart Circulatory Physiol. 298, H2010–H2023. doi:10.1152/ajpheart.00783.2009
Maltsev V. A., Lakatta E. G. (2013). Numerical Models Based on a Minimal Set of Sarcolemmal Electrogenic Proteins and an Intracellular Ca2+ Clock Generate Robust, Flexible, and Energy-Efficient Cardiac Pacemaking. J. Mol. Cell Cardiol. 59, 181–195. doi:10.1016/j.yjmcc.2013.03.004
Maltsev V. A., Lakatta E. G. (2009). Synergism of Coupled Subsarcolemmal Ca2+ clocks and Sarcolemmal Voltage Clocks Confers Robust and Flexible Pacemaker Function in a Novel Pacemaker Cell Model. Am. J. Physiology-Heart Circulatory Physiol. 296, H594–H615. doi:10.1152/ajpheart.01118.2008
Maltsev V. A., Yaniv Y., Maltsev A. V., Stern M. D., Lakatta E. G. (2014). Modern Perspectives on Numerical Modeling of Cardiac Pacemaker Cell. J. Pharmacol. Sci. 125, 6–38. doi:10.1254/jphs.13r04cr
Mangoni M. E., Nargeot J. (2008). Genesis and Regulation of the Heart Automaticity. Physiol. Rev. 88, 919–982. doi:10.1152/physrev.00018.2007
Mattick P., Parrington J., Odia E., Simpson A., Collins T., Terrar D. (2007). Ca2+-stimulated Adenylyl Cyclase Isoform AC1 Is Preferentially Expressed in guinea-pig Sino-Atrial Node Cells and Modulates theIfpacemaker Current. J. Physiol. 582, 1195–1203. doi:10.1113/jphysiol.2007.133439
Michaels D. C., Matyas E. P., Jalife J. (1987). Mechanisms of Sinoatrial Pacemaker Synchronization: a New Hypothesis. Circ. Res. 61, 704–714. doi:10.1161/01.res.61.5.704
Mitrofanova L. B., Gorshkov A. N., Konovalov P. V., Krylova J. S. (2018). Telocytes in the Human Sinoatrial Node. J. Cell. Mol. Med. 22, 521–532. doi:10.1111/jcmm.13340
Monfredi O., Tsutsui K., Ziman B., Stern M. D., Lakatta E. G., Maltsev V. A. (2018). Electrophysiological Heterogeneity of Pacemaker Cells in the Rabbit Intercaval Region, Including the SA Node: Insights from Recording Multiple Ion Currents in Each Cell. Am. J. Physiology-Heart Circulatory Physiol. 314, H403–H414. doi:10.1152/ajpheart.00253.2016
Monfredi O., Tsutsui K., Ziman B., Stern M. D., Lakatta E. G., Maltsev V. A. (2018). Electrophysiological Heterogeneity of Pacemaker Cells in the Rabbit Intercaval Region, Including the SA Node: Insights from Recording Multiple Ion Currents in Each Cell. Am. J. Physiology-Heart Circulatory Physiol. 314, H403–H414. doi:10.1152/ajpheart.00253.2016
Muñoz M. A., Kaur J., Vigmond E. J. (2011). Onset of Atrial Arrhythmias Elicited by Autonomic Modulation of Rabbit Sinoatrial Node Activity: a Modeling Study. Am. J. Physiology-Heart Circulatory Physiol. 301, H1974–H1983. doi:10.1152/ajpheart.00059.2011
Musa H., Lei M., Honjo H., Jones S. A., Dobrzynski H., Lancaster M. K., et al. (2002). Heterogeneous Expression of Ca2+ Handling Proteins in Rabbit Sinoatrial Node. J. Histochem. Cytochem. 50, 311–324. doi:10.1177/002215540205000303
Nicolás Mata A., Román Alonso G., López Garza G., Godinez Fernández J. R., Castro García M. A., Castellanos Ábrego N. P. (2019). Parallel Simulation of the Synchronization of Heterogeneous Cells in the Sinoatrial Node. Concurrency Computat Pract. Exper 32, e5317. doi:10.1002/cpe.5317
Ono K., Iijima T. (2005). Pathophysiological Significance of T-type Ca2+ Channels: Properties and Functional Roles of T-type Ca2+ Channels in Cardiac Pacemaking. J. Pharmacol. Sci. 99, 197–204. doi:10.1254/jphs.fmj05002x2
Onsager L. (1944). Crystal Statistics. I. A Two-Dimensional Model with an Order-Disorder Transition. Phys. Rev. 65, 117–149. doi:10.1103/physrev.65.117
Opthof T. (2007). Embryological Development of Pacemaker Hierarchy and Membrane Currents Related to the Function of the Adult Sinus Node: Implications for Autonomic Modulation of Biopacemakers. Med. Bio Eng. Comput. 45, 119–132. doi:10.1007/s11517-006-0138-x
Oren R. V., Clancy C. E. (2010). Determinants of Heterogeneity, Excitation and Conduction in the Sinoatrial Node: a Model Study. Plos Comput. Biol. 6, e1001041. doi:10.1371/journal.pcbi.1001041
Quinn T. A., Kohl P. (2012). Mechano-sensitivity of Cardiac Pacemaker Function: Pathophysiological Relevance, Experimental Implications, and Conceptual Integration with Other Mechanisms of Rhythmicity. Prog. Biophys. Mol. Biol. 110, 257–268. doi:10.1016/j.pbiomolbio.2012.08.008
Sano T., Sawanobori T., Adaniya H. (1978). Mechanism of Rhythm Determination Among Pacemaker Cells of the Mammalian Sinus Node. Am. J. Physiology-Heart Circulatory Physiol. 235, H379–H384. doi:10.1152/ajpheart.1978.235.4.H379
Severi S., Fantini M., Charawi L. A., Difrancesco D. (2012). An Updated Computational Model of Rabbit Sinoatrial Action Potential to Investigate the Mechanisms of Heart Rate Modulation. J. Physiol. 590, 4483–4499. doi:10.1113/jphysiol.2012.229435
Sirenko S. G., Maltsev V. A., Yaniv Y., Bychkov R., Yaeger D., Vinogradova T., et al. (2016). Electrochemical Na+ and Ca2+ Gradients Drive Coupled-Clock Regulation of Automaticity of Isolated Rabbit Sinoatrial Nodal Pacemaker Cells. Am. J. Physiology-Heart Circulatory Physiol. 311, H251–H267. doi:10.1152/ajpheart.00667.2015
Stern M. D., Maltseva L. A., Juhaszova M., Sollott S. J., Lakatta E. G., Maltsev V. A. (2014). Hierarchical Clustering of Ryanodine Receptors Enables Emergence of a Calcium Clock in Sinoatrial Node Cells. J. Gen. Physiol. 143, 577–604. doi:10.1085/jgp.201311123
Tada M., Inui M. (1983). Regulation of Calcium Transport by the ATPase-Phospholamban System. J. Mol. Cell Cardiol. 15, 565–575. doi:10.1016/0022-2828(83)90267-5
Tanaka H., Komikado C., Namekata I., Nakamura H., Suzuki M., Tsuneoka Y., et al. (2008). Species Difference in the Contribution of T-type Calcium Current to Cardiac Pacemaking as Revealed by R(−)-Efonidipine. J. Pharmacol. Sci. 107, 99–102. doi:10.1254/jphs.sc0070405
Torrente A. G., Mesirca P., Neco P., Rizzetto R., Dubel S., Barrere C., et al. (2016). L-type Cav1.3 Channels Regulate Ryanodine Receptor-dependent Ca2+release during Sino-Atrial Node Pacemaker Activity. Cardiovasc. Res. 109, 451–461. doi:10.1093/cvr/cvw006
Tsutsui K., Monfredi O. J., Sirenko-Tagirova S. G., Maltseva L. A., Bychkov R., Kim M. S., et al. (2018). A Coupled-Clock System Drives the Automaticity of Human Sinoatrial Nodal Pacemaker Cells. Sci. Signal. 11, eaap7608. doi:10.1126/scisignal.aap7608
Tsutsui K., Florio M. C., Yang A., Wirth A. N., Yang D., Kim M. S., et al. (2021). cAMP-Dependent Signaling Restores AP Firing in Dormant SA Node Cells via Enhancement of Surface Membrane Currents and Calcium Coupling. Front. Physiol. 12, 596832. doi:10.3389/fphys.2021.596832
Verheijck E. E., Wessels A., Van Ginneken A. C. G., Bourier J., Markman M. W. M., Vermeulen J. L. M., et al. (1998). Distribution of Atrial and Nodal Cells within the Rabbit Sinoatrial Node. Circulation 97, 1623–1631. doi:10.1161/01.cir.97.16.1623
Vinogradova T. M., Brochet D. X. P., Sirenko S., Li Y., Spurgeon H., Lakatta E. G. (2010). Sarcoplasmic Reticulum Ca2+ Pumping Kinetics Regulates Timing of Local Ca2+ Releases and Spontaneous Beating Rate of Rabbit Sinoatrial Node Pacemaker Cells. Circ. Res. 107, 767–775. doi:10.1161/circresaha.110.220517
Vinogradova T. M., Lakatta E. G. (2009). Regulation of Basal and reserve Cardiac Pacemaker Function by Interactions of cAMP-Mediated PKA-dependent Ca2+ Cycling with Surface Membrane Channels. J. Mol. Cell Cardiol. 47, 456–474. doi:10.1016/j.yjmcc.2009.06.014
Weiss J. N., Qu Z. (2020). The Sinus Node. JACC: Clin. Electrophysiol. 6, 1841–1843. doi:10.1016/j.jacep.2020.09.017
Yang D., Morrell C. H., Lyashkov A. E., Tagirova Sirenko S., Zahanich I., Yaniv Y., et al. (2021). Ca2+ and Membrane Potential Transitions during Action Potentials Are Self-Similar to Each Other and to Variability of AP Firing Intervals across the Broad Physiologic Range of AP Intervals during Autonomic Receptor Stimulation. Front. Physiol. 12, 612770. doi:10.3389/fphys.2021.612770
Yaniv Y., Sirenko S., Ziman B. D., Spurgeon H. A., Maltsev V. A., Lakatta E. G. (2013). New Evidence for Coupled Clock Regulation of the normal Automaticity of Sinoatrial Nodal Pacemaker Cells: Bradycardic Effects of Ivabradine Are Linked to Suppression of Intracellular Ca2+ Cycling. J. Mol. Cell Cardiol. 62, 80–89. doi:10.1016/j.yjmcc.2013.04.026
Younes A., Lyashkov A. E., Graham D., Sheydina A., Volkova M. V., Mitsak M., et al. (2008). Ca2+-stimulated Basal Adenylyl Cyclase Activity Localization in Membrane Lipid Microdomains of Cardiac Sinoatrial Nodal Pacemaker Cells. J. Biol. Chem. 283, 14461–14468. doi:10.1074/jbc.m707540200
Zhang H., Holden A. V., Boyett M. R. (2001). Gradient Model versus Mosaic Model of the Sinoatrial Node. Circulation 103, 584–588. doi:10.1161/01.cir.103.4.584
Keywords: sinoatrial node, coupled-clock pacemaker system, numerical modeling, calcium release, sarcoplasmic reticulum, cardiac arrhythmia, sinus node arrest, sick sinus syndrome
Citation: Maltsev AV, Stern MD, Lakatta EG and Maltsev VA (2022) Functional Heterogeneity of Cell Populations Increases Robustness of Pacemaker Function in a Numerical Model of the Sinoatrial Node Tissue. Front. Physiol. 13:845634. doi: 10.3389/fphys.2022.845634
Received: 30 December 2021; Accepted: 15 March 2022;
Published: 27 April 2022.
Edited by:
Alexey V. Glukhov, University of Wisconsin-Madison, United StatesReviewed by:
Haibo Ni, University of California, Davis, United StatesCopyright © 2022 Maltsev, Stern, Lakatta and Maltsev. This is an open-access article distributed under the terms of the Creative Commons Attribution License (CC BY). The use, distribution or reproduction in other forums is permitted, provided the original author(s) and the copyright owner(s) are credited and that the original publication in this journal is cited, in accordance with accepted academic practice. No use, distribution or reproduction is permitted which does not comply with these terms.
*Correspondence: Victor A. Maltsev, bWFsdHNldnZpQG1haWwubmloLmdvdg==
Disclaimer: All claims expressed in this article are solely those of the authors and do not necessarily represent those of their affiliated organizations, or those of the publisher, the editors and the reviewers. Any product that may be evaluated in this article or claim that may be made by its manufacturer is not guaranteed or endorsed by the publisher.
Research integrity at Frontiers
Learn more about the work of our research integrity team to safeguard the quality of each article we publish.