 Yaroslav R. Nartsissov
94% of researchers rate our articles as excellent or good
Learn more about the work of our research integrity team to safeguard the quality of each article we publish.
Find out more
METHODS article
Front. Physiol., 22 August 2022
Sec. Vascular Physiology
Volume 13 - 2022 | https://doi.org/10.3389/fphys.2022.843473
This article is part of the Research TopicMethods and Applications in Vascular Physiology: 2021View all 11 articles
A supply of glucose to a nervous tissue is fulfilled by a cerebrovascular network, and further diffusion is known to occur at both an arteriolar and a microvascular level. Despite a direct relation, a blood flow dynamic and reaction-diffusion of metabolites are usually considered separately in the mathematical models. In the present study they are coupled in a multiphysical approach which allows to evaluate the effects of capillary blood flow changes on near-vessels nutrient concentration gradients evidently. Cerebral blood flow (CBF) was described by the non-steady-state Navier-Stokes equations for a non-Newtonian fluid whose constitutive law is given by the Carreau model. A three-level organization of blood–brain barrier (BBB) is modelled by the flux dysconnectivity functions including densities and kinetic properties of glucose transporters. The velocity of a fluid flow in brain extracellular space (ECS) was estimated using Darcy’s law. The equations of reaction-diffusion with convection based on a generated flow field for continues and porous media were used to describe spatial-time gradients of glucose in the capillary lumen and brain parenchyma of a neurovascular unit (NVU), respectively. Changes in CBF were directly simulated using smoothing step-like functions altering the difference of intracapillary pressure in time. The changes of CBF cover both the decrease (on 70%) and the increase (on 50%) in a capillary flow velocity. Analyzing the dynamics of glucose gradients, it was shown that a rapid decrease of a capillary blood flow yields an enhanced level of glucose in a near-capillary nervous tissue if the contacts between astrocytes end-feet are not tight. Under the increased CBF velocities the amplitude of glucose concentration gradients is always enhanced. The introduced approach can be used for estimation of blood flow changes influence not only on glucose but also on other nutrients concentration gradients and for the modelling of distributions of their concentrations near blood vessels in other tissues as well.
It is well-known that a brain is the most nutrient sensitive organ in a human body. The adult human brain is generally limited to the use of glucose to fuel biochemical processes. It has an extremely high demand in metabolites especially in glucose and oxygen (Dwyer, 2002; Jespersen and Østergaard, 2012). The adult human brain consumes 20% of the total energy in the body while it comprises only 2% of the body weight (Ashrafi and Ryan, 2017). Indeed, the delivery of the compounds is fulfilled by a vasculature network which provide intensive cerebral blood flow (CBF) (Nartsissov, 2017).
Any kind of CBF impairment is the cause of sever neurodegenerative disorders like dementia and ischemic stroke (Gursoy-Ozdemir et al., 2012). Certainly, the nutrient supply is directly forming by a convectional reaction-diffusion in brain parenchyma. However, despite an obvious relation, theoretical modelling of a blood flow dynamic and metabolites reaction-diffusion are usually accomplished separately. Moreover, the type of the considered processes is often simplified advisedly. For example, under essential symmetrical properties of the system the general three-dimensional model can be reduced into a one-dimensional radial model by averaging over the vertical and angular variables in cylindrical coordinates and derive the one-dimensional reduced model similar to the lumped model (Calvetti et al., 2015). Sometimes such a way of modelling can be applied for analysis (Aubert and Costalat, 2005). Despite a complexity of the considering tissue, a remarkable success has been recently achieved in modeling of drug delivery systems for treatment of cancer. Numerical modeling of convectional diffusion yields a magnetically controlled intraperitoneal drug targeting system as a solution to improve the drug penetration into the tumor (Rezaeian et al., 2022). Moreover, the simulation results suggest that the thermosensitive liposomal doxorubicin delivery system in smaller tumors is far advantageous than larger ones (Rezaeian et al., 2019). Furthermore, it was shown that a multi-scale computational model in evaluating nano-sized drug-delivery systems can be used as a step forward towards optimization of patient-specific nanomedicine plans (Kashkooli et al., 2022). These findings clearly indicate an ability of combined multyphysical modeling to be a useful tool for pre-clinical and biomedical investigations.
Nevertheless, to get a right conclusion about the regulation properties of the system and explain or predict different effects, one needs to use the experimental or model approaches including an appropriate design of the complex phenomena. In the present study a theoretical approach to description of a spatial nutrient concentration distribution near a blood vessel has been established. It is based on a combination of a direct CBF modelling in a blood capillary with a convectional reaction-diffusion of the metabolite in a surrounding brain tissue. An essential feature of the introduced approach is explicit consideration of the metabolite transport systems in endothelia cells, and astrocyte end-feet. Moreover, the represented design of the model makes it possible to distinguish the lumen- and tissue- orientated surfaces of the endothelial cells.
The represented design of the model adjusts to description of spatial-time gradients of glucose. The same scheme of a physical coupling with the transport systems on the surfaces may be implemented for other metabolites, like lactate, when the membrane transporters can provide a double-direction trans-membrane flow. For nutrients which have no especial transport systems, the approach also pertains, but the main difference will be in the absence of flux dysconnectivity functions on the internal boundaries. The examples of such nutrients are oxygen, nitric oxide, and some xenobiotic drugs. The advantage of the created approach with respect to estimation of the non-steady state metabolites gradients is the fundamental modification of boundary conditions. Indeed, when reaction-diffusion is modeled near a blood vessel the simplest way is to fix the concentration or fluxes on the boundaries corresponding to endothelium layer. However, in such a case the gradients will be unsensitive to the alterations of CBF. The introduced method helps to resolve this problem. Both hemodynamic and a convectional reaction-diffusion are explicitly coupled in a single project model. The introduced approach may examine alterations of metabolite concentrations gradients caused by time-scaled changes of CBF. The developed model is considered by the example of a neurovascular unit (NVU) with respect to diffusion of glucose.
Since turn of this century, it has been becoming clear that neurons, glia and microvessels are organized into well-structured anatomical formations which are involved in the regulation of CBF (Abbott et al., 2006). The brain is sheltered from the changing metabolite concentrations in blood by the obstacle which is called a blood–brain barrier (BBB). It surrounds the central nervous system (CNS) including the spinal cord (Hawkins et al., 2006). A selective ‘physical barrier’ is formed by the complex tight junctions between adjacent endothelial cells. They force most molecular traffic to take a transcellular route across blood/brain contact, rather than moving paracellularly through the junctions, as in most endothelia (Abbott et al., 2006). Moreover, pericytes, astrocytic end-feet and extracellular matrix (ECM) components are also included into the BBB as the structural components (Keaney and Campbell, 2015). These barriers will of course present challenges for delivery of nutrients, essential for normal brain growth, metabolism and function (Hladky and Barrand, 2018). While endothelial cells form the vessel walls, pericytes are embedded in the vascular basement membrane and astrocytic processes almost completely ensheath brain capillaries (Abbott et al., 2010). The endothelial layer is surrounded by a basement membrane and pericytes all closely enveloped by astrocyte (glial) end-feet (Hladky and Barrand, 2016). The pericytes have a contractile function as well as a role in inducing and maintaining barrier properties (Berthiaume et al., 2018). There are also nerve cells close by within the parenchyma. Finally, this whole assembly is called the neurovascular unit (NVU) (Hladky and Barrand, 2018). The role of glial cells is very essential, and it should be even reasonable to use a term “neuro-glial-vascular unit.” However, during our further explanation a classic term NVU will be used because the sense of coupling in the model is to combine a convectional reaction-diffusion of metabolite (neuro including both neurons and glia cells) and hemodynamics (vascular).
At the present stage of a detailed geometry, there is no difference between glia cells and neurons in the medium of convectional reaction-diffusion of metabolites. The parameters are considered as the average values of consumption and diffusion. One should remark that the same structure appears under any level of vasculature bifurcation in brain but for large and medium arteries a smooth muscle wall must be considered as an external cover of endothelial cells. However, due to a relatively high CBF rate and the multilevel boundary structure there is no real diffusion of glucose and other nutrients form the vessels with diameter more than approximately 60 μm. Thus, for description of CBF and metabolites convectional reaction-diffusion coupling a structure of capillary type NVU can be properly used. A summarized scheme of NVU is represented in Figure 1A.
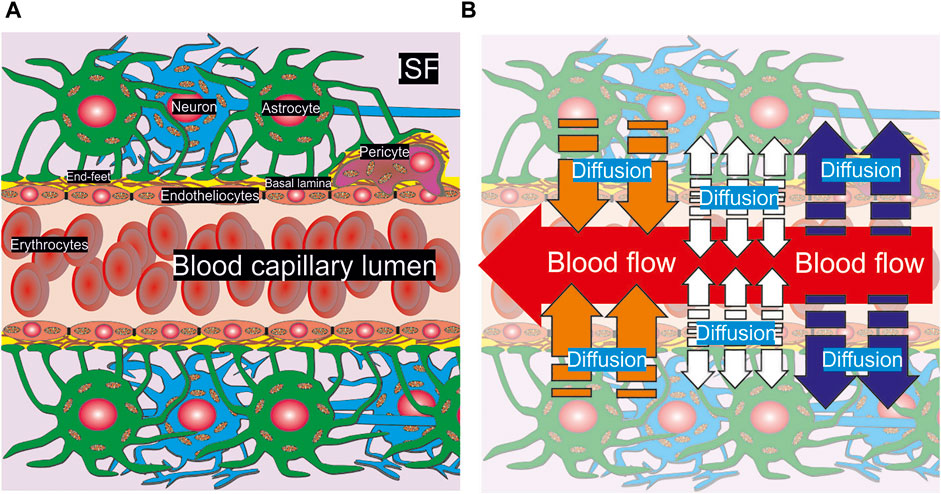
FIGURE 1. A scheme of anatomical composition of NVU. A part of a capillary pipe with erythrocytes included inside is surrounded by basal lamina, a pericyte, astrocytes and neurons (A). The cells are pictured with the nucleus and mitochondria. End-feet are represented as the touch area near basal lamina and the pericyte. The physical processes of convection and diffusion are shown in appropriate areas of NVU (B). A convectional CBF is represented as a red arrow in the capillary lumen. The diffusion of nutrients out/into the blood stream is indicated by blue and orange arrows respectively. The diffusion from the endothelium is marked by white arrows.
It is very essential that the processes in a brain parenchyma near a capillary are clearly structured. On the one hand, blood is coming inside a capillary lumen supplying different chemical compounds. This process is described in terms of the fluid flow dynamics (Pontrelli, 1998) and it is a subject of experimental and theoretical studying of microvascular perfusion (Davis et al., 2008; Jensen and Chernyavsky, 2019). On the other hand, the nutrients can penetrate out or into a blood stream. For small arterioles, pre-capillaries, and capillaries the diffusion will be directed out of lumen (blue arrows, Figure 1B). On the contrary, for veins the opposite direction of metabolites transport dominates (orange arrows, Figure 1B). Some chemical compounds can be synthesized in endothelium cells and then they will spread out in both directions into capillary lumen and brain parenchyma (white arrows, Figure 1B). The example of such a compound is nitric oxide. The introduced approach yields evaluation of nutrients gradients for all possible considered conditions, because CBF and convectional reaction-diffusion are considered explicitly. Nevertheless, the calculations are fulfilled for the example of glucose diffusion.
According to consideration of a complex biological structure mentioned in the previous Section A combined multiphysics approach needs to be used for description of the spatial non-steady state gradients of glucose in NVU. For successful modeling one has to consider different processes which provide evident influence on a glucose level in brain parenchyma. There is a successful example where a combined model has been applied to description of a novel drug delivery system based on the use of acoustic waves and temperature-sensitive liposomes. Herein, using an acoustics-thermal-fluid-mass transport coupling model, it was shown that the effective drug penetration into the tissue increased by 56% compared to conventional drug delivery (Sedaghatkish et al., 2020). In the present study, a mathematical model which describes physical phenomena near the inside/outside space of a blood vessel will be a combination of the fluids flow dynamics, diffusion, and kinetic consumption/production. In fact, the last ones are merged into reaction-diffusion and under a wide range of conditions the first process is included into the governing equation as an appropriate term.
Moreover, one should note that convection is also present in brain parenchyma. Despite a relatively low velocity as compared to CBF, it must be also regarded. Furthermore, a physiologically important role for local parenchymal convective flow in solute transport through brain extracellular space (ECS) is matched against diffusion even though it is not finally approved (Jin et al., 2016). Thus, the model of NVU is proposed as combined consideration of a blood flow and convectional reaction-diffusion for a metabolite both inside the capillary and in a surrounding tissue.
Initially, the geometrical shape of the modelled area must be determined. For this purpose, one needs to create a virtual (digital) phantom (
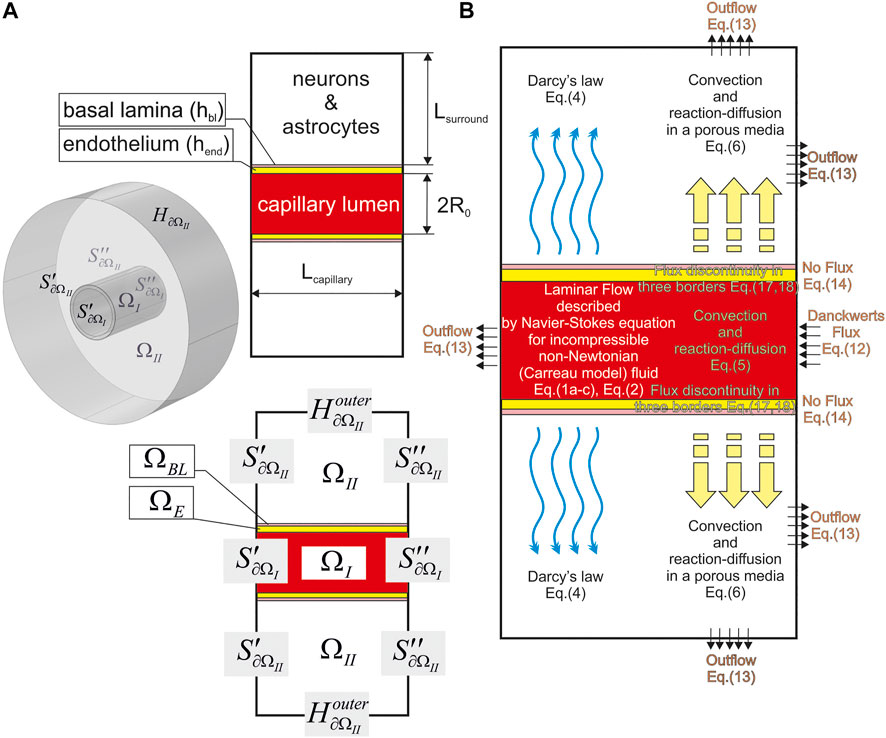
FIGURE 2. A geometry of the used digital NVU phantom. The main parameters are indicated on the plane projection (A) and the indication of the phantom parts and surfaces are shown both in an isometric drawing [The left part of (A)] and the plain view [The bottom part of (A)]. It is assumed that
The rest part of NVU is approximated as a cylinder (
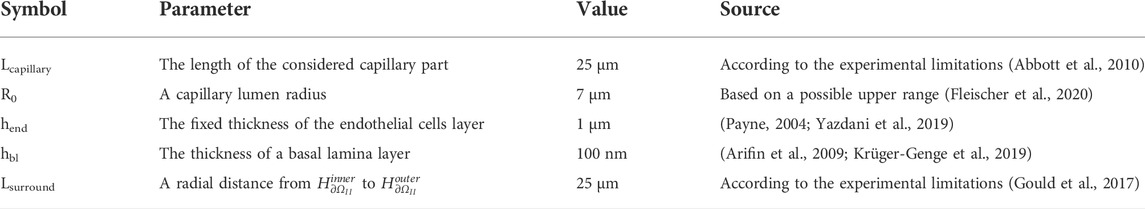
TABLE 1. The geometrical parameters of a NVU virtual phantom used for the modelling.
For many cases, the governing equation for the fluid flow is the non-steady-state Navier-Stokes equation for an incompressible flow without buoyancy effects (Huang et al., 2013; Iasiello et al., 2016)
where
There are a lot of time-dependent models proposed to describe thixotropic and viscoelastic behavior of blood (Yilmaz and Yaar Gundogdu, 2008). They designate the dependence of
Therefore, the Carreau model has been used for Eq. 1a in the present study. According to the Carreau model the dynamics viscosity is described by the following expression:
where
Although the exact value of p under a microcirculation level is controversial, the initial pressure in the capillary has been fixed at
The view of
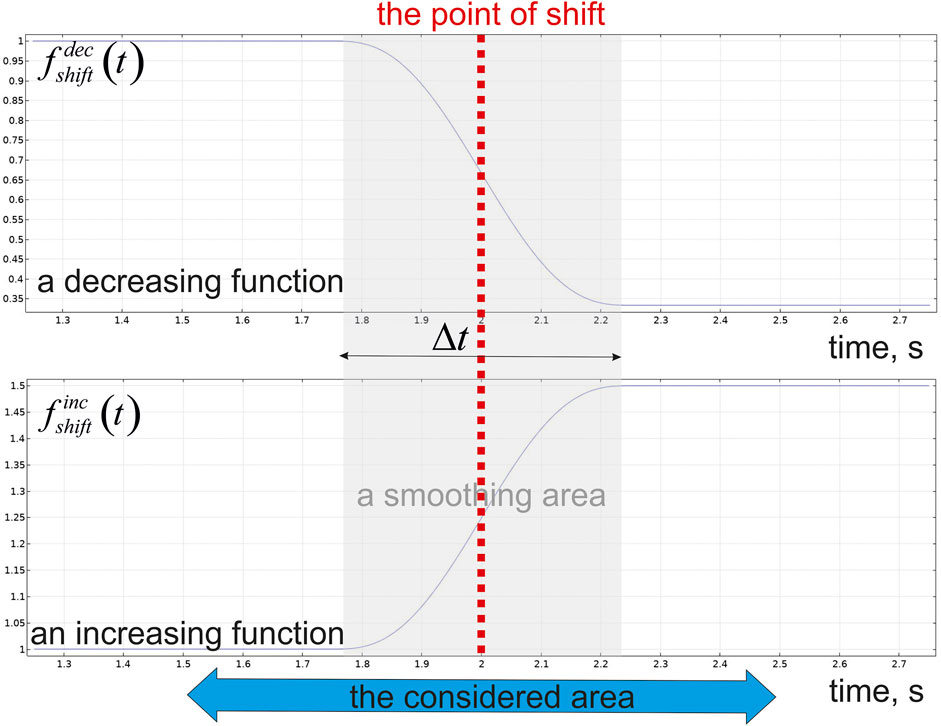
FIGURE 3. The step-like function governing inlet/outlet pressure in a capillary blood flow.
Forming of metabolic gradients near a capillary surface obviously composes of diffusion and advection in the interstitial space which is facilitated by convection of interstitial fluid (ISF) in the paravascular space (Jin et al., 2016). To describe these processes the form of tissue structure geometry should be set explicitly. In some case it has been done on the base of 3D reconstructions of neuropil from electron microscopy images (Kinney, 2009; Mishchenko et al., 2010; Kinney et al., 2013). However, a digital form of the phantom is sometimes created based on the anatomical information. For example, to consider the glymphatic mechanism by modeling diffusive and convective transport in brain ECS, the geometry of the microvascular lobule can be idealized as a hexagonal lattice with a venule at the center, surrounded by six arterioles (Jin et al., 2016).
If the parenchymal structure is not assigned plainly the velocity of fluid flow in brain ECS can be estimated using Darcy’s law,
where
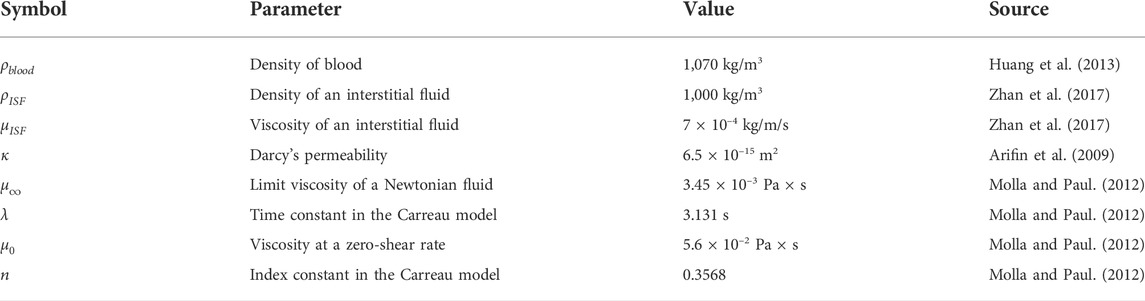
TABLE 2. The main properties of theneeds to consider the diffusion of parenchyma medium and the characteristics of capillary blood flow. It should be stressed that there are a lot of measured values of ρ which are reported to blood. However, the most of them belong to the range from 1,029 kg/m3 (Gijsen et al., 1999; Kim et al., 2008), to 1,087 kg/m3 (Fan et al., 2009). Nevertheless, both a low (1,000 kg/m3), and a high density (1,410 kg/m3) are also described (Chen et al., 2006; Vimmr and Jonasova, 2008).
Having obtained the velocity field
where c is the volume concentration of glucose,
where
where
where the coefficients
Having assumed longitudinal dispersivity is proportional to a linear size of the system (Lsurround) (Pickens and Grisak, 1981) and taking into account the medium value of ISF in approximately 5 × 10⁻⁷ m/s (Zhan et al., 2017), one can neglect the second summand in a right part of Eq. 7. Thus, the dispersion transforms into:
Indeed, tensors in Eqs 5, 6 are the subject for experimental measurements. Despite the attempts to depict the true diffusion process, it was generally accepted that the gradients in a biological tissue be portrayed on a voxel scale of obtained images (Basser and Jones, 2002). In that case the physical diffusion coefficient has been replaced with a global, statistical parameter, the apparent diffusion coefficient (ADC) (Chanraud et al., 2010). The non-invasive observation of the water diffusion driven displacement distributions in vivo provides unique clues to the fine structural features and geometric organization of neural tissues, and the technique of brain tissue anisotropy measurement is actually based on a water diffusion magnetic resonance imaging (Le Bihan, 2003).
Taking together the mentioned above, the elements of diffusion tensors can be represented as production of the mean diffusion coefficient and anisotropy matrix.
Certainly, in a common case it is difficult to indicate the sharp orientation of a short capillary part to parenchyma anisotropy. Nevertheless, without loss of generality one can suppose that
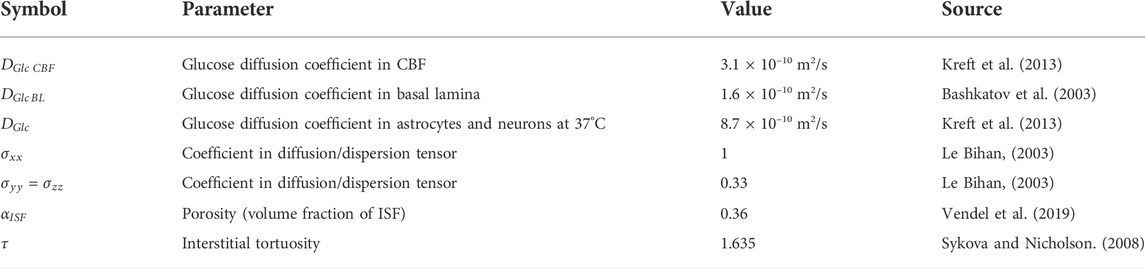
TABLE 3. The diffusion property of the medium. Diffusion coefficients for glucose considered as mean physical values which will be used as
The third summand in the second member of Eqs 5, 6 is corresponds to consumption of glucose in the medium. As for many metabolites this process is mediated by an activity of enzymes transforming an initial substrate to the products of reaction. It should be noticed that the first step of the metabolic pathway for glucose oxidation is considered to be a unique reaction forming
The Eq. 11 includes not only glucose concentration but also concentration of adenosine triphosphate (ATP) -
For any kind of partial differential equation problem, the boundary conditions are the most essential part which determines, in fact, quantitative characteristics of the solution. Moreover, the type of condition is related to the physical properties of the system. It is supposed that the capillary is essentially isolated from the external influence, and the main part of metabolites is coming with CBF. It means that on the end transverse surface of
Another end transverse surface was validated with outflow condition:
Considering a convection field in ISF, the concentrations on
If the virtual phantom length is long i.e.,
It should be stressed that a peculiarity of the brain tissue causes an evident effect of ISF on medium convection properties. Under considered conditions, a flow takes the metabolites away from the blood vessel boundary and it turns mathematical expression of Eq. 14 equal to Eq. 13 for
The gradients of glucose will be always formed under circumstances of non-zero initial values of the metabolite. This essential feature of native compounds has a substantial difference with the same one to the toxic chemicals. Indeed, usual concentration of some mediator or a drug can be awfully close to zero because a high regulatory effect of the molecules needs to be appeared shortly. On the contrary, common participants in the metabolic pathways must be present in an essential amount in tissues all the time. It means that the initial concentrations of each metabolite are reasonably fixed at an average tissue level.
In a common case the sharp values of initial concentrations are varied for different areas. However, the most diversity is observed between CBF and parenchyma.
The essential processes forming the gradients of metabolites near a capillary are the transport across the membranes. The transport of glucose is mediated by a well-known family of sodium-independent bi-directional facilitative transporters from the solute carrier 2 (SLC2) family of which 14 isoforms (GLUTs 1–14) are widely represented in endothelial cells, glia and neurons (Lizák et al., 2019). Despite variety of identified membrane carriers, GLUT1 and GLUT3 are the major glucose transporters in NVU (Patching, 2017). It is described by the usual equation of a passive transport. Under normal circumstances, as it was mentioned above brain glycolysis is not limited by glucose transport, but by phosphorylation of glucose to glucose-6-phosphate. Quantitative measurements suggest an asymmetric distribution of GLUT1 at the luminal and abluminal membranes and up to 40% of the GLUT1 protein may be sequestered within the cell cytoplasm at any given time (Patching, 2017). A number of other studies have quantified the relative amounts of GLUT1 in luminal and abluminal membranes and cytoplasm from humans and from other mammals with variable results (Deng and Yan, 2016).
The existence of the transmembrane transporters in endothelial cells and astrocytes end-feet forms an irregularity in a diffusion process. Indeed, having reached the surfaces of different areas, the molecules of glucose collide with an obstacle. There is no free diffusion available when they pass through
These functions includes both kinetic properties of membrane transporters and their capacity on the surfaces
A superposition of the transport activity is defined as the following expression:
The function
where
Finally, the kinetic constants and the parameters of transporters densities can be found in Table 4.
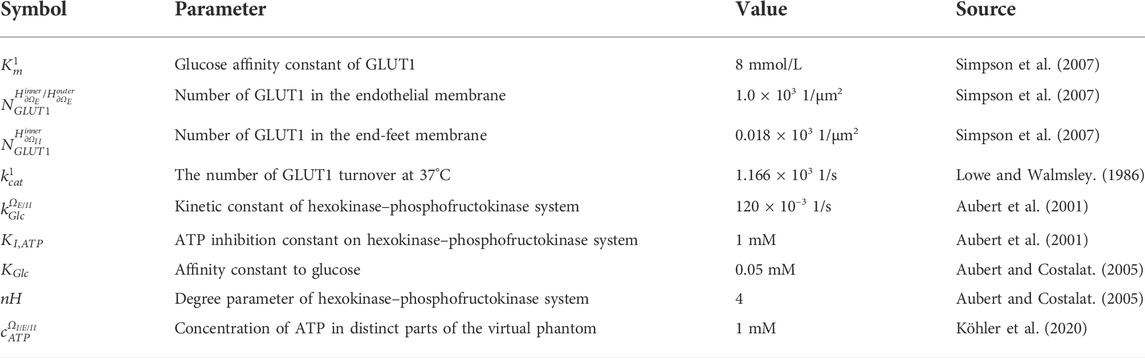
TABLE 4. The parameters of transmembrane glucose transport and the constants of consumption rates for glucose.
The model is created on the base of COMSOL Multiphysics ver. 5.5. All physical processes described above are included into structural geometry of NVU in appropriate way (Figure 2B). As it was mentioned above, the size of the blood vessel is taken as R0 = 7 μm. The set of concentration values is the following
The calculations have been made for the time range from t = 0 to t = 4 s. The considered area in a time scale is chosen as
The results of the modelling are both the velocity field in
The introduced approach makes it possible to evaluate both a velocity field in a blood stream/ISF convection and reaction diffusion of glucose in distinct parts of the considered phantom. Initially, the velocity field for CBF and convection in a nervous parenchyma part was obtained. The diagrams of this field are represented in Figure 4.
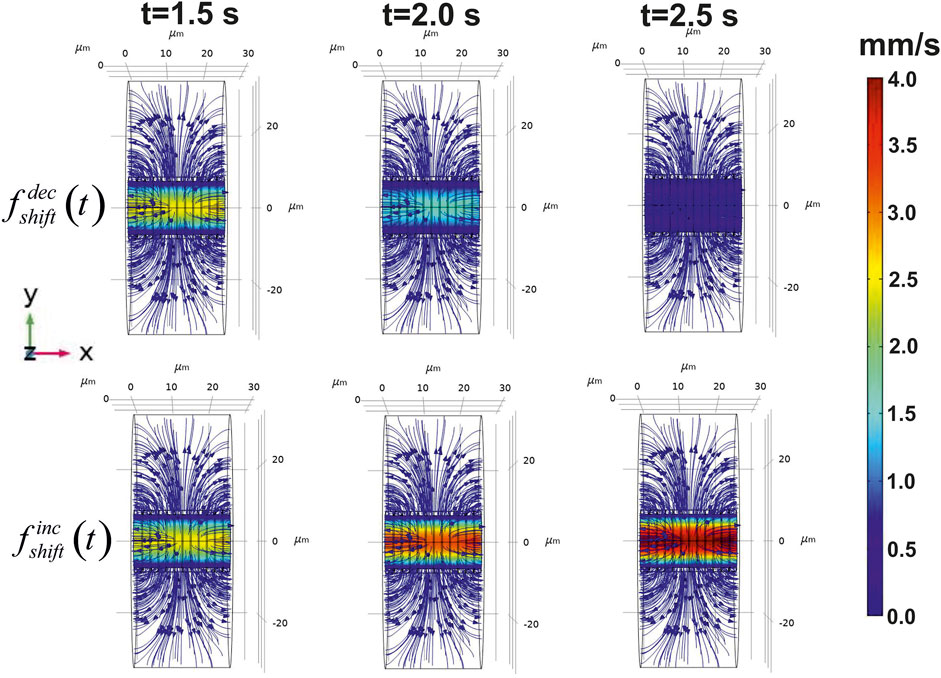
FIGURE 4. Calculated velocity field in the virtual phantom. The blood flow velocities and ISF flow are represented in the three points of the considered time area. The distribution of the velocities is shown on the central longitudinal cut plain XY. The application of the step-like function to the pressure causes either decrease of CBF (
The chosen parameters of the pressure in a considered blood vessel yield the appropriate modeled values of velocity magnitude
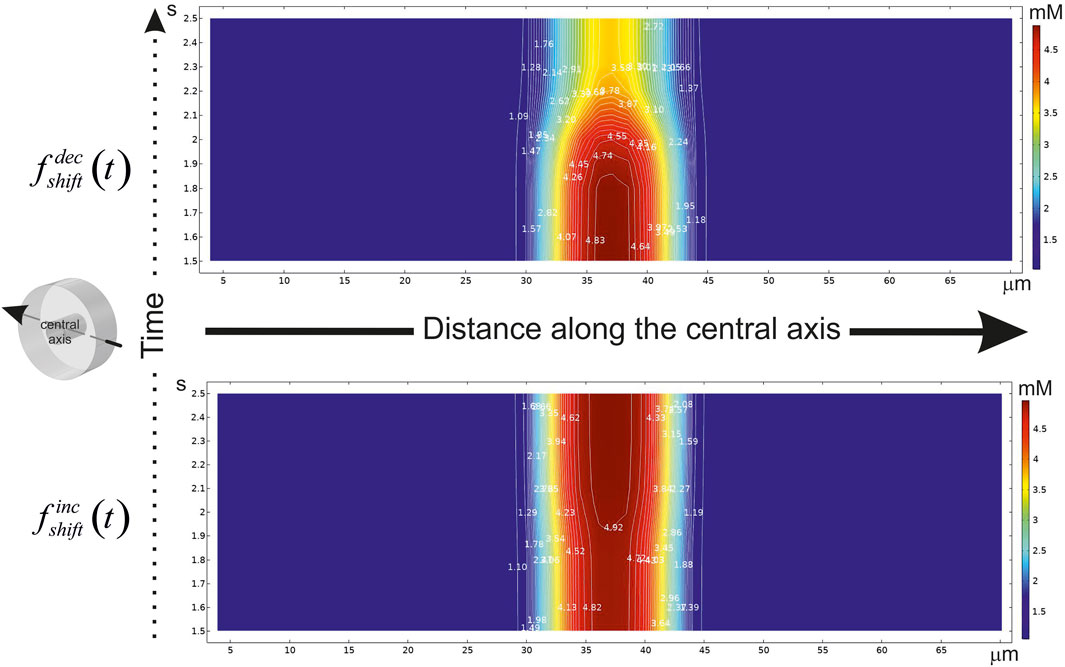
FIGURE 5. A diagram of the glucose concentration changes after CBF shift in time. The abscissa indicates the distance (μm) along the central axis penetrating the virtual phantom at mid-points of X and Y. The axis position is hinted in an isometric illustration in the left. The ordinate indicates the time scale (s). If the step-like function had been applied, CBF either to be decreased (
The essential variance is localized in a smoothing area near the point of shift. Indeed, the main influence on the gradient in
Decrease of an incoming glucose causes a lowered level of this metabolite in the tissue part (Figure 6, top). However, if the area of a free diffusion from the basal lamina is high (
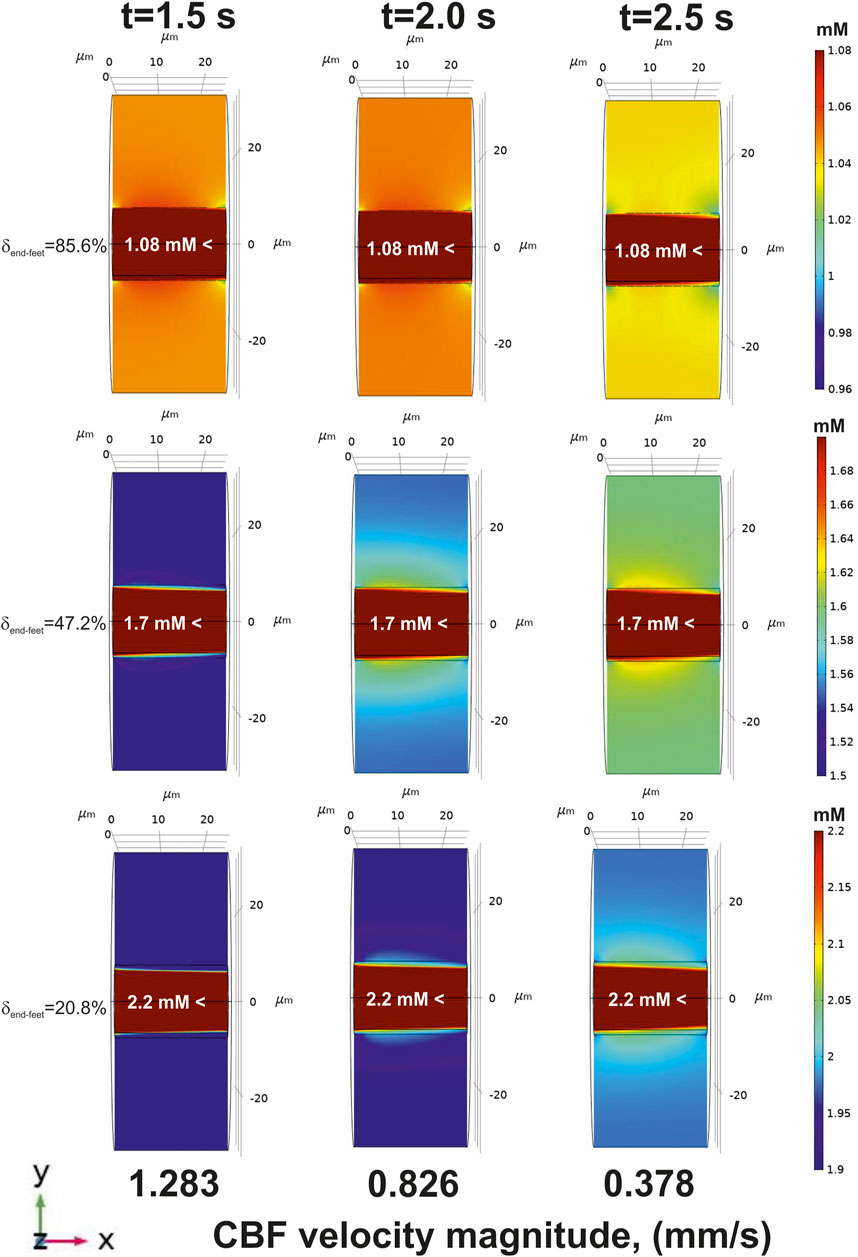
FIGURE 6. The glucose gradients near a blood capillary surface after CBF decrease (an application of
On the contrary, there is no such a difference between
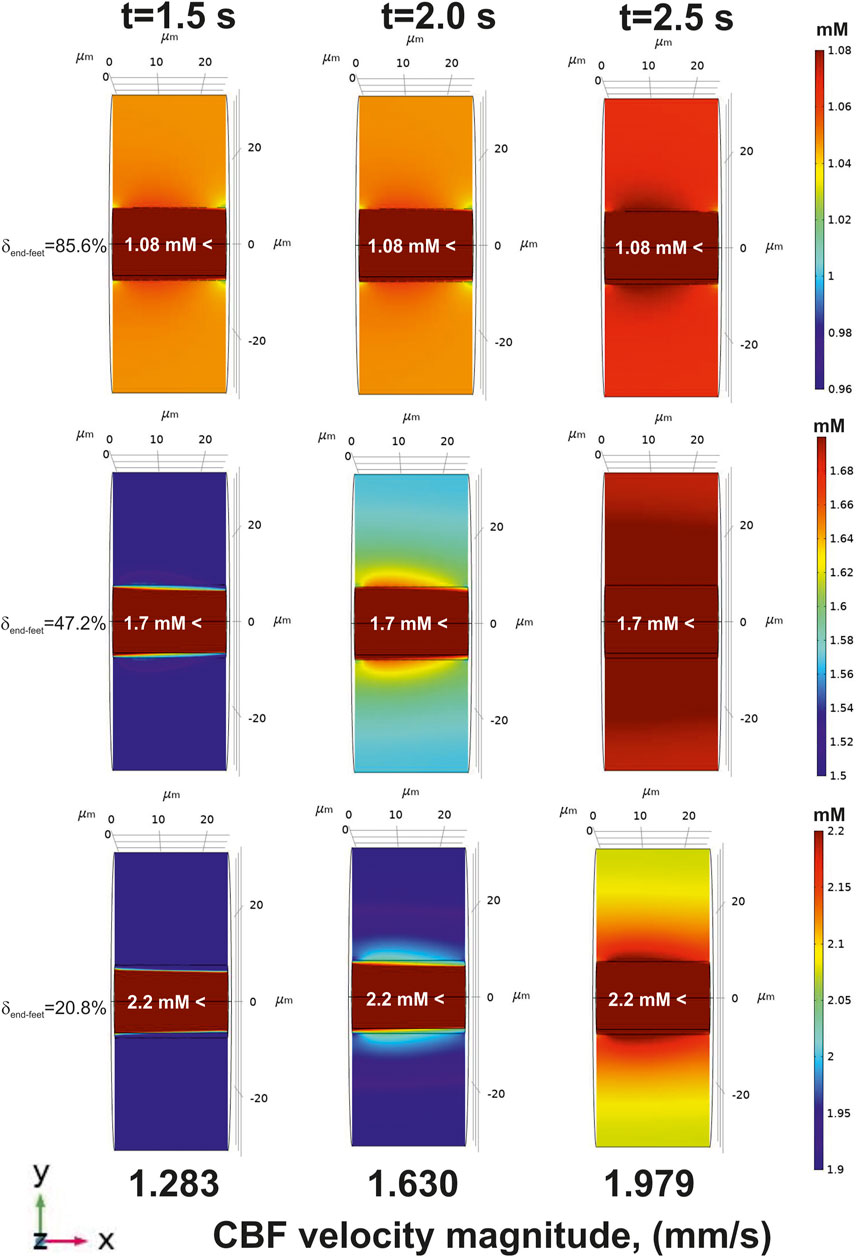
FIGURE 7. The glucose gradients near a blood capillary surface after CBF increase [application of
The results of the introduced multyphysical approach reveal an especial physiological feature of BBB. In a classic view BBB is created by a tight junction between endothelial cells that form the walls of the capillaries (Abbott et al., 2010). Nevertheless, astrocytes also sealed the area around a blood vessel by the end-feet network. Certainly, there is a complex structure of the clefts between the astrocytes where nutrients can penetrate fluently. According to the methodology of the present study it means in that area glucose incomes by a simple diffusion. The existence of a free diffusion area intermitting end-feet was experimentally observed (Hawkins et al., 2006). Moreover, the simulations predicted a very close correspondence between theory and data obtained in rats and humans (Gruetter et al., 1998; Choi et al., 2001) only under conditions when
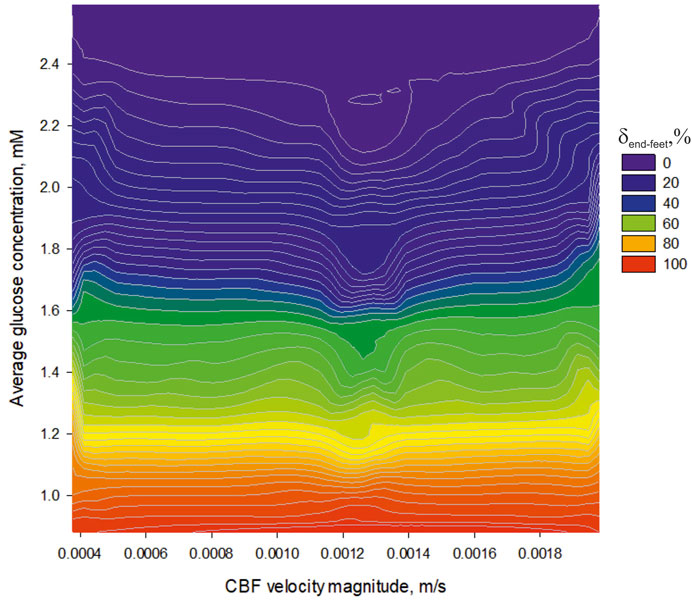
FIGURE 8. The dependence of an average glucose concentration in nervous parenchyma (
A physical background of this phenomenon has previously been explained (Nartsissov, 2021a). The increased CBF always causes an enhanced amplitude of the glucose gradient in
The introduced model has different physiological applications which help clinicians to investigate the aspects of neuropathology. First, the geometry of the phantom
Moreover, the developed approach can be used for estimation of CBF alteration influence on several types of metabolites. For oxygen and nitric oxide, the model will be simplified by the omitting of the flux discontinuity on the internal borders, but the other principles remain the same. For the drugs, the structure of the flux dysconnectivity functions in Eq. 15 should be modified. Additionally, the third summand in the second member of Eqs 5, 6 can be simplified to a linear dependence. However, as in the case of oxygen, the main described algorithm will persist the same.
Another advantage of the model is to evaluate a wide set of physical parameters which are useful for medical purposes. The considered CBF velocities can be transformed into the standard unit of measurement for CBF which is milliliters of blood per 100 g of tissue per minute (Liu, 2015). The considered time area in
Nevertheless, impaired cerebral autoregulation leads to dependence of blood flow on blood pressure, which may affect blood supply to brain when peripheral blood pressure is reduced under physiological and pathological conditions (Hu et al., 2008). This phenomenon is also the subject of consideration in the introduced model.
Another aspect of the introduced approach is a detailed consideration of brain parenchyma—the area
Thus, the introduced method is an adaptive tool for analysis of CBF changes influence on spatial-time gradients of glucose. It can be also used for evaluation of non-steady state spatial distribution of different chemical compounds. Certainly, the supposed model can be applied not only to modeling of brain parenchyma but also for estimation of the gradients near blood vessels in other tissues as well.
The original contributions presented in the study are included in the article/Supplementary Material, further inquiries can be directed to the corresponding author.
YN developed algorithms, created the model in COMSOL Multiphysics Software, fulfilled all calculations, designed the work, analysed the data, wrote, and edited the text.
The author would like to thank Dr. Dmitry Lazarev for his consultations in preparing the project model in COMSOL Multiphysics Software.
The authors declare that the research was conducted in the absence of any commercial or financial relationships that could be construed as a potential conflict of interest.
All claims expressed in this article are solely those of the authors and do not necessarily represent those of their affiliated organizations, or those of the publisher, the editors and the reviewers. Any product that may be evaluated in this article, or claim that may be made by its manufacturer, is not guaranteed or endorsed by the publisher.
Abbott N. J., Patabendige A. A. K., Dolman D. E. M., Yusof S. R., Begley D. J. (2010). Structure and Function of the Blood-Brain Barrier. Neurobiol. Dis. 37 (1), 13–25. doi:10.1016/j.nbd.2009.07.030
Abbott N. J., Rönnbäck L., Hansson E. (2006). Astrocyte-endothelial Interactions at the Blood-Brain barrier.Review DB - Scopus. Nat. Rev. Neurosci. 7 (1), 41–53. doi:10.1038/nrn1824
Ainscow E. K., Mirshamsi S., Tang T., Ashford M. L. J., Rutter G. A. (2002). Dynamic Imaging of Free Cytosolic ATP Concentration during Fuel Sensing by Rat Hypothalamic Neurones: Evidence for ATP-independent Control of ATP-Sensitive K+ Channels. J. Physiol. 544 (2), 429–445. doi:10.1113/jphysiol.2002.022434
Arifin D. Y., Lee K. Y. T., Wang C. H. (2009). Chemotherapeutic Drug Transport to Brain Tumor. J. Control. Release 137 (3), 203–210. doi:10.1016/j.jconrel.2009.04.013
Ashrafi G., Ryan T. A. (2017). Glucose Metabolism in Nerve Terminals. Curr. Opin. Neurobiol. 45, 156–161. doi:10.1016/j.conb.2017.03.007
Aubert A., Costalat R. (2005). Interaction between Astrocytes and Neurons Studied Using a Mathematical Model of Compartmentalized Energy Metabolism. J. Cereb. Blood Flow. Metab. 25 (11), 1476–1490. doi:10.1038/sj.jcbfm.9600144
Aubert A., Costalat R., Valabrègue R. (2001). Modelling of the Coupling between Brain Electrical Activity and Metabolism. Acta Biotheor. 49 (4), 301–326. doi:10.1023/A:1014286728421
Bashkatov A. N., Genina E. A., Sinichkin Y. P., Kochubey V. I., Lakodina N. A., Tuchin V. V. (2003). Glucose and Mannitol Diffusion in Human Dura Mater. Biophys. J. 85 (5), 3310–3318. doi:10.1016/S0006-3495(03)74750-X
Basser P. J., Jones D. K. (2002). Diffusion-tensor MRI: Theory, Experimental Design and Data Analysis - A Technical Review. NMR Biomed. 15 (7-8), 456–467. doi:10.1002/nbm.783
Bear J. (1961). On the Tensor Form of Dispersion in Porous Media. J. Geophys. Res. 66 (4), 1185–1197. doi:10.1029/jz066i004p01185
Berthiaume A. A., Hartmann D. A., Majesky M. W., Bhat N. R., Shih A. Y. (2018). Pericyte Structural Remodeling in Cerebrovascular Health and Homeostasis. Front. Aging Neurosci. 10, 210. doi:10.3389/fnagi.2018.00210
Calvetti D., Cheng Y., Somersalo E. (2015). A Spatially Distributed Computational Model of Brain Cellular Metabolism. J. Theor. Biol. 376, 48–65. doi:10.1016/j.jtbi.2015.03.037
Chanraud S., Zahr N., Sullivan E. V., Pfefferbaum A. (2010). MR Diffusion Tensor Imaging: A Window into White Matter Integrity of the Working Brain. Neuropsychol. Rev. 20 (2), 209–225. doi:10.1007/s11065-010-9129-7
Chen J., Lu X. Y., Wang W. (2006). Non-Newtonian Effects of Blood Flow on Hemodynamics in Distal Vascular Graft Anastomoses. J. Biomech. 39 (11), 1983–1995. doi:10.1016/j.jbiomech.2005.06.012
Choi I. Y., Lee S. P., Kim S. G., Gruetter R. (2001). In Vivo measurements of Brain Glucose Transport Using the Reversible Michaelis-Menten Model and Simultaneous Measurements of Cerebral Blood Flow Changes during Hypoglycemia. J. Cereb. Blood Flow. Metab. 21 (6), 653–663. doi:10.1097/00004647-200106000-00003
Davis M. J., Hill M. A., Kuo L. (2008). “Chapter 6. Local Regulation of Microvascular Perfusion,” in Microcirculation. Second Edition (Academic Press), 161–284.
Delgado J. M. P. Q. (2007). Longitudinal and Transverse Dispersion in Porous Media. Chem. Eng. Res. Des. 85 (9), 1245–1252. doi:10.1205/cherd07017
Deng D., Yan N. (2016). GLUT, SGLT, and SWEET: Structural and Mechanistic Investigations of the Glucose Transporters. Protein Sci. 25 (3), 546–558. doi:10.1002/pro.2858
Fan Y., Jiang W., Zou Y., Li J., Chen J., Deng X. (2009). Numerical Simulation of Pulsatile Non-newtonian Flow in the Carotid Artery Bifurcation. Acta Mech. Sin. 25 (2), 249–255. doi:10.1007/s10409-009-0227-9
Fatahian E., Kordani N., Fatahian H. (2018). A Review on Rheology of Non-newtonian Properties of Blood. IIUM Eng. J. 19 (1), 237–250. doi:10.31436/iiumej.v19i1.826
Fel L., Bear J. (2010). Dispersion and Dispersivity Tensors in Saturated Porous Media with Uniaxial Symmetry. Transp. Porous Media 85 (1), 259–268. doi:10.1007/s11242-010-9558-z
Fleischer S., Tavakol D. N., Vunjak-Novakovic G. (2020). From Arteries to Capillaries: Approaches to Engineering Human Vasculature. Adv. Funct. Mat. 30 (37), 1910811. doi:10.1002/adfm.201910811
Gijsen F. J. H., Allanic E., Van De Vosse F. N., Janssen J. D. (1999). The Influence of the Non-newtonian Properties of Blood on the Flow in Large Arteries: Unsteady Flow in a 90 Degrees Curved Tube. J. Biomech. 32 (7), 705–713. doi:10.1016/S0021-9290(99)00014-7
Gould I. G., Tsai P., Kleinfeld D., Linninger A. (2017). The Capillary Bed Offers the Largest Hemodynamic Resistance to the Cortical Blood Supply. J. Cereb. Blood Flow. Metab. 37 (1), 52–68. doi:10.1177/0271678X16671146
Gruetter R., Ugurbil K., Seaquist E. R. (1998). Steady-state Cerebral Glucose Concentrations and Transport in the Human Brain. J. Neurochem. 70 (1), 397–408. doi:10.1046/j.1471-4159.1998.70010397.x
Gursoy-Ozdemir Y., Yemisci M., Dalkara T. (2012). Microvascular Protection Is Essential for Successful Neuroprotection in Stroke. J. Neurochem. 123 (Suppl. 2), 2–11. doi:10.1111/j.1471-4159.2012.07938.x
Hawkins R. A., O'Kane R. L., Simpson I. A., Viña J. R. (2006). Structure of the Blood-Brain Barrier and its Role in the Transport of Amino acidsConference Paper DB - Scopus. J. Nutr. 136 (1), 218S–226S.
Heinrich R., Schuster S. (1996). The Regulation of Cellular Systems. New York: Springer New York, NY. doi:10.1007/978-1-4613-1161-4
Hladky S. B., Barrand M. A. (2018). Elimination of Substances from the Brain Parenchyma: Efflux via Perivascular Pathways and via the Blood-Brain Barrier. Fluids Barriers CNS 15 (1), 30. doi:10.1186/s12987-018-0113-6
Hladky S. B., Barrand M. A. (2016). Fluid and Ion Transfer across the Blood-Brain and Blood-Cerebrospinal Fluid Barriers; a Comparative Account of Mechanisms and Roles. Fluids Barriers CNS 13 (1), 19. doi:10.1186/s12987-016-0040-3
Hu K., Peng C. K., Huang N. E., Wu Z., Lipsitz L. A., Cavallerano J., et al. (2008). Altered Phase Interactions between Spontaneous Blood Pressure and Flow Fluctuations in Type 2 Diabetes Mellitus: Nonlinear Assessment of Cerebral Autoregulation. Phys. A 387 (10), 2279–2292. doi:10.1016/j.physa.2007.11.052
Huang C., Chai Z., Shi B. (2013). Non-newtonian Effect on Hemodynamic Characteristics of Blood Flow in Stented Cerebral Aneurysm. Commun. Comput. Phys. 13 (3), 916–928. doi:10.4208/cicp.281011.020212s
Hudetz A. G., Fehér G., Kampine J. P. (1996). Heterogeneous Autoregulation of Cerebrocortical Capillary Flow: Evidence for Functional Thoroughfare Channels? Microvasc. Res. 51 (1), 131–136. doi:10.1006/mvre.1996.0015
Iasiello M., Vafai K., Andreozzi A., Bianco N. (2016). Analysis of Non-newtonian Effects on Low-Density Lipoprotein Accumulation in an Artery. J. Biomech. 49 (9), 1437–1446. doi:10.1016/j.jbiomech.2016.03.017
Jensen O. E., Chernyavsky I. L. (2019). Blood Flow and Transport in the Human Placenta Ann. Rev. Fluid Mech. 51 (1), 25–47. doi:10.1146/annurev-fluid-010518-040219
Jespersen S. N., Østergaard L. (2012). The Roles of Cerebral Blood Flow, Capillary Transit Time Heterogeneity, and Oxygen Tension in Brain Oxygenation and Metabolism. J. Cereb. Blood Flow. Metab. 32 (2), 264–277. doi:10.1038/jcbfm.2011.153
Jin B. J., Smith A. J., Verkman A. S. (2016). Spatial Model of Convective Solute Transport in Brain Extracellular Space Does Not Support a "glymphatic" Mechanism. J. Gen. Physiol. 148 (6), 489–501. doi:10.1085/jgp.201611684
Kashkooli F. M., Rezaeian M., Soltani M. (2022). Drug Delivery through Nanoparticles in Solid Tumors: a Mechanistic Understanding. Nanomedicine 17, 695–716. doi:10.2217/nnm-2021-0126
Keaney J., Campbell M. (2015). The Dynamic Blood-Brain Barrier. FEBS J. 282 (21), 4067–4079. doi:10.1111/febs.13412
Kim Y. H., VandeVord P. J., Lee J. S. (2008). Multiphase Non-Newtonian Effects on Pulsatile Hemodynamics in a Coronary Artery. Internat. J. Numerical Methods Fluids 58 (7), 803–825. doi:10.1002/fld.1768
Kinney J. P. (2009). Investigation of Neurotransmitter Diffusion in Three- Dimensional Reconstructions of Hippocampal Neuropil. PhD, University of California.
Kinney J. P., Spacek J., Bartol T. M., Bajaj C. L., Harris K. M., Sejnowski T. J. (2013). Extracellular Sheets and Tunnels Modulate Glutamate Diffusion in Hippocampal Neuropil. J. Comp. Neurol. 521 (2), 448–464. doi:10.1002/cne.23181
Köhler S., Schmidt H., Fülle P., Hirrlinger J., Winkler U. (2020). A Dual Nanosensor Approach to Determine the Cytosolic Concentration of ATP in Astrocytes. Front. Cell. Neurosci. 14, 565921. doi:10.3389/fncel.2020.565921
Kopylova V. S., Boronovskiy S. E., Nartsissov Y. R. (2017). Fundamental Principles of Vascular Network Topology. Biochem. Soc. Trans. 45 (3), 839–844. doi:10.1042/BST20160409
Kreft M., Lukšič M., Zorec T. M., Prebil M., Zorec R. (2013). Diffusion of D-Glucose Measured in the Cytosol of a Single Astrocyte. Cell. Mol. Life Sci. 70 (8), 1483–1492. doi:10.1007/s00018-012-1219-7
Krüger-Genge A., Blocki A., Franke R. P., Jung F. (2019). Vascular Endothelial Cell Biology: An Update. Int. J. Mol. Sci. 20 (18), E4411. doi:10.3390/ijms20184411
Le Bihan D. (2003). Looking into the Functional Architecture of the Brain with Diffusion MRI. Nat. Rev. Neurosci. 4 (6), 469–480. doi:10.1038/nrn1119
Liu T. T. (2015). “Perfusion Imaging with Arterial Spin Labeling MRI,” in Brain Mapping. Editor A. W. Toga (Waltham: Academic Press), 149–154.
Lizák B., Szarka A., Kim Y., Choi K. S., Németh C. E., Marcolongo P., et al. (2019). Glucose Transport and Transporters in the Endomembranes. Int. J. Mol. Sci. 20 (23), E5898. doi:10.3390/ijms20235898
Lowe A. G., Walmsley A. R. (1986). The Kinetics of Glucose Transport in Human Red Blood Cells. Biochim. Biophys. Acta 857 (2), 146–154. doi:10.1016/0005-2736(86)90342-1
Lyons D. G., Parpaleix A., Roche M., Charpak S. (2016). Mapping Oxygen Concentration in the Awake Mouse Brain. eLife 5 (FEBRUARY2016), e12024. doi:10.7554/eLife.12024
Mishchenko Y., Hu T., Spacek J., Mendenhall J., Harris K. M., Chklovskii D. B. (2010). Ultrastructural Analysis of Hippocampal Neuropil from the Connectomics Perspective. Neuron 67 (6), 1009–1020. doi:10.1016/j.neuron.2010.08.014
Molla M. M., Paul M. C. (2012). LES of Non-newtonian Physiological Blood Flow in a Model of Arterial Stenosis. Med. Eng. Phys. 34 (8), 1079–1087. doi:10.1016/j.medengphy.2011.11.013
Nartsissov Y. R. (2021b). A Novel Algorithm of the Digital Nervous Tissue Phantom Creation Based on 3D Voronoi Diagram Application. J. Phys. Conf. Ser. 2090 (1), 012009. doi:10.1088/1742-6596/2090/1/012009
Nartsissov Y. R. (2022). “Amino Acids as Neurotransmitters. The Balance between Excitation and Inhibition as a Background for Future Clinical Applications,” in Recent Advances in Neurochemistry. Editor D. T. Heinbockel.
Nartsissov Y. R. (2017). Geometries of Vasculature Bifurcation Can Affect the Level of Trophic Damage during Formation of a Brain Ischemic Lesion. Biochem. Soc. Trans. 45 (5), 1097–1103. doi:10.1042/BST20160418
Nartsissov Y. R., Mashkovtseva E. V. (2006). Application of Rigid Body Mechanics to Theoretical Description of Rotation within F0F1-ATP Synthase. J. Theor. Biol. 242 (2), 300–308. doi:10.1016/j.jtbi.2006.02.018
Nartsissov Y. R. (2021a). The Effect of Flux Dysconnectivity Functions on Concentration Gradients Changes in a Multicomponent Model of Convectional Reaction-Diffusion by the Example of a Neurovascular Unit. Defect Diffusion Forum 413, 19–28. doi:10.4028/www.scientific.net/ddf.413.19
Patching S. G. (2017). Glucose Transporters at the Blood-Brain Barrier: Function, Regulation and Gateways for Drug Delivery. Mol. Neurobiol. 54 (2), 1046–1077. doi:10.1007/s12035-015-9672-6
Payne S. J. (2004). Analysis of the Effects of Gravity and Wall Thickness in a Model of Blood Flow through Axisymmetric Vessels. Med. Biol. Eng. Comput. 42 (6), 799–806. doi:10.1007/BF02345213
Pickens J. F., Grisak G. E. (1981). Scale‐dependent Dispersion in a Stratified Granular Aquifer. Water Resour. Res. 17 (4), 1191–1211. doi:10.1029/WR017i004p01191
Pontrelli G. (1998). Pulsatile Blood Flow in a Pipe. Comput. Fluids 27 (3), 367–380. doi:10.1016/S0045-7930(97)00041-8
Rezaeian M., Sedaghatkish A., Soltani M. (2019). Numerical Modeling of High-Intensity Focused Ultrasound-Mediated Intraperitoneal Delivery of Thermosensitive Liposomal Doxorubicin for Cancer Chemotherapy. Drug Deliv. 26 (1), 898–917. doi:10.1080/10717544.2019.1660435
Rezaeian M., Soltani M., Karimvand A. N., Raahemifar K. (2022). Mathematical Modeling of Targeted Drug Delivery Using Magnetic Nanoparticles during Intraperitoneal Chemotherapy. Pharmaceutics 14 (2), 324. doi:10.3390/pharmaceutics14020324
Secomb T. W. (2017). Blood Flow in the Microcirculation. Annu. Rev. Fluid Mech. 49, 443–461. doi:10.1146/annurev-fluid-010816-060302
Sedaghatkish A., Rezaeian M., Heydari H., Ranjbar A. M., Soltani M. (2020). Acoustic Streaming and Thermosensitive Liposomes for Drug Delivery into Hepatocellular Carcinoma Tumor Adjacent to Major Hepatic Veins; an Acoustics–Thermal–Fluid-Mass Transport Coupling Model. Int. J. Therm. Sci. 158, 106540. doi:10.1016/j.ijthermalsci.2020.106540
Selivanov V. A., Zagubnaya O. A., Nartsissov Y. R., Cascante M. (2021). Unveiling a Key Role of Oxaloacetate-Glutamate Interaction in Regulation of Respiration and ROS Generation in Nonsynaptic Brain Mitochondria Using a Kinetic Model. PLoS ONE 16 (8), e0255164. doi:10.1371/journal.pone.0255164
Shukla J. B., Parihar R. S., Rao B. R. P. (1980). Effects of Stenosis on Non-newtonian Flow of the Blood in an Artery. Bull. Math. Biol. 42 (3), 283–294. doi:10.1007/BF02460787
Simpson I. A., Carruthers A., Vannucci S. J. (2007). Supply and Demand in Cerebral Energy Metabolism: The Role of Nutrient Transporters. J. Cereb. Blood Flow. Metab. 27 (11), 1766–1791. doi:10.1038/sj.jcbfm.9600521
Stefanovic B., Hutchinson E., Yakovleva V., Schram V., Russell J. T., Belluscio L., et al. (2008). Functional Reactivity of Cerebral Capillaries. J. Cereb. Blood Flow. Metab. 28 (5), 961–972. doi:10.1038/sj.jcbfm.9600590
Syková E., Nicholson C. (2008). Diffusion in Brain Extracellular Space. Physiol. Rev. 88 (4), 1277–1340. doi:10.1152/physrev.00027.2007
Unekawa M., Tomita M., Tomita Y., Toriumi H., Miyaki K., Suzuki N. (2010). RBC Velocities in Single Capillaries of Mouse and Rat Brains Are the Same, Despite 10-fold Difference in Body Size. Brain Res. 1320, 69–73. doi:10.1016/j.brainres.2010.01.032
Vendel E., Rottschäfer V., De Lange E. C. M. (2019). The Need for Mathematical Modelling of Spatial Drug Distribution within the Brain. Fluids Barriers CNS 16 (1), 12. doi:10.1186/s12987-019-0133-x
Vimmr J., Jonasova A. (2008). On the Modelling of Steady Generalized Newtonian Flows in a 3D Coronary Bypass. Eng. Mech. 15 (3), 193–203.
Weiler A., Volkenhoff A., Hertenstein H., Schirmeier S. (2017). Metabolite Transport across the Mammalian and Insect Brain Diffusion Barriers. Neurobiol. Dis. 107, 15–31.
Xing F., Lee J. H., Polucha C., Lee J. (2020). Three-dimensional Imaging of Spatio-Temporal Dynamics of Small Blood Capillary Network in the Cortex Based on Optical Coherence Tomography: A Review. J. Innov. Opt. Health Sci. 13 (1), 2030002. doi:10.1142/S1793545820300025
Yazdani S., Jaldin-Fincati J. R., Pereira R. V. S., Klip A. (2019). Endothelial Cell Barriers: Transport of Molecules between Blood and tissues.Review DB - Scopus. Traffic 20 (6), 390–403. doi:10.1111/tra.12645
Yilmaz F., Yaar Gundogdu M. (2008). A Critical Review on Blood Flow in Large Arteries; Relevance to Blood Rheology, Viscosity Models, and Physiologic Conditions. Korea-Australia Rheology J. 20 (4), 197–211.
Zhan W., Arifin D. Y., Lee T. K., Wang C. H. (2017). Mathematical Modelling of Convection Enhanced Delivery of Carmustine and Paclitaxel for Brain Tumour Therapy. Pharm. Res. 34 (4), 860–873. doi:10.1007/s11095-017-2114-6
Keywords: reaction-diffusion, neurovascular unit, blood flow, nutrients, blood–brain barrier
Citation: Nartsissov YR (2022) Application of a multicomponent model of convectional reaction-diffusion to description of glucose gradients in a neurovascular unit. Front. Physiol. 13:843473. doi: 10.3389/fphys.2022.843473
Received: 26 December 2021; Accepted: 18 July 2022;
Published: 22 August 2022.
Edited by:
Alexey Goltsov, Electronics and Automation, RussiaReviewed by:
Corina Stefania Drapaca, The Pennsylvania State University (PSU), United StatesCopyright © 2022 Nartsissov. This is an open-access article distributed under the terms of the Creative Commons Attribution License (CC BY). The use, distribution or reproduction in other forums is permitted, provided the original author(s) and the copyright owner(s) are credited and that the original publication in this journal is cited, in accordance with accepted academic practice. No use, distribution or reproduction is permitted which does not comply with these terms.
*Correspondence: Yaroslav R. Nartsissov, eWFyb3NsQGJpb3RpYy5kb2wucnU=
Disclaimer: All claims expressed in this article are solely those of the authors and do not necessarily represent those of their affiliated organizations, or those of the publisher, the editors and the reviewers. Any product that may be evaluated in this article or claim that may be made by its manufacturer is not guaranteed or endorsed by the publisher.
Research integrity at Frontiers
Learn more about the work of our research integrity team to safeguard the quality of each article we publish.