 Yang Tian
 Xiangqi Yi
 Kunshan Gao
95% of researchers rate our articles as excellent or good
Learn more about the work of our research integrity team to safeguard the quality of each article we publish.
Find out more
METHODS article
Front. Physiol. , 10 May 2022
Sec. Aquatic Physiology
Volume 13 - 2022 | https://doi.org/10.3389/fphys.2022.838001
This article is part of the Research Topic Methods and Applications in Aquatic Physiology View all 7 articles
Traditional methods using sealed bottles to determine the grazing rates by secondary producers neglect chemical changes induced by biological activities during the incubation, giving rise to instable levels of nutrients, pH, pCO2, pO2 and other chemicals along with changing microalgal cell concentrations and grazers’ metabolism. Here, we used dialysis bags, which allows exchanges of nutrients and gases, to grow microalgae and to determine grazing rates of secondary producers. The specific growth rate of diatom within the dialysis bags increased with increasing water velocities, indicating its suitability to grow microalgae under dynamic water conditions. Then, we compared the grazing rates by the heterotrophic dinoflagellate Noctiluca scintillans measured with the traditional method using polycarbonate (PC) bottles and the approach with the dialysis bags, and found that these two methods gave rise to comparable grazing rates. Nevertheless, the concentrations of inorganic nitrogen and phosphate in the closed PC bottles were about 89–94% lower than those in the dialysis bags due to the microalga’s assimilation. Subsequently, we applied it to determine the grazing rates by a copepod and an oyster (in the presence of other grazers). Consistent results were obtained using the dialysis bags to determine grazing rates by copepods. During the mesocosm (3000 L) experiment in the presence of primary and secondary producers, the grazing rates by the oyster Crassostrea angulata were determined based on the difference of phytoplankton biomass within and outside of the dialysis bags that held all organisms in the mesocosm except the oyster. Since the dialysis bags are permeable to gases, the grazing rates by the oyster under 410 (AC) and 1,000 (HC) μatm CO2 were successfully measured, with a promising result that HC significantly increased the oyster’s grazing. We concluded that using dialysis bags to grow microalgae and to determine grazing rates is a reliable approach, especially under different levels of CO2 and O2.
In aquatic food webs, secondary producers bridge primary producers and higher trophic levels via grazing. Therefore, grazing rates are frequently estimated. It can be assessed in different ways, such as dilution method (Landry and Hassett, 1982), intestinal pigment analysis (Mackas and Bohrer, 1976), radioisotope or fluorescence labeling technique (Lessard and Swift, 1985; Sherr and Sherr, 1987) and prey biomass subtraction method (Frost, 1972). Prey biomass subtraction method has been frequently used in laboratory (Ger et al., 2016), and dilution method has been often employed during field studies (Worden and Binder, 2003). However, due to the lack of exchanges of chemicals and gases with milieu, these traditional methods with small closed containers may cause bottle effects (Gao et al., 2012; Gao 2021). The neglected removals of nutrients and changes of aquatic chemistry, therefore, most likely lead to inaccurate assessment of the grazing rates.
Since dialysis membranes are permeable to ions and small molecules, preventing penetrations of larger particles or microbes, dialysis bags have been employed in marine science studies examining the growth rate of single species or phytoplankton community under in situ environmental conditions (Jensen et al., 1972; Sakshaug, 1977; Furnas, 1982; Furnas, 1990; Mura and Agusti, 1996), the grazing rates of microzooplankton combined with dilution techniques (Landry and Hassett, 1982; Stibor et al., 2006), viral lysis and protistan predation (Weinbauer et al., 2007), allelopathy (Ma et al., 2015), microalgae-bacteria interaction (Zhang et al., 2019) and deep-sea microbes in-situ incubation (Zheng et al., 2021). Apparently, the deficiency in using a completely-closed testing system for grazing measurements could be improved by using the dialysis bags, since nutrients and gases can be easily exchanged between the inner and outside of the bags.
Diatoms and dinoflagellates are two typical phytoplankton groups, playing essential roles in the primary production and biogeochemical cycles. On the other hand, zooplankton and other secondary producers drive energy transfer in trophic webs and contribute to sustainability of marine ecosystems. Therefore, accurate and comparable assessments of growth rates of microalgae and grazing rates of secondary producers are essential in understanding the energy flow and their responses to environmental changes. Here, we used dialysis bags to measure microalgae growth, grazing rates of heterotrophic dinoflagellates and copepods in microcosm and then we applied the dialysis bag approach to measure the grazing rates of oysters in mesocosms. Our results indicate that this approach using dialysis bags can be applied to measure microalgal growth and grazing rates of secondary producers under in situ conditions or in mesocosm studies.
The regenerated cellulose dialysis membranes (Biosharp, Beijing, China) with different molecular weight cut-offs (MWCOs), 7,000 Da (7 KD) and 14,000 Da (14 KD), were cut into sections of 17 cm in length. Since the dry membranes contain glycerin as a humectant and low levels of sulfide and metal ions, they were cleaned and activated according to the manufacturer’s instructions. After being boiled in 2% sodium hydrogen carbonate and 1 mM ethylenediaminetetraacetic acid disodium salt solution (pH 8.0) for 10 min, the membranes were flushed thoroughly by autoclaved reverse osmotic (RO) water and then boiled in 1 mM ethylenediaminetetraacetic acid disodium salt solution (pH 8.0) for another 10 min. The dialysis bags were rinsed further with autoclaved RO water and kept in sterile RO water at 4°C for later uses.
In order to quantify the diffusion performance of the dialysis bags with different MWCOs under different water current speeds, we monitored the changes of CuSO4 concentration in two compartments (within and outside of the bags), which were separated by the dialysis membrane. The reason for choosing CuSO4 as the indicator is that the concentration of copper ions in aqueous solution can be readily measured by a spectrophotometer. Furthermore, nutrients exist generally as ions, and thus the diffusion of Cu2+ through the membrane could be considered as a proxy of nutrients (effective hydrated ionic radii are similar among Cu2+, nitrate, nitrite, phosphate and ammonium, ranging from 0.25 to 0.6 nm) (Speight, 2005). The standard curve for CuSO4 concentration vs. OD800 values was constructed using a UV-VIS spectrophotometer (TU-1810, Persee, China). The CuSO4 solution of 0.1 mol L−1 was injected into each dialysis bag (44 mm in flat width, 17 cm in length, 50 ml). Both ends of the dialysis bag were sealed with polyamide clamps. Then, the sealed bags were placed and fixed in a glass beaker (198 mm in height, 99 mm in diameter) containing 1 L RO water. Different hydrodynamic conditions were obtained by adjusting the speed of a cylindrical polytetrafluoroethylene stirring bar (Ф7 mm, 25 mm in length) driven by a magnetic stirrer (LS-DMS-ProNI, Lichen, China). The velocities at different locations were measured by a portable current meter (LS300-A, Xiangruide, China). The current speeds at the site where the dialysis bags were placed were measured for more than 2 min to gain a stable value. We selected four velocities (0, 1.8, 3.9, 5.1 cm s−1) and two types of dialysis bags (7 KD and 14 KD), and each combination has two replicates. The concentrations of CuSO4 inside and outside of the bags were measured at 0, 1, 3, 5, 7, 9, 11 and 23 h.
Theoretically, the Cu2+ diffusion across the dialysis membranes should follow the Fick’s law of diffusion:
where J is the diffusion flux whose dimension is the amount of Cu2+ per unit area per unit time, (Cin–Cout) is the concentration difference across the dialysis membrane, and D is the diffusion coefficient. With assumed homogeneity of the solution, the corresponding concentrations of Cu2+ can be described as:
where S is the membrane area, Vin is the volume of the dialysis bags, and Vout is the volume of the beaker. Because the size of the dialysis bags used in this experiment is fixed, we multiplied D and S as a new parameter, apparent diffusion coefficient (Dapparent). Therefore, the effect of water velocity on the diffusion can be reflected by the Dapparent. The above differential equations can be solved as follows:
where Cin,t is the concentration of the CuSO4 within the dialysis bags at time t, Cout,t is the concentration of the solute in the beaker at time t, Vin is the volume of the dialysis bags, Vout is the volume of the beaker. Based on the measured Cu2+ concentrations at different time points, the apparent diffusion coefficient can be obtained through nonlinear regression fitting.
The validity of this model we used was confirmed by the effective match between the measured values and the predicted values by the model (Figure 1A). The apparent diffusion coefficient of the dialysis membranes increased linearly with the increasing of the water velocity, and the difference between the two membranes were enlarged with increased water velocities in the beaker (Figure 1B). Due to the relatively higher diffusion performance under water velocities, dialysis bags possessing 14 KD MWCOs were selected for the following experiments.
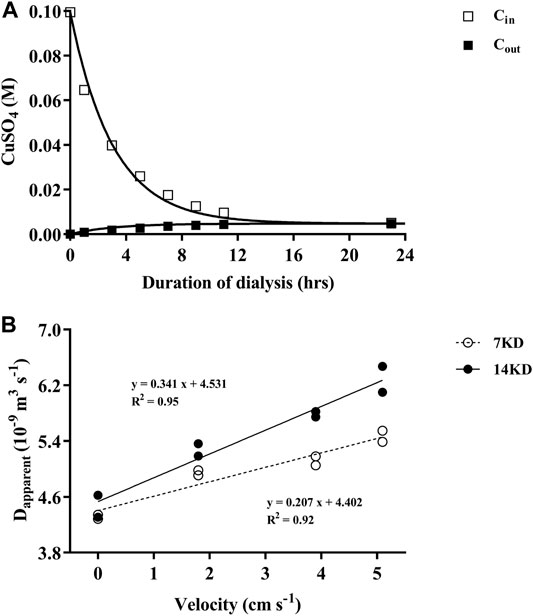
FIGURE 1. (A) The changes of CuSO4 concentrations within (Cin) and outside (Cout) of the dialysis bags over time, with the curves representing the predicted and the squares the measured values. (B) Relationship of the apparent diffusion coefficient (Dapparent) of the dialysis membranes (7, 14 KD) with water velocities outside of the bags.
The centric diatom Thalassiosira weissflogii (strain CCMA 102), obtained from the Center for Collections of Marine Algae (Xiamen University, China), was grown at 20°C in f/2 medium under 230 μmol photons m−2 s−1 (PAR) and a 12:12 h light-dark cycle (Guillard and Ryther, 1962; Guillard, 1975). The microalgal cells in mid-exponential phase were collected by filtration with less than 0.01 MPa vacuum pressure, washed three times by autoclaved artificial seawater and resuspended with modified f/2 mediums containing limited (10 μmol L−1) or replete (882 μmol L−1) nitrogen (nitrate), and then inoculated in the dialysis bags (14 KD, 50 ml in volume). The dialysis bags were placed in a glass beaker containing 1 L of the same medium as in the dialysis bags. Then, the bags were incubated under three hydrodynamic conditions (0, 1.8 and 3.9 cm s−1) for 48 h. The diatom cell concentration was determined by a particle count and size analyzer (Z2, Beckman Coulter, United States), and its specific growth rate was calculated using the following equation:
where N1 and N2 represent cell concentrations at t1 (initial) and t2 (after 2 days).
When there was no mixing in the incubation system, the specific growth rates (d−1) of T.weissflogii grown within dialysis bags under replete and limited nitrogen conditions were 0.75 ± 0.02 and 0.67 ± 0.03, respectively (Figure 2). Exposure to water motion significantly increased the specific growth rate of the diatom, since the water currents could reduce the thickness of the diffusion boundary layer and expedite the exchange of substances (Gao, 2021) (Figure 1). Consequently, the uptake and assimilation of nutrients and CO2 by the microalgal cells could be facilitated. The specific growth rate was significantly enhanced by nearly 18% under nitrogen-limitation but less than 10% under replete nitrate condition, indicating mixing could mitigate the inhibition of growth caused by nitrogen depletion. Although there was no significant difference in the growth rate between 1.8 and 3.9 cm s−1, the mean rates were higher with the faster current speed, especially under N-limited condition. Therefore, using dialysis bags to grow algae can take into account the effects of water motion or mixing on algal physiology.
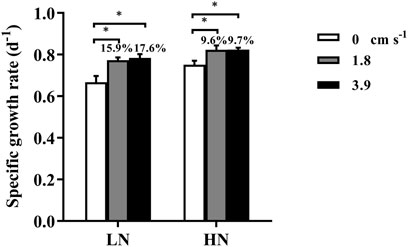
FIGURE 2. The specific growth rate (d−1) of the diatom Thalassiosira weissflogii grown within the dialysis bags (14 KD) under limited (10 μmol L−1, LN) and replete nitrate (882 μmol L−1, HN) and three water velocities (0, 1.8 and 3.9 cm s−1) determined over 48 h. Data are the means ± SD, n = 4 (4 independent dialysis bags). Values above the bars indicate increased proportions of the specific growth rate under water motion compared to that under motionless condition. One-way ANOVA and Tukey’s post-hoc test were employed to check the effects of water velocity on the specific growth rates. Asterisk indicates the significant differences at p < 0.05 level.
We carried out a field experiment to compare the grazing rates using dialysis bags and polycarbonate bottles. The heterotrophic dinoflagellate Noctiluca scintillans was isolated and collected in a subtropical coastal region, Wuyuan Bay, adjacent to the Facility for Ocean Acidification Impacts Study of Xiamen University (FOANIC-XMU) (24°31′48″N, 118°10′47″E), where the test was carried out. Subsequently, the cells of N. scintillans were transferred into 0.22 μm-filtered in-situ seawater for 24 h starvation treatment. On the day of the feeding experiment, 100 similarly sized N. scintillans cells were inoculated in the dialysis bags (14 KD, 600 ml) or PC bottles (600 ml) filled with 180 μm-filtered in-situ seawater with phytoplankton assemblages. The incubations were carried out simultaneously under incident solar radiation, and the bags or bottles free of N. scintillans were served as the controls. There were three replicates for each grazing test. Temperature was controlled similar to that of in situ by continuously running seawater through the water bath (Figure 3A). The water velocity in the bath was 2.2 cm s−1. After 24 h incubation, samples were equally taken from each container for chlorophyll a determination. The samples were filtered onto GF/F filters (Ф25 mm, Whatman, United Kingdom) and extracted in 3.5 ml acetone (90%, final concentration) at 4°C in darkness for 24 h. After centrifugation at 6,000 g for 10 min, the supernatants were measured using a Trilogy laboratory fluorometer (Turner Designs, United States) to determine Chl a concentration. Samples for measuring changed levels of nutrients were filtered through 0.45 μm cellulose acetate membranes, frozen immediately and stored at −20°C until later analysis. The concentration of dissolved inorganic nitrogen (DIN, nitrate plus nitrite), soluble reactive phosphorus (SRP) and silicate (Si(OH)4) were measured photometrically with a Technicon AA3 Auto-Analyzer (SEAL, Germany).The clearance and grazing rates of N.scintillans on natural phytoplankton were determined from the change in chlorophyll a concentration over time using the following equation according to Frost (1972):
where V is the volume of the containers, N is the number of grazers in each grazing group,
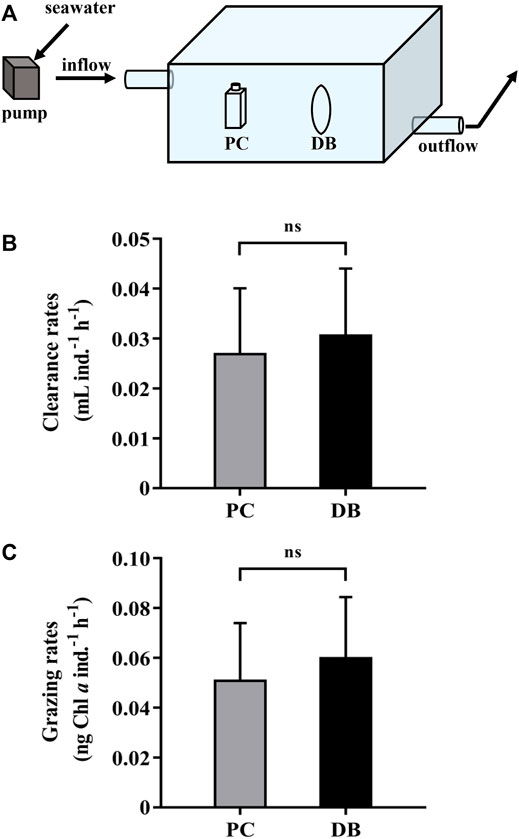
FIGURE 3. (A) A water bath with in situ seawater running through in which the dialysis bags and sealed bottles were incubated to measure and compare the grazing rates. (B) The clearance rates and (C) grazing rates of the heterotrophic dinoflagellates Noctiluca scintillans on natural phytoplankton assemblages during 1-day incubation by using polycarbonate bottles (PC, grey bars) and dialysis bags (DB, black bars). Data are the means ± SD, n = 3 (3 different replicates). Independent samples t-test was used to test the difference in the clearance and grazing rates of N. scintillans between the methods, and the differences were considered to be statistically significant at p < 0.05. The abbreviation ns stands for non-significant differences.
The clearance and grazing rates of the heterotrophic dinoflagellate, N.scintillans, measured using the dialysis bags were respectively 0.031 ± 0.013 ml ind.−1 h−1 and 0.060 ± 0.024 ng Chl a ind.−1 h−1, slightly higher but not statistically different from those obtained by PC bottles, which were 0.027 ± 0.013 ml ind.−1 h−1 and 0.051 ± 0.023 ng Chl a ind.−1 h−1 (Figures 3B,C). At the end of the test, the nutrients in the dialysis bags maintained a relative high level, attributed to the replenishment by in-situ seawater, while DIN and SRP concentrations in the closed PC bottles were about 90% lower than those in the dialysis bags (Table 1). Consequently, using the dialysis bag to determine grazing rates is reliable even for prolonged incubation, since the membrane is permeable to nutrients and small molecules, changes of which could be tremendous in the sealed containers used in the traditional method (Table 1).
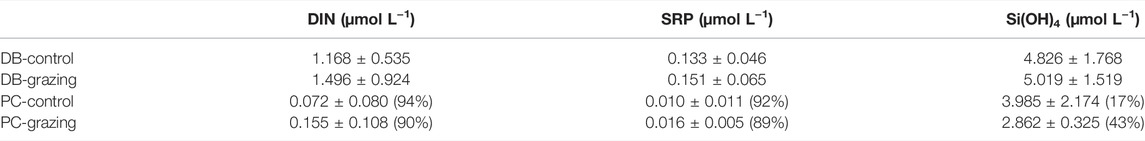
TABLE 1. The concentration of dissolved inorganic nitrogen (DIN, nitrate plus nitrite), soluble reactive phosphorus (SRP) and silicate [Si(OH)4] remained in the dialysis bags (DB) and polycarbonate bottles (PC) at the end of grazing experiment. The relative values in parenthese indicate decreased proportions of the nutrients in the bottles compared to that in the dialysis bags.
The traditional method (M1) for grazing experiments consists of three grazing vessels and one to three control vessels. Here, we designed a method by using a dialysis bag to separate the water in a beaker into two compartments, one for control (prey alone) and one for the grazing (grazer and prey). The microalgae grown within the dialysis bag is deemed as the control group while the zooplankton feed outside of the dialysis bag (M2, Figure 4A). In order to verify the feasibility and validity of this method (M2), we obtained the grazing rates of the copepod, Pseudodiaptomus sp., by M1 and M2. The copepods were collected from Longzhou pool, Xiamen, China and nursed under laboratory conditions. Prior to each grazing experiment, the mature individuals were selected and transferred into 0.22-μm filtered artificial seawater to be starved for 24 h. 120 copepods were aliquoted into 6 glass beakers (1 L) containing the microalgae Isochrysis galbana (initial concentration of 2.5×10⁴ cells mL−1). Simultaneously, I. galbana with the same concentration were introduced into one glass beaker (1 L) and three dialysis bags (60 ml), as the control group for M1 and M2 respectively. In parallel, we put the copepods inside the dialysis bags to graze and the microalgae residing outside of the dialysis bag were deemed as the controls (M3, Figure 4B). The test was conducted in the incubator for 8 h at 23°C either under 4 h light (40 μmol photons m−2 s−1) and 4 h dark (M1, M2) or 8 h light (M2', M3). It should be noted that only 10 copepods were placed into each dialysis bag in M3 due to its relatively small volume (60 ml). The clearance and grazing rates of copepods were determined by the equation in Section 2.4 while the parameter V (volume) equals to the space where the grazers feed.
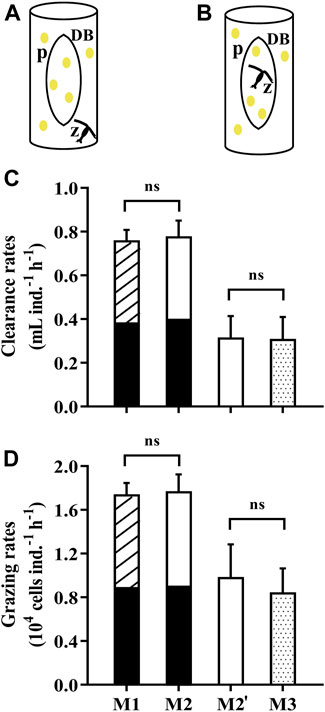
FIGURE 4. (A) The dialysis bags holding the microalga Isochrysis galbana as the control to determine the grazing rates of the copepod Pseudodiaptomus sp. in an open vessel (1L beaker). (B) The dialysis bags holding microalgal cells and the copepod to determine the grazing rates with the phytoplankton in the vessel as the control. The letter “p” represents microalgae, “z” zooplankton and “DB” dialysis bags. (C) The clearance rates and (D) grazing rates of the copepod Pseudodiaptomus sp. on the microalga I.galbana measured by using dialysis bags in different ways (A,B). Specifically, M1 represents the traditional method using vessels with and without the prey, while M2 (A) and M3 (B) used dialysis bags within the vessels as the control or grazing tests, respectively. The comparison between M1 (striped over black bars) and M2 (white over black bars) was carried out over 8 h (4 h light, 4 h dark), while the comparison between M2’ (white bar) and M3 (dotted bars) was under the light conditions of 8 h. Data are the means ± SD, n = 3 (3 different replicates). Independent samples t-test was used to test the difference in the clearance rates and grazing rates between the methods, and significant differences were set at p < 0.05. The abbreviation ns stands for non-significant differences.
During a period of 4 h light and 4 h dark, the clearance rates and grazing rates of Pseudodiaptomus were 0.78 ± 0.07 ml ind.−1 h−1 and 1.77 ± 0.15
We employed the second approach (M2) into a mesocosm study to verify its applicability in a more complex system. During 9 April 2021 to 21 May 2021, eight mesocosms (Figure 5A) were set up on the platform of FOANIC-XMU. Each transparent thermoplastic polyurethane (TPU) bags were filled with 3000 L 0.01 μm filtered in-situ surface seawater by a water purifier (MU801-4T, Midea, China). Four of the eight mesocosms were set as the control groups with ambient level of pCO2 (AC, 410 μatm), while the other four mesocosms were set as the elevated pCO2 (HC, 1,000 μatm) treatment groups by using a CO2 mixer (CE-100B, Wuhan Ruihua, China) (Huang et al., 2021). Subsequently, 100 L 180 μm filtered in-situ seawater was simultaneously added into each mesocosm to construct a natural microflora. After 16 days, 36 Crassostrea angulate juveniles (3–5 months old, shell length = 34.13 ± 4.89 mm, shell height = 19.96 ± 3.77 mm) were evenly placed into three net cages and hanged in each mesocosm in the presence of other grazers.
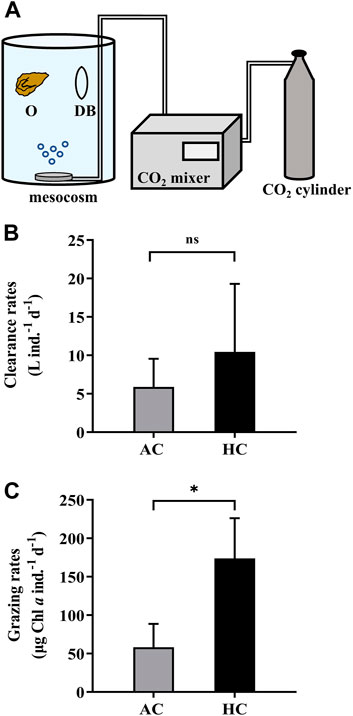
FIGURE 5. The dialysis bags with phytoplankton and zooplankton inside were employed in the mesocosms (3000 L) to determine the grazing rates by oysters (A). The letter “O” represents oysters, and “DB” dialysis bags. The clearance rates (B) and grazing rates (C) of the oysters Crassostrea angulata on natural phytoplankton assemblages in the AC (ambient pCO2, 410 μatm, grey bars) and HC (high pCO2, 1,000 μatm, black bars) mesocosms. Data are the means ± SD, n = 4 (4 independent mesocosms). Independent samples t-test was used to test the difference in the clearance rates and grazing rates of C. angulate between pCO2 treatments. Asterisk indicates the significant difference at p < 0.05 level, and ns stands for non-significant differences.
To conduct the grazing experiment for C. angulate, two dialysis bags were placed and fixed in each mesocosm. Specifically, 2 L sample collected from each mesocosm bag was mixed adequately, and then a portion of it was filtered onto GF/F filters (Ф25 mm, Whatman, United Kingdom) for determination of chlorophyll a concentration before grazing (C0), while another portion were injected into each dialysis bag (600 ml) as the controls in the absence of oyster. Since the changes of chlorophyll a concentration in mesocosms and the dialysis bags were attributed to the growth of phytoplankton and the predation of zooplankton and oysters, samples taken from each mesocosm and each of the dialysis bags in 24 h were filtered for measuring the chlorophyll a concentrations. The chlorophyll a concentration was determined according Ritchie (2006). The clearance and grazing rates of the oysters were calculated by the equations in Section 2.4, except that the parameter V (volume) represents the volume of the mesocosm.
It was found that the elevated pCO2 induced a significantly higher grazing rate of oysters (173.82 ± 52.37 μg Chl a ind.−1 d−1), which was about three times that under ambient pCO2 level (58.31 ± 30.43 μg Chl a ind.−1 d−1) (Figures 5B,C).
Statistical analyses were performed by SPSS 26.0 software. The homogeneity of variance was examined using Levene’s test before the statistical analyses. One-way ANOVA and independent samples t-test were employed to establish differences among treatments. Difference was considered to be statistically significant at p < 0.05.
During the incubations based on the traditional prey biomass subtraction method (Frost, 1972), levels of nutrients, pH, pCO2 and pO2 as well as other chemicals can be altered due to biological processes within the closed water bodies. Using the dialysis bags can improve such bottle effects since the membrane allows exchanges of gases and chemicals. On the other hand, the effects of ultraviolet irradiances on the marine primary and secondary producers have been neglected (Gao et al., 2019), since incubation bottles used for biological investigations are opaque to solar UV radiation. The dialysis membrane allows the transmission of both photosynthetically active radiation (PAR) and UV radiation (Supplementary Figure S1). Therefore, the dialysis bags can be applied in examining the impacts of ocean acidification, hypoxia, and UV radiation on aquatic plankton, since they can easily be placed under exposures to these factors. From the economic perspective, using dialysis bags to measure the grazing rates of secondary producers could reduce the cost by minimizing the number of containers or replicates required for the traditional method. We conclude that using dialysis bags to grow microalgae and to determine grazing rates has the following merits: 1) Reducing the bottle effects due to allowed exchanges of chemicals; 2) enabling comparisons of grazing rates among different grazers within the same environment (mesocosm, microcosm); 3) taking water current speed into account, since mixing or water velocities affect biological activities; 4) being suitable to examine growth rates of microalgae and secondary producers’ grazing activities under different levels of CO2 and O2 while maintaining stable gas partial pressures within and outside of the dialysis bags.
In application of dialysis bags, the following recommendations should be considered:
1. In Section 2.2, we provided a simple model to determine the diffusion property of the membrane. Based on the data (Figure 1), measuring the changes in solute concentration within 3–5 h at 3 time points is enough to derive a reliable apparent diffusion coefficient. The membranes with a higher apparent diffusion coefficient result in higher exchange rates of nutrients and small molecules. Therefore, one can choose proper dialysis membranes for different exchanging rates to examine different biological or biogeochemical processes.
2. Dialysis membrane should be cleaned thoroughly to prevent the experiment system from contamination.
3. Since the epiphytic microorganisms and sticky colloidal particles may adhere to the surface of the membrane due to biofouling, exchanging rates of gases or nutrients could be hindered. Therefore, replacement with new dialysis bags periodically is recommended, if the incubation lasts too long. Inversely, the dialysis bags could be applied to test biofouling effects on biological activities of organisms or communities.
4. The dialysis bags can be used in combination with a bubbled zooplankton grazing rotating wheel (Kim and Kang, 2003) or other agitation apparatus to enhance internal water mixing, facilitating the exchange of nutrients, gases, and metabolites. Therefore, this approach with the dialysis bags can be used to study the effects of water current speed or mixing rates in dynamic water conditions.
5. Since the dialysis bags can be used to measure grazing rates of several different grazers or different groups of secondary producers at the same time in the same environment (Figure 5A), this approach can be expanded to explore grazing rates of different trophic levels simply by combining prey and grazer (or grazers) in the same testing and control dialysis bags. The grazing rates by different grazers or different groups of grazers can be estimated with the same calculation as prey biomass subtraction method (Frost, 1972). To do this, all the dialysis bags should be maintained in the same chemical and physical environments.
6. Before taking subsamples, the dialysis bags should be inverted repeatedly to obtain a homogenized internal cell or individual biomass density.
7. There may be needs to perform the grazing tests using the dialysis bags of larger “pore size,” inquiries can be directed to the membrane manufacturers.
8. Since the dialysis bags are commercially available at very low price, pre-test for applying this method is recommended for different kinds of experiments.
The raw data supporting the conclusions of this article will be made available by the authors, without undue reservation.
KG designed the experiment. YT carried out the experiment. YT and XY analysed the data. YT wrote the manuscript. All authors revised the manuscript.
The study was supported by National Natural Science Foundation of China (41720104005, 41890803, and 41721005).
The authors declare that the research was conducted in the absence of any commercial or financial relationships that could be construed as a potential conflict of interest.
All claims expressed in this article are solely those of the authors and do not necessarily represent those of their affiliated organizations, or those of the publisher, the editors and the reviewers. Any product that may be evaluated in this article, or claim that may be made by its manufacturer, is not guaranteed or endorsed by the publisher.
The authors are grateful to the laboratory engineers Xianglan Zeng and Wenyan Zhao for their logistical and technical support.
The Supplementary Material for this article can be found online at: https://www.frontiersin.org/articles/10.3389/fphys.2022.838001/full#supplementary-material
Frost B. W. (1972). Effects of Size and Concentration of Food Particles on the Feeding Behavior of the Marine Planktonic Copepod Calanus Pacificus 1. Limnol. Oceanogr. 17 (6), 805–815. doi:10.4319/lo.1972.17.6.0805
Furnas M. J. (1982). An Evaluation of Two Diffusion Culture Techniques for Estimating Phytoplankton Growth Rates In Situ. Mar. Biol. 70 (1), 63–72. doi:10.1007/BF00397297
Furnas M. J. (1990). In Situ growth Rates of Marine Phytoplankton: Approaches to Measurement, Community and Species Growth Rates. J. Plankton Res. 12 (6), 1117–1151. doi:10.1093/plankt/12.6.1117
Gao K. (2021). Approaches and Involved Principles to Control pH/pCO2 Stability in Algal Cultures. J. Appl. Phycol. 33 (6), 3497–3505. doi:10.1007/s10811-021-02585-y
Gao K., Beardall J., Häder D.-P., Hall-Spencer J. M., Gao G., Hutchins D. A. (2019). Effects of Ocean Acidification on Marine Photosynthetic Organisms under the Concurrent Influences of Warming, UV Radiation, and Deoxygenation. Front. Mar. Sci. 6, 322. doi:10.3389/fmars.2019.00322
Gao K., Xu J., Zheng Y., Ke C. (2012). Measurement of Benthic Photosynthesis and Calcification in Flowing-Through Seawater with Stable Carbonate Chemistry. Limnol. Oceanogr. Methods 10 (7), 555–559. doi:10.4319/lom.2012.10.555
Ger K. A., Faassen E. J., Pennino M. G., Lürling M. (2016). Effect of the Toxin (Microcystin) Content of Microcystis on Copepod Grazing. Harmful Algae 52, 34–45. doi:10.1016/j.hal.2015.12.008
Guillard R. R. (1975). “''Culture of Phytoplankton for Feeding Marine Invertebrates,” in Culture of Marine Invertebrate Animals. Editors W. L. Smith, and M. H. Chanley (New York: Plenum Press), 26–60. doi:10.1007/978-1-4615-8714-9_3
Guillard R. R. L., Ryther J. H. (1962). Studies of Marine Planktonic Diatoms: I. Cyclotella Nana Hustedt, and Detonula Confervacea (Cleve) Gran. Can. J. Microbiol. 8 (2), 229–239. doi:10.1139/m62-029
Huang R., Sun J., Yang Y., Jiang X., Wang Z., Song X., et al. (2021). Elevated pCO2 Impedes Succession of Phytoplankton Community from Diatoms to Dinoflagellates along with Increased Abundance of Viruses and Bacteria. Front. Mar. Sci. 8 (1212), 642208. doi:10.3389/fmars.2021.642208
Jensen A., Rystad B., Skoglund L. (1972). The Use of Dialysis Culture in Phytoplankton Studies. J. Exp. Mar. Biol. Ecol. 8 (3), 241–248. doi:10.1016/0022-0981(72)90063-9
Kim W.-S., Kang J. H. (2003). A Bubble-Powered Zooplankton Grazing Wheel. J. Plankton Res. 25 (6), 683–686. doi:10.1093/plankt/25.6.683
Landry M. R., Hassett R. P. (1982). Estimating the Grazing Impact of Marine Micro-zooplankton. Mar. Biol. 67 (3), 283–288. doi:10.1007/BF00397668
Lessard E. J., Swift E. (1985). Species-specific Grazing Rates of Heterotrophic Dinoflagellates in Oceanic Waters, Measured with a Dual-Label Radioisotope Technique. Mar. Biol. 87 (3), 289–296. doi:10.1007/BF00397808
Ma H., Wu Y., Gan N., Zheng L., Li T., Song L. (2015). Growth Inhibitory Effect of Microcystis on Aphanizomenon Flos-Aquae Isolated from Cyanobacteria Bloom in Lake Dianchi, China. Harmful Algae 42, 43–51. doi:10.1016/j.hal.2014.12.009
Mackas D., Bohrer R. (1976). Fluorescence Analysis of Zooplankton Gut Contents and an Investigation of Diel Feeding Patterns. J. Exp. Mar. Biol. Ecol. 25 (1), 77–85. doi:10.1016/0022-0981(76)90077-0
Mura M., Agustí S. (1996). Growth Rates of Diatoms from Coastal Antarctic Waters Estimated by In Situ Dialysis Incubation. Mar. Ecol. Prog. Ser. 144 (1-3), 237–245. doi:10.3354/meps144237
Ritchie R. J. (2006). Consistent Sets of Spectrophotometric Chlorophyll Equations for Acetone, Methanol and Ethanol Solvents. Photosynth Res. 89 (1), 27–41. doi:10.1007/s11120-006-9065-9
Sakshaug E. (1977). Limiting Nutrients and Maximum Growth Rates for Diatoms in Narragansett Bay. J. Exp. Mar. Biol. Ecol. 28 (2), 109–123. doi:10.1016/0022-0981(77)90110-1
Sherr E. B., Sherr B. F. (1987). High Rates of Consumption of Bacteria by Pelagic Ciliates. Nature 325 (6106), 710–711. doi:10.1038/325710a0
Stibor H., Gelzleichter A., Hantzsche F., Sommer U., Striebel M., Vadstein O., et al. (2006). Combining Dialysis and Dilution Techniques to Estimate Gross Growth Rate of Phytoplankton and Grazing by Micro- and Mesozooplankton In Situ. archiv_hydrobiologie 167 (1-4), 403–419. doi:10.1127/0003-9136/2006/0167-0403
Weinbauer M. G., Hornák K., Jezbera J., Nedoma J., Dolan J. R., Šimek K. (2007). Synergistic and Antagonistic Effects of Viral Lysis and Protistan Grazing on Bacterial Biomass, Production and Diversity. Environ. Microbiol. 9 (3), 777–788. doi:10.1111/j.1462-2920.2006.01200.x
Worden A., Binder B. (2003). Application of Dilution Experiments for Measuring Growth and Mortality Rates Among Prochlorococcus and Synechococcus Populations in Oligotrophic Environments. Aquat. Microb. Ecol. 30 (2), 159–174. doi:10.3354/ame030159
Zhang M., Lu T., Paerl H. W., Chen Y., Zhang Z., Zhou Z., et al. (2019). Feedback Regulation between Aquatic Microorganisms and the Bloom-Forming Cyanobacterium Microcystis Aeruginosa. Appl. Environ. Microbiol. 85 (21), e01362–01319. doi:10.1128/AEM.01362-19
Keywords: grazing rate, phytoplankton, zooplankton, secondary producer, dialysis bag
Citation: Tian Y, Yi X and Gao K (2022) Applying Dialysis Bags to Grow Microalgae and Measure Grazing Rates by Secondary Producers. Front. Physiol. 13:838001. doi: 10.3389/fphys.2022.838001
Received: 17 December 2021; Accepted: 25 April 2022;
Published: 10 May 2022.
Edited by:
Menghong Hu, Shanghai Ocean University, ChinaReviewed by:
Ghjuvan Grimaud, Michigan State University, United StatesCopyright © 2022 Tian, Yi and Gao. This is an open-access article distributed under the terms of the Creative Commons Attribution License (CC BY). The use, distribution or reproduction in other forums is permitted, provided the original author(s) and the copyright owner(s) are credited and that the original publication in this journal is cited, in accordance with accepted academic practice. No use, distribution or reproduction is permitted which does not comply with these terms.
*Correspondence: Kunshan Gao, a3NnYW9AeG11LmVkdS5jbg==
Disclaimer: All claims expressed in this article are solely those of the authors and do not necessarily represent those of their affiliated organizations, or those of the publisher, the editors and the reviewers. Any product that may be evaluated in this article or claim that may be made by its manufacturer is not guaranteed or endorsed by the publisher.
Research integrity at Frontiers
Learn more about the work of our research integrity team to safeguard the quality of each article we publish.