 Anneloes G. Munneke
 Joost Lumens
 Theo Arts
 Tammo Delhaas
- Department of Biomedical Engineering, CARIM School for Cardiovascular Diseases, Maastricht University, Maastricht, Netherlands
The mechanisms by which cardiac mechanics effect coronary perfusion (cardiac-to-coronary coupling) remain incompletely understood. Several coronary models have been proposed to deepen our understanding of coronary hemodynamics, but possibilities for in-depth studies on cardiac-to-coronary coupling are limited as mechanical properties like myocardial stress and strain are most often neglected. To overcome this limitation, a mathematical model of coronary mechanics and hemodynamics was implemented in the previously published multi-scale CircAdapt model of the closed-loop cardiovascular system. The coronary model consisted of a relatively simple one-dimensional network of the major conduit arteries and veins as well as a lumped parameter model with three transmural layers for the microcirculation. Intramyocardial pressure was assumed to arise from transmission of ventricular cavity pressure into the myocardial wall as well as myocardial stiffness, based on global pump mechanics and local myofiber mechanics. Model-predicted waveforms of global epicardial flow velocity, as well as of intramyocardial flow and diameter were qualitatively and quantitatively compared with reported data. Versatility of the model was demonstrated in a case study of aortic valve stenosis. The reference simulation correctly described the phasic pattern of coronary flow velocity, arterial flow impediment, and intramyocardial differences in coronary flow and diameter. Predicted retrograde flow during early systole in aortic valve stenosis was in agreement with measurements obtained in patients. In conclusion, we presented a powerful multi-scale modeling framework that enables realistic simulation of coronary mechanics and hemodynamics. This modeling framework can be used as a research platform for in-depth studies of cardiac-to-coronary coupling, enabling study of the effect of abnormal myocardial tissue properties on coronary hemodynamics.
Introduction
With the ever increasing load of coronary heart disease, a better understanding of factors that influence coronary function is of utmost clinical importance. Although blood flow and pressure in the proximal epicardial arteries have been studied extensively (Ofili et al., 1993, 1995; Akasaka et al., 1996; Crowley and Shapiro, 1997; Daimon et al., 2005; Davies et al., 2006; Hadjiloizou et al., 2006, 2008; Okura et al., 2006; Tani et al., 2009), microcirculatory data is scarce as clinical measurements, particularly non-invasive ones, are difficult to perform and limited in resolution. Mathematical models, together with experimental studies, have played an important role in deepening our understanding of coronary hemodynamics, providing useful insights into, e.g., the effect of myocardial contraction and intramyocardial pressure on coronary flow waveform (cardiac-to-coronary coupling), pressure wave propagation in epicardial coronary arteries, large microvascular compliance, and transmural differences of flow patterns (Arts and Reneman, 1985; Burattini et al., 1985; Beyar and Sideman, 1987; Bruinsma et al., 1988; Flynn et al., 1992; Ge et al., 2018).
Reported models of the coronary circulation differ largely in form and degree of complexity. The majority of the early models have been of the lumped-parameter [zero-dimensional (0D)] type, testing the key mechanisms by which coronary flow is determined (Suga et al., 1973; Downey and Kirk, 1975; Spaan et al., 1981; Arts and Reneman, 1985; Burattini et al., 1985; Beyar and Sideman, 1987; Krams et al., 1989). The major limitation of the 0D modeling approach is that wave propagation effects, particularly those arising from cardiac contraction (Guiot et al., 1990), are neglected. More recently, therefore, several one-dimensional (1D) models have been proposed to study coronary perfusion by prescribing a time-varying external pressure on subendocardial vessels (Guiot et al., 1990; Rammos et al., 1998; Mynard et al., 2010, 2014; Algranati et al., 2011) or alternatively by coupling the coronary circulation to a left ventricular (LV) time-varying elastance model in an open-loop (Reymond et al., 2009; Duanmu et al., 2019; Scarsoglio et al., 2019) or closed-loop manner (Fan et al., 2020, 2021). Mynard and Smolich (2015, 2016) as well as Ge et al. (2018, 2019) described both left and right ventricular mechanics with a time-varying elastance model coupled to a detailed anatomically based coronary network. Although the above-mentioned 1D models are perfectly suitable to study the effect of valvular and vascular pathologies on coronary flow hemodynamics, a detailed study on cardiac-to-coronary coupling is limited as mechanical properties like myocardial stress and strain are not taken into account. Hence, this approach makes it difficult to study the effect of cardiac pathologies like mechanical dyssynchrony on coronary flow hemodynamics.
The CircAdapt model of the human heart and circulation originally focused on cardiac mechanics and hemodynamics, relating global ventricular pump mechanics to local myofiber mechanics with the one-fiber model for myocardial contraction (Arts et al., 2005). After integration of modules describing mechanical ventricular interaction (Lumens et al., 2009), (heterogeneity in) mechanical behavior in myocardial tissue segments (Walmsley et al., 2015), and 1D wave propagation (Heusinkveld et al., 2019), the multi-scale CircAdapt model enables real-time beat-to-beat simulation of cardiovascular mechanics and hemodynamics in a wide range of physiological and pathophysiological situations. Examples are heart failure with preserved ejection fraction (van Loon et al., 2020), myocardial scar (Huntjens et al., 2014), and mechanical dyssynchrony (Walmsley et al., 2015). A modeling framework that couples a coronary model to the CircAdapt model would enable modifications of myocardial properties per wall (segment), allowing a different cardiac-to-coronary coupling for each coronary vascular bed simulated. Hence, such a modeling framework would be perfectly suited to study the effects of the above-mentioned cardiac pathologies on coronary perfusion.
Therefore, we implemented a model of coronary mechanics into the well-established CircAdapt model to construct a modeling framework that couples ventricular cavity pressure and local myofiber mechanics to the intramyocardial pressure and coronary flow, enabling future in-depth study of cardiac-to-coronary coupling. The anatomical configuration of the coronary circulation was chosen such that the model complexity remains minimal, while still capturing relevant details at each level of the network; the large coronary vessels were modeled one-dimensionally, whereas small vessels were represented by lumped elements. Flexibility of the coronary model was shown by simulation of the influence of aortic valve stenosis on coronary flow.
Materials and Methods
Overview of the Model
The coronary module was integrated in the closed-loop CircAdapt (Arts et al., 2005; Lumens et al., 2009; Walmsley et al., 2015; Heusinkveld et al., 2019) computational model of the cardiovascular system to simulate coronary hemodynamics.1 The CircAdapt model allows fast beat-to-beat simulation of cardiovascular mechanics and hemodynamics in both healthy and (patho-)physiological conditions (Huntjens et al., 2014; Walmsley et al., 2015; van Loon et al., 2020). The multi-scale CircAdapt model consists of a network of different modules representing the main elements of the closed-loop cardiovascular system, including cardiac walls, local cardiac tissue mechanics, cardiac valves, pericardium, large blood vessels, and systemic and pulmonary circulation (Figure 1A). In the next few sections, we will describe the most relevant aspects of the cardiac module and we will introduce the governing equations, modeling assumptions and implementation of the new coronary module in detail. A description of the remainder modules can be found in Arts et al. (2005), Lumens et al. (2009), Walmsley et al. (2015); Heusinkveld et al. (2019).
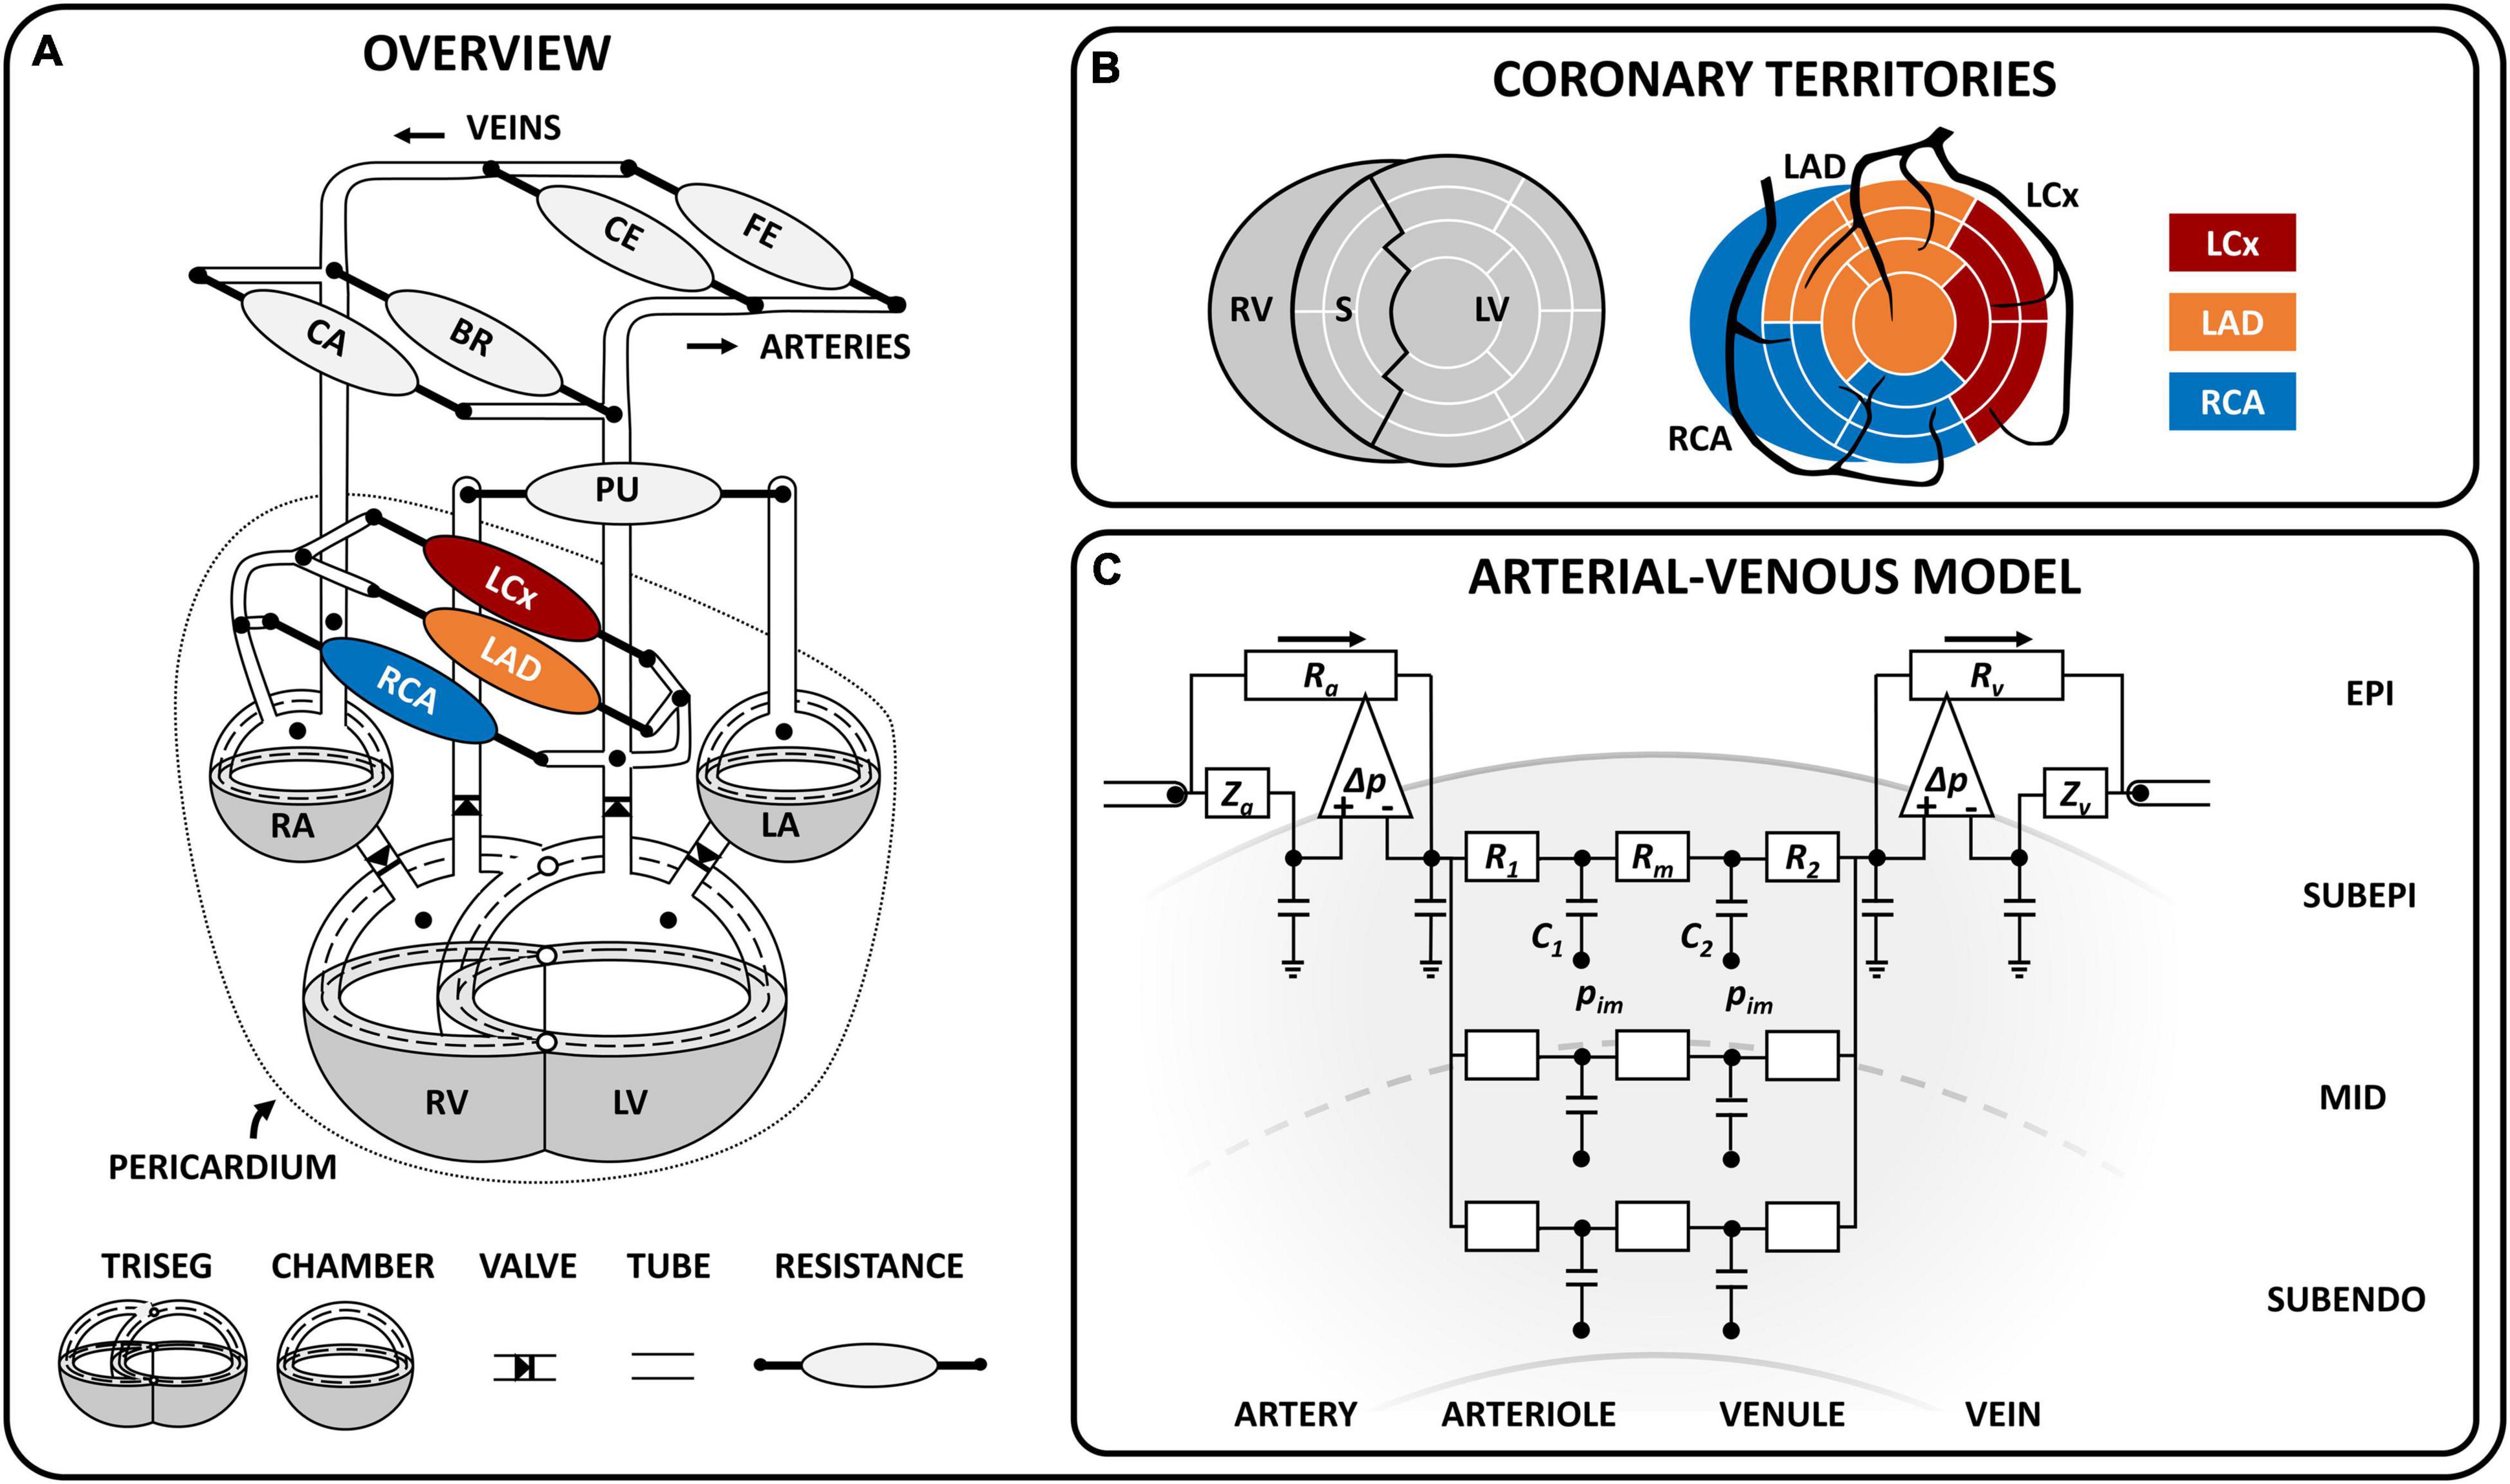
Figure 1. Schematic model overview. (A) Schematic representation of the closed-loop cardiovascular CircAdapt model, including the TriSeg module (Lumens et al., 2009) [which allows mechanical interaction at the junction (°) between the left (LV) and right (RV) ventricle and the septal (S) wall], the chamber module (Arts et al., 2005), valve module (Palau-Caballero et al., 2016), one-dimensional tube module (Heusinkveld et al., 2019), and zero-dimensional arterio-venous resistances for systemic and pulmonary circulation (Arts et al., 2005) as well as coronary circulation. The dashed line indicates the midwall volume; the dotted line indicates the pericardium, which surrounds the heart and coronary circulation. The coronary circulation included three major branches, namely the left circumflex (LCx), left anterior descending (LAD) and right coronary (RCA). (B) Schematic overview of the territory assignment of the three main coronary branches. The LV and S wall were divided into 12 and 5 segments, respectively, using the MultiPatch module (Walmsley et al., 2015). Coronary territories of the LCx, LAD and RCA were assigned to individual segments according to the AHA proposed 17-segment model (Cerqueira et al., 2002). (C) Coronary arterial-venous model with epicardial arterial inlet and venous outlet accounting for wave behavior in the connecting 1D vessel. The pressure difference-controlled flow source (Δ) accommodates high flow conditions (i.e., low peripheral resistance) and makes solving the differential equation for this highly non-linear system less complicated. The arterial-venous model is subdivided into three transmural layers (subepicardium, mid, subendocardium), each containing an arteriolar and venular compartment (with compliances C1 and C2, resistances R1 and R2, and a shared resistance Rm). The intramyocardial pressure (pim) varies between layers and acts on the compliance. BR, brachial; CA, cerebral; CE, celiac; FE, femoral; LA, left atrium; RA, right atrium. Symbols: Ra, arterial resistance; Rv, venous resistance, Za, arterial wave impedance, Zv, venous wave impedance.
Cardiac Module
The cardiac module consists of five walls, i.e., the left and right atrial walls, the left and right ventricular walls and the interventricular septum (Figure 1A). The one-fiber model of myofiber mechanics was previously described (Arts et al., 1991; Walmsley et al., 2015) and relevant equations for this study can be found in Supplementary Material. Briefly, local myofiber mechanics are related to global pump mechanics under the assumption that myofiber tension is homogeneously distributed throughout the cardiac walls (Arts et al., 1991) as follows. Cavity volume stretches the myocardial wall, determining wall area and hence, myofiber strain. A model of myofiber mechanics is used to calculate myofiber stress from myofiber strain. In each cardiac wall, tension is determined by total myofiber stress, which equals the sum of active stress as a result of sarcomere contraction and passive stress originating from microstructural tissue components. With the TriSeg module (Lumens et al., 2009), mechanical ventricular interaction was established by force equilibrium in the junction of the three ventricular walls. Transmural pressure is calculated from wall tension and wall curvature using Laplace’s Law. Cavity pressures are calculated by adding the transmural pressures to the intrapericardial pressure induced by the non-linearly compliant pericardium surrounding the myocardial walls. Model-predicted cavity pressures have been extensively validated previously (Lumens et al., 2009; Walmsley et al., 2015).
With the MultiPatch module (Walmsley et al., 2015), the LV free wall and septum were subdivided into 12 and 5 wall segments, respectively, in order to assign individual myocardial segments to specific coronary territories (Figure 1B) according to the AHA proposed 17 segment-model (Cerqueira et al., 2002).
New Coronary Module
The coronary circulation was modeled similar to the systemic circulation, in which large arteries and veins were represented by 1D tubes coupled to 0D arterio-venous models representing the microcirculation. The level of detail in the present coronary circulation model (e.g., number of 1D branches and 0D intramyocardial layers) was chosen with the objective of describing both epicardial and transmural myocardial sites of the coronary circulation in a simple manner, taking into account the available clinical and experimental data. The resulting coronary module was influenced by the work of Spaan et al. (2000) and Mynard et al. (2014).
One-Dimensional Modeling of the Coronary Vascular Tree
The coronary vascular tree was assumed to consist of four epicardial arteries and five epicardial veins (Figure 1A), modeled as 1D non-linear elastic tubes with a fixed length and variable cross-sectional area, to account for flow distribution and pulse wave propagation. The coronary arterial tree stems directly from the ascending aorta, consisting of (1) the left main (LM) coronary artery, which bifurcates into (2) the left circumflex (LCx) and (3) the left anterior descending (LAD) coronary artery, and (4) the right coronary artery (RCA). The distal ends of the left and right coronary veins were connected to opposite sides of the distal coronary sinus, which then drains by means of the proximal coronary sinus into the right atrium. The tube module with 1D wave propagation was previously described (Heusinkveld et al., 2019). Briefly, the wave behavior can be derived from the principles of conservation of mass and impulse momentum under the assumptions that blood flow in medium to large sized (coronary) vessels behaves incompressible and Newtonian (Ku, 1997). Parameter values for the 1D coronary tree can be found in Supplementary Material.
Lumped Parameter Modeling of the Intramyocardial Vessels
The terminal end of a coronary artery was coupled to a non-linear arterial-venous lumped model as shown in Figure 1C. The arterial-venous model has been described previously (Arts et al., 2012) and was extended to consist of three series-arranged compartments, namely an epicardial arterial compartment, intramyocardial compartment and epicardial venous compartment. Both the epicardial arterial and venous compartments consist of a pressure-dependent wave impedance, compliance and resistance. Separation of wave behavior and resistance in the large vessels facilitates modeling of the non-linear behavior considerably. Due to the transmural variation in intramyocardial pressure from epicardium to endocardium, each intramyocardial compartment was further divided in three myocardial layers according to penetrating depth (i.e., subepicardial-, mid-, and subendocardial layer). Each layer consists of an arteriolar and venular subcompartment with volumes depending on the compliances C1 and C2, respectively. The arterial and venous subcompartments each contain a resistance (R1 and R2, respectively); a middle resistance (Rm) was shared by both subcompartments. The connection between the model of cardiac mechanics and the coronary circulation is made through the intramyocardial pressure (pIM) acting on the intramyocardial compliances (C1 and C2) as shown in Figure 1C. Finally, the distal end of the arterial-venous lumped model was coupled to a coronary vein.
Myocardium-Vessel Interaction
The intramyocardial pressure is assumed to be time-varying and dependent on both cardiac contraction and transmural depth (Figure 2A). Increased intramyocardial pressure during systole is transmitted across the vessel wall, impeding perfusion particularly in the subendocardial layers. The intramyocardial pressure (IMP) was assumed to be a summation of two mechanism: 1) transmission of cavity pressure into the myocardial wall (cavity-induced extracellular pressure (CEP); Figure 2B), and 2) effect of myocardial stiffness (labeled as varying elastance (VE); Figure 2C). CEP was directly related to ventricular cavity pressure and assumed to vary linearly from ventricular cavity pressure (P1) at endocardium to pericardial pressure (P2) at epicardium. For the septal wall, CEP was varied linearly between LV pressure (P1) and right ventricular pressure (P2). VE was assumed to be related to fiber stress (σf) as fiber stiffening increases myocardial pressure (Krams et al., 1989). Correspondingly, IMP was prescribed to be the sum of CEP and VE as follows:
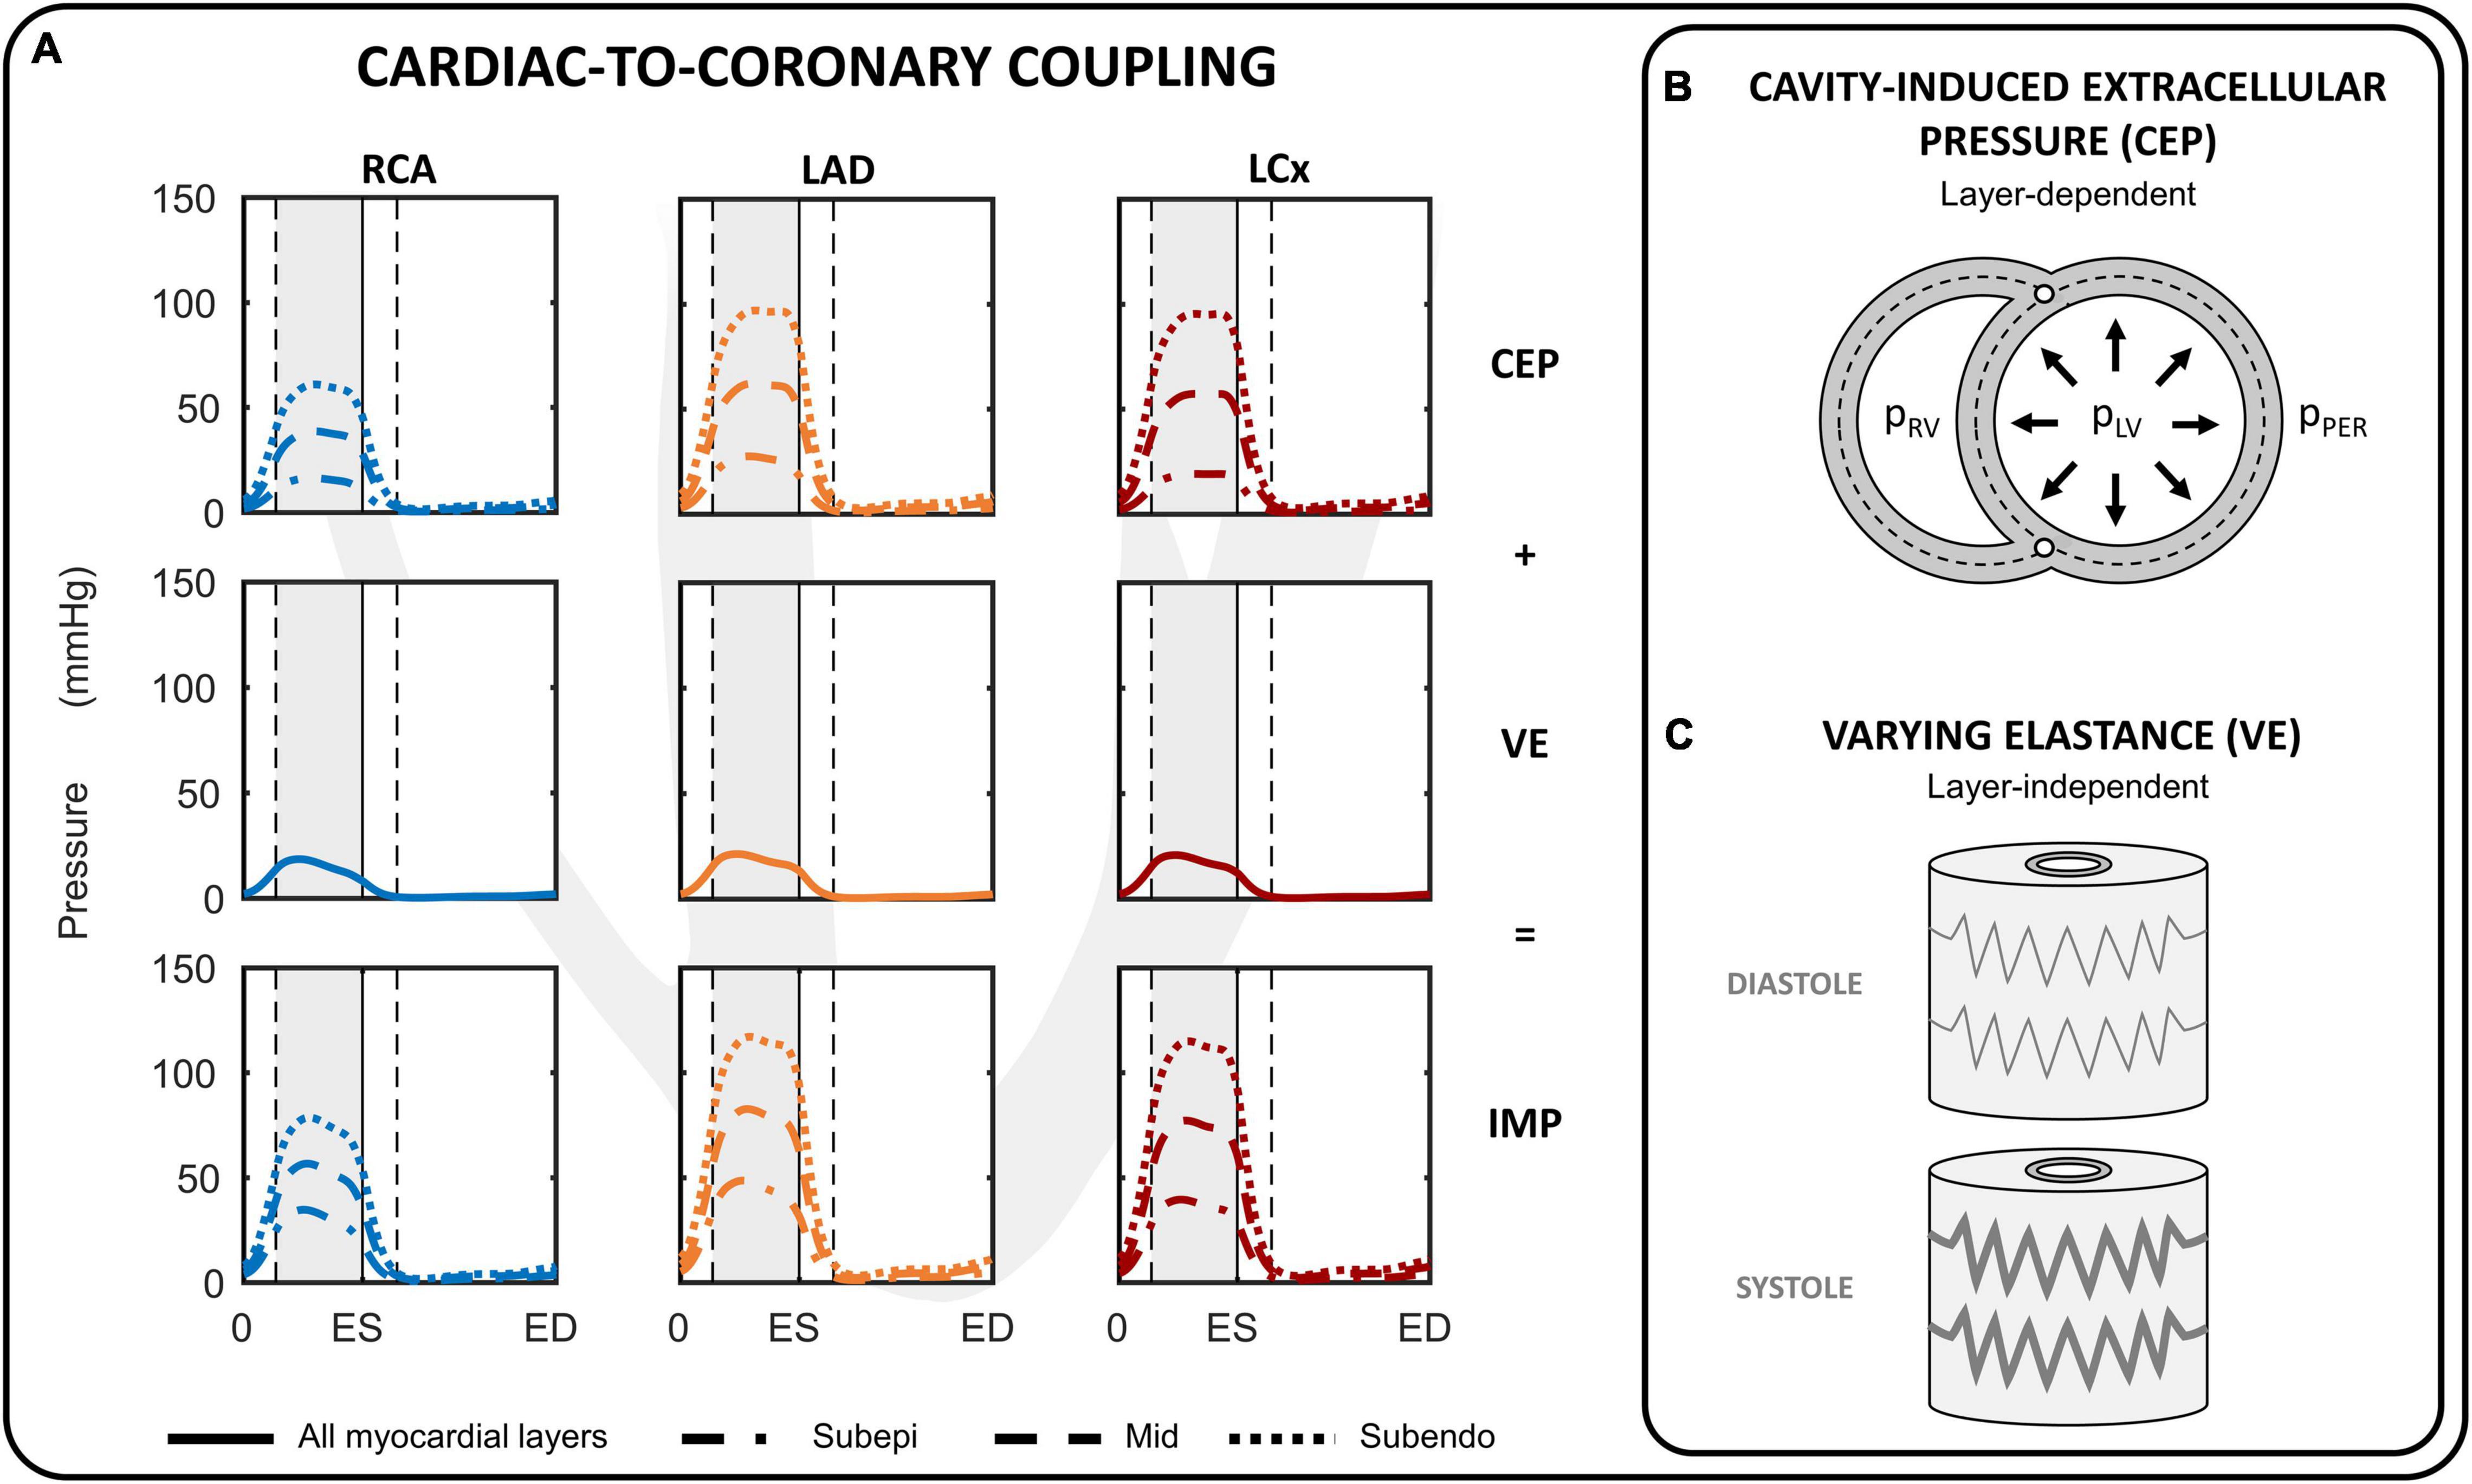
Figure 2. Cardiac-to-coronary coupling. (A) Overview of the intramyocardial pressure (IMP) during one cardiac cycle for the right coronary artery (RCA), left anterior descending (LAD) and left circumflex (LCx). The IMP is assumed to consist of two components: cavity-induced extracellular pressure (CEP) and myocardial stiffness (labeled as varying elastance; VE). (B) CEP arises from transmission of cavity pressure in the myocardial wall and varies linearly from cavity pressure (pLV, pRV) at the endocardial border to pericardial pressure (pPER) at epicardial border for the left and right ventricular free walls. (C) VE was directly related to fiber stress. ED, end-diastole; ES, end-systole.
where γ is a prescribed scaling parameter, and r is the radial position of the subepicardial-, mid- and subendocardial layer prescribed at 1/6, 3/6, 5/6 of the myocardial wall segment, respectively. The IMP per coronary branch was calculated from a volume-weighted average of the IMP per coronary territorial myocardial wall segments. Parameter γ was chosen to produce a peak VE equal to ∼20% of peak LV pressure because in animal experiments subendocardial peak intramyocardial pressure generally exceeds peak LV pressure by 10–30% (Rabbany et al., 1989; Mihailescu and Abel, 1994). Note that the same value of γ = 0.06 was chosen for the left, right and septal walls.
Transmural Pressure
The transmural pressure of the intramyocardial vessels is equal to intravascular pressure minus intramyocardial pressure. The transmural pressure is related to vessel cross-sectional area by a non-linear power-law to phenomenologically capture the experimentally observed non-linear relation between transmural pressure (ptrans) and area (A) in vessel walls as a result of its tissue components, collagen and elastin (Arts et al., 1991):
At reference pressure p0, the cross-sectional area of the vessel lumen and vessel wall area are equal to A0 and Aw, respectively. The second term between brackets in Equation 2 was added to cope with negative transmural pressures and was based on the collapsible tube law (Shapiro, 1977; Kozlovsky et al., 2014). Note that with volume approaching the state of collapse, transmural pressure becomes progressively negative. The reference pressure (p0) was based on data reported by Spaan (1985).
Vascular Resistance
Based on the assumption that the resistance of each of the compartments depends on volume according to Poiseuille’s Law (Bruinsma et al., 1988), the volume-resistance relationship was
Where R0 is the reference resistance and V0 refers to the equal distribution of the proximal and distal reference volumes. Distribution of resistance over the epicardial arterial (Ra), intramyocardial (R1 + Rm + R2), and epicardial venous (Rv) compartment was assumed to be 28%:65%:7% during normal resting conditions (Chilian et al., 1989). For the intramyocardial resistances, the distribution over the arterioles, capillaries and venules (i.e., R1 : Rm : R2) was assumed to be 60%:30%:10% (Chilian et al., 1989).
The reference resistance (R0) was controlled by the target flow (q0) and reference pressure drop (△ p0) as follows
The reference arteriolar resistance (R0,1) was determined by adjusting the reference pressure drop (△ p0,1) to achieve target mean flow (q0,1), creating an “auto-regulated” healthy control simulation. The coronary target flow was distributed among myocardial segments in proportion to their myocardial weights (Table 1), with an subendocardial-to-subepicardial flow ratio of 1.11 (Crawford et al., 2009). Total weight of the left, septal and right walls were taken to be 114, 47, and 41 grams (myocardial density of 1.055 g/ml), respectively.
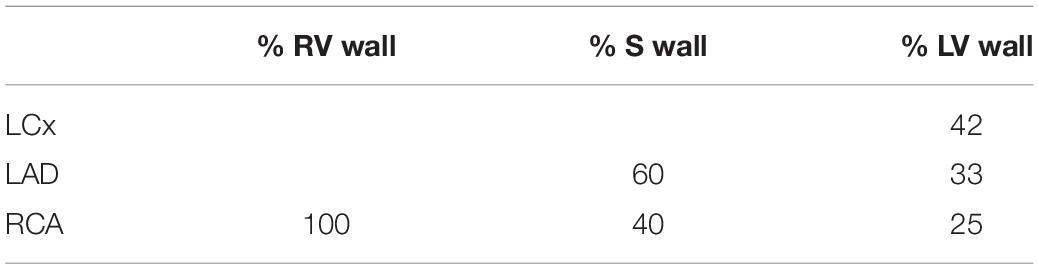
Table 1. Volume distribution based on myocardial weight and coronary territory.
Simulation Protocol and Data Analysis
The reference simulation was modeled with the parameters listed in Table 2. Systemic parameters were chosen to yield representative function curves for a 70 kg adult at resting conditions. To validate the model framework, simulated coronary flow, velocity and diameter were compared to measurements obtained in human subjects. Specifically, arterial flow velocity waveforms of the LM, LCx, LAD, and RCA simulated by the model were qualitatively compared to flow velocity measurements performed by Davies et al. (2006) and Hadjiloizou et al. (2008). Quantitative comparison of arterial flow velocity with clinical data was conducted in terms of peak diastolic-to-systolic flow velocity ratio (Ofili et al., 1995; Akasaka et al., 1996; Crowley and Shapiro, 1997; Daimon et al., 2005; Okura et al., 2006; Hadjiloizou et al., 2008; Tani et al., 2009) and diastolic-to-total velocity time integral (Ofili et al., 1993, 1995; Crowley and Shapiro, 1997; Hadjiloizou et al., 2006, 2008) as shown in Figure 3C. Due to the scarcity of coronary venous data, validation of venous flow velocity was restricted to a qualitative comparison with measured coronary sinus flow waveforms (Bloch et al., 2009; Moro et al., 2011). Subendocardial flow and diameter were qualitatively compared to measured subendocardial LAD tracings (Hiramatsu et al., 1998; Kajiya and Goto, 1999), as intramyocardial RCA and LCx data are lacking. Furthermore, simulated transmural diameter, in terms of end-diastolic to end-systolic diameter, was quantitatively compared to LAD diameter changes measured transmurally (Kanatsuka et al., 1989; Nellis and Whitesell, 1989; Yada et al., 1993, 1995; Hiramatsu et al., 1994, 1998).
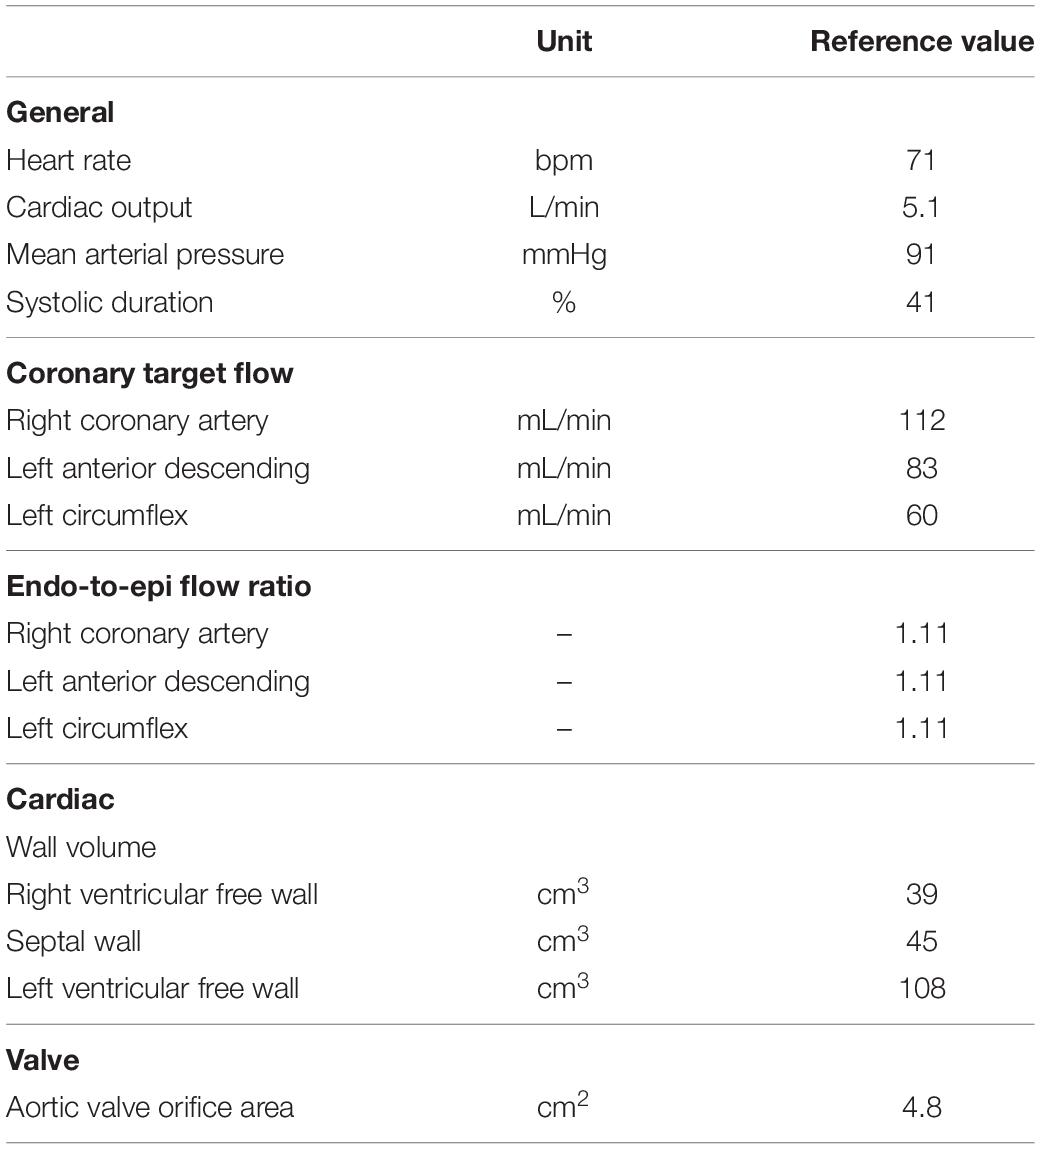
Table 2. Reference input parameter values.
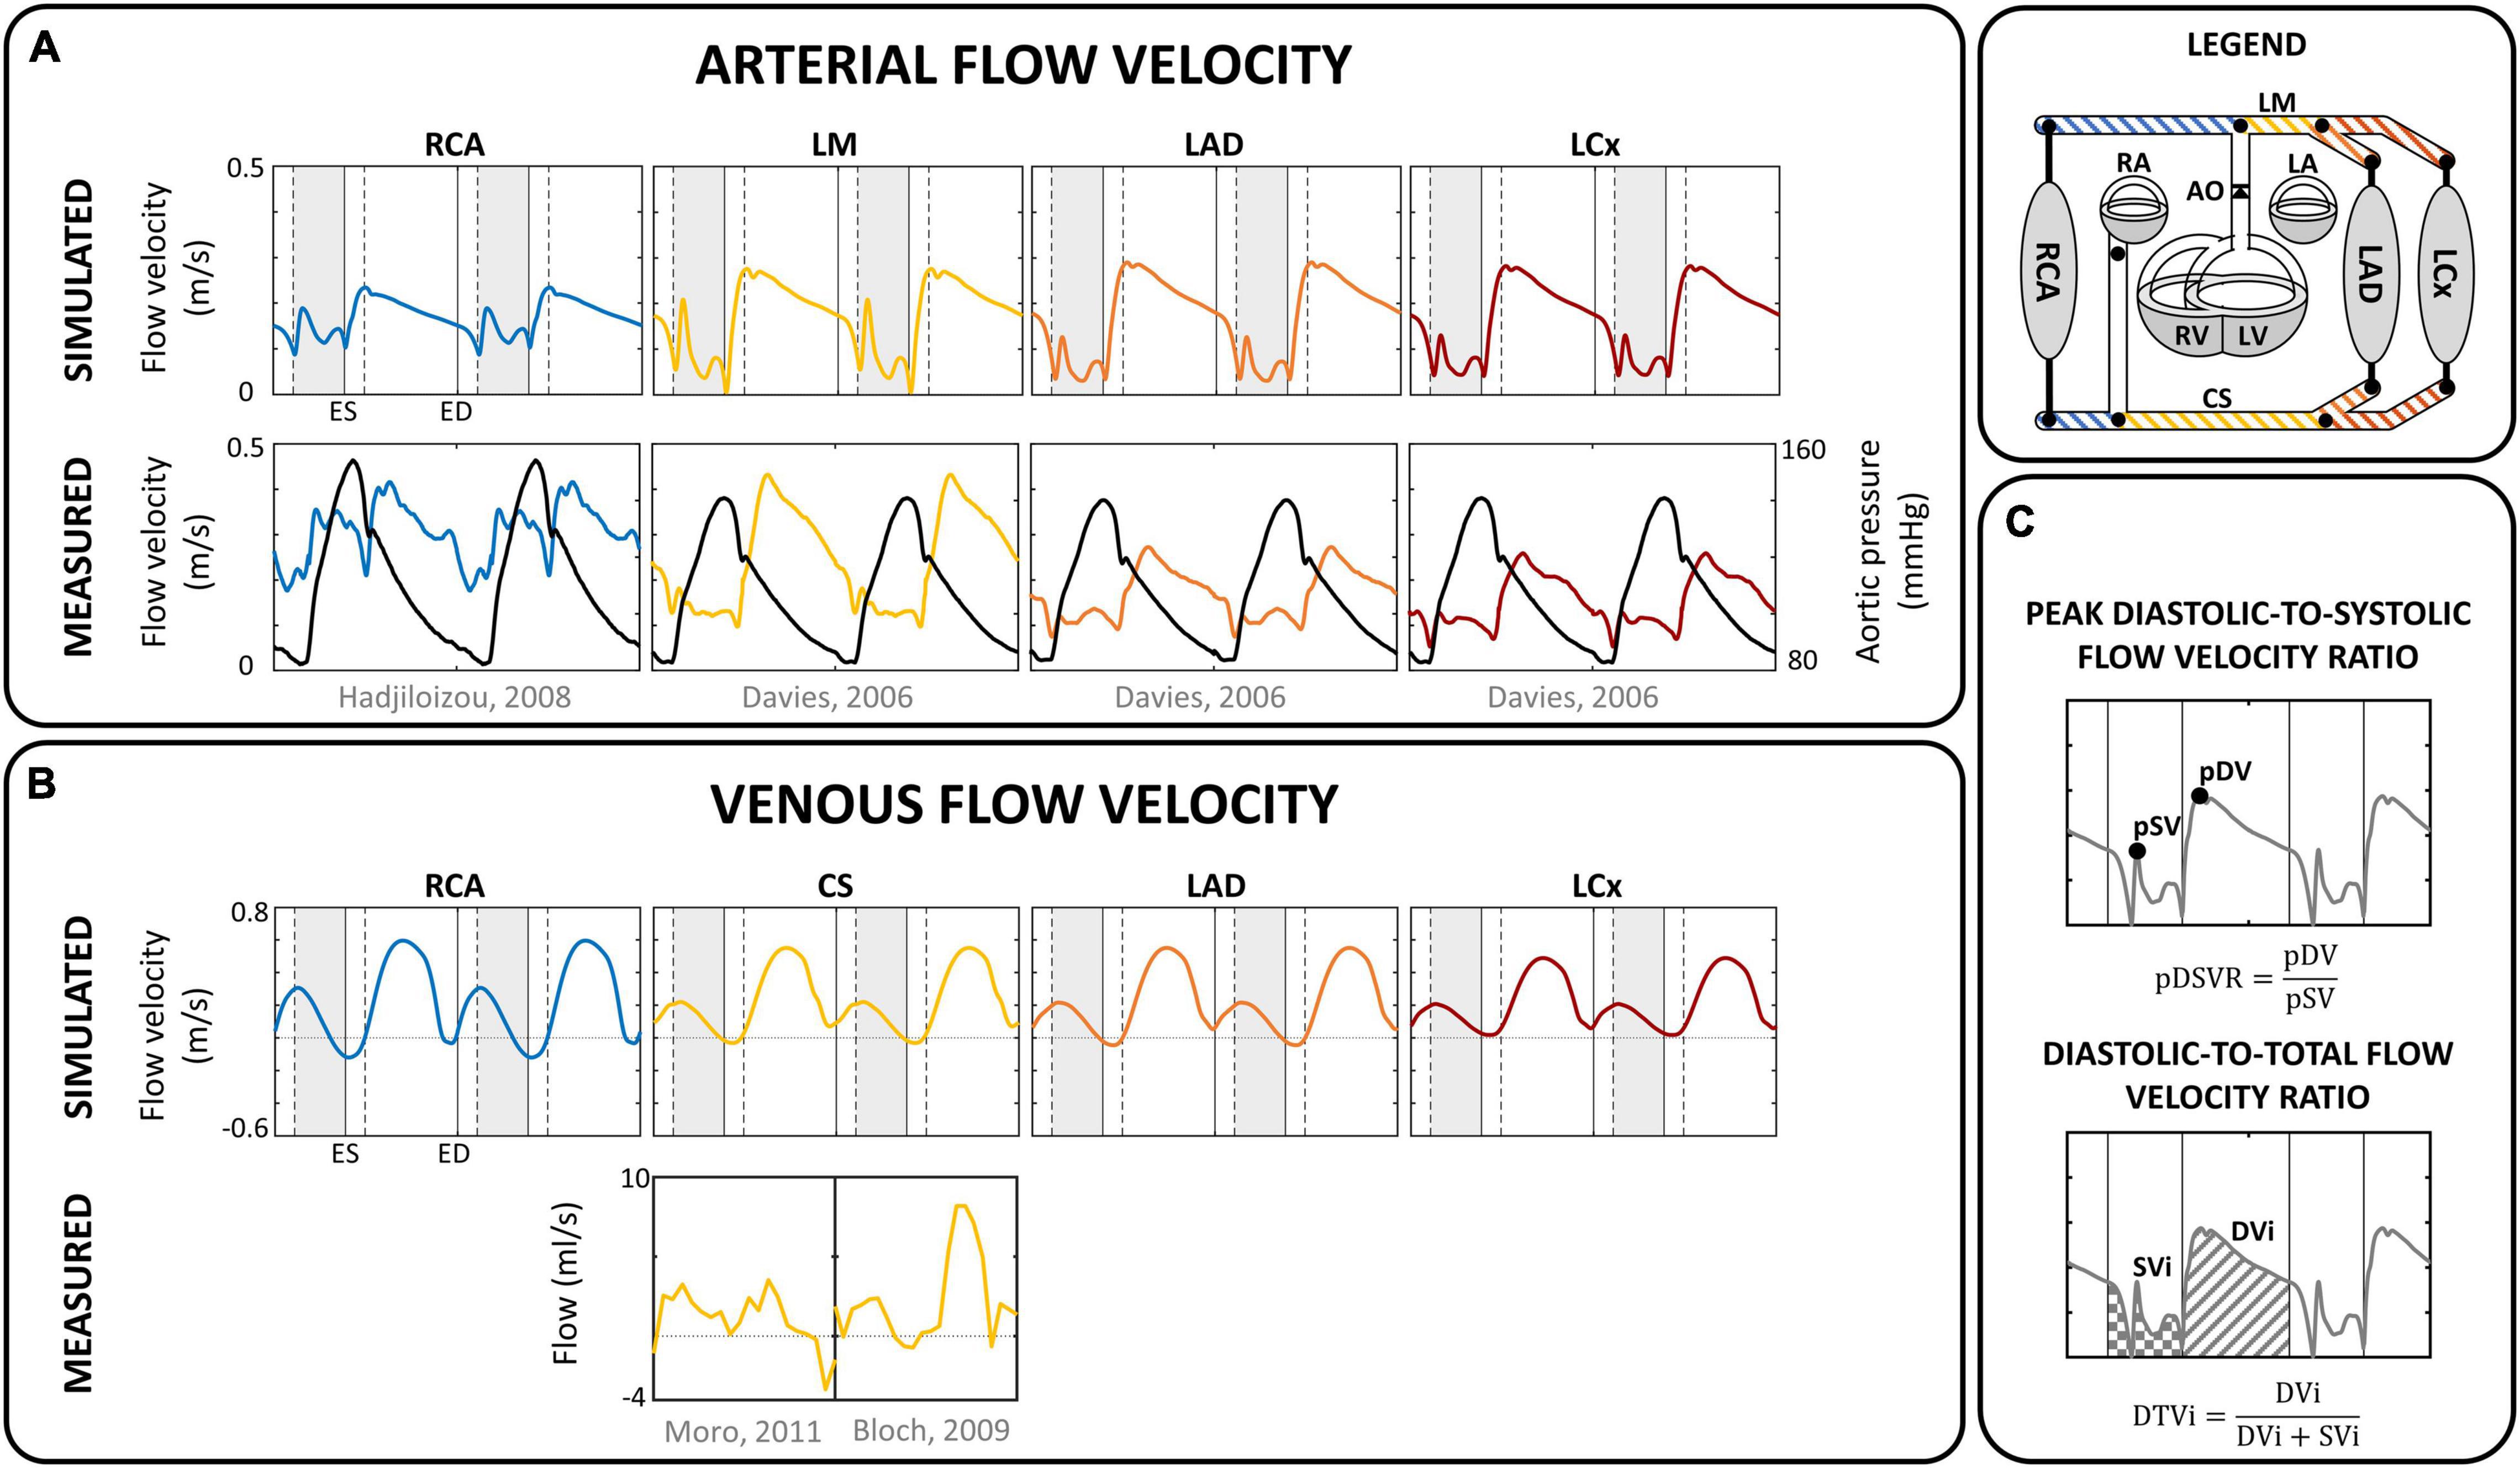
Figure 3. Flow velocity. Comparison of simulated (A) arterial and (B) venous flow velocity with measured flow (velocity) in corresponding sites for a single human subject (Davies et al., 2006; Hadjiloizou et al., 2008; Bloch et al., 2009; Moro et al., 2011). Vertical gray areas indicate left ventricular ejection and vertical dashed/solid lines indicate opening/closing of left ventricular cardiac valves. (C) Analysis of coronary flow waveform, in terms of peak diastolic-to-systolic flow velocity ratio (pDSVR) and diastolic-to-total flow velocity time integral (DTVi) as reported in Table 3. CS, distal coronary sinus; DVi, diastolic velocity integral; ED, end-diastole; ES, end-systole; LA, left atrium; LAD, left anterior descending coronary; LCx, left circumflex coronary; LM, left main coronary; LV, left ventricle; pDV, peak diastolic velocity; pSV, peak systolic velocity; RA, right atrium; RCA, right coronary artery; RV, right ventricle; S, septum; SVi, systolic velocity integral.
To show that the model can simulate conditions of different pathologies, a case study of aortic valve stenosis was simulated. The aortic valve area was decreased from 4.8 to 0.8 cm2 to represent non-existent and non-chronic severe aortic valve stenosis, respectively. Systemic flow and mean arterial pressure were maintained, whereas aortic valve stenosis-induced cardiovascular adaptations were not simulated to reduce model complexity. Simulated LAD flow velocity was compared to clinical measurements performed by Hildick-Smith and Shapiro (2000) before and 6 months after aortic valve replacement.
Numerical Implementation
The set of differential equations describing pressure and volume has been solved numerically with a time step of 1 ms. Calculation time for simulation of one cardiac cycle in MATLAB 2019a (The MathWorks, Natrick, MA) on a standard personal computer with an Intel® Core™ i7 processor and 16 GB RAM was approximately 2 s.
Results
Proximal Coronary Arterial Inflow and Distal Venous Outflow
Figure 3 shows the simulated flow velocity waves in the epicardial coronary arteries and veins, together with measured flow velocity waves (Davies et al., 2006; Hadjiloizou et al., 2006; Bloch et al., 2009; Moro et al., 2011). Visual agreement between model and measured waveforms was excellent in most cases.
The model predicted the typical biphasic flow velocity waveform in the left coronary arteries, with marked diastolic flow predominance (Figure 3A). In contrast, the flow waveform of the RCA was more uniformly distributed over the cardiac cycle, mainly due to lower intramyocardial pressure. Simulated peak diastolic-to-systolic flow velocity ratio as well as diastolic-to-total velocity time integral of the coronary arteries agreed well with reported average values (Table 3; Ofili et al., 1993, 1995; Akasaka et al., 1996; Crowley and Shapiro, 1997; Daimon et al., 2005; Hadjiloizou et al., 2006, 2008; Okura et al., 2006; Tani et al., 2009).
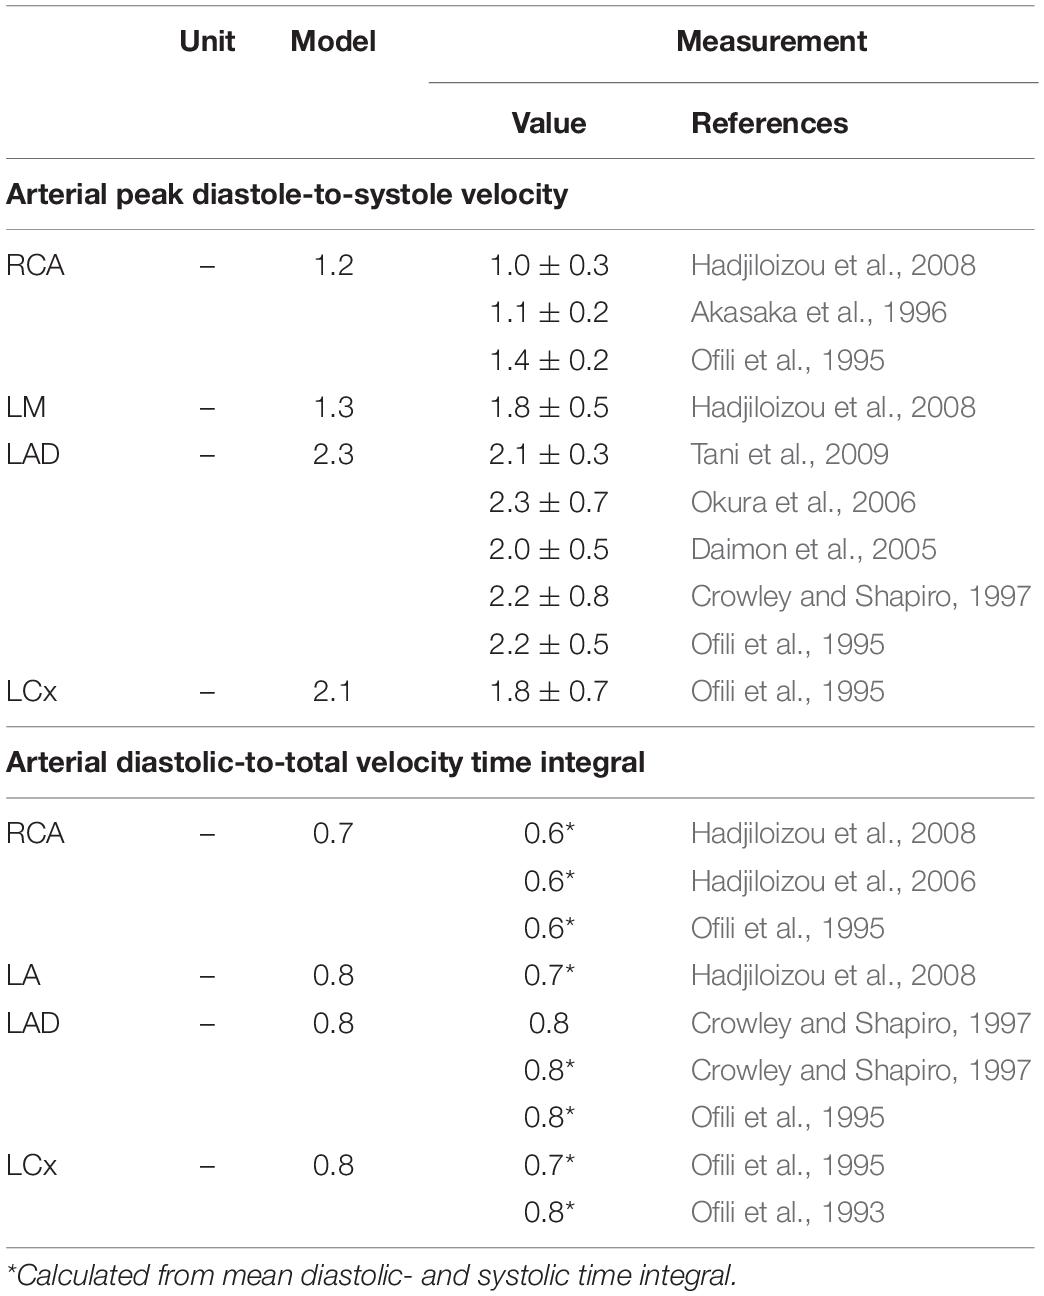
Table 3. Quantitative comparison of model arterial flow with in vivo measurements.
The coronary veins showed a systolic and diastolic phase of antegrade flow, separated by a short period of retrograde flow (Figure 3B), similar to measured coronary sinus flow data (Van Rossum et al., 1992; D’Cruz and Shirwany, 2003; Bloch et al., 2009). Average simulated distal coronary sinus flow of 143 mL/min was in range with reported values between 69 and 144 mL/min (Van Rossum et al., 1992; Schwitter et al., 2000; Koskenvuo et al., 2001; Watzinger et al., 2005; Kennedy et al., 2007; Bloch et al., 2009).
Dynamics of Intramyocardial Flow and Diameter
Simulated arteriolar flow exhibited some retrograde flow during early systole, slightly increasing velocities toward end-systole, and diastolic flow dominance (Figure 4A). In contrast, simulated venular flow was dominant in systole and almost absent throughout diastole. Because the magnitude of intramyocardial pressure varies transmurally, being greatest in the innermost myocardium and decreasing progressively across the ventricular wall, subendocardial arteriolar flow showed the most pulsatile behavior and exhibited a substantial degree of retrograde flow. Subepicardial arteriolar flow showed relatively similar magnitudes of antegrade flow during diastole and systole.
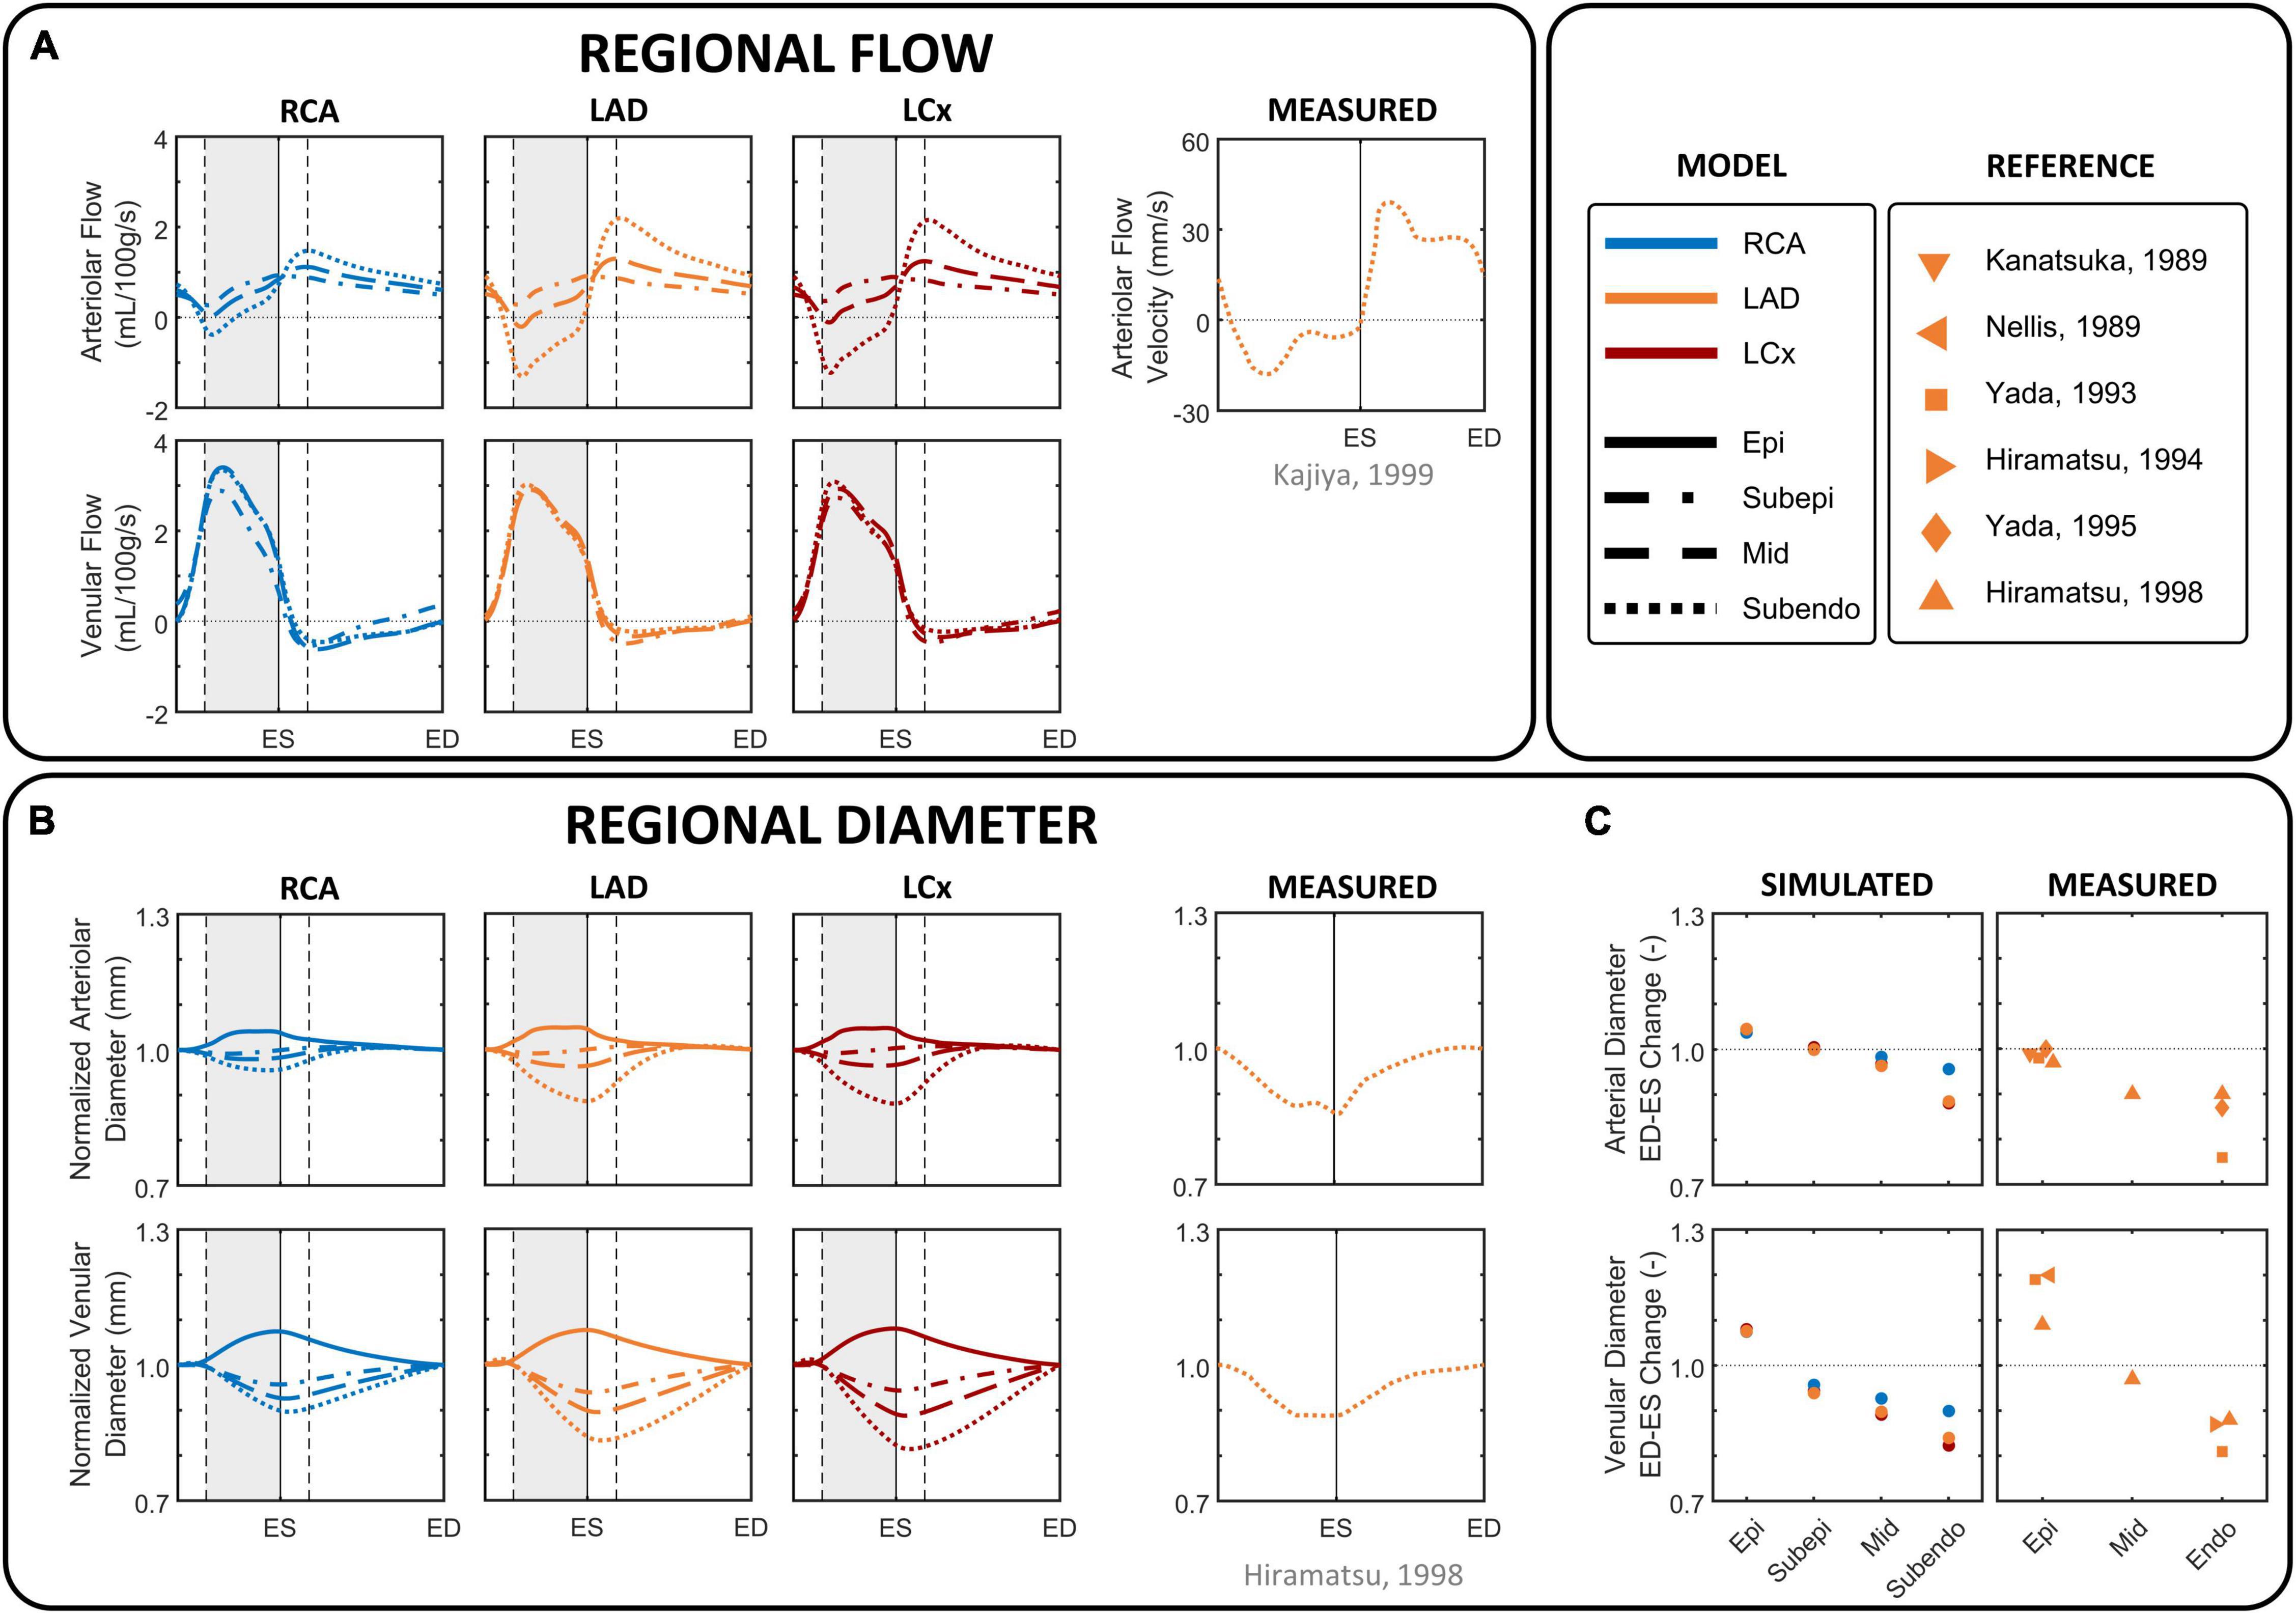
Figure 4. Phasic changes in regional microvascular flow and diameter of arterioles and venules in different coronary layers. (A) Simulated arteriolar (R1) and venular (R2) intramyocardial flow in the subepicardial, mid-, and subendocardial layer during one cardiac cycle, together with arteriolar subendocardial flow measured in the left anterior descending (LAD) (Kajiya and Goto, 1999). (B) imulated intramyocardial diameter in the epicardial, subepicardial, mid-, and subendocardial layer during one cardiac cycle, together with normalized subendocardial diameter measured in the LAD (Hiramatsu et al., 1998). Simulated diameter changes were derived from the arteriolar and venular volumes, assuming a circular shape and constant length, normalized by the diameter at end-diastole to facilitate the evaluation of the amplitude of diameter change over the cardiac cycle. (C) Simulated percental change in diameter of epicardial (Epi), subepicardial, mid, and subendocardial arterioles and venules from end-diastole (ED) to end-systole (ES), together with measured data in the LAD (Kanatsuka et al., 1989; Nellis and Whitesell, 1989; Yada et al., 1993, 1995; Hiramatsu et al., 1994, 1998). Vertical gray areas indicate left ventricular ejection and vertical dashed/solid lines indicate opening/closing of left ventricular cardiac valves. LCx, left circumflec artery; RCA, right coronary artery.
Similar to flow, arteriolar diameter varied most in the subendocardium (Figures 4B,C). The diameter of subendocardial arterioles in the right and left coronary branches decreased from end-diastole to end-systole with 4 and 12%, respectively. In contrast, the diameter of the subepicardial arterioles changed little during the cardiac cycle, whereas the diameter of the epicardial arterioles even increased 3–5% from end-diastole to end-systole.
Venular flow was systolic dominant, with similar magnitudes in all layers of a branch (Figure 4A). The diameter of subendocardial venules decreased 10–18% from end-diastole to end-systole, whereas the diameter of epicardial venules increased 7–8% from end-diastole to end-systole as blood is being squeezed out of the microcirculation (Figures 4B,C).
Model-predicted subendocardial LAD flow and diameter were in agreement with their corresponding phasic measurements (Kanatsuka et al., 1989; Nellis and Whitesell, 1989; Yada et al., 1993, 1995; Hiramatsu et al., 1994, 1998; Kajiya and Goto, 1999) as shown in Figure 4.
Aortic Stenosis
Figure 5 shows the effect of simulated aortic valve stenosis on the predicted LAD flow velocity, together with transthoracic Doppler echocardiography measurements by Hildick-Smith and Shapiro (2000) before and after aortic valve replacement. A period of reverse systolic flow was present in both simulation and measurement with aortic valve stenosis. Simulated peak systolic flow velocity decreased from 0.13 m/s in the reference simulation to 0.04 m/s with aortic valve stenosis, consistent with the decreased peak systolic flow velocity of 0.16 ± 0.08 m/s after aortic valve replacement compared to 0.05 ± 0.11 m/s before aortic valve replacement found in the measurements (Hildick-Smith and Shapiro, 2000). Peak diastolic flow velocity remained unaffected in both the simulation and the measurements.
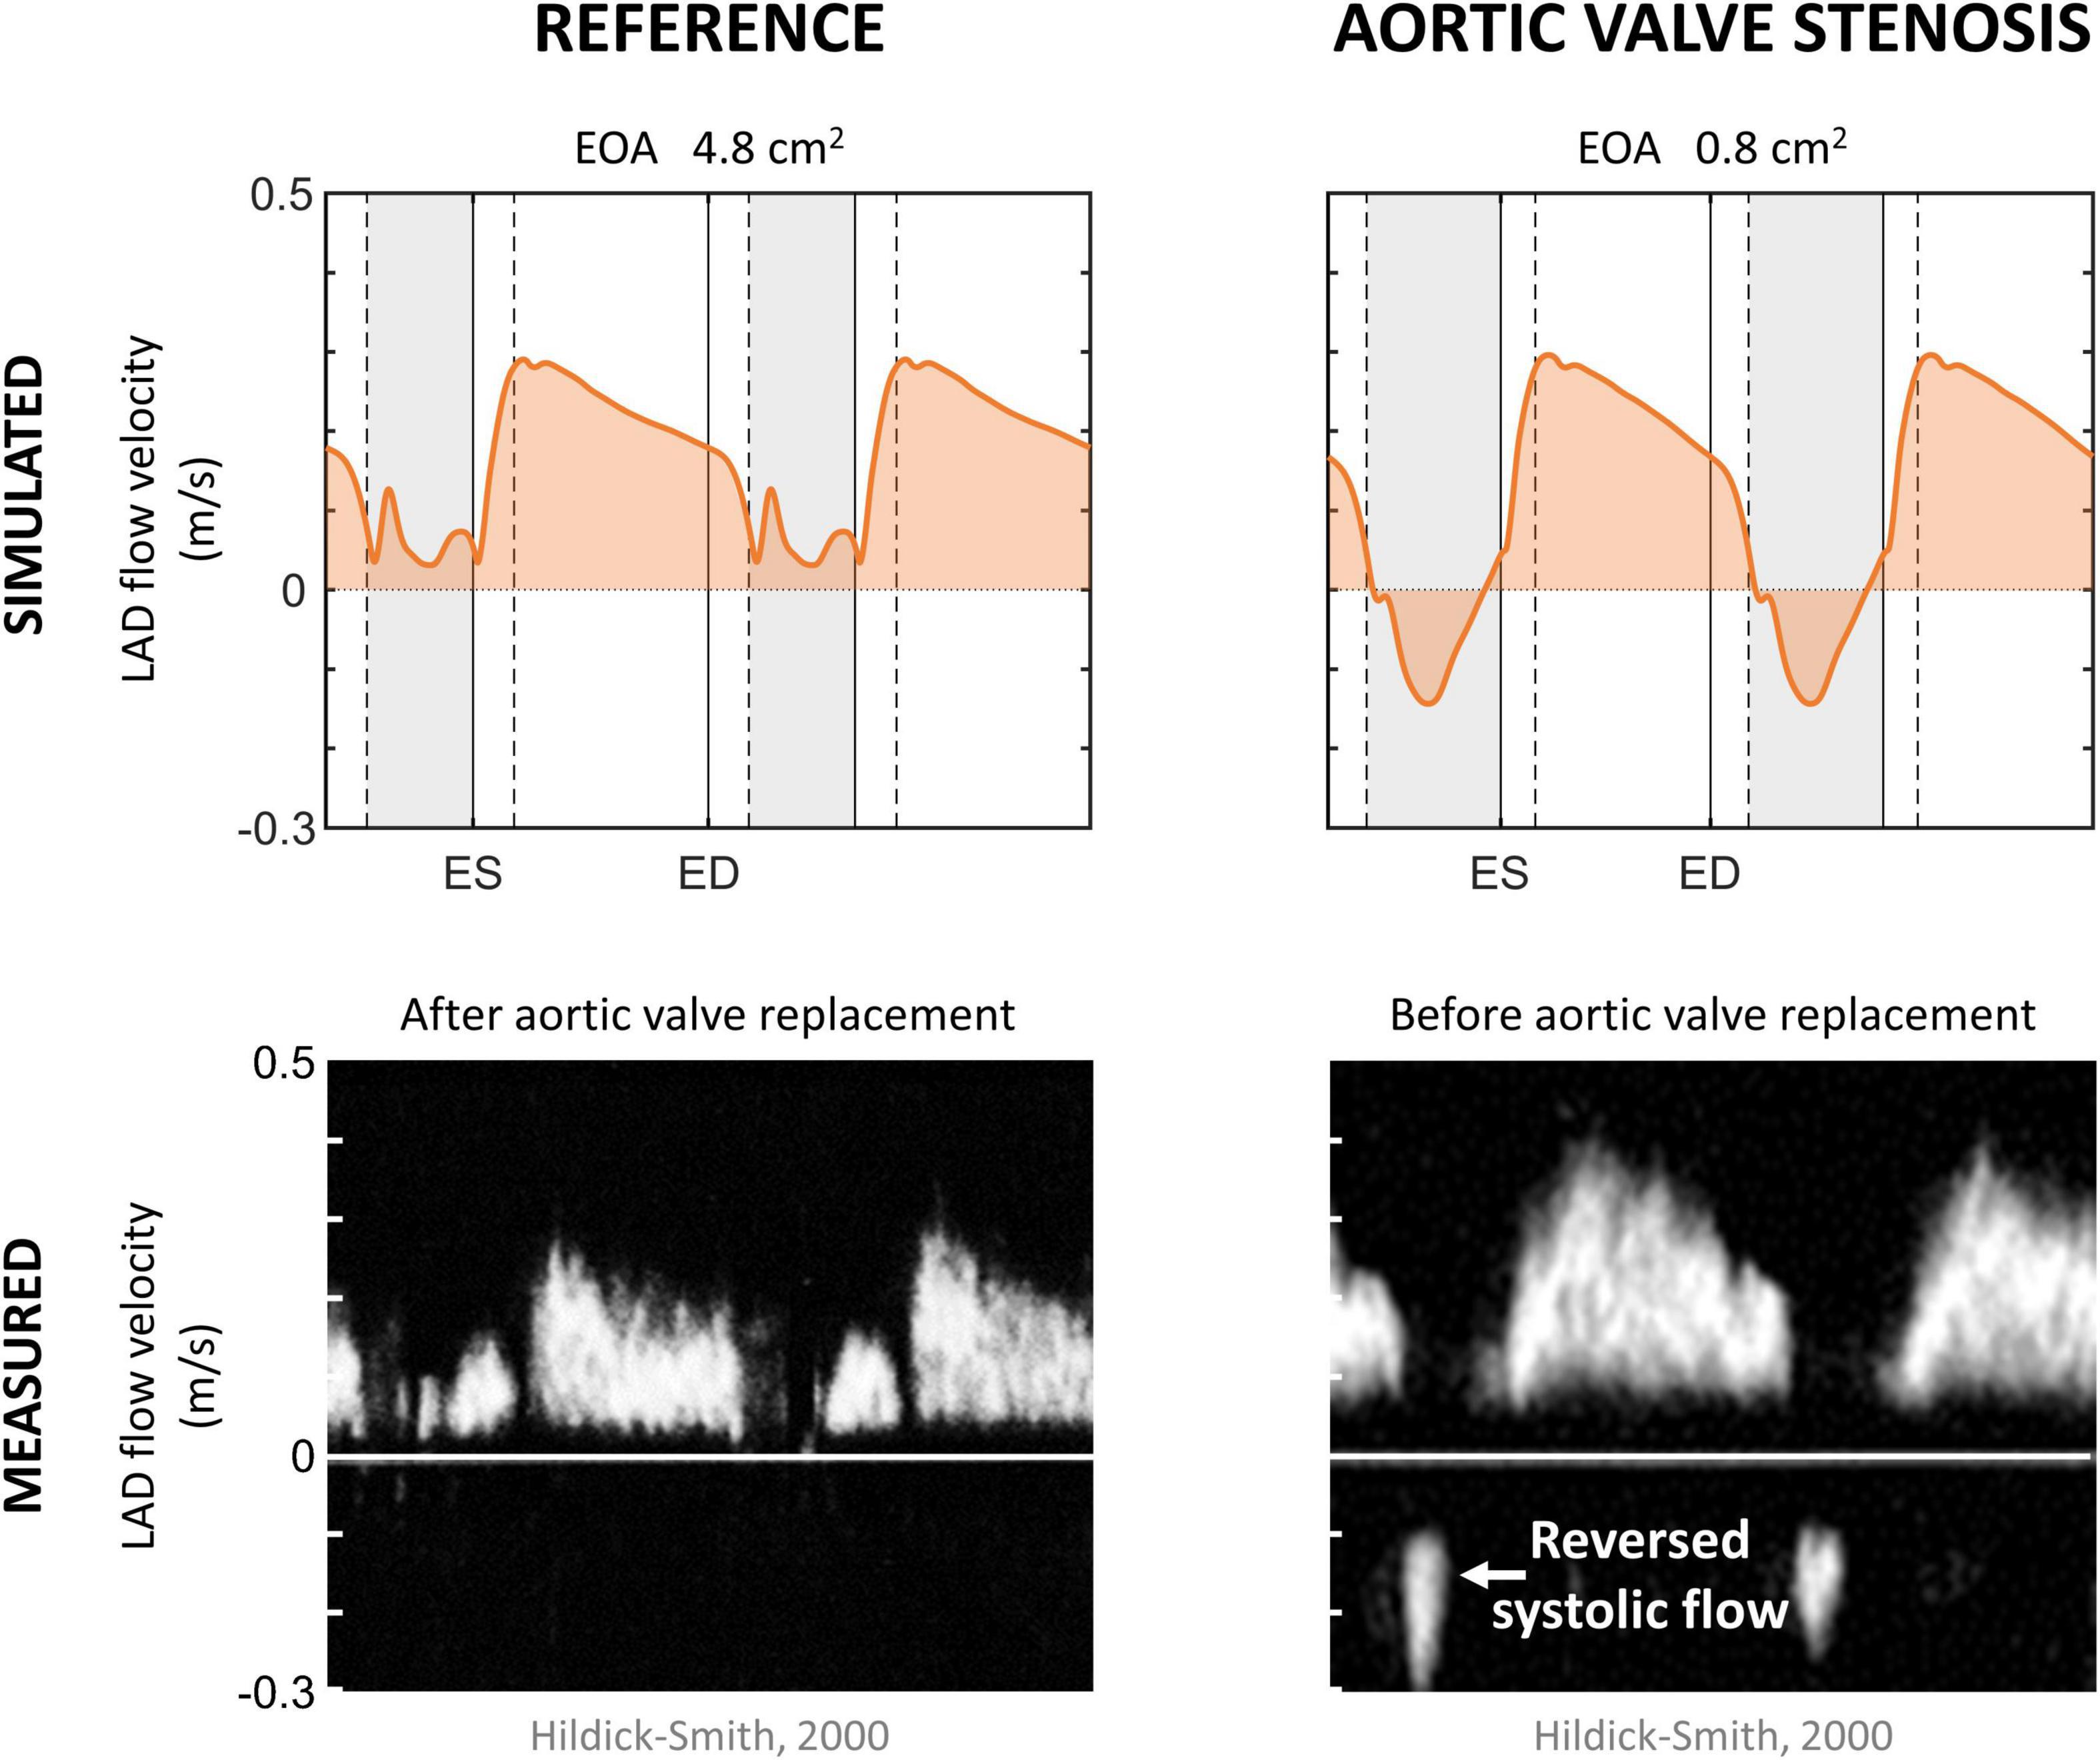
Figure 5. Aortic valve stenosis. Simulated left anterior descending (LAD) coronary artery flow velocity in the reference and aortic valve stenosis case, together with measured LAD flow velocity in patients 6 months after and before aortic valve replacement (Hildick-Smith and Shapiro, 2000). Vertical gray areas indicate left ventricular ejection and vertical dashed/solid lines indicate opening/closing of left ventricular cardiac valves. ED, end-diastole; EOA, effective orifice area; ES, end-systole.
The aortic valve stenosis-induced increase in systolic intramyocardial pressure forced the coronary microcirculation to work at minimal diameters, reducing mean flow by 35% in the LAD (Table 4). As the intramyocardial pressure is greatest in the endocardium, the inner layers of the myocardium play a major role in the decreased mean systolic contribution to forward coronary flow, i.e., endo-to-epi ratio decreased.
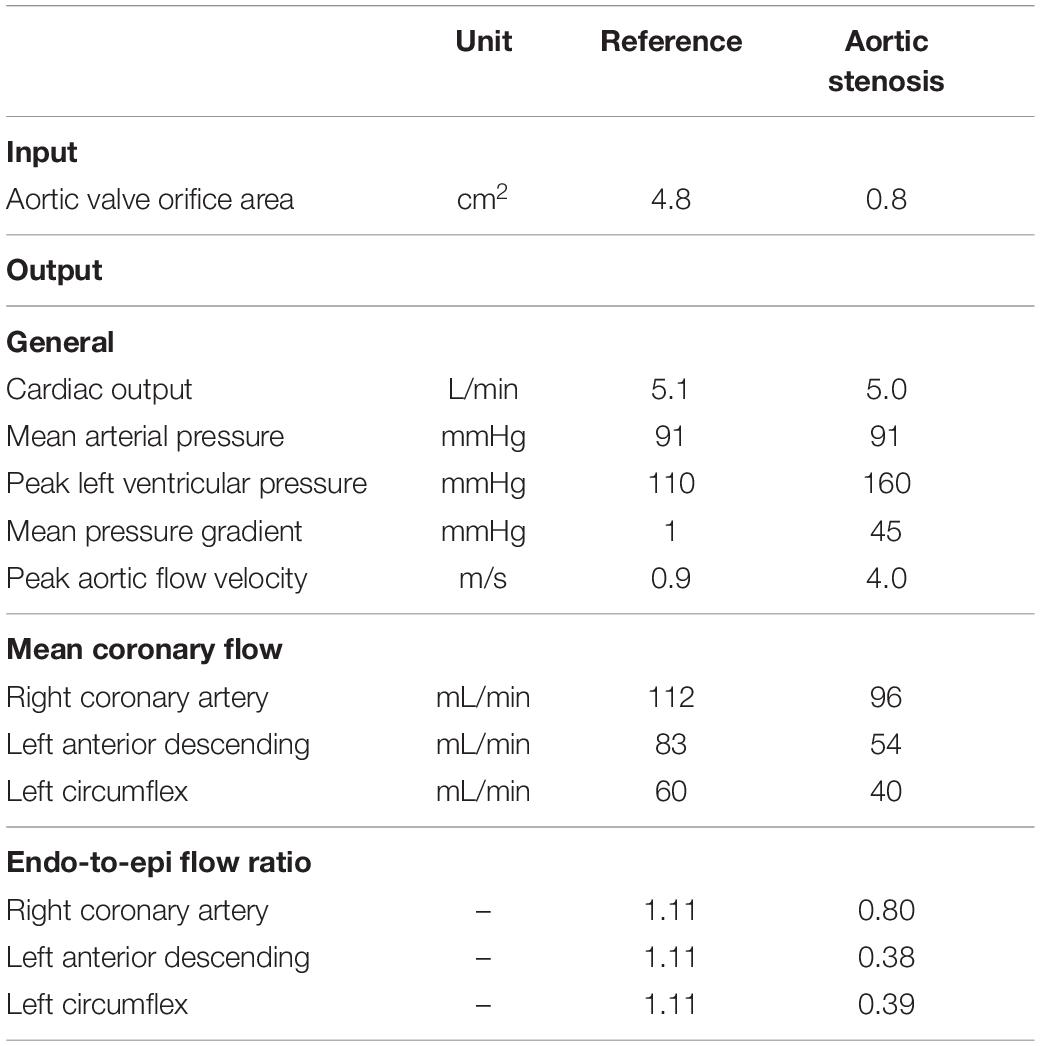
Table 4. Comparison of reference model parameter values with the case of aortic valve stenosis.
Discussion
The newly designed model of coronary mechanics combines a 1D coronary vascular network, lumped coronary microcirculation, and intramyocardial (pressure) components, to capture relevant details at each level of the coronary circulation. The coronary circulation was successfully implemented in the closed-loop CircAdapt model of the cardiovascular system, allowing simulation of coronary mechanics and hemodynamics in a wide variety of physiological and pathophysiological conditions. Model-predicted waveforms featured the main dynamic characteristics of epicardial and intramyocardial flow and vessel diameter of the coronary circulation. The versatility and validity of the model was demonstrated in a case study of aortic valve stenosis followed by valve replacement. The model independently reproduced the effects of aortic valve stenosis and valve replacement on coronary flow velocity measured in patients before and after valve replacement.
Model Assumptions in Relation to Other Models
Overview Coronary Circulation
In the present study, a 1D wave-propagation model for the three main coronary branches was coupled to a 0D lumped parameter model of the small intramyocardial vessels, with extravascular compressive forces acting on the intramyocardial compliances. This modeling approach has been adopted by many others, although different degrees of complexity in coronary vascular network have been reported, ranging from tens to millions of 1D vessel segments and from a single to 31 0D transmural layers (Guiot et al., 1990; Rammos et al., 1998; Smith et al., 2002; Mittal et al., 2005; Huo and Kassab, 2007; Reymond et al., 2009; Mynard et al., 2010, 2014; Algranati et al., 2011; van der Horst et al., 2013; Mynard and Smolich, 2015, 2016; Ge et al., 2018, 2019; Duanmu et al., 2019; Scarsoglio et al., 2019; Fan et al., 2020, 2021). Though our model our model (with four arterial and five venous segments, and three transmural layers) does not describe the anatomical configuration in as much detail as recent models by Mynard and Smolich (2015, 2016) and Ge et al. (2018, 2019), the level of detail was based on data availability and the model could capture the main dynamic features of coronary hemodynamics at each level of the network. Due to the modular design of the CircAdapt model, the anatomical detail can be easily altered when needed. For example, modification of specific model parameter (values), e.g., the arbitrarily chosen vessel lengths, or inclusion of new input parameters, e.g., additional coronary vessel beds, is simple and would allow for e.g., investigation of the impact of a certain regional change.
One-Fiber Model for Myocardial Contraction
Different from previous mathematical models (Rammos et al., 1998; Reymond et al., 2009; Mynard et al., 2010, 2014; Algranati et al., 2011; Mynard and Smolich, 2015, Mynard and Smolich, 2016; Ge et al., 2018, 2019; Duanmu et al., 2019; Scarsoglio et al., 2019; Fan et al., 2020, 2021), where a time-varying elastance model was adopted to govern cardiac mechanics, our study adopted the one-fiber model of myocardial contraction (Arts et al., 1991). The main advantage of this particular model over time-varying elastance models is that it is based on geometric data (e.g., cavity and wall volume, wall thickness) in combination with microstructural properties of the myocardium (e.g., active and passive fiber stress development). Hence, with the one-fiber contraction model, global ventricular pump mechanics (volumes and pressures) are related to local myofiber mechanics (fiber stress and strain) (Lumens et al., 2009), allowing for easy simulation of cardiac diseases involving abnormal myocardial properties, ranging from hypertrophy to more complex pathologies like myocardial conduction disorders (Walmsley et al., 2015) or diastolic dysfunction (van Loon et al., 2020).
Myocardium-Vessel Interaction
In vivo measurement of the spatial and temporal distribution of the intramyocardial pressure is difficult because of uncontrolled distortion of the tissue microstructure by the pipette tip (Westerhof, 1990), the inhomogeneities of the pressure in various microcompartments (Spaan, 1995) and cardiac motion.
Several myocardium-vessel interaction mechanisms have been proposed to describe the intramyocardial pressure, but none by themself can account for all major coronary flow features. The first mechanism is CEP, which arises from transmission of ventricular cavity pressure into the myocardial wall. CEP is generally assumed to be equal to cavity pressure at the endocardium with an approximately linear decline to pericardial pressure at the epicardium (Westerhof et al., 2006; Spaan et al., 2008; Algranati et al., 2010; Mynard et al., 2014).
Subsequently, Krams et al. (1989) proposed the VE mechanism, emphasizing the importance of changes in ventricular elastance (i.e., stiffness), as CEP could not explain the similar coronary flow impediment in isovolumic and isobaric contractions (Downey et al., 1974; Carew and Covell, 1976; Marzilli et al., 1979). VE has been assumed proportional to ventricular elastance (Fan et al., 2020, 2021), or when using a one-fiber contraction model, to radial wall stress (Beyar et al., 1993; van der Horst et al., 2013). The advantage of the latter is that sarcomere properties are directly related to the intramyocardial pressure.
The third hypothesized mechanism was based on shortening-induced intracellular pressure (SIP), which arises from the thickening of shortening myocytes that leads to compression of adjacent blood vessels, as proposed by Rabbany et al. (1989, 1994). However, quantitative information on the effect of muscle shortening and thickening during contraction on coronary flow is lacking and the different approximations of SIP are debatable. Mynard and Smolich (2015, 2016) and Ge et al. (2018, 2019) both assumed SIP to be directly proportional to ventricular elastance, adopting a similar approach to the VE mechanism. Alternatively, SIP can be directly related to sarcomere stretch ratio (Algranati et al., 2010; Fan et al., 2020, 2021), defined as the ratio of cavity volume to end-diastolic volume. This approach, however, is questionable as the zero strain state changes with changes in end-diastolic volume.
The transmural difference in intramyocardial pressure cannot be explained by the SIP or VE mechanisms, whereas CEP alone cannot explain intramyocardial pressures being higher than cavity pressure, highlighting the need to combine CEP with VE and/or SIP. Due to the lack of data supporting the SIP mechanism, the abovementioned SIP issues, as well as the possibility to relate VE directly to sarcomere properties, the intramyocardial pressure in this study was assumed to be a summation of the CEP and VE mechanisms. The VE approximation adopted in this study is based on wall stress, taking into account contraction-dependent active stress, intrinsic elasticity, as well as passive stress generated by extracellular matrix and intracellular tissues like titin (Arts et al., 2005), as explained in more detail in Supplementary Material. This approach may give rise to more coronary flow impediment in early and mid-systole, compared to the approximation with SIP by ventricular elastance, which peaks in late-systole, although the effect is likely to be negligible in the healthy subject.
Coronary Territory Assignment
The standardized assignment of coronary territories to individual myocardial segments (Figure 1B) is currently based on empirical assumptions (Cerqueira et al., 2002). However, several studies have confirmed the oversimplicity of this mapping due to large anatomical variations of the coronary territories among individuals, especially in the apical region (Ortiz-Pérez et al., 2008; Termeer et al., 2010; Malkasian et al., 2020). The anatomical variation, in combination with the assumed flow distribution based on myocardial wall segment mass (Table 1), complicate quantitative comparison of model results with measurement data. Nevertheless, model-generated coronary flow waveforms matched well with measured waveforms in terms of mean flow, peak diastolic-to-systolic flow velocity ratio and diastolic-to-total velocity time integral (Table 3) given the standard coronary mapping. Modification of specific model parameters like wall (segment) mass and coronary mapping is simple and straightforward due to the modular design of the CircAdapt model and allows for simulation, e.g., of left and right coronary dominance.
Collapsible Tube Law
As the coronary vessels are subjected to high extravascular pressures, we applied a tube law (Equation 2) that, based on the work of Shapiro (1977) and Kozlovsky et al. (2014), takes into account vascular deformation at negative transmural pressures. Although circular vascular geometries were assumed, the collapsible tube law enabled the model to simulate the associated hemodynamic effects of intramyocardial vessels over a wide range of transmural pressures. The simulated amplitude of change in subendocardial nominal diameter over a cardiac cycle (12%) in the LAD agreed well with in vivo measurements (10–24%) (Kanatsuka et al., 1989; Nellis and Whitesell, 1989; Yada et al., 1993, 1995; Hiramatsu et al., 1994, 1998), to some extent proving the ability of our model to simulate deformation of intramyocardial vessels.
Comparison of Model Simulations With Measurements
Available data that could be used for validation is scarce, especially for microvascular and venous sites. In addition, data from different sources are subject to considerable biological variability and may at times even contradict other studies. For these reasons, validation was carried out against qualitative waveforms measured in humans and a quantitative comparison was conducted only if sufficient in vivo data was available.
Reference Simulation
In general, the flow, velocity and diameter patterns predicted by the model were qualitatively in line with published in vivo data of healthy human controls. Specifically, the model performed well in predicting systolic and early diastolic flow transitions arising from wave propagation effects in the arterial tree (Figure 3A). Quantitatively, overall levels of peak systolic and peak diastolic velocity, caused by onset of ventricular ejection and relaxation, respectively, were similar in the model and experiments (Table 3).
Intramyocardial vessels are subjected to the phasic mechanical influences of cardiac contraction and relaxation, resulting in a unique blood flow pattern where arteriolar flow is diastolic predominant and venular flow is systolic predominant (Kajiya et al., 2000; Figure 4A). Sustained retrograde flow in subendocardial arterioles during systole was observed in vivo (Kajiya and Goto, 1999) as well as in our simulation. In some subjects, near zero flow was measured during the latter part of systole (Toyota et al., 2005). Subepicardial arterioles showed forward flow throughout the cardiac cycle, in agreement with in vivo measurements (Kajiya et al., 2000; Toyota et al., 2005), although the model did not predict early diastolic rise in subepicardial flow. A possible explanation for the small deviations in arteriolar flow patterns between model and experiments may be attributed to the simplicity of our coronary vascular network.
The coronary sinus typically shows a biphasic pattern (Figure 3B), although the physiological variation between subjects is large. Van Rossum et al. (1992) reported the systolic phase lower in amplitude compared to the diastolic phase, whereas the opposite was observed by D’Cruz and Shirwany (2003) and while both cases were reported by Bloch et al. (2009).
Despite the lack of intramyocardial venular flow data, the systolic venular flow dominance as predicted by the model (Figure 4A) is in agreement with measurements of myocardial venous outflow (Kajiya et al., 2000). The discrepancy between the biphasic venous flow pattern (Figure 3B) and the monophasic venular flow pattern (Figure 4A) can be explained by large venous compliance, corresponding low wave velocity, relatively high blood flow velocity and atrial contraction.
Simulated vascular diameter was qualitatively and quantitatively compared with in vivo LAD data (Nellis and Whitesell, 1989; Yada et al., 1993, 1995; Hiramatsu et al., 1994, 1998), confirming the model’s ability to predict phasic variations in vascular volume (Figures 4B,C).
Aortic Valve Stenosis
Simulated coronary flow wave patterns in aortic valve stenosis qualitatively agreed with the waveforms shown in literature (Hongo et al., 1993; Hildick-Smith and Shapiro, 2000), indicating that the model is able to capture the main phenomena contributing to altered coronary flow patterns in aortic valve stenosis while changing only a single parameter (i.e., valve area). More specifically, a period of reverse systolic flow was present as a result of the aortic valve stenosis-induced increase in systolic intramyocardial pressure. For an in-depth study, however, one should account for compensatory mechanisms that commonly occur when aortic valve stenosis progresses, such as LV hypertrophy and increased coronary flow demand (Hildick-Smith and Shapiro, 2000), as well as autoregulation. Inclusion of these mechanisms was beyond the scope of the current study.
Clinical and Future Perspective
Our modeling framework enables simulation of key phenomena that contribute to coronary hemodynamics, such as cardiac, pericardial, valvular, systemic, pulmonary, vascular, and intramyocardial factors. In particular, the one-fiber model of myocardial contraction enables in-depth study of cardiac-to-coronary coupling, which is very difficult to achieve in vivo. For example, specific material properties can be changed per wall segment [e.g., asynchronous activation or local myocardial infarct (Lumens et al., 2008; Huntjens et al., 2014; Walmsley et al., 2015)] in order to study the effects of regional heterogeneity of myocardial tissue properties on coronary hemodynamics.
Besides application of this model as a research platform for in silico investigation of coronary hemodynamic changes under pathological conditions, it might serve as an educational tool to demonstrate the functional complexity of the coronary circulation.
The next step in improving the present model would be to include a bi-directional interaction of ventricular mechanics and coronary perfusion. This would be interesting when investigating large changes in perfusion pressure (Gregg, 1963) or impeded vascular emptying (Westerhof et al., 2006). Furthermore, inclusion of coronary autoregulatory mechanisms in future studies could be valuable to evaluate the effect of altered cardiac mechanics and myocardial demand on coronary flow reserve (Gould et al., 1990) under resting and hyperemic conditions. Our modeling framework with the one-fiber model for myocardial contraction provides an opportunity to match local coronary supply to local myocardial demand, the latter determined by myocardial stress and strain.
Conclusion
We have presented a model of coronary mechanics that combines a relatively simple one-dimensional network of the major coronary vessels with a lumped microvascular model consisting of three transmural layers, to capture epicardial flow velocity as well as intramyocardial flow and diameter. Regional coronary perfusion was made dependent on myocardial contraction through the intramyocardial pressure, based on global pump mechanics and local myofiber mechanics. Coupled to the closed-loop CircAdapt model of heart and circulation, our modeling framework enables simulation of coronary hemodynamics. Qualitative and quantitative comparison of simulation results with clinical data showed that the model correctly described epicardial flow velocity, as well as intramyocardial flow and diameter. The versatility and validity of the model was demonstrated in a case study of aortic valve stenosis followed by valve replacement. The model independently reproduced the effects of aortic valve stenosis and valve replacement on coronary flow velocity measured in patients before and after valve replacement. In summary, we have presented a powerful multi-scale modeling framework that enables realistic simulation of coronary hemodynamics. This modeling framework can be used as a research platform for in-depth studies of cardiac-to-coronary coupling in healthy and diseased conditions.
Data Availability Statement
The raw data and source code supporting the conclusions of this article will be made available by the authors, without undue reservation.
Author Contributions
AM contributed to conception and design of the study, performed the simulations, and wrote the manuscript. All authors helped with analysis and interpretation of the data, contributed to manuscript revision, as well as read and approved the submitted version.
Funding
JL was funded through the Netherlands Organisation for Scientific Research (NWO-ZonMw, VIDI grant 016.176.340) and the Dutch Heart Foundation (grant 2015T082).
Conflict of Interest
The authors declare that the research was conducted in the absence of any commercial or financial relationships that could be construed as a potential conflict of interest.
Publisher’s Note
All claims expressed in this article are solely those of the authors and do not necessarily represent those of their affiliated organizations, or those of the publisher, the editors and the reviewers. Any product that may be evaluated in this article, or claim that may be made by its manufacturer, is not guaranteed or endorsed by the publisher.
Supplementary Material
The Supplementary Material for this article can be found online at: https://www.frontiersin.org/articles/10.3389/fphys.2022.830925/full#supplementary-material
Abbreviations
CEP, cavity-induced extracellular pressure; IMP, intramyocardial pressure; LAD, left anterior descending coronary artery; LCx, left circumflex coronary artery; LM, left main coronary artery; LV, left ventricle; RCA, right coronary artery; SIP, shortening-induced intracellular pressure; VE, varying-elastance.
Footnotes
References
Akasaka, T., Yoshikawa, J., Yoshida, K., Hozumi, T., Takagi, T., and Okura, H. (1996). Comparison of relation of systolic flow of the right coronary artery to pulmonary artery pressure in patients with and without pulmonary hypertension. Am. J. Cardiol. 78, 240–244. doi: 10.1016/s0002-9149(96)90407-5
Algranati, D., Kassab, G. S., and Lanir, Y. (2010). Mechanisms of myocardium-coronary vessel interaction. Am. J. Physiol. Heart Circ. Physiol. 298, 861–873. doi: 10.1152/ajpheart.00925.2009
Algranati, D., Kassab, G. S., and Lanir, Y. (2011). Why is the subendocardium more vulnerable to ischemia? A new paradigm. Am. J. Physiol. Heart Circ. Physiol. 300, 1090–1100. doi: 10.1152/ajpheart.00473.2010
Arts, T., Bovendeerd, P. H., Prinzen, F. W., and Reneman, R. S. (1991). Relation between left ventricular cavity pressure and volume and systolic fiber stress and strain in the wall. Biophys. J. 59, 93–102. doi: 10.1016/S0006-3495(91)82201-9
Arts, T., Delhaas, T., Bovendeerd, P., Verbeek, X., and Prinzen, F. W. (2005). Adaptation to mechanical load determines shape and properties of heart and circulation: the circadapt model. Am. J. Physiol. Heart Circ. Physiol. 288, 1943–1954. doi: 10.1152/ajpheart.00444.2004
Arts, T., Reesink, K., Kroon, W., and Delhaas, T. (2012). Simulation of adaptation of blood vessel geometry to flow and pressure: implications for arterio-venous impedance. Mech Res. Commun. 42, 15–21. doi: 10.1016/j.mechrescom.2011.10.005
Arts, T., and Reneman, R. S. (1985). Interaction between intramyocardial pressure (IMP) and myocardial circulation. J. Biomech Eng. 107, 51–56. doi: 10.1115/1.3138520
Beyar, R., Ben-ari, R., Gibbons-kroeker, C. A., Tyberg, J. V., and Sideman, S. (1993). Effect of interconnecting collagen fibres on left ventricular function and intramyocardial compression. Cardiovasc. Res. 27, 2254–2263. doi: 10.1093/cvr/27.12.2254
Beyar, R., and Sideman, S. (1987). Time-dependent coronary blood flow distribution in left ventricular wall. Am. J. Physiol. Heart Circ. Physiol. 252, H417–H433. doi: 10.1152/ajpheart.1987.252.2.h417
Bloch, K. M., Carlsson, M., Arheden, H., Ståhlberg, F. (2009). Quantifying coronary sinus flow and global LV perfusion at 3T. BMC Med. Imaging 9:9. doi: 10.1186/1471-2342-9-9
Bruinsma, P., Arts, T., Dankelman, J., Spaan, J. A. E. (1988). Model of the coronary circulation based on pressure dependence of coronary resistance and compliance. Basic Res. Cardiol. 18, 510–524. doi: 10.1007/BF01906680
Burattini, R., Sipkema, P., van Huis, G. A., and Westerhof, N. (1985). Identification of canine coronary resistance and intramyocardial compliance on the basis of the waterfall model. Ann. Biomed. Eng. 13, 385–404. doi: 10.1007/BF02407768
Carew, T. E., and Covell, J. W. (1976). Effect of intramyocardial pressure on the phasic flow in the intraventricular septal artery. Cardiovasc. Res. 10, 56–64. doi: 10.1093/cvr/10.1.56
Cerqueira, M. D., Weissman, N. J., Dilsizian, V., Jacobs, A. K., Kaul, S., Laskey, W. K., et al. (2002). Standardized myocardial sementation and nomenclature for tomographic imaging of the heart: a statement for healthcare professionals from the cardiac imaging committee of the council on clinical cardiology of the American heart association. Circulation 105, 539–542. doi: 10.1161/hc0402.102975
Chilian, W. M., Layne, S. M., Klausner, E. C., Eastham, C. L., and Marcus, M. L. (1989). Redistribution of coronary microvascular resistance produced by dipyridamole. Am. J. Physiol. Heart Circ. Physiol. 256:383. doi: 10.1152/ajpheart.1989.256.2.h383
Crawford, M. H., DiMarco, J. P., and Paulus, W. J. (2009). Cardiology: Expert Consult, 3rd Edn. Philadephia, PA: Mosby Ltd.
Crowley, J. J., and Shapiro, L. M. (1997). Analysis of phasic flow velocity dynamics in the left anterior descending coronary artery before and after angioplasty using transthoracic echocardiography in patients with stable angina pectoris. Am. J. Cardiol. 80, 614–617. doi: 10.1016/S0002-9149(97)00431-1
Daimon, M., Watanabe, H., Yamagishi, H., Kuwabara, Y., Hasegawa, R., Toyoda, T., et al. (2005). Physiologic assessment of coronary artery stenosis without stress tests: noninvasive analysis of phasic flow characteristics by transthoracic doppler echocardiography. J. Am. Soc. Echocardiogr. 18, 949–955. doi: 10.1016/j.echo.2005.01.006
Davies, J. E., Whinnett, Z. I., Francis, D. P., Manisty, C. H., Aguado-sierra, J., Willson, K., et al. (2006). Evidence of a dominant backward-propagating “ suction ” wave responsible for diastolic coronary filling in humans, attenuated in left ventricular hypertrophy. Circulation 113, 1768–1778. doi: 10.1161/CIRCULATIONAHA.105.603050
D’Cruz, I. A., and Shirwany, A. (2003). Update on echocardiography of coronary sinus anatomy and physiology. Echocardiography 20, 87–95. doi: 10.1046/j.1540-8175.2003.00014.x
Downey, J., Downey, H., and Kirk, E. (1974). Effects of myocardial strains on coronary blood flow. Circ. Res. 34, 286–292. doi: 10.1016/0002-9149(94)90379-4
Downey, J. M., and Kirk, E. S. (1975). Inhibition of coronary blood flow by a vascular waterfall mechanism. Circ. Res. 36, 753–760. doi: 10.1161/01.RES.36.6.753
Duanmu, Z., Chen, W., Gao, H., Yang, X., Luo, X., and Hill, N. A. (2019). A one-dimensional hemodynamic model of the coronary arterial tree. Front. Physiol. 10:1–12. doi: 10.3389/fphys.2019.00853
Fan, L., Namani, R., Choy, J. S., Awakeem, Y., Kassab, G. S., and Lee, L. C. (2021). Role of coronary flow regulation and cardiac-coronary coupling in mechanical dyssynchrony associated with right ventricular pacing. Am. J. Physiol. Heart Circ. Physiol. 320, H1037–H1054. doi: 10.1152/ajpheart.00549.2020
Fan, L., Namani, R., Choy, J. S., Kassab, G. S., and Lee, L. C. (2020). Effects of mechanical dyssynchrony on coronary flow: insights from a computational model of coupled coronary perfusion with systemic circulation. Front. Physiol. 11:1–17. doi: 10.3389/fphys.2020.00915
Flynn, A. E., Coggins, D. L., Goto, M., Aldea, G. S., Austin, R. E., Doucette, J. W., et al. (1992). Does systolic subepicardial perfusion come from retrograde subendocardial flow? Am. J. Physiol. Heart Circ. Physiol. 262, 1759–1769. doi: 10.1152/ajpheart.1992.262.6.h1759
Ge, X., Liu, Y., Tu, S., Simakov, S., Vassilevski, Y., and Liang, F. (2019). Model-based analysis of the sensitivities and diagnostic implications of FFR and CFR under various pathological conditions. Int. J. Numer Method Biomed. Eng. 37:e3257. doi: 10.1002/cnm.3257
Ge, X., Yin, Z., Fan, Y., Vassilevski, Y., and Liang, F. (2018). A multi-scale model of the coronary circulation applied to investigate transmural myocardial flow. Int. J. Numer Method Biomed Eng. 34:3123. doi: 10.1002/cnm.3123
Gould, K. L., Kirkeeide, R. L., and Buchi, M. (1990). Coronary flow reserve as a physiologic measure of stenosis severity. J. Am. Coll. Cardiol. 15, 459–474. doi: 10.1016/S0735-1097(10)80078-6
Gregg, D. E. (1963). Effect of coronary perfusion pressure or coronary flow on oxygen usage of the myocardium. Circ. Res. 13, 497–500. doi: 10.1161/CIRCRESAHA.119.315412
Guiot, C., Pianta, P. G., Cancelli, C., and Pedley, T. J. (1990). Prediction of coronary blood flow with a numerical model based on collapsible tube dynamics. Am. J. Physiol. Heart Circ. Physiol. 258, 1606–1614. doi: 10.1152/ajpheart.1990.258.5.h1606
Hadjiloizou, N., Davies, J., Francis, D., Manisty, C., Malik, I., Hughes, A., et al. (2006). Simultaneous doppler and pressure measurements to explain differences in the haemodynamic properties of the left and right coronary arteries. Eur. J. Echocardiogr. 7:S181.
Hadjiloizou, N., Davies, J. E., Malik, I. S., Aguado-Sierra, J., Willson, K., Foale, R. A., et al. (2008). Differences in cardiac microcirculatory wave patterns between the proximal left mainstem and proximal right coronary artery. Am. J. Physiol. Heart Circ. Physiol. 295:H1198. doi: 10.1152/ajpheart.00510.2008
Heusinkveld, M. H. G., Huberts, W., Lumens, J., Arts, T., Delhaas, T., and Reesink, K. D. (2019). Large vessels as a tree of transmission lines incorporated in the circadapt whole-heart model: a computational tool to examine heart-vessel interaction. PLoS Comput. Biol. 15:e1007173. doi: 10.1371/journal.pcbi.1007173
Hildick-Smith, D. J. R., and Shapiro, L. M. (2000). Coronary flow reserve improves after aortic valve replacement for aortic stenosis: an adenosine transthoracic echocardiography study. J. Am. Coll. Cardiol. 36, 1889–1896. doi: 10.1016/S0735-1097(00)00947-5
Hiramatsu, O., Goto, M., Yada, T., Kimura, A., Chiba, Y., Tachibana, H., et al. (1998). In vivo observations of the intramural arterioles and venules in beating canine hearts. J. Physiol. 509, 619–628. doi: 10.1111/j.1469-7793.1998.619bn.x
Hiramatsu, O., Goto, M., Yada, T., Kimura, A., Tachibana, H., Ogasawara, Y., et al. (1994). Diameters of subendocardial arterioles and venules during prolonged diastole in canine left ventricles. Circ. Res. 75, 393–397. doi: 10.1161/01.res.75.2.393
Hongo, M., Goto, T., Watanabe, N., Nakatsuka, T., Tanaka, M., Kinoshita, O., et al. (1993). Relation of phasic coronary flow velocity profile to clinical and hemodynamic characteristics of patients with aortic valve disease. Circulation 88, 953–960. doi: 10.1161/01.CIR.88.3.953
Huntjens, P. R., Walmsley, J., Ploux, S., Bordachar, P., Prinzen, F. W., Delhaas, T., et al. (2014). Influence of left ventricular lead position relative to scar location on response to cardiac resynchronization therapy: a model study. Europace 16, iv62–iv68. doi: 10.1093/europace/euu231
Huo, Y., and Kassab, G. S. (2007). A hybrid one-dimensional/womersley model of pulsatile blood flow in the entire coronary arterial tree. Am. J. Physiol. Heart Circ. Physiol. 292, H2623–H2633. doi: 10.1152/ajpheart.00987.2006
Kajiya, F., and Goto, M. (1999). Integrative physiology of coronary microcirculation. JPN J. Physiol. 49, 229–241. doi: 10.2170/jjphysiol.49.229
Kajiya, F., Yada, T., Matsumoto, T., Goto, M., and Ogasawara, Y. (2000). Intramyocardial influences on blood flow distributions in the myocardial wall. Ann. Biomed Eng. 28, 897–902. doi: 10.1114/1.1308487
Kanatsuka, H., Lamping, K. G., Eastham, C. L., Dellsperger, K. C., and Marcus, M. L. (1989). Comparison of the effects of increased myocardial oxygen consumption and adenosine on the coronary microvascular resistance. Circ. Res. 65, 1296–1305. doi: 10.1161/01.RES.65.5.1296
Kennedy, K., Dick, A., Drangova, M., Raval, A., Mahoney, C., Karlik, S., et al. (2007). Magnetic resonance measurements of coronary flow reserve in heart transplant recipients: an exploratory study of the relationship to coronary angiographic findings. J. Cardiovasc. Magn. Reson. 9, 701–707. doi: 10.1080/10976640701198980
Koskenvuo, J. W., Hartiala, J. J., Knuuti, J., Sakuma, H., Toikka, J. O., Komu, M., et al. (2001). Assessing coronary sinus blood flow in patients with coronary artery disease: a comparison of phase-contrast MR imaging with positron emission tomography. Am. J. Roentgenol. 177, 1161–1166. doi: 10.2214/ajr.177.5.1771161
Kozlovsky, P., Zaretsky, U., Jaffa, A. J., and Elad, D. (2014). General tube law for collapsible thin and thick-wall tubes. J. Biomech. 47, 2378–2384. doi: 10.1016/j.jbiomech.2014.04.033
Krams, R., Sipkema, P., and Westerhof, N. (1989). Varying elastance concept may explain coronary systolic flow impediment. Am. J. Physiol. Heart Circ. Physiol. 257, H1471–H1479. doi: 10.1152/ajpheart.1989.257.5.h1471
Ku, D. N. (1997). Blood flow in arteries. Ann. Rev. Fluid Mech. 29, 399–434. doi: 10.1146/annurev.fluid.29.1.399
Lumens, J., Delhaas, T., Kirn, B., and Arts, T. (2008). Modeling ventricular interaction: a multiscale approach from sarcomere mechanics to cardiovascular system hemodynamics. Pacific Symp. Biocomput. 13, 378–389. doi: 10.1142/9789812776136_0037
Lumens, J., Delhaas, T., Kirn, B., and Arts, T. (2009). Three-wall segment (TriSeg) model describing mechanics and hemodynamics of ventricular interaction. Ann. Biomed Eng. 37, 2234–2255. doi: 10.1007/s10439-009-9774-2
Malkasian, S., Hubbard, L., Abbona, P., Dertli, B., Kwon, J., and Molloi, S. (2020). Vessel-specific coronary perfusion territories using a CT angiogram with a minimum cost path technique and its direct comparison to the American heart association 17-segment model. Eur. Radiol. 30, 3334–3345. doi: 10.1007/s00330-020-06697-w
Marzilli, M., Goldstein, S., Sabbah, H. N., Lee, T., and Stein, P. D. (1979). Modulating effect of regional myocardial performance on local myocardial perfusion in the dog. Circ. Res. 45, 634–641. doi: 10.1161/01.RES.45.5.634
Mihailescu, L. S., and Abel, F. L. (1994). Intramyocardial pressure gradients in working and nonworking isolated cat hearts. Am. J. Physiol. Heart Circ. Physiol. 266:1233. doi: 10.1152/ajpheart.1994.266.3.h1233
Mittal, N., Zhou, Y., Ung, S., Linares, C., Molloi, S., and Kassab, G. S. (2005). A computer reconstruction of the entire coronary arterial tree based on detailed morphometric data. Ann. Biomed Eng. 33, 1015–1026. doi: 10.1007/s10439-005-5758-z
Moro, P. J., Flavian, A., Jacquier, A., Kober, F., Quilici, J., Gaborit, B., et al. (2011). Gender differences in response to cold pressor test assessed with velocity-encoded cardiovascular magnetic resonance of the coronary sinus. J. Cardiovasc. Magn. Reson. 13, 13–54. doi: 10.1186/1532-429X-13-54
Mynard, J. P., Davidson, M. R., Penny, D. J., and Smolich, J. J. (2010). A numerical model of neonatal pulmonary atresia with intact ventricular septum and RV-dependent coronary flow. Int. J. Numer Method Biomed Eng. 26, 843–861. doi: 10.1002/cnm.1384
Mynard, J. P., Penny, D. J., and Smolich, J. J. (2014). Scalability and in vivo validation of a multiscale numerical model of the left coronary circulation. Am. J. Physiol. Heart Circ. Physiol. 306, 517–528. doi: 10.1152/ajpheart.00603.2013
Mynard, J. P., and Smolich, J. J. (2015). One-dimensional haemodynamic modeling and wave dynamics in the entire adult circulation. Ann. Biomed Eng. 43, 1443–1460. doi: 10.1007/s10439-015-1313-8
Mynard, J. P., and Smolich, J. J. (2016). Influence of anatomical dominance and hypertension on coronary conduit arterial and microcirculatory flow patterns: a multiscale modeling study. Am. J. Physiol. Heart Circ. Physiol. 311, H11–H23. doi: 10.1152/ajpheart.00997.2015
Nellis, S. H., and Whitesell, L. (1989). Phasic pressures and diameters in small epicardial veins of the unrestrained heart. Am. J. Physiol. Heart Circ. Physiol. 257:1056. doi: 10.1152/ajpheart.1989.257.4.h1056
Ofili, E. O., Kern, M. J., Labovitz, A. J., St Vrain, J. A., Segal, J., Aguirre, F. V., et al. (1993). Analysis of coronary blood flow velocity dynamics in angiographically normal and stenosed arteries before and after endolumen enlargement by angioplasty. J. Am. Coll. Cardiol. 21, 308–316. doi: 10.1016/0735-1097(93)90668-q
Ofili, E. O., Kern, M. J., St. Vrain, J. A., Donohue, T. J., Bach, R., Al-Joundi, B., et al. (1995). Differential characterization of blood flow, velocity, and vascular resistance between proximal and distal normal epicardial human coronary arteries: analysis by intracoronary doppler spectral flow velocity. Am. Heart J. 130, 37–46. doi: 10.1016/0002-8703(95)90233-3
Okura, H., Fuyuki, H., Kubo, T., Iwata, K., Taguchi, H., Toda, I., et al. (2006). Noninvasive diagnosis of ischemic and nonischemic cardiomyopathy using coronary flow velocity measurements of the left anterior descending coronary artery by transthoracic doppler echocardiography. J. Am. Soc. Echocardiogr. 19, 552–558. doi: 10.1016/j.echo.2005.12.013
Ortiz-Pérez, J. T., Rodríguez, J., Meyers, S. N., Lee, D. C., Davidson, C., and Wu, E. (2008). Correspondence between the 17-segment model and coronary arterial anatomy using contrast-enhanced cardiac magnetic resonance imaging. JACC Cardiovasc. Imaging 1, 282–293. doi: 10.1016/j.jcmg.2008.01.014
Palau-Caballero, G., Walmsley, J., Gorcsan, J., Lumens, J., and Delhaas, T. (2016). Abnormal ventricular and aortic wall properties can cause inconsistencies in grading aortic regurgitation severity: a computer simulation study. J. Am. Soc. Echocardiogr. 29, 1122–1130.e4. doi: 10.1016/j.echo.2016.07.015
Rabbany, S. Y., Funai, J. T., and Noordergraaf, A. (1994). Pressure generation in a contracting myocyte. Heart Vessels 9, 169–174. doi: 10.1007/BF01746060
Rabbany, S. Y., Kresh, J. Y., and Noordergraaf, A. (1989). Intramyocardial pressure: Interaction of myocardial fluid pressure and fiber stress. Am. J. Physiol. Heart Circ. Physiol. 257, H357–H364. doi: 10.1152/ajpheart.1989.257.2.h357
Rammos, K. S., Koullias, G. J., Pappou, T. J., Bakas, A. J., Panagopoulos, P. G., and Tsangaris, S. G. (1998). A computer model for the prediction of left epicardial coronary blood flow in normal, stenotic and bypassed coronary arteries, by single or sequential grafting. Vascular 6, 635–648. doi: 10.1177/096721099800600617
Reymond, P., Merenda, F., Perren, F., Rüfenacht, D., and Stergiopulos, N. (2009). Validation of a one-dimensional model of the systemic arterial tree. Am. J. Physiol. Heart Circ. Physiol. 297, H208–H222. doi: 10.1152/ajpheart.00037.2009
Scarsoglio, S., Gallo, C., Saglietto, A., Ridolfi, L., and Anselmino, M. (2019). Computer methods and programs in biomedicine impaired coronary blood flow at higher heart rates during atrial fibrillation: investigation via multiscale modelling. Comput. Methods Prog. Biomed. 175, 95–102. doi: 10.1016/j.cmpb.2019.04.009
Schwitter, K., DeMarco, T., Kneifel, S., von Schulthess, G., Ciopor Jörg, M., Arheden, H., et al. (2000). Magnetic resonance – based assessment of global coronary functional parameters. Circulation 101, 2696–2702.
Smith, N. P., Pullan, A. J., and Hunter, P. J. (2002). An anatomically based model of transient coronary blood flow in the heart. SIAM J. Appl. Math. 62, 990–1018. doi: 10.1137/S0036139999355199
Spaan, J., Kolyva, C., Van Den Wijngaard, J., Ter Wee, R., Van Horssen, P., Piek, J., et al. (2008). Coronary structure and perfusion in health and disease. Philos. Trans. R. Soc. Math. Phys. Eng. Sci. 366, 3137–3153. doi: 10.1098/rsta.2008.0075
Spaan, J. A. E. (1985). Circulation research coronary diastolic pressure-flow relation and zero flow pressure explained on the basis of intramyocardial compliance. Circ. Res. 56, 293–309. doi: 10.1161/01.res.56.3.293
Spaan, J. A. E. (1995). Mechanical determinants of myocardial perfusion. Basic Res. Cardiol. 90, 89–102.
Spaan, J. A. E., Breuls, N. P. W., and Laird, J. D. (1981). Diastolic-systolic coronary flow differences are caused by intramyocardial pump action in the anesthetized dog with the technical assistance of. Circ. Res. 49, 584–593. doi: 10.1161/01.res.49.3.584
Spaan, J. A. E., Cornelissen, A. J. M., Chan, C., Dankelman, J., Yin, F. C. P. (2000). Dynamics of flow, resistance, and intramural vascular volume in canine coronary circulation. Am. J. Physiol. Heart Circ. Physiol. 278, H383–H403. doi: 10.1152/ajpheart.2000.278.2.h383
Suga, H., Sagawa, K., and Shoukas, A. A. (1973). Load independence of the instantaneous pressure-volume ratio of the canine left ventricle and effects of epinephrine and heart rate on the ratio. Circ. Res. 32, 314–322. doi: 10.1161/01.RES.32.3.314
Tani, T., Tanabe, K., Kitai, T., Yamane, T., Kureha, F., Katayama, M., et al. (2009). Detection of severe stenosis and total occlusion in the left anterior descending coronary artery with transthoracic doppler echocardiography in the emergency room. Echocardiography 26, 15–20. doi: 10.1111/j.1540-8175.2008.00737.x
Termeer, M., Bescós, J. O., Breeuwer, M., Vilanova, A., Gerritsen, F., Gröller, M. E., et al. (2010). “Patient-specific mappings between myocardial and coronary anatomy,” in Dagstuhl Follow-Ups, ed. H. Hagen 196–209.
Toyota, E., Ogasawara, Y., Hiramatsu, O., Tachibana, H., Kajiya, F., Yamamori, S., et al. (2005). Dynamics of flow velocities in endocardial and epicardial coronary arterioles. Am. J. Physiol. Heart Circ. Physiol. 288, 1598–1603. doi: 10.1152/ajpheart.01103.2003.-The
van der Horst, A., Boogaard, F. L., Van’t Veer, M., Rutten, M. C. M. M., Pijls, N. H. J. J., Van De Vosse, F. N., et al. (2013). Towards patient-specific modeling of coronary hemodynamics in healthy and diseased state. Comput. Math. Methods Med. 2013:15. doi: 10.1155/2013/393792
van Loon, T., Knackstedt, C., Cornelussen, R., Reesink, K. D., Brunner La Rocca H.-P., Delhaas, T., et al. (2020). Increased myocardial stiffness more than impaired relaxation function limits cardiac performance during exercise in heart failure with preserved ejection fraction: a virtual patient study. Eur. Heart J. Digit Heal. 1, 40–50. doi: 10.1093/ehjdh/ztaa009
Van Rossum, A., Visser, F., Hofman, M., Galjee, M., Westerhof, N., and Valk, J. (1992). Global left ventricular perfusion: noninvasive measurement with cine MR imaging and phase velocity mapping of coronary venous outflow. Radiology 182, 685–691. doi: 10.1148/radiology.182.3.1535881
Walmsley, J., Arts, T., Derval, N., Bordachar, P., Cochet, H., Ploux, S., et al. (2015). Fast simulation of mechanical heterogeneity in the electrically asynchronous heart using the multipatch module. PLoS Comput. Biol. 11:1–23. doi: 10.1371/journal.pcbi.1004284
Watzinger, N., Lund, G. K., Saeed, M., Reddy, G. P., Araoz, P. A., Yang, M., et al. (2005). Myocardial blood flow in patients with dilated cardiomyopathy: quantitative assessment with velocity-encoded cine magnetic resonance imaging of the coronary sinus. J. Magn. Reson. Imaging 21, 347–353. doi: 10.1002/jmri.20274
Westerhof, N. (1990). Physiological hypotheses-intramyocardial pressure. a new concept, suggestions for measurement. Basic, Res. Cardiol. 85, 105–119. doi: 10.1007/BF01906964
Westerhof, N., Boer, C., Lamberts, R. R., and Sipkema, P. (2006). Cross-talk between cardiac muscle and coronary vasculature. Physiol. Rev. 86, 1263–1308. doi: 10.1152/physrev.00029.2005
Yada, T., Hiramatsu, O., Kimura, A., Goto, M., Ogasawara, Y., Tsujioka, K., et al. (1993). In vivo observation of subendocardial microvessels of the beating porcine heart using a needle-probe videomicroscope with a CCD camera. Circ. Res. 72, 939–946. doi: 10.1161/01.RES.72.5.939
Keywords: coronary circulation, coronary hemodynamics, transmural myocardial flow, computational model, cardiac-to-coronary coupling
Citation: Munneke AG, Lumens J, Arts T and Delhaas T (2022) A Closed-Loop Modeling Framework for Cardiac-to-Coronary Coupling. Front. Physiol. 13:830925. doi: 10.3389/fphys.2022.830925
Received: 07 December 2021; Accepted: 24 January 2022;
Published: 28 February 2022.
Edited by:
Yong Wang, Max-Planck-Institute for Dynamics and Self-Organisation, GermanyReviewed by:
Lei Fan, Michigan State University, United StatesJonathan Paul Mynard, Murdoch Childrens Research Institute, Australia
Copyright © 2022 Munneke, Lumens, Arts and Delhaas. This is an open-access article distributed under the terms of the Creative Commons Attribution License (CC BY). The use, distribution or reproduction in other forums is permitted, provided the original author(s) and the copyright owner(s) are credited and that the original publication in this journal is cited, in accordance with accepted academic practice. No use, distribution or reproduction is permitted which does not comply with these terms.
*Correspondence: Anneloes G. Munneke, YS5tdW5uZWtlQG1hYXN0cmljaHR1bml2ZXJzaXR5Lm5s