 Youna Marc-Derrien1Louise Gren2
 Katrin Dierschke3Maria Albin3,4Anders Gudmundsson2Aneta Wierzbicka2
 Frida Sandberg1*
- 1Department of Biomedical Engineering, Lund University, Lund, Sweden
- 2Ergonomics and Aerosol Technology, Lund University, Lund, Sweden
- 3Division of Occupational and Environmental Medicine, Lund University, Lund, Sweden
- 4Unit of Occupational Medicine, Institute of Environmental Medicine, Karolinska Institutet, Stockholm, Sweden
Ambient air pollution is recognized as a key risk factor for cardiovascular morbidity and mortality contributing to the global disease burden. The use of renewable diesel fuels, such as hydrotreated vegetable oil (HVO), have increased in recent years and its impact on human health are not completely known. The present study investigated changes in cardiovascular tone in response to exposure to diluted HVO exhaust. The study participants, 19 healthy volunteers, were exposed in a chamber on four separate occasions for 3 h and in a randomized order to: (1) HVO exhaust from a wheel loader without exhaust aftertreatment, (2) HVO exhaust from a wheel loader with an aftertreatment system, (3) clean air enriched with dry NaCl salt particles, and (4) clean air. Synchronized electrocardiogram (ECG) and photoplethysmogram (PPG) signals were recorded throughout the exposure sessions. Pulse decomposition analysis (PDA) was applied to characterize PPG pulse morphology, and heart rate variability (HRV) indexes as well as pulse transit time (PTT) indexes were computed. Relative changes of PDA features, HRV features and PTT features at 1, 2, and 3 h after onset of the exposure was obtained for each participant and exposure session. The PDA index A13, reflecting vascular compliance, increased significantly in both HVO exposure sessions but not in the clean air or NaCl exposure sessions. However, the individual variation was large and the differences between exposure sessions were not statistically significant.
1. Introduction
Ambient air pollution is recognized as a key risk factor influencing the global disease burden (Landrigan et al., 2018). Both long-term and short-term exposure to particulate matter (PM) air pollution has been shown to contribute to cardiovascular morbidity and mortality (Franklin et al., 2015). Exposure to PM air pollution correlates with subclinical pathologies underlying cardiovascular disease, including systemic inflammation and oxidative stress, atherosclerosis, thrombosis, endothelial dysfunction, hypertension, cardiac remodeling, and arrhythmia (Hamanaka and Mutlu, 2018). The biological mechanisms behind PM-induced cardiovascular disease are not completely known. One of the suggested mechanisms is that inhaled PM acts on sensory receptors in the lung, promoting activation of the hypothalamic pituitary adrenal (HPA) axis resulting in increased sympathetic activity in the autonomic nervous system (ANS) (Hamanaka and Mutlu, 2018).
Heart rate variability (HRV) analysis is widely used to characterize the functions of the ANS (Task Force, 1996; Sassi et al., 2015). Previous studies have linked PM2.5 exposure to decreased HRV (Pieters et al., 2012), however, results from controlled exposure studies are inconsistent. Hemmingsen et al. (2015) found that HRV significantly decreased during exposure to real-life levels of particles from urban streets in an exposure chamber in a study population of overweight, older adults. In contrast, Mills et al. (2011a) found that brief exposure to diluted diesel exhaust did not alter HRV in healthy volunteers or well-treated patients with stable coronary heart disease.
Previous studies have found an association between air pollution and arterial stiffness (Zanoli et al., 2017). Moreover, results from controlled exposure studies suggest that short-term exposure to air pollution are associated with changes in vascular tone. Lucking et al. (2011) and Mills et al. (2011b) have reported impairment of vasomotor responses to endothelium-dependent and endothelium independent vasodilators after diesel exhaust exposure. Transient increases in arterial stiffness have been reported in response to exposure to diluted diesel exhaust (Lundbäck et al., 2009), and diluted wood smoke (Unosson et al., 2013), respectively. In those studies, arterial stiffness was assessed with applanation tonometry. The pulses at the carotid and femoral arteries were used to estimate carotid-femoral pulse wave velocity (PWV) which is regarded as gold standard to assess arterial stiffness (Laurent et al., 2006). Further, the pulse obtained at the radial artery was used to estimate an aortic pressure pulse from which an augmentation index quantifying the ration of the amplitude of the reflected pressure wave to the pulse pressure peaks was derived.
Photoplethysmography (PPG) is used as inexpensive and operator independent alternative to applanation tonometry (Millasseau et al., 2006; von Wowern et al., 2015). The PPG pulse transit time (PTT), commonly defined as the time interval between the ECG R peak and the corresponding PPG pulse onset, is inversely related to PWV and is used as a marker of arterial compliance. Several different indexes characterizing the PPG finger pulse morphology have been proposed to quantify arterial stiffness and vascular tone (Allen, 2007). Most of these indexes are computed based on peak detection in the PPG signal and its first and second derivative( Elgendi, 2012), which is very sensitive to noise and deviating pulse morphology and to remedy this, more robust techniques based on PPG pulse decomposition have been proposed. One such method is the pulse decomposition analysis (PDA) recently proposed for PPG based assessment of changes in vascular tone in response to mental stress by Kontaxis et al. (2021), which we use in the present study.
Diesel exhaust emission is considered one of the main sources of air pollution in cities. Diesel exhaust is a complex mixture of PM and gases, including elemental carbon (EC), carbon monoxide (CO), carbon dioxide (CO2), nitric oxide (NO), nitrogen dioxide (NO2), hydrocarbons (HC), and polyaromatic hydrocarbons (PAHs). The use of renewable diesel fuels, such as hydrotreated vegetable oil (HVO), have increased in recent years to reduce CO2 emissions from diesel vehicles. Hydrotreated vegetable oil generate exhaust emission similar to diesel exhaust in composition, but can reduce the PM emissions by 20–50% compared to petroleum diesel (Kuronen et al., 2007; Murtonen et al., 2010). In order to reduce the environmental and health hazardous emission from diesel vehicles, emission abatement techniques such aftertreatment systems have been enforced in newer vehicles. Such systems are located in the exhaust pipe and can for example contain a diesel oxidation catalyst for removing CO and organic compounds (Zeraati-Rezaei et al., 2020), and a diesel particulate filter (DPF) which can remove a large fraction of the PM by oxidizing the soot particles (Reşitoĝlu and K Altinişik K, 2015). The impact of such difference in exhaust composition on human health are not completely known (Landwehr et al., 2021).
The purpose of the present study is to investigate changes in HRV and vascular tone in response to diluted HVO exhaust with and without exhaust particles in a controlled exposure chamber study. We analyze PPG pulse morphology, HRV, and PTT in synchronized ECG and PPG signals from 19 healthy volunteers in a randomized double-blinded cross-over study that compare four exposure scenarios; HVO exhaust from a wheel loader without exhaust aftertreatment, HVO exhaust from a wheel loader with an aftertreatment system, clean air, and clean air enriched with dry NaCl salt particles.
2. Materials
The exposures were conducted in a 22 m3 stainless steel chamber with an air exchange rate of 4 changes per hour at the Aerosol Laboratory, Lund University, Sweden, during fall 2019. The study population consisted of 19 healthy volunteers (10 males, age 20–55 years) which complied with the inclusion criteria: no symptoms or diagnosis of lung disease or asthma; a normal standard ECG reading; no allergy- or cardiovascular medication; non-smokers the last three years. The study participants were instructed to avoid caffeine in the morning and alcohol for 24 h before each exposure session. Further, the participants were told to try to live as normal and similar as possible before each exposure session. Previous studies have investigated pulmonary function and self-rated symptoms (Gren et al., 2022), urinary PAH metabolites and biomarkers (Krais et al., 2021), and genotoxic responses (Scholten et al., 2021), respectively, in response to the exposures.
The participants were exposed on separate occasions for 3 h in a randomized order to the following exposure scenarios: filtered air (FA, PM ≃ 1 μg/m3), filtered air with dry salt NaCl particles (NaCl, ≈120μgm−3 of PM2.5), HVO exhaust from a wheel loader with an aftertreatment system, i.e., emission with nitrogen oxides and low amounts of particulate matter (HVONOx, PM ≃ 1 μg/m3, NO = 2.0 ppm, NO2 = 0.7 ppm), and HVO exhaust from a wheel loader without aftertreatment, i.e., emission with nitrogen oxides and particulate matter (HVONOx+PM, PM ≃ 90 μg/m3, EC = 54 μg/m3, NO = 3.4 ppm, NO2 = 0.6 ppm). The temperature was kept at 26 ± 1°C and the relative humidity at 33 ± 4%. The duration of the exposures was limited to 3 h for practical reasons to allow for controlled conditions; during this time the participants did not leave the chamber.
The HVONOx+PM and HVONOx exhaust was generated with a smaller vehicle (without the aftertreatment system) following the emission standard Euro IIIa for non-road engines, and a larger vehicle (with the aftertreatment system) following the emission standard Euro V, respectively. The vehicles were run on 100% HVO and the exhaust was extracted from the exhaust pipe, transported in heated tubing and diluted in two steps to a total dilution ratio of 1:160. The supply air for the dilution was filtered from particles with a high efficiency particulate absorbing (HEPA) filter and from gases with an active carbon filter. The resulting exposure concentrations complied with current EU occupational exposure limits (OELs) of NO, NO2, formaldehyde, PAHs, and future OEL of elemental carbon (2023). The NaCl exposure was generated by nebulizing a salt solution (chemical-grade NaCl dissolved in ultrapure water) with a constant output atomizer model 3076 (TSI Inc. Shoreview, MN, U.S.A.) together with a custom-built nebulizer. The aerosol was dried with a dilution flow of HEPA-filtered air in a 10 L steel chamber, and the relative humidity was kept was kept below 30% in this step (except during one exposure that had <40% RH), to ensure that the salt particles were in dry solid form. The exposure setup and the HVO exhaust generation are described in detail in Gren et al. (2022).
Synchronized PPG and ECG recordings were acquired using a custom-made medical device, CardioHolter v6.2, developed at Kaunas University of Technology, Lithuania. Three-lead ECG was continuously recorded during the experimental protocol at a sampling frequency of 1 kHz. Transmittance PPG at wavelengths of 635 nm (IR) and 960 nm (R) from the right and left hand index fingers, sampled at 250 Hz were recorded during four 15-min sessions when the participants were told to rest: pre-exposure and after 1, 2, and 3 h into the exposure, respectively.
The study was conducted in accordance with the Declaration of Helsinki and approved by the Swedish Ethical Review Authority (registration no. 2019-03320). All participants gave their informed consent before the experiment.
3. Methods
3.1. PPG Pulse Waveform Analysis
3.1.1. PPG Pre-processing and Pulse Detection
The PPG signals are subjected to high-pass filtering for the purpose of baseline removal using a 2nd order Butterworth filter with cut-off frequency of 0.5 Hz, and interpolated to 1 kHz using cubic splines to match the temporal resolution of corresponding ECG signals. Segments of the PPG signal containing large amplitude artifacts are excluded from further analysis; such intervals are identified using the energy-related approach proposed by Armañac et al. (2019); if the 2-s moving variance of the squared PPG signal y2(n) is more than 4 times larger than the 100-s moving median of y2(n), the sample y(n) is excluded from further analysis. Finally, the PPG signals are subjected to low-pass filtering at 10 Hz to attenuate high-frequency noise; xPPG(n) denotes the pre-processed PPG signal.
Detection of PPG pulse onset times is carried out using the method proposed by Argüello-Prada (2019), which is based on the first derivative of xPPG(n), denoted . The maximum of associated with the ith PPG pulse is denoted nF(i). The pulse onset nB(i) is defined as:
where Ω = [nF(i)−0.3·Fs, nF(i)], and Fs = 1000 Hz is the sampling rate of xPPG(n). In other words, nB(i) is the point in an interval 300 ms prior to nF(i) where the slope of xPPG(n) has been reduced by 5%.
Further, linear interpolation of xPPG(nB(i)) is subtracted from xPPG(n), yielding , so that each pulse begins and ends with zero amplitude. The ith PPG pulse is defined as
PPG pulses immediately preceding and following each detected artefact segment are excluded from further analysis.
3.1.2. Pulse Decomposition Analysis
A pulse decomposition analysis (PDA) technique adapted from Kontaxis et al. (2021) is applied for PPG pulse waveform modeling. Each pulse xi(n) is decomposed into K symmetrical waves: xi, 1(n), ..., xi,K(n) and a residual signal. In this study, K is set to 5. The up-slope interval of the running residual is defined, with its onset denoted as nOj and its end as nEj. The point nOj corresponds to of the first non-negative sample and nEj to the position of the first relative maximum of . The inner wave is obtained by concatenating the up-slope of the residual with itself horizontally flipped:
The jth inner wave is then subtracted from the running residual, i.e., and the following inner waves are computed recursively. A minimum amplitude threshold is set: an inner wave is defined only if exceeds γ = 0.05 ·max{xi(n)}. Moreover, either the presence of a relative maximum with amplitude lower than γ, or a slope change which, however, does not appear as a relative maximum in can lead to erroneous pulse decomposition. The point nOj is thus redefined as the next sample after the last negative-amplitude sample of and nEj as the position of the first relative minimum of for which is fulfilled.
3.1.3. Pulse Waveform Features
Morphological attributes related to vascular compliance properties are extracted from each modeled PPG pulse. For every inner wave, Aj(i) and Tj(i) are, respectively, defined as the amplitude and position of the absolute maximum of xi,j(n). The width of each inner wave, denoted as Wj(i) is estimated by the width at half-maximum of xi,j(n). Figure 1 shows an example of pulse waveform characteristics.
Figure 1. PPG pulse waveform features derived from the amplitude Aj, position Tj, and width Wj of the K = 5 decomposed waves.
The time delay T1j(i), as well as the percentage of amplitude loss A1j(i) between the first and the jth wave, are calculated:
A pulse is considered distorted if one of the following criteria is fulfilled: (a) the pulse is decomposed into less than five waves, (b) the amplitude of the main wave is not the largest of the five waves, (c) the second wave is located at the end of the pulse interval, i.e., T2(i)>0.8·TBB(i), or (d) the fifth wave is located at the beginning of the pulse interval, i.e., T5(i) <0.4·TBB(i). All distorted pulses are excluded from further analysis.
PDA-derived features are computed for each pulse in the last 5-min segment of each 15-min PPG recording. For each study participant, the median value and the median absolute deviation (MAD) of each pulse waveform characteristic is calculated, separately for every exposure scenario (FA, NaCl, HVONOx, HVONOx+PM) and time into exposure (pre-exposure and after 1, 2, and 3 h). Complementary outlier rejection is performed; if a feature value deviates more than 5· MAD from the median the it is excluded, and the median is updated.
3.2. Heart Rate Variability Analysis
Classical time-domain and frequency-domain HRV features are calculated based on ECG segments from the last 5 min of rest pre-exposure and after 1, 2, and 3 h into the exposure, respectively, i.e., the same 5 min window that are used for PPG waveform analysis.
Following detection of R-peaks in the ECG, beats are clustered and ectopic beats are identified based on heartbeat morphology (Lagerholm et al., 2000). For each ECG recording an RR interval series is constructed
where tE(i) denotes the time of the ith R-peak. RR intervals preceding and following ectopic beats, and RR intervals deviating more than 20% from the mean of the 50 preceding RR intervals are excluded from the series to obtain a normal-to-normal interval series dNN.
The following time-domain HRV features are obtained directly from dNN(tE(j)): mean normal-to-normal interval (NN), standard deviation of NN intervals (SDNN), root mean square of successive differences of adjacent NN intervals (rMSSD), and standard deviation of adjacent NN interval differences (SDSD).
To calculate the frequency-domain HRV features dNN is uniformly re-sampled to 4 Hz using cubic spline interpolation and the fast Fourier transform is applied. The power in the low-frequency band (LF, 0.04–0.15 Hz) and in the high frequency band (HF, 0.15–0.4 Hz) are estimated, as well as the LF to HF ratio (LF/HF) and the relative power in the LF and HF bands to the total power (HF norm and LF norm).
3.3. Pulse Transit Time Analysis
Pulse transit time are calculated based on synchronized PPG and ECG segments from the last 5 min of rest pre-exposure and after 1, 2, and 3 h into the exposure, respectively, i.e., the same 5 min window that are used for HRV and PPG waveform analysis.
The pulse transit time interval series is computed as
where tP(i) denotes the PPG pulse onset time, given by the nB [cf. Equation (1)] that occurs within the interval [tE(i), tE(i+1)].
PTT intervals deviating more than 30% from the mean length of the 50 preceding intervals are considered abnormal and excluded from further analysis. Classical time domain indices are measured: mean PTT interval (PTT), standard deviation of PTT intervals (SDPTT), root mean square of successive differences of adjacent PTT intervals (rMSSDPTT), and standard deviation of adjacent PTT interval differences (SDSDPTT).
3.4. Statistical Analysis
For each participant i the percentage change in feature a given time point (t = 1, 2, and 3 h) after exposure onset, relative to pre-exposure parameter, , is computed:
For each exposure and time into exposure t, a Wilcoxon signed rank test is applied to test if the participant median differs significantly from zero; for the PDA and PTT features, is averaged over PPG channels prior to this test.
Further, a non-parametric Friedman one-way repeated measure analysis of variance by ranks is used to determine if the exposure type (FA, NaCl, HVONOx, HVONOx+PM) effects . For the PDA and PTT features, obtained from the different PPG channels is considered as repeated observations. A multi-comparison test (post-hoc analysis) with Bonferroni applied to determine if differences between exposure types are significant.
4. Results
4.1. Data Acquisition and Experimental Protocol
A total of 18 study participants completed the whole experimental protocol; one participant only attended sessions NaCl and HVONOx. PPG recordings were partly missing and/or of insufficient quality for one participant during exposure NaCl and two participants during exposure HVONOx+PM. At 3 h after exposure onset, PDA features could be obtained from 18 (FA), 17 (NaCl), 19 (HVONOx), and 17 (HVONOx+PM), participants, respectively.
ECG recordings were partly missing from three participants during exposure NaCl, two participants during exposure HVONOx and two participants during exposure HVONOx+PM. At 3 h after exposure onset, HRV features could be obtained from 18 (FA), 16 (NaCl), 19 (HVONOx), 16 (HVONOx+PM) and participants, respectively. Further, at 3 h after exposure onset, PTT features could be obtained from 18 (FA), 16 (NaCl), 16 (HVONOx), and 18 (HVONOx+PM) participants, respectively.
Changes in PDA features at 3 h after exposure for all exposure sessions could be obtained from 15 participants, and changes in HRV and PTT features at 3 h after exposure for all exposure sessions could be obtained from 13 participants; the comparison between exposure sessions is based on this subset of data.
4.2. PPG Pulse Characteristics
For each exposure scenario, the percentage of discarded pulses (mean±std) is 4.9 ± 9.3% (FA), 4.4 ± 7.7% (NaCl), 4.8 ± 8.1% (HVONOx), and 4.5 ± 9.1% (HVONOx+PM). These results suggest that few distorted pulses are present in PPG signal recordings in average, but the percentages varies between recordings. The number of analyzed pulses (mean±std) in each 5-min segment is 206 ± 114 (FA), 212 ± 109 (NaCl), 204 ± 105 (HVONOx), and 195 ± 118 (HVONOx+PM), which is considered sufficient for robust estimation of the PDA features (cf. Section 3.1.3).
On average, pre-exposure PPG pulse characteristics did not differ significantly between the exposure sessions (Table 1). A large range of responses was however observed for each participant and feature individually, justifying the computation of relative changes of parameters to assess the effects of different exposure scenarios.
Table 1. Median and interquartile range (Q1–Q3) of pre-exposure PDA features for each exposure scenario.
The distribution of relative changes in A13 during each exposure scenario are displayed in Figure 2. A Wilcoxon signed rank test indicates that the increase in response to exposure scenario HVONOx at 2 and 3 h and exposure scenario HVONOx+PM at 3 h are significant (p < 0.05). However, individual differences are large.
Figure 2. Median (central mark) and interquartile range (edges of box) of relative change of A13 during exposure scenario FA (blue), NaCl (red), HVONOx(yellow), and HVONOx+PM (purple). Whiskers extend to 1.5 times the interquartile range and values outside this interval are marked by “+.” significantly different from zero according to the Wilcoxon signed rank test (p <0.05) are marked by (*).
Relative changes in PDA features from pre-exposure to 3 h after exposure onset are summarized in Table 2. In addition to the increases in A13, significant increases in A12 were observed during exposures NaCl and HVONOx. The median of for A13 was considerably larger in exposure HVONOx+PM and HVONOx compared to FA, and the median of for A12 was considerably larger in exposure NaCl, HVONOx+PM, and HVONOx compared to FA, however, the individual variation was large. The Friedman tests indicated that the differences between exposure types were not statistically significant.
Table 2. Median and interquartile range (Q1-Q3) of relative changes in PDA features for each exposure scenario.
4.3. Heart Rate Variability
The percentage of discarded RR intervals (mean±std) for each stage is 3.5 ± 6.6% (FA), 3.6 ± 6.7% (NaCl), 2.5 ± 3.4% 2.6 ± 4.8% (HVONOx), and (HVONOx+PM). These results suggest that few abnormal RR intervals are present in the ECG signal recordings in average. The number of analyzed RR intervals (mean±std) for each exposure type is 281 ± 52 (FA), 285 ± 47 (NaCl), 284 ± 42 (HVONOx), and 282 ± 47 (HVONOx+PM). Pre-exposure HRV statistics were not significantly different between exposure sessions, but a large range of responses was observed for every subject and feature individually (Table 3).
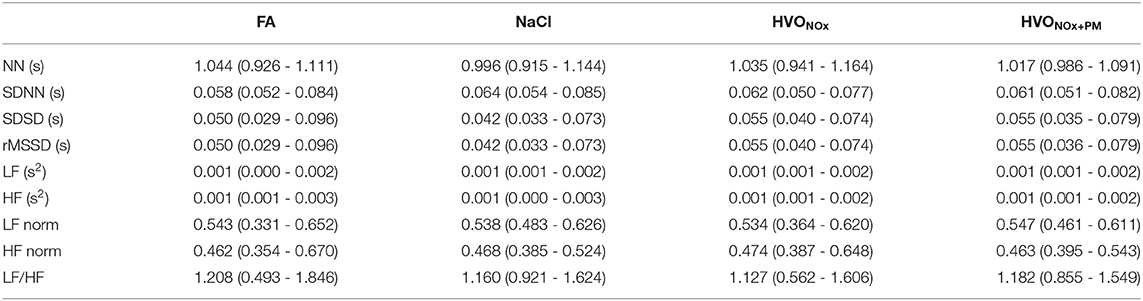
Table 3. Median and interquartile range (Q1-Q3) of pre-exposure HRV features for each exposure scenario.
The distribution of relative changes in LF/HF during each exposure scenario are displayed in Figure 3; increases were observed in several exposure sessions. A Wilcoxon signed rank test indicates that the increases during exposure scenario FA at 1h and 3 h, scenario NaCl at 2 h, and scenario HVONOx at 1, 2, and 3 h are significant (p < 0.05). However, individual differences are large.
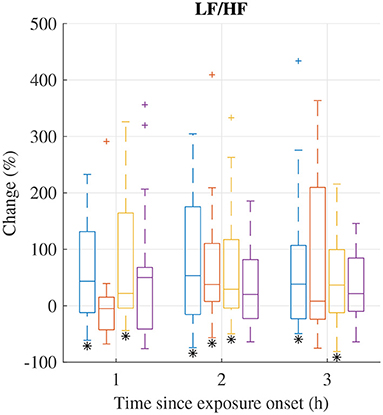
Figure 3. Median (central mark) and interquartile range (edges of box) of change of LF/HF during exposure scenario FA (blue), NaCl (red), HVONOx(yellow), and HVONOx+PM (purple). Whiskers extend to 1.5 times the interquartile range and values outside this interval are marked by “+.” significantly different from zero according to the Wilcoxon signed rank test (p <0.05) are marked by (*).
Relative changes of HRV features from pre-exposure to 3 h after exposure onset are summarized in Table 4. I addition to the observed changes in LF/HF, heart rate was found to increase as indicated by the decrease in NN; the decrease in NN was significant for HVONOx but not for the other exposure scenarios. Further, LF was found to increase significantly during exposure scenario NaCl. The Friedman test show that no exposure type induce changes in HRV characteristics that were significantly different to the changes induced in the control session FA.
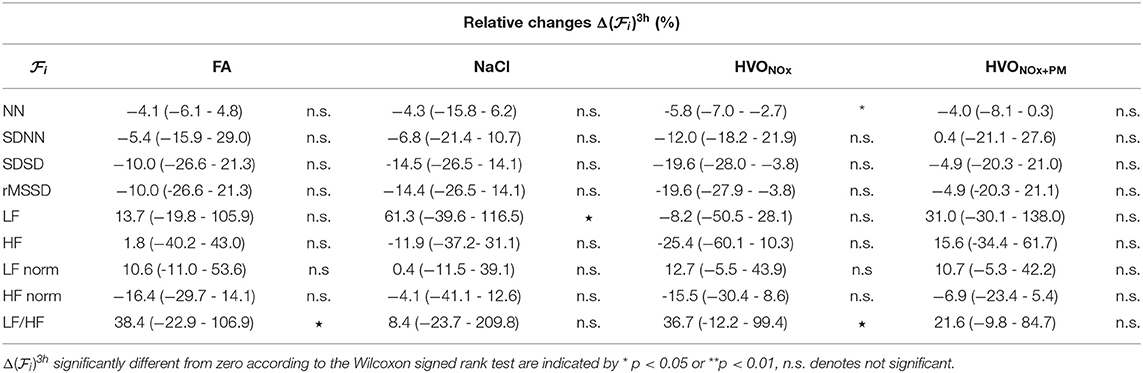
Table 4. Median and interquartile range (Q1–Q3) of relative changes in HRV features for each exposure scenario.
4.4. Pulse Transit Time
The percentage of discarded PTT intervals (mean±std) for each stage is 4.2 ± 9.5% (FA), 4.8 ± 12.0% (NaCl), 6.6 ± 16.5% (HVONOx), and 2.6 ± 5.9% (HVONOx+PM). The results remain heterogeneous, with several recordings concerned by a percentage of discarded PTT intervals superior to 15% (2 for FA, 4 for NaCl, 4 for HVONOx, and 1 for HVONOx+PM). However, the number of analyzed PTT intervals in each 5-min recording (mean±std) 284 ± 54 (FA), 287 ± 55 (NaCl), 275 ± 60 (HVONOx), and 288 ± 46 (HVONOx+PM) is considered sufficient for analysis.
Pre-exposure PTT features were not significantly different between exposure sessions, but a large range of responses was observed for every subject and feature individually (Table 5).
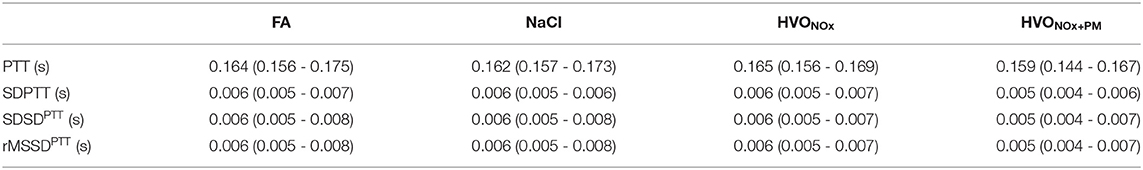
Table 5. Median and interquartile range (Q1-Q3) of pre-exposure PTT features for each exposure scenario.
The distribution of relative changes in PTT during each exposure scenario are displayed in Figure 4. Significant decreases were observed during all exposure sessions. However, individual differences were large.
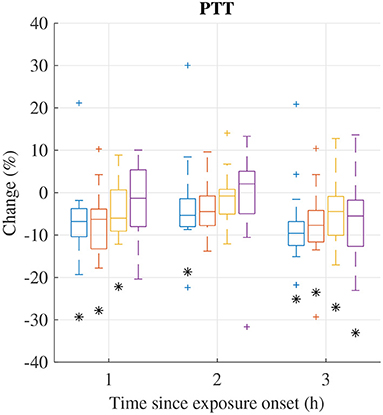
Figure 4. Median (central mark) and interquartile range (edges of box) of change of mean PTT during exposure scenario FA (blue), NaCl (red), HVONOx(yellow), and HVONOx+PM (purple). Whiskers extend to 1.5 times the interquartile range and values outside this interval are marked by “+.” significantly different from zero according to the Wilcoxon signed rank test (p <0.05) are marked by (*).
Relative changes of PTT features from pre-exposure to 3 h after exposure onset are summarized in Table 6. In addition to the decrease in PTT, a significant decreases were observed for rMSSDPTT and SDSDPTT during exposures FA and HVONOx. The Friedman test show that no exposure type induces changes in PTT characteristics that was significantly different to the changes induced in the control session FA.
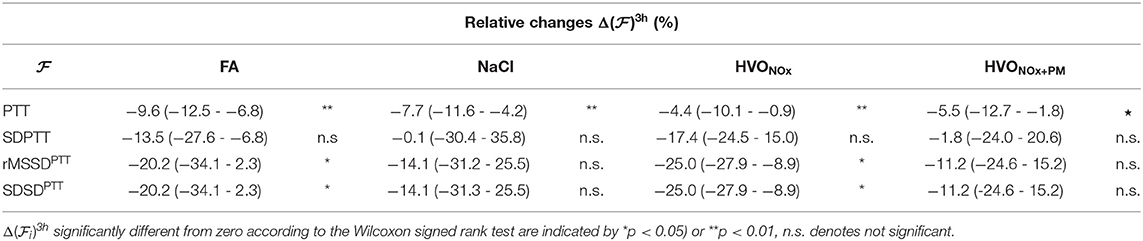
Table 6. Median and interquartile range (Q1–Q3) of relative changes in PTT features for each exposure scenario.
5. Discussion
The present results show that PPG pulse characteristics, PTT and HRV change during the chamber exposure sessions. However, the individual variation is large and differences between exposure sessions were not statistically significant.
The methodology applied to analyze changes in PPG pulse characteristics in the present study has previously been used to assess differences in autonomic reactivity to mental stress in patients with mental depressive disorder and healthy controls (Kontaxis et al., 2021); the methodology was first proposed for robust extraction of PPG pulse features in the context of surrogate baroreflex sensitivity measurements (Lázaro et al., 2019). Each PPG pulse is decomposed into a main wave and several reflected waves; the waves are assumed to be symmetrical but no specific shape is assumed. Several other methods have been proposed for PPG pulse decomposition based on fitting of Gaussian functions (Rubins, 2008; Liu et al., 2013; Wang et al., 2013; Couceiro et al., 2015), Rayleigh functions (Goswami et al., 2010), and Log-Normal functions (Huotari et al., 2011). In contrast to Lázaro et al. (2019) where the waves are fitted sequentially, these methods are based on joint fitting a sum of two (Goswami et al., 2010) to five waves (Huotari et al., 2011; Wang et al., 2013; Couceiro et al., 2015). Whereas (Kontaxis et al., 2021) decomposed the PPG pulses into three waves, five waves were used in the present study. We obtained equally robust estimates of the amplitude and timing for the 4th and 5th decomposed waves as for the 2nd and 3rd wave (results not shown).
Pulse decomposition analysis is based on the concept of arterial pressure pulses originating from the left ventricle being reflected in the arterial tree. The first decomposed wave resulting from PDA corresponds to the primary pressure pulse and the following decomposed waves results from these reflections. Baruch (2019) argues that two distinct central pressure pulse reflection sites contributes most; one in the region of the renal arteries and one beyond the bifurcation of the iliac arteries. Reflections from these sites are assumed to correspond to the second and third decomposed wave, respectively, and the fourth and fifth decomposed waves are assumed to be caused by re-reflections between these sites. Stiffer arteries are assumed to increase the propagation of the arterial pulse and enhance the speed and magnitude of the reflected waves.
The PPG pulse feature A13 quantifies relative amplitude loss in the second reflected wave. The increase in A13 during exposure HVONOx and HVONOx+PM may reflect changes in vascular tone induced by the exposure to HVO exhaust, since similar increases in A13 were not observed during the control session FA. The increases in LF/HF indicating increased sympathetic tone observed during the control scenario FA suggest that the experiment induces stress; such increases are also observed during the other exposure scenarios. Other possible reasons for the observed changes in LF/HF is that the time of the day changes during the experiment; circadian variation in short-term HRV indexes obtained from healthy subjects have previously been reported (Bilan et al., 2005). The decrease in PTT observed during the control scenario FA suggest that changes in vascular tone are induced during the experiment; similar decreases in PTT are observed during exposure scenarios NaCl, HVONOx, and HVONOx+PM. The decrease in PTT most likely reflect increases in PWV caused by increased sympathetic tone; such increases have previously been shown in response sympathoexcitatory maneuvers such as cold pressure test, lower body negative pressure, and orthostasis (Nardone et al., 2020).
It should be noted that whereas the decrease in PTT is associated to increased arterial stiffness, the increase in A13 quantifying a decreased magnitude of the reflected wave is rather assumed to be associated to the opposite. However, vascular smooth muscle tone can also can influence wave reflection characteristics independent of artery stiffness. Kelly et al. (2001) showed that systemic administration of the arterial vasodilator nitroglycerin reduced the augmentation index quantifying the magnitude of the reflected wave, but had little effect on the pulse wave velocity. Since the increase in A13 was observed both during exposure HVONOx+PM and HVONOx, it may be associated to inhalation of nitric oxides rather than particulate matter. NO is known as a vasodilator (Levine et al., 2012), and inhalation of NO has been proposed as a selective pulmonary vasodilator (Ichinose et al., 2004). The levels of inhaled NO during the HVO exposures in the present study are close to therapeutic levels of inhaled NO (5–80 ppm) (Yu et al., 2019). On the other hand, long-term exposure to NO2 is linked to increased arterial stiffness; (Lenters et al., 2010) reported increases in augmentation index and pulse wave velocity associated to increases in NO2 study involving 729 young individuals. However, no such association was found in subsequent studies on short-term NO2 exposure (Mehta et al., 2014; Wu et al., 2016).
Transient increases in arterial stiffness have previously been reported in response to exposure to diluted diesel exhaust (Lundbäck et al., 2009) as well as diluted wood smoke (Unosson et al., 2013). It should be noted that the PM concentrations in those studies were larger, ≈350 and ≈314μgm−3 of PM2.5, respectively. Further, in contrast to the present study, where the participants were at rest throughout the exposure session, the participants in those studies were exercising moderately and thereby possibly increasing the exposure. The present study was conducted on a study population of healthy young and middle-aged adults. Our results are consistent with the results presented in Mills et al. (2011a), where brief exposure to diluted diesel exhaust (≈300μgm−3) did not alter HRV in healthy volunteers. A study population consisting of older and overweight adults may have given a different result; (Hemmingsen et al., 2015) found that HRV significantly decreased during 5 h exposure to real-life levels of particles from urban streets in a study population of overweight, middle-aged and elderly adults.
5.1. Limitations
The main limitation of the present study is the small study population. Considering that the individual variation of changes in PPG pulse characteristics, HRV and PTT in response to the exposures is very large, a larger study population is desired. It should be noted, however, that including a large number of participants in a chamber exposure study is associated with major difficulties. Each volunteer has to spend half a day at four different occasions for the experiments. Further, the exposure chamber can fit a maximum of four study participants at the time. Another limitation is the lack of comparison to reference clinical standard measurements of pulse wave velocity and pulse wave reflection. Previous studies on air pollution and arterial stiffness are based on planation tonometry, and it should be noted that the results of PPG based assessment of pulse wave velocity and pulse wave reflections presented in this study are not directly comparable to the results in the previous studies.
6. Conclusions
The aim of the present study was to characterize changes in PPG pulse morphology, HRV, and PTT in response to exposure to diluted HVO exhaust in a randomized double-blinded cross-over study. Significant increases in LF/HF and significant decreases in PTT were observed in all exposure scenarios. Further, the PDA feature A13, reflecting vascular compliance, increased significantly in the HVONOx and HVONOx+PM exposure sessions but not in the FA and NaCl sessions. The individual variation of the changes in PDA, HRV, or PTT features during the exposures were large, and no significant differences in between exposure sessions were found.
Data Availability Statement
The raw data supporting the conclusions of this article will be made available by the authors, without undue reservation.
Ethics Statement
The study was conducted in accordance with the Declaration of Helsinki. It was reviewed and approved by the Swedish Ethical Review Authority (registration no. 2019-03320). All participants gave their informed consent before the experiment.
Author Contributions
LG, KD, AG, AW, and FS contributed to the study design and data acquisition. YM-D and FS performed the data analysis and drafted the manuscript. MA contributed to the clinical interpretation of the results. AG and AW conceived the original idea for the exposure project and acquired funding. AW coordinated the exposure project. All authors contributed to the final version of the manuscript.
Funding
This work was supported by the Swedish Research Council for Sustainable Development (grant FORMAS2016-00824), the Swedish Research Council (grant VR2019-04272), and the Crafoord Foundation (grant 20200605).
Conflict of Interest
The authors declare that the research was conducted in the absence of any commercial or financial relationships that could be construed as a potential conflict of interest.
Publisher's Note
All claims expressed in this article are solely those of the authors and do not necessarily represent those of their affiliated organizations, or those of the publisher, the editors and the reviewers. Any product that may be evaluated in this article, or claim that may be made by its manufacturer, is not guaranteed or endorsed by the publisher.
Acknowledgments
The authors thank the volunteers for participating in the exposure study. Fredrik Mattson is acknowledged for vehicle operation and practical support around exposure study. Mattias Holmer and Vaidotas Marozas are acknowledged for providing the CardioHolter equipment.
References
Allen, J. (2007). Photoplethysmography and its application in clinical physiological measurement. Physiol. Meas. 28, R1–R39. doi: 10.1088/0967-3334/28/3/r01
Argüello-Prada, E. J. (2019). The mountaineer's method for peak detection in photoplethysmographic signals. Revista Facultad de Ingeniería, Universidad de Antioquia 2019, 42–50. doi: 10.17533/udea.redin.n90a06
Armañac, P., Kontaxis, S., Lázaro, J., Laguna, P., Bailón, R., and Gil, E. (2019). Cardiovascular changes induced by acute emotional stress estimated from the pulse transit time difference. Comput. Cardiol. (CinC) 46, 1–4. doi: 10.23919/CinC49843.2019.9005922
Baruch, M. C. (2019). “Pulse decomposition analysis techniques,” in The Handbook of Cuffless Blood Pressure Monitoring: A Practical Guide for Clinicians, Researchers, and Engineers, eds J. Solà and R. Delgado-Gonzalo (Cham: Springer International Publishing), 75–105.
Bilan, A., Witczak, A., Palusiński, R., Myśliński, W., and Hanzlik, J. (2005). Circadian rhythm of spectral indices of heart rate variability in healthy subjects. J. Electrocardiol. 38, 239–243. doi: 10.1016/j.jelectrocard.2005.01.012
Couceiro, R., Carvalho, P., Paiva, R. P., Henriques, J., Quintal, I., Antunes, M., et al. (2015). Assessment of cardiovascular function from multi-gaussian fitting of a finger photoplethysmogram. Physiol. Meas. 36, 1801–1825. doi: 10.1088/0967-3334/36/9/1801
Elgendi, M. (2012). On the analysis of fingertip photoplethysmogram signals. Curr. Cardiol. Rev. 8, 14–25. doi: 10.2174/157340312801215782
Franklin, B., Brook, R., and Arden Pope 3rd, C. (2015). Air pollution and cardiovascular disease. Curr. Problems Cardiol. 40, 207–238. doi: 10.1016/j.cpcardiol.2015.01.003
Goswami, D., Chaudhuri, K., and Mukherjee, J. (2010). A new two-pulse synthesis model for digital volume pulse signal analysis. Cardiovasc. Eng. 10, 109–117. doi: 10.1007/s10558-010-9098-8
Gren, L., Dierschke, K., Mattsson, F., Assarsson, E., Krais, A. M., Kåredal, M., et al. (2022). Lung function and self-rated symptoms in healthy volunteers after exposure to hydrotreated vegetable oil (hvo) exhaust with and without particles. Part. Fibre Toxicol. 19, 9. doi: 10.1186/s12989-021-00446-7
Hamanaka, R. B., and Mutlu, G. M. (2018). Particulate matter air pollution: effects on the cardiovascular system. Front. Endocrinol. 9:680. doi: 10.3389/fendo.2018.00680
Hemmingsen, J. G., Rissler, J., Lykkesfeldt, J., Sallsten, G., Kristiansen, J., P, P. M., et al. (2015). Controlled exposure to particulate matter from urban street air is associated with decreased vasodilation and heart rate variability in overweight and older adults. Part. Fibre Toxicol. 12, 6. doi: 10.1186/s12989-015-0081-9
Huotari, M., Vehkaoja, A., Määttä, K., and Kostamovaara, J. (2011). Photoplethysmography and its detailed pulse waveform analysis for arterial stiffness. Rakenteiden Mekaniikka (J. Struct. Mech.) 44, 345–362. Available online at: https://researchportal.tuni.fi/en/publications/photoplethysmography-and-its-detailed-pulse-waveform-analysis-for
Ichinose, F., Roberts, J. D. J., and Zapol, W. M. (2004). Inhaled nitric oxide: a selective pulmonary vasodilator: current uses and therapeutic potential. Circulation 109, 3106–3111. doi: 10.1161/01.CIR.0000134595.80170.62
Kelly, R. P., Millasseau, S. C., Ritter, J. M., and Chowienczyk, P. J. (2001). Vasoactive drugs influence aortic augmentation index independently of pulse-wave velocity in healthy men. Hypertension 37, 1429–1433. doi: 10.1161/01.hyp.37.6.1429
Kontaxis, S., Gil, E., Marozas, V., Lázaro, J., Garcíaa, E., de Miguel, M. P., et al. (2021). Photoplethysmographic waveform analysis for autonomic reactivity assessment in depression. IEEE Trans. Biomed. Eng. 68, 1273–1281. doi: 10.1109/TBME.2020.3025908
Krais, A., Essig, J., Gren, L., Vogs, C., Assarsson, E., Dierschke, K., et al. (2021). Biomarkers after controlled inhalation exposure to exhaust from hydrogenated vegetable oil (hvo). Int. J. Environ. Res. Public Health 18:6492.
Kuronen, M., Mikkonen, S., Aakko, P., and Murtonen, T. (2007). Hydrotreated vegetable oil as fuel for heavy duty diesel engines. Technical Report 724, SAE. Available online at: http://www.sae.org/technical/papers/2007-01-4031
Lagerholm, M., Peterson, C., Braccini, G., Edenbrandt, L., and Sornmo, L. (2000). Clustering ecg complexes using hermite functions and self-organizing maps. IEEE Trans. Biomed. Eng. 47, 838–848. doi: 10.1109/10.846677
Landrigan, P., Fuller, R., Acosta, N., Adeyi, O., Arnold, R., Baldé, A., et al. (2018). The lancet commission on pollution and health. Lancet 391, 462–512. doi: 10.1016/S0140-6736(17)32345-0
Landwehr, K. R., Larcombe, A. N., Reid, A., and Mullins, B. J. (2021). Critical review of diesel exhaust exposure health impact research relevant to occupational settings: are we controlling the wrong pollutants? Exposure Health 13, 141–171. doi: 10.1007/s12403-020-00379-0
Laurent, S., Cockcroft, J., Van Bortel, L., Boutouyrie, P., Giannattasio, C., Hayoz, D., Pannier, B., Vlachopoulos, C., Wilkinson, I., Struijker-Boudier, and Harry, o. b. o. t. E. N. f. N.-i. I. o. L. A. (2006). Expert consensus document on arterial stiffness: methodological issues and clinical applications. Eur. Heart J. 27, 2588–2605. doi: 10.1093/eurheartj/ehl254
Lázaro, J., Gil, E., Orini, M., Laguna, P., and Bailón, R. (2019). Baroreflex sensitivity measured by pulse photoplethysmography. Front. Neurosci. 13:339. doi: 10.3389/fnins.2019.00339
Lenters, V., Uiterwaal, C. S., Beelen, R., Bots, M. L., Fischer, P., Brunekreef, B., and Hoek, G. (2010). Long-term exposure to air pollution and vascular damage in young adults. Epidemiology 21, 512–520. doi: 10.1097/EDE.0b013e3181dec3a7
Levine, A. B., Punihaole, D., and Levine, T. B. (2012). Characterization of the role of nitric oxide and its clinical applications. Cardiology 122, 55–68. doi: 10.1159/000338150
Liu, C., Zheng, D., Murray, A., and Liu, C. (2013). Modeling carotid and radial artery pulse pressure waveforms by curve fitting with gaussian functions. Biomed. Signal Process. Control 8, 449–454. doi: 10.1016/j.bspc.2013.01.003
Lucking, A. J., Lundbäck, M., Barath, S. L., Mills, N. L., Sidhu, M. K., Langrish, J. P., et al. (2011). Particle traps prevent adverse vascular and prothrombotic effects of diesel engine exhaust inhalation in men. Circulation 123, 1721–1728. doi: 10.1161/CIRCULATIONAHA.110.987263
Lundbäck, M., Mills, N. L., Lucking, A., Barath, S., Donaldson, K., Newby, D. E., Sandström, T., and Blomberg, A. (2009). Experimental exposure to diesel exhaust increases arterial stiffness in man. Part. Fibre Toxicol. 6, 7. doi: 10.1186/1743-8977-6-7
Mehta, A. J., Zanobetti, A., Koutrakis, P., Mittleman, M. A., Sparrow, D., Vokonas, P., et al. (2014). Associations between short-term changes in air pollution and correlates of arterial stiffness: the veterans affairs normative aging study, 2007-2011. Am. J. Epidemiol. 179, 192–199. doi: 10.1093/aje/kwt271
Millasseau, S. C., Ritter, J. M., Takazawa, K., and Chowienczyk, P. J. (2006). Contour analysis of the photoplethysmographic pulse measured at the finger. J. Hypertension 24, 1449–1456. doi: 10.1097/01.hjh.0000239277.05068.87
Mills, N. L., Finlayson, A. E., Gonzalez, M. C., Törnqvist, H., Barath, S., Vink, E., et al. (2011a). Diesel exhaust inhalation does not affect heart rhythm or heart rate variability. Heart 97, 544–550. doi: 10.1136/hrt.2010.199042
Mills, N. L., Miller, M. R., Lucking, A. J., Beveridge, J., Flint, L., Boere, A., et al. (2011b). Combustion-derived nanoparticulate induces the adverse vascular effects of diesel exhaust inhalation. Eur. Heart J. 32, 2660–2671. doi: 10.1093/eurheartj/ehr195
Murtonen, T., Aakko-Saksa, P., Kuronen, M., Mikkonen, S., and Lehtoranta, K. (2010). Emissions with heavy-duty diesel engines and vehicles using FAME, HVO and GTL fuels with and without DOC+ POC aftertreatment. AE Int. J. Fuels Lubr. 2, 147–66. doi: 10.4271/2009-01-2693
Nardone, M., Floras, J. S., and Millar, P. J. (2020). Sympathetic neural modulation of arterial stiffness in humans. Am. J. Physiol. Heart Circ. Physiol. 319, H1338–H1346. doi: 10.1152/ajpheart.00734.2020
Pieters, N., Plusquin, M., Cox, B., Kicinski, M., Vangronsveld, J., and Nawrot, T. S. (2012). An epidemiological appraisal of the association between heart rate variability and particulate air pollution: a meta-analysis. Heart 98, 1127–1135. doi: 10.1136/heartjnl-2011-301505
Reşitoĝlu I. and K Altinişik K, K. A.. (2015). The pollutant emissions from diesel-engine vehicles and exhaust aftertreatment systems. Clean. Technol. Environ. Policy 17, 15–27. doi: 10.1007/s10098-014-0793-9
Rubins, U. (2008). Finger and ear photoplethysmogram waveform analysis by fitting with gaussians. Med. Biol. Eng. Comput. 46, 1271–1276. doi: 10.1007/s11517-008-0406-z
Sassi, R., Cerutti, S., Lombardi, F., Malik, M., Huikuri, H. V., Peng, C.-K., et al. (2015). Advances in heart rate variability signal analysis: joint position statement by the e-cardiology esc working group and the european heart rhythm association co-endorsed by the asia pacific heart rhythm society. Europace 17, 1341–1353. doi: 10.1093/europace/euv015
Scholten, R. H., Essig, Y. J., Roursgaard, M., Jensen, A., Krais, A. M., Gren, L., et al. (2021). Inhalation of hydrogenated vegetable oil combustion exhaust and genotoxicity responses in humans. Arch. Toxicol. 95, 3407–3416. doi: 10.1007/s00204-021-03143-8
Task Force (1996). Heart rate variability: standards of measurement, physiological interpretation and clinical use. Task Force of the european society of cardiology and the north american society of pacing and electrophysiology. Circulation 93, 1043–1065.
Unosson, J., Blomberg, A., Sandström, T., Muala, A., Boman, C., Nyström, R., et al. (2013). Exposure to wood smoke increases arterial stiffness and decreases heart rate variability in humans. Part. Fibre Toxicol. 10:20. doi: 10.1186/1743-8977-10-20
von Wowern, E., Östling, G., Nilsson, P. M., and Olofsson, P. (2015). Digital photoplethysmography for assessment of arterial stiffness: Repeatability and comparison with applanation tonometry. PLOS ONE 10:1–19. doi: 10.1371/journal.pone.0135659
Wang, L., Xu, L., Feng, S., Meng, M. Q. H., and Wang, K. (2013). Multi-gaussian fitting for pulse waveform using weighted least squares and multi-criteria decision making method. Comput. Biol. Med. 43, 1661–1672. doi: 10.1016/j.compbiomed.2013.08.004
Wu, C.-F., Shen, F.-H., Li, Y.-R., Tsao, T.-M., Tsai, M.-J., Chen, C.-C., et al. (2016). Association of short-term exposure to fine particulate matter and nitrogen dioxide with acute cardiovascular effects. Sci. Total Environ. 569–570, 300–305. doi: 10.1016/j.scitotenv.2016.06.084
Yu, B., Ichinose, F., Bloch, D. B., and Zapol, W. M. (2019). Inhaled nitric oxide. Brit. J. Pharmacol. 176, 246–255. doi: 10.1111/bph.14512
Zanoli, L., Lentini, P., Granata, A., Gaudio, A., Fatuzzo, P., Serafino, L., et al. (2017). A systematic review of arterial stiffness, wave reflection and air pollution. Mol. Med. Rep. 15, 3425–3429. doi: 10.3892/mmr.2017.6392
Keywords: pulse decomposition analysis, PPG (photoplethysmography), HRV (heart rate variability), pulse transit time (PTT), air pollution, chamber study, hydrotreated vegetable oil (HVO), biomedical signal processing
Citation: Marc-Derrien Y, Gren L, Dierschke K, Albin M, Gudmundsson A, Wierzbicka A and Sandberg F (2022) Acute Cardiovascular Effects of Hydrotreated Vegetable Oil Exhaust. Front. Physiol. 13:828311. doi: 10.3389/fphys.2022.828311
Received: 03 December 2021; Accepted: 27 January 2022;
Published: 08 March 2022.
Edited by:
Federico Formenti, King's College London, United KingdomReviewed by:
Matthew William Gorr, The Ohio State University, United StatesRichard Bruce, King's College London, United Kingdom
Copyright © 2022 Marc-Derrien, Gren, Dierschke, Albin, Gudmundsson, Wierzbicka and Sandberg. This is an open-access article distributed under the terms of the Creative Commons Attribution License (CC BY). The use, distribution or reproduction in other forums is permitted, provided the original author(s) and the copyright owner(s) are credited and that the original publication in this journal is cited, in accordance with accepted academic practice. No use, distribution or reproduction is permitted which does not comply with these terms.
*Correspondence: Frida Sandberg, ZnJpZGEuc2FuZGJlcmdAYm1lLmx0aC5zZQ==