
94% of researchers rate our articles as excellent or good
Learn more about the work of our research integrity team to safeguard the quality of each article we publish.
Find out more
ORIGINAL RESEARCH article
Front. Physiol., 31 March 2022
Sec. Gastrointestinal Sciences
Volume 13 - 2022 | https://doi.org/10.3389/fphys.2022.819606
This article is part of the Research TopicWomen in Gastrointestinal Sciences: 2021View all 10 articles
 Ivana R. Sequeira1,2*
 Wilson C. Yip1,2Louise W. W. Lu1,2Yannan Jiang3
 Rinki Murphy2,4,5,6
 Lindsay D. Plank7
 Garth J. S. Cooper4,8,9,10Carl N. Peters4,11
 Jun Lu12Kieren G. Hollingsworth13
 Sally D. Poppitt1,2,4,9
Objective: Prevalence of type 2 diabetes (T2D) is disproportionately higher in younger outwardly lean Asian Chinese compared to matched Caucasians. Susceptibility to T2D is hypothesised due to dysfunctional adipose tissue expansion resulting in adverse abdominal visceral and organ fat accumulation. Impact on early risk, particularly in individuals characterised by the thin-on-the-outside-fat-on-the-inside (TOFI) phenotype, is undetermined.
Methods: Sixty-eight women [34 Chinese, 34 Caucasian; 18–70 years; body mass index (BMI), 20–45 kg/m2] from the TOFI_Asia study underwent magnetic resonance imaging and spectroscopy to quantify visceral, pancreas, and liver fat. Total body fat was (TBF) assessed by dual-energy x-ray absorptiometry, and fasting blood biomarkers were measured. Ethnic comparisons, conducted using two-sample tests and multivariate regressions adjusted for age, % TBF and ethnicity, identified relationships between abdominal ectopic fat depots with fasting plasma glucose (FPG), insulin resistance (HOMA2-IR), and related metabolic clinical risk markers in all, and within ethnic groups.
Results: Despite being younger and of lower bodyweight, Chinese women in the cohort had similar BMI and % TBF compared to their Caucasian counterparts. Protective high-density lipoprotein cholesterol, total- and high-molecular weight adiponectin were significantly lower, while glucoregulatory glucagon-like peptide-1 and glucagon significantly higher, in Chinese. There were no ethnic differences between % pancreas fat and % liver fat. However, at low BMI, % pancreas and % liver fat were ∼1 and ∼2% higher in Chinese compared to Caucasian women. In all women, % pancreas and visceral adipose tissue had the strongest correlation with FPG, independent of age and % TBF. Percentage (%) pancreas fat and age positively contributed to variance in FPG, whereas % TBF, amylin and C-peptide contributed to IR which was 0.3 units higher in Chinese.
Conclusion: Pancreas fat accumulation may be an early adverse event, in TOFI individuals, with peptides highlighting pancreatic dysfunction as drivers of T2D susceptibility. Follow-up is warranted to explore causality.
Individuals with obesity have a 50- to 80-fold increased risk of type 2 diabetes (T2D) compared to those with lean bodyweight (Colditz et al., 1995). A decline in lean body mass and consequent increase in body fat often increases with age (Alva et al., 2017), accompanied by altered beta-cell function and insulin resistance (IR). Using body mass index (BMI) as a predictor, however, is shown to potentially misclassify both low BMI (Reilly et al., 2018) and, on occasion, younger (Ramachandran et al., 2012) individuals. Ethnicity is shown to be of importance since, at a fixed BMI, Chinese individuals are shown to have 3–5% higher total body fat (TBF) than Caucasians (Haldar et al., 2015).
Highlighted in large cohort studies (Lear et al., 2007; Nazare et al., 2012; Chen et al., 2018; Jo and Mainous, 2018), including in our recently published TOFI_Asia study (Sequeira et al., 2020), visceral adipose tissue (VAT) is an important factor that differs between these groups. In Chinese, typified by the thin-on-the-outside-fat-on-the-inside (TOFI) phenotype, even modest weight gain may differentially promote lipid deposition into VAT (Hocking et al., 2013) which is associated with increased hepatic IR (Tchernof and Després, 2013), and further promotes ectopic fat infiltration into key metabolic non-adipose tissue organs such as liver and pancreas (Rossi et al., 2011).
The need for phenotypic characterisation based on non-adipose ectopic fat is now recognised to be vital to understanding susceptibility to developing T2D (Neeland et al., 2019), particularly in TOFI individuals (Sequeira et al., 2020). Decreased levels of liver fat are associated with the normalisation of blood glucose (Lim et al., 2011; Nazare et al., 2012; Zhyzhneuskaya et al., 2018) with emerging evidence for the role of pancreas fat (Lim et al., 2011; Taylor et al., 2018). Some studies have reported increased pancreas fat in dysglycaemic individuals (Lingvay et al., 2009; Ou et al., 2013; Gaborit et al., 2014; Kim et al., 2014; Lim et al., 2014; Wang et al., 2014; Macauley et al., 2015; Steven et al., 2016) while others showed a negative correlation with beta-cell function (Tushuizen et al., 2007; Heni et al., 2010; Lim et al., 2011; Szczepaniak et al., 2012; Yokota et al., 2012; Nowotny et al., 2018) albeit as yet inconsistent in cohorts with prediabetes and diabetes (Tushuizen et al., 2007; Lê et al., 2011; van der Zijl et al., 2011). Discrepancies between pancreatic fat and beta-cell dysfunction may be in part due to methodological differences in pancreas fat assessment, in addition to variable glycaemic status in these early studies. A recent meta-analysis attempted to define an upper limit for pancreatic fat percentage, as weighted mean + 2 standard deviations (SDs), determined from pooled data from nine studies in 1,209 healthy individuals who underwent magnetic resonance imaging and spectroscopy (MRI/S) (Singh et al., 2017). A limitation of the recommended normal upper limit of 6.2% pancreas fat, as acknowledged by the authors, are the different methods and quantitative approaches used in the various MR studies which preclude comparisons.
An absence of published data on ectopic fat, particularly pancreatic fat, in different ethnicities, and its contribution to early dysglycaemia led us to undertake the current TOFI_Asia MR study. We hypothesised that fat deposition in non-adipose ectopic sites may be associated with the dysregulation of glucose, and IR, with Chinese participants potentially more susceptible to ectopic lipid infiltration when younger and at lower bodyweight than Caucasians. Furthermore, to identify clinical risk markers, and ectopic fat depots, that are associated with and predictive of fasting plasma glucose (FPG) and IR. Notably, while haemoglobin A1c (HbA1c) is a reliable marker of frank T2D, it has limited sensitivity and specificity for identifying prediabetes (Barry et al., 2017) and hence was not considered an outcome measure.
Ethical approval was received from the New Zealand Health and Disabilities Ethics Committee (16/STH/23) and all research, and study protocols, performed in accordance with Committee guidelines. The study is registered with the Australian New Zealand Clinical Trials Registry ACTRN12616000362493.
To avoid potential confounding due to gender differences in body composition, women (202; 108 Asian Chinese, 94 European Caucasian) from a larger mixed gender cohort the TOFI_Asia study (Sequeira et al., 2020), recruited in our clinic, were additionally invited for a MRI/S assessment of ectopic visceral, pancreas, and liver fat respectively. The TOFI_Asia cohort consisted of participants over a wide age and BMI range, of which a random cohort of 70 women (20–70 years, BMI 20–45 kg/m2) provided informed written consent to participate in the current MR sub-study (Figure 1). Women were normoglycaemic or had impaired fasting glucose (IFG), as defined by the American Diabetes Association (2018), self-reported healthy with no significant disease, no significant weight gain or loss (>10%) in previous 3 months, and no contraindications for MRI/S procedures. Imaging was successfully completed in 68 women (34 Chinese, 34 Caucasian). Two women were excluded due to acute claustrophobic episodes during MRI.
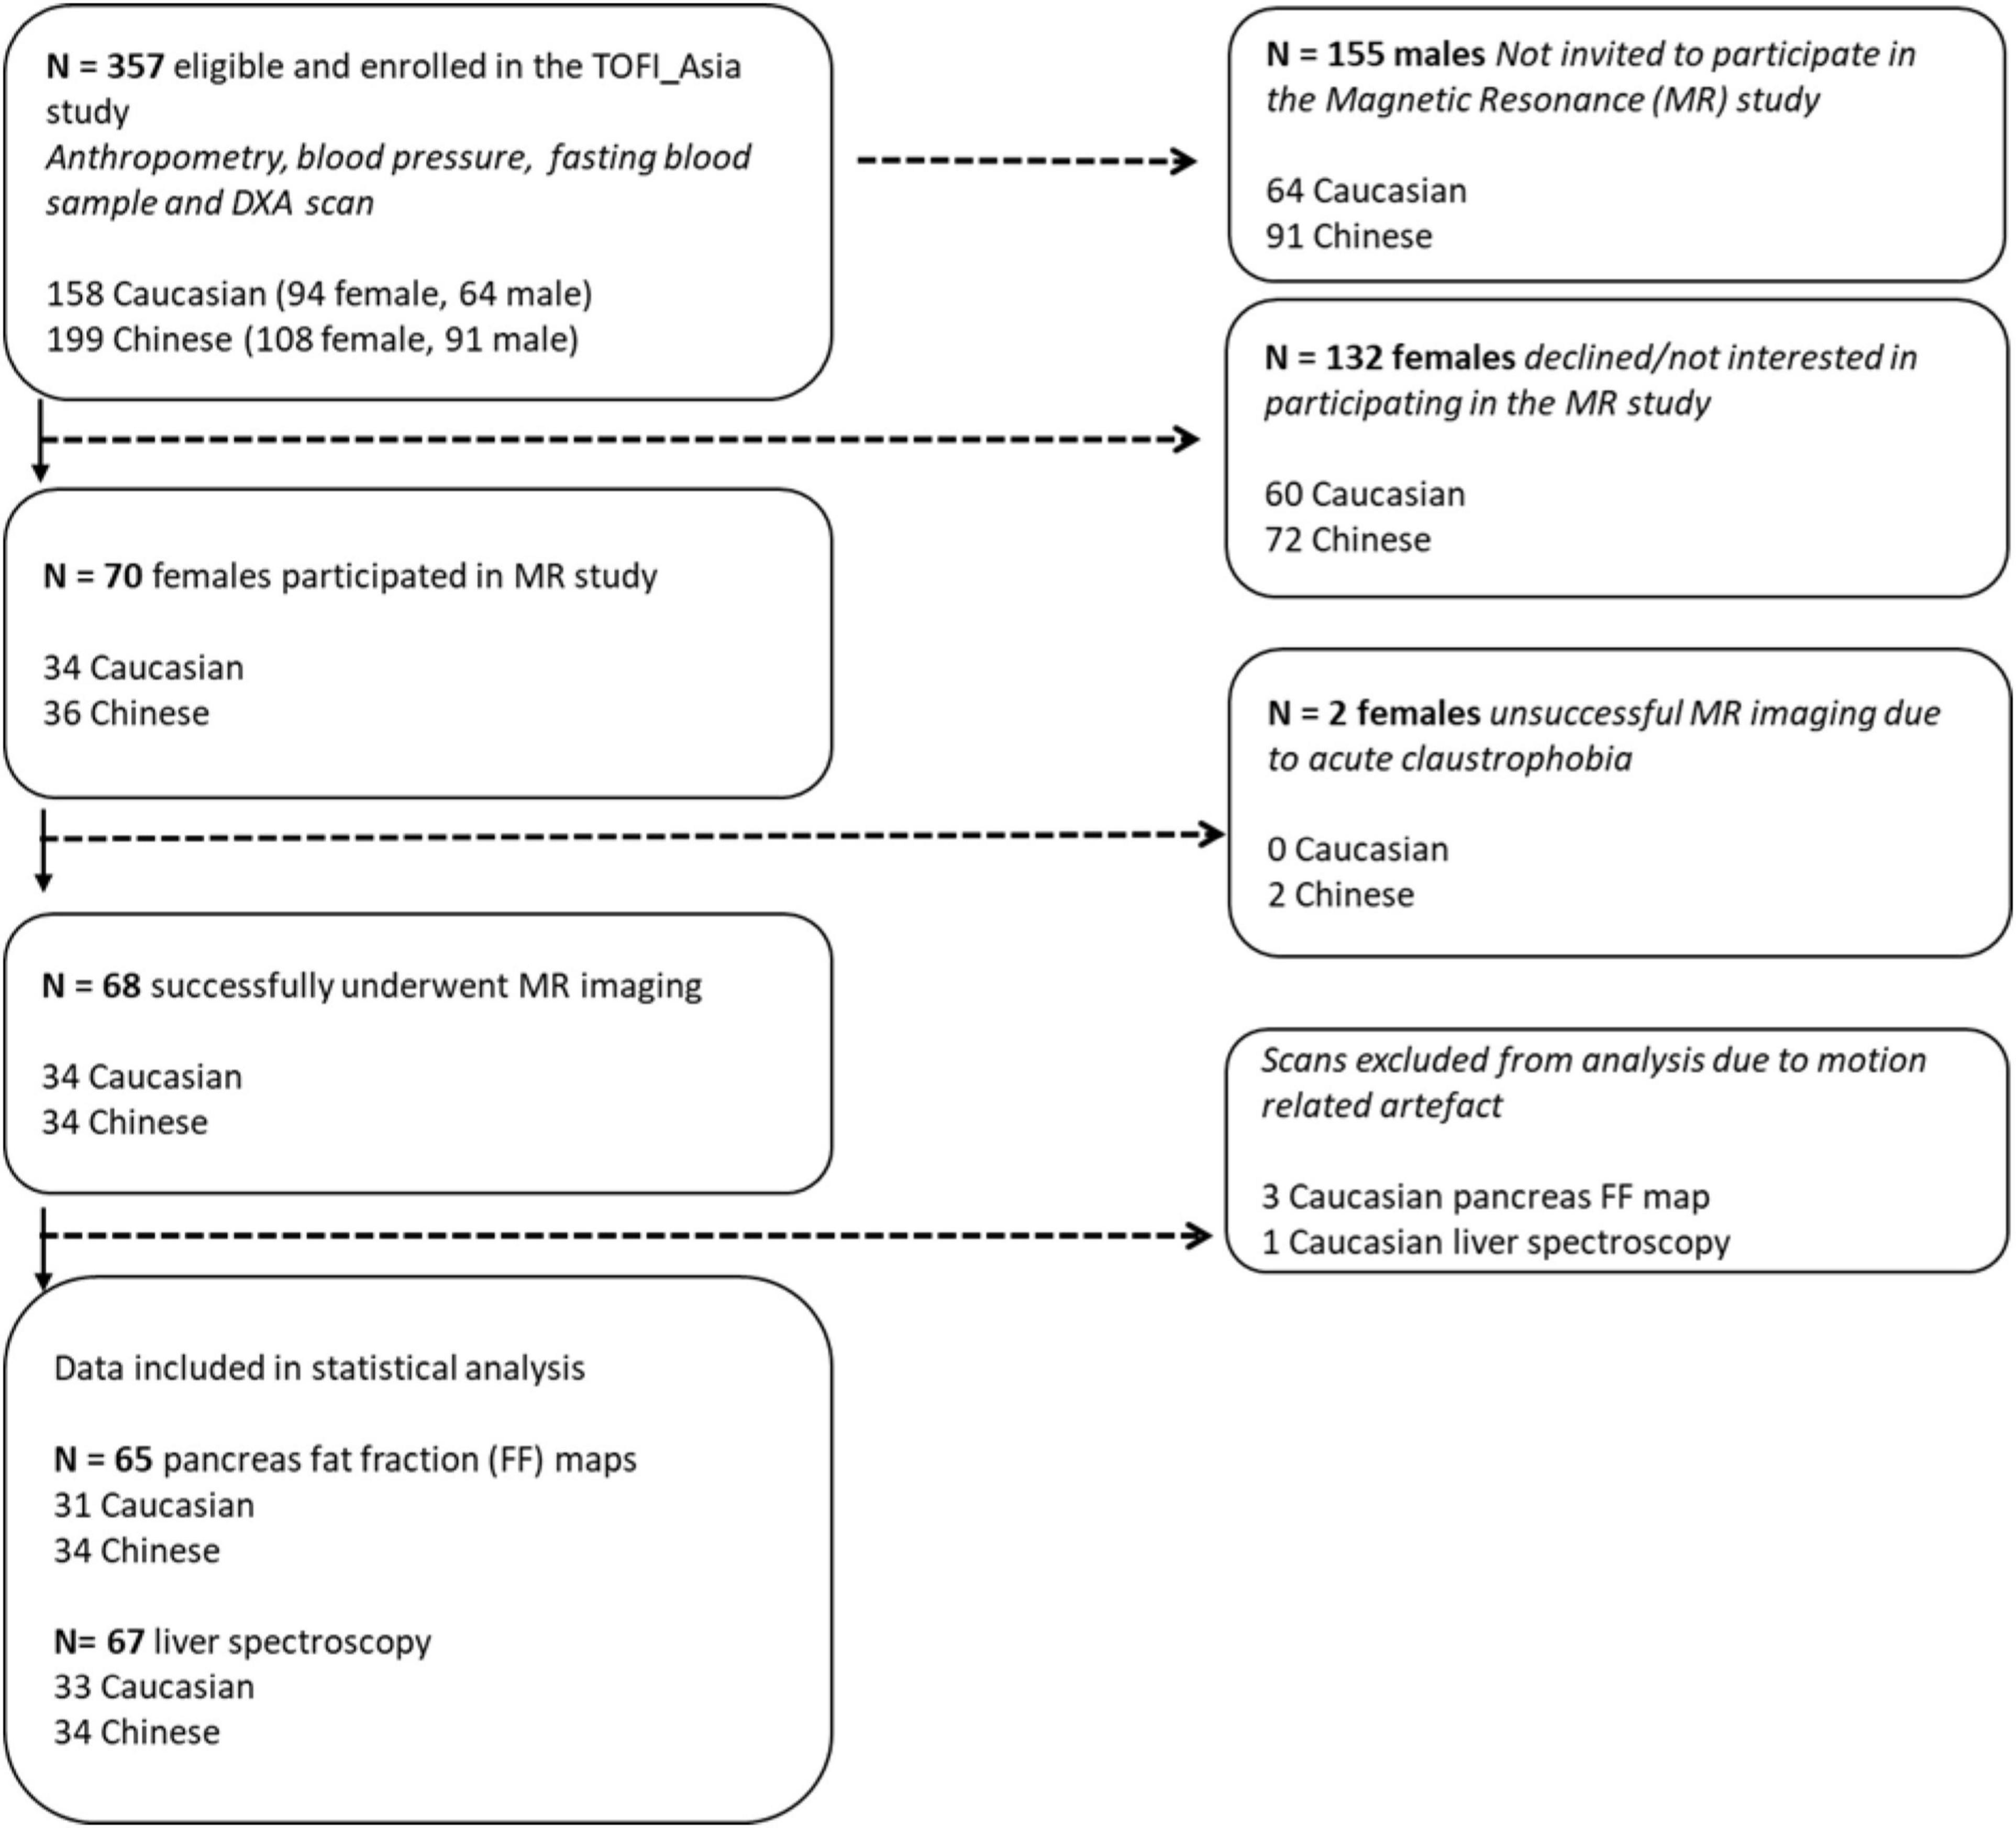
Figure 1. Flowchart illustrating enrolment and eligibility of 202 female participants from the TOFI_Asia study into the MR study. DXA, dual-energy X-ray absorptiometry.
All women attended the Human Nutrition Unit following an overnight fast. Bodyweight, height, waist/hip circumference, and blood pressure were recorded and fasted blood samples obtained as previously described (Sequeira et al., 2020). TBF was determined by dual-energy X-ray absorptiometry (DXA) (iDXA, GE Healthcare, Madison, WI, United States). MRI/S scans were conducted fasted within 1 week of clinical assessments using a 3T Magnetom Skyra scanner, VE 11A (Siemens, Germany). Instruction for adherence to scan protocol and imaging requirements, e.g., breath hold sequences, were given to minimise motion-related artefact.
Venous samples were centrifuged (Eppendorf, HH, Germany) at 1,300 × g for 10 min at 4°C with plasma and serum stored at −80°C until batch analyses. HbA1c was determined by capillary electrophoresis (Cap2FP, IDF, France), FPG by the hexokinase method, alanine amino transferase (ALT), aspartate amino transferase (AST), and alkaline phosphatase (ALP) by the International Federation of Clinical Chemistry methods, and gamma glutamyl transferase (GGT) by the Szasz method. Total cholesterol (TC) was analysed by cholesterol esterase/cholesterol oxidase/peroxidase method, triacylglycerol (TAG) by lipase/glycerol kinase method, high-density lipoprotein cholesterol (HDL-C) by detergent/cholesterol esterase/cholesterol oxidase/peroxidase method. Low-density lipoprotein cholesterol (LDL-C) was calculated using the Friedewald formula. Plasma insulin, C-peptide, glucagon, (total) amylin, gastric inhibitory peptide (GIP), and (total) glucagon-like peptide-1 (GLP-1) were analysed using MILLIPLEX MAP Human Metabolic Hormone Magnetic Bead Panel (Merck, HE, Germany). Intra- and inter-assay coefficients of variation (CV) for all analytes were <10 and <15%, respectively. Serum total- and high-molecular weight (HMW) adiponectin was measured by enzyme-linked immunosorbent assay (R&D Systems Quantikine kit, Bio-Techne, Minneapolis, MN, United States). IR, using the updated homeostasis model assessment of insulin resistance (HOMA2-IR), was determined by using the online HOMA Calculator (The University of Oxford 2013, Version 2.2.3).
Total body fat and lean (fat-free soft tissue) masses were obtained from a full body DXA scan with participants measured according to manufacturer’s standard protocols. DXA-percentage (%) TBF was calculated as 100 × TBF mass/(total body lean mass + TBF mass).
Fast sagittal localising images were acquired from diaphragm to pelvis, using respiratory gating to reduce motion artefacts. A 3D dual gradient-echo sequence (VIBE) was acquired to separate fat and water signals using a 2-point Dixon technique: repetition time/echo times/flip angle = 3.85 ms/1.27, 2.50 ms/9°. Three blocks (11 s breath hold each) of forty 5 mm axial slices using a field of view of 500 mm × 400 mm, matrix 320 × 256, were acquired to cover the abdominal cavity using partial Fourier and parallel imaging with total acceleration factor of 3.1. Following the abdominal scan, the pancreas was located and imaged using a higher resolution sequence, requiring a 11 s breath hold, to acquire fourteen 5 mm axial slices with repetition time/echo times/flip angle/signal averages = 5.82 ms/2.46, 3.69 ms/9°/1 with a field of view of 500 mm × 400 mm, matrix 512 × 410, using partial Fourier and parallel imaging with total acceleration factor of 2.8. MRS with respiratory-gated sequence determined liver fat content. Localiser images were obtained in the transverse, coronal, and sagittal planes and a voxel (2 × 2 × 2 cm3) placed in the right lobe of the liver, avoiding blood vessels and the biliary tree. MRS of the selected voxel was acquired using the stimulated-echo acquisition mode sequence with respiratory triggering; echo time: 20 ms, repetition time: 3,000 ms and mixing time: 33 ms, 1,024 data points collected with 50 averages. A water-suppressed spectrum with 50 averages was also recorded to detect weak lipid signals.
Custom Matlab R2017a software (The MathWorks, Inc., Natick, MA, United States) was used to separate the fat and water contributions of the abdominal MRI and construct a fat fraction (FF) map with noise bias correction at the L4–L5 intervertebral disc space. The single FF map was separated into MR-VAT and MR-subcutaneous adipose tissue (SAT) with Image J (Schneider et al., 2012), using the polygon tool to manually circumscribe contours around each region. The single slice MR abdominal adipose tissue (MR-AAT) measurement at the L4–L5 anatomical location is shown to be concordant with fat mass measured at all intervertebral spaces (Schweitzer et al., 2015; Linder et al., 2016). MRI analysis was conducted independently by two trained investigators, IS and WY. The intra-observer repeatability CV for MR-VAT and MR-SAT, conducted by IS calculated from 10% of total scans was 0.2 and 0.1%, respectively, while the inter-observer CV of all scans, between IS and WY, was 0.02 and 0.1%. Percentage (%) pancreas fat was determined by MR-opsy (Al-Mrabeh et al., 2017) with thresholding applied to eliminate potential inclusion of non-parenchymal tissue. Briefly, two candidate pancreas (5 mm each) FF maps were created from images in which the head, body, and tail of the pancreas were clearly visualised. Three regions of interest (ROIs) were placed in the head, body, and tail of each image, respectively, to estimate pancreas fat; thresholding (1–20%) was also applied to eliminate potential inclusion of non-parenchymal tissue within the selected ROI. Percentage pancreas fat was calculated as the average fat of both candidate pancreas FF images [39]. FF maps obtained from three Caucasian women contained artefact and were unable to be analysed, hence % pancreas fat was measured in 65 women. As conducted for MR-AAT compartments, the intra-observer repeatability % pancreas fat CV, from 10% of total scans, was 3.4% and the inter-observer CV was 2.4%. Pancreas volume (cm3) was determined as previously described (Macauley et al., 2015), and volume divided by body surface area, using the Dubois and Dubois method, to obtain pancreas volume index (PVI) which accounts for potential effect of anthropometry on measurements. Liver fat was calculated, using the SIVIC software (Crane et al., 2013), from area under the curve of water and fat peaks from non-water-suppressed spectra, corrected for T2-weighting according to previous literature values (Hamilton et al., 2011) and presented as percentage volume/volume from 67 women; the spectroscopy signal obtained from one Caucasian woman could not be analysed. Liver fat ≥5.6% was considered elevated, this cut off reported as the upper 95 percentile in healthy subjects that corresponds to ∼15% histological liver fat (Petäjä and Yki-Järvinen, 2016). There is no global comparable cut off for % pancreas fat, particularly since our pancreas imaging in this study has T1 weighting and will overestimate FF by a factor of approximately 1.4 (de Bazelaire et al., 2004). To internally compare % pancreas fat in our cohort of women we used an arbitrary 4.5% cut off.
Continuous variables are expressed as mean ± SD in the descriptive summary. Group comparisons were performed using two-sample tests with level of significance set at P < 0.05. The distribution of outcome measures (FPG and HOMA2-IR) was assessed and log-transformation was applied to non-normally distributed data if applicable. Relationships between the two outcome measures with MR-VAT (cm2), % pancreas and % liver fat were assessed using multiple linear regression models in all women and for each ethnic group separately. The models were adjusted for age and % TBF, as well as ethnicity in the total cohort. The interaction effect between ethnicity and the predictor of interest was tested in the models to assess ethnicity as a potential effect modifier. All MR quantified non-adipose tissue organ fat measurements were included in statistical analyses, as no outliers were detected. Of the two outcome variables, analyses were conducted on raw FPG data while HOMA2-IR was normalised using log-transformation due to skewed distribution. Univariate and multivariate regression analyses were conducted to identify clinical risk markers that predicted the difference in FPG and log HOMA2-IR. Associations between the clinical risk markers and FPG, and log HOMA2-IR, were each assessed using single predictor linear regression models, adjusted for ethnicity. Those clinical risk markers that showed statistical significance at P < 0.1 were included in stepwise multiple linear regression analyses using SAS version 9.4 (SAS Institute Inc., Cary, NC, United States). The software utilises a combination of backward and forward selection techniques to retain independent predictors that showed a significant effect (P < 0.05) to give a final prediction model with risk markers that predicted FPG, and log HOMA2-IR. Additionally, we also performed stepwise multiple linear regression and the least angle regression (LAR) models treating ethnicity as a potential predictor same as the clinical markers that showed statistical significance at P < 0.1 in the models. The results were cross-validated with the main analysis using ethnicity-adjusted stepwise regression models.
Mean age and BMI of the full cohort was 44.4 ± 14.5 years and 27.3 ± 4.4 kg/m2. The women were predominantly healthy and normoglycaemic, with 19% (n = 13) with IFG with an equal division of prediabetes between ethnicities (n = 7 Caucasian, n = 6 Chinese). Although significantly younger (P = 0.05), the Chinese women were of similar mean BMI to Caucasian (P > 0.05, Table 1) with lower mean bodyweight, height (both P < 0.001), waist (P = 0.05), and hip circumference (P = 0.002).
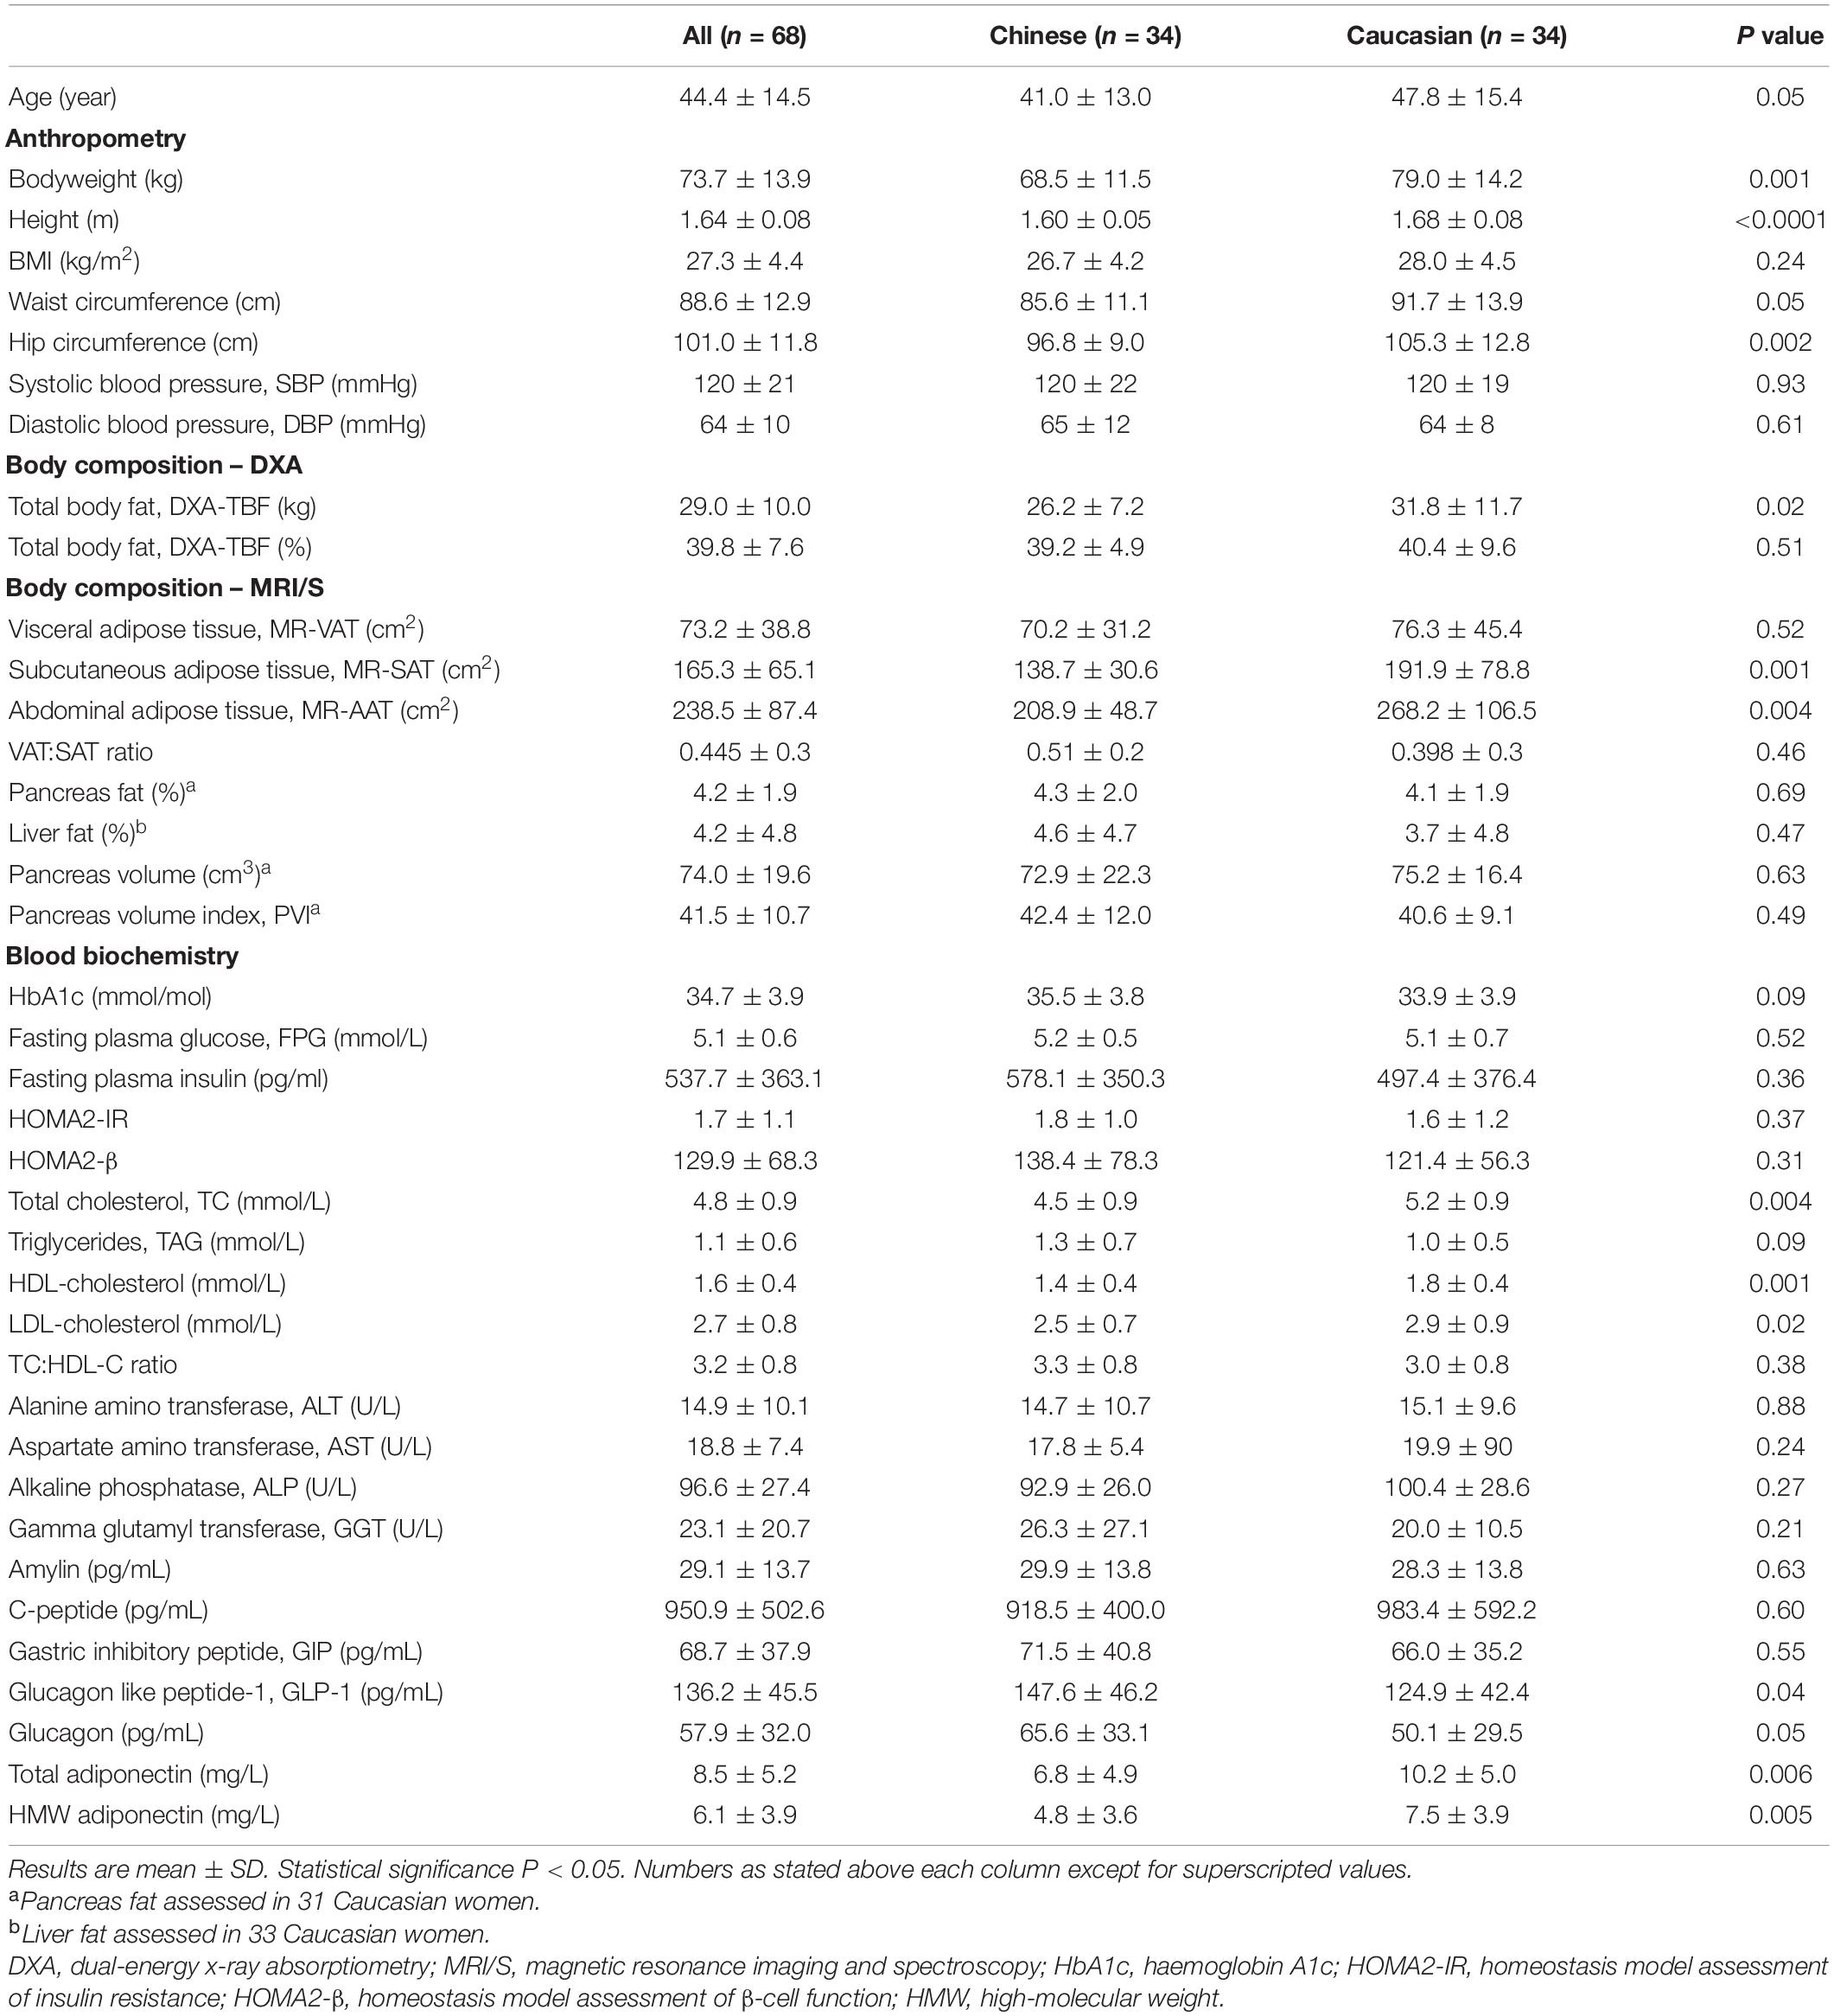
Table 1. Summary of metabolic risk factors of women enrolled in the TOFI_Asia MR study.
Mean DXA-% TBF was 39.8 ± 7.6% in the full cohort of women. In accordance with lower bodyweight and stature, DXA-assessed TBF mass (kg) was also significantly lower in Chinese (P = 0.02) but when normalised as % of total soft tissue mass there were no ethnic-specific differences in DXA-% TBF between the Chinese and Caucasian women (Table 1). While MR-assessed SAT (cm2) and MR-VAT (cm2) were again both numerically lower in these smaller stature Chinese women, notably this difference was highly significant for MR-SAT (P = 0.001, Figure 1) but not for MR-VAT (P > 0.05) which was not significantly different from the Caucasian subcohort. In turn, while mean MR-AAT (cm2) was again significantly lower (P = 0.004) in smaller stature Chinese than Caucasian women, there was greater contribution of VAT (34 vs. 28%) than SAT (66 vs. 72%) to the abdominal fat compartment in the Chinese subcohort (Figure 2).
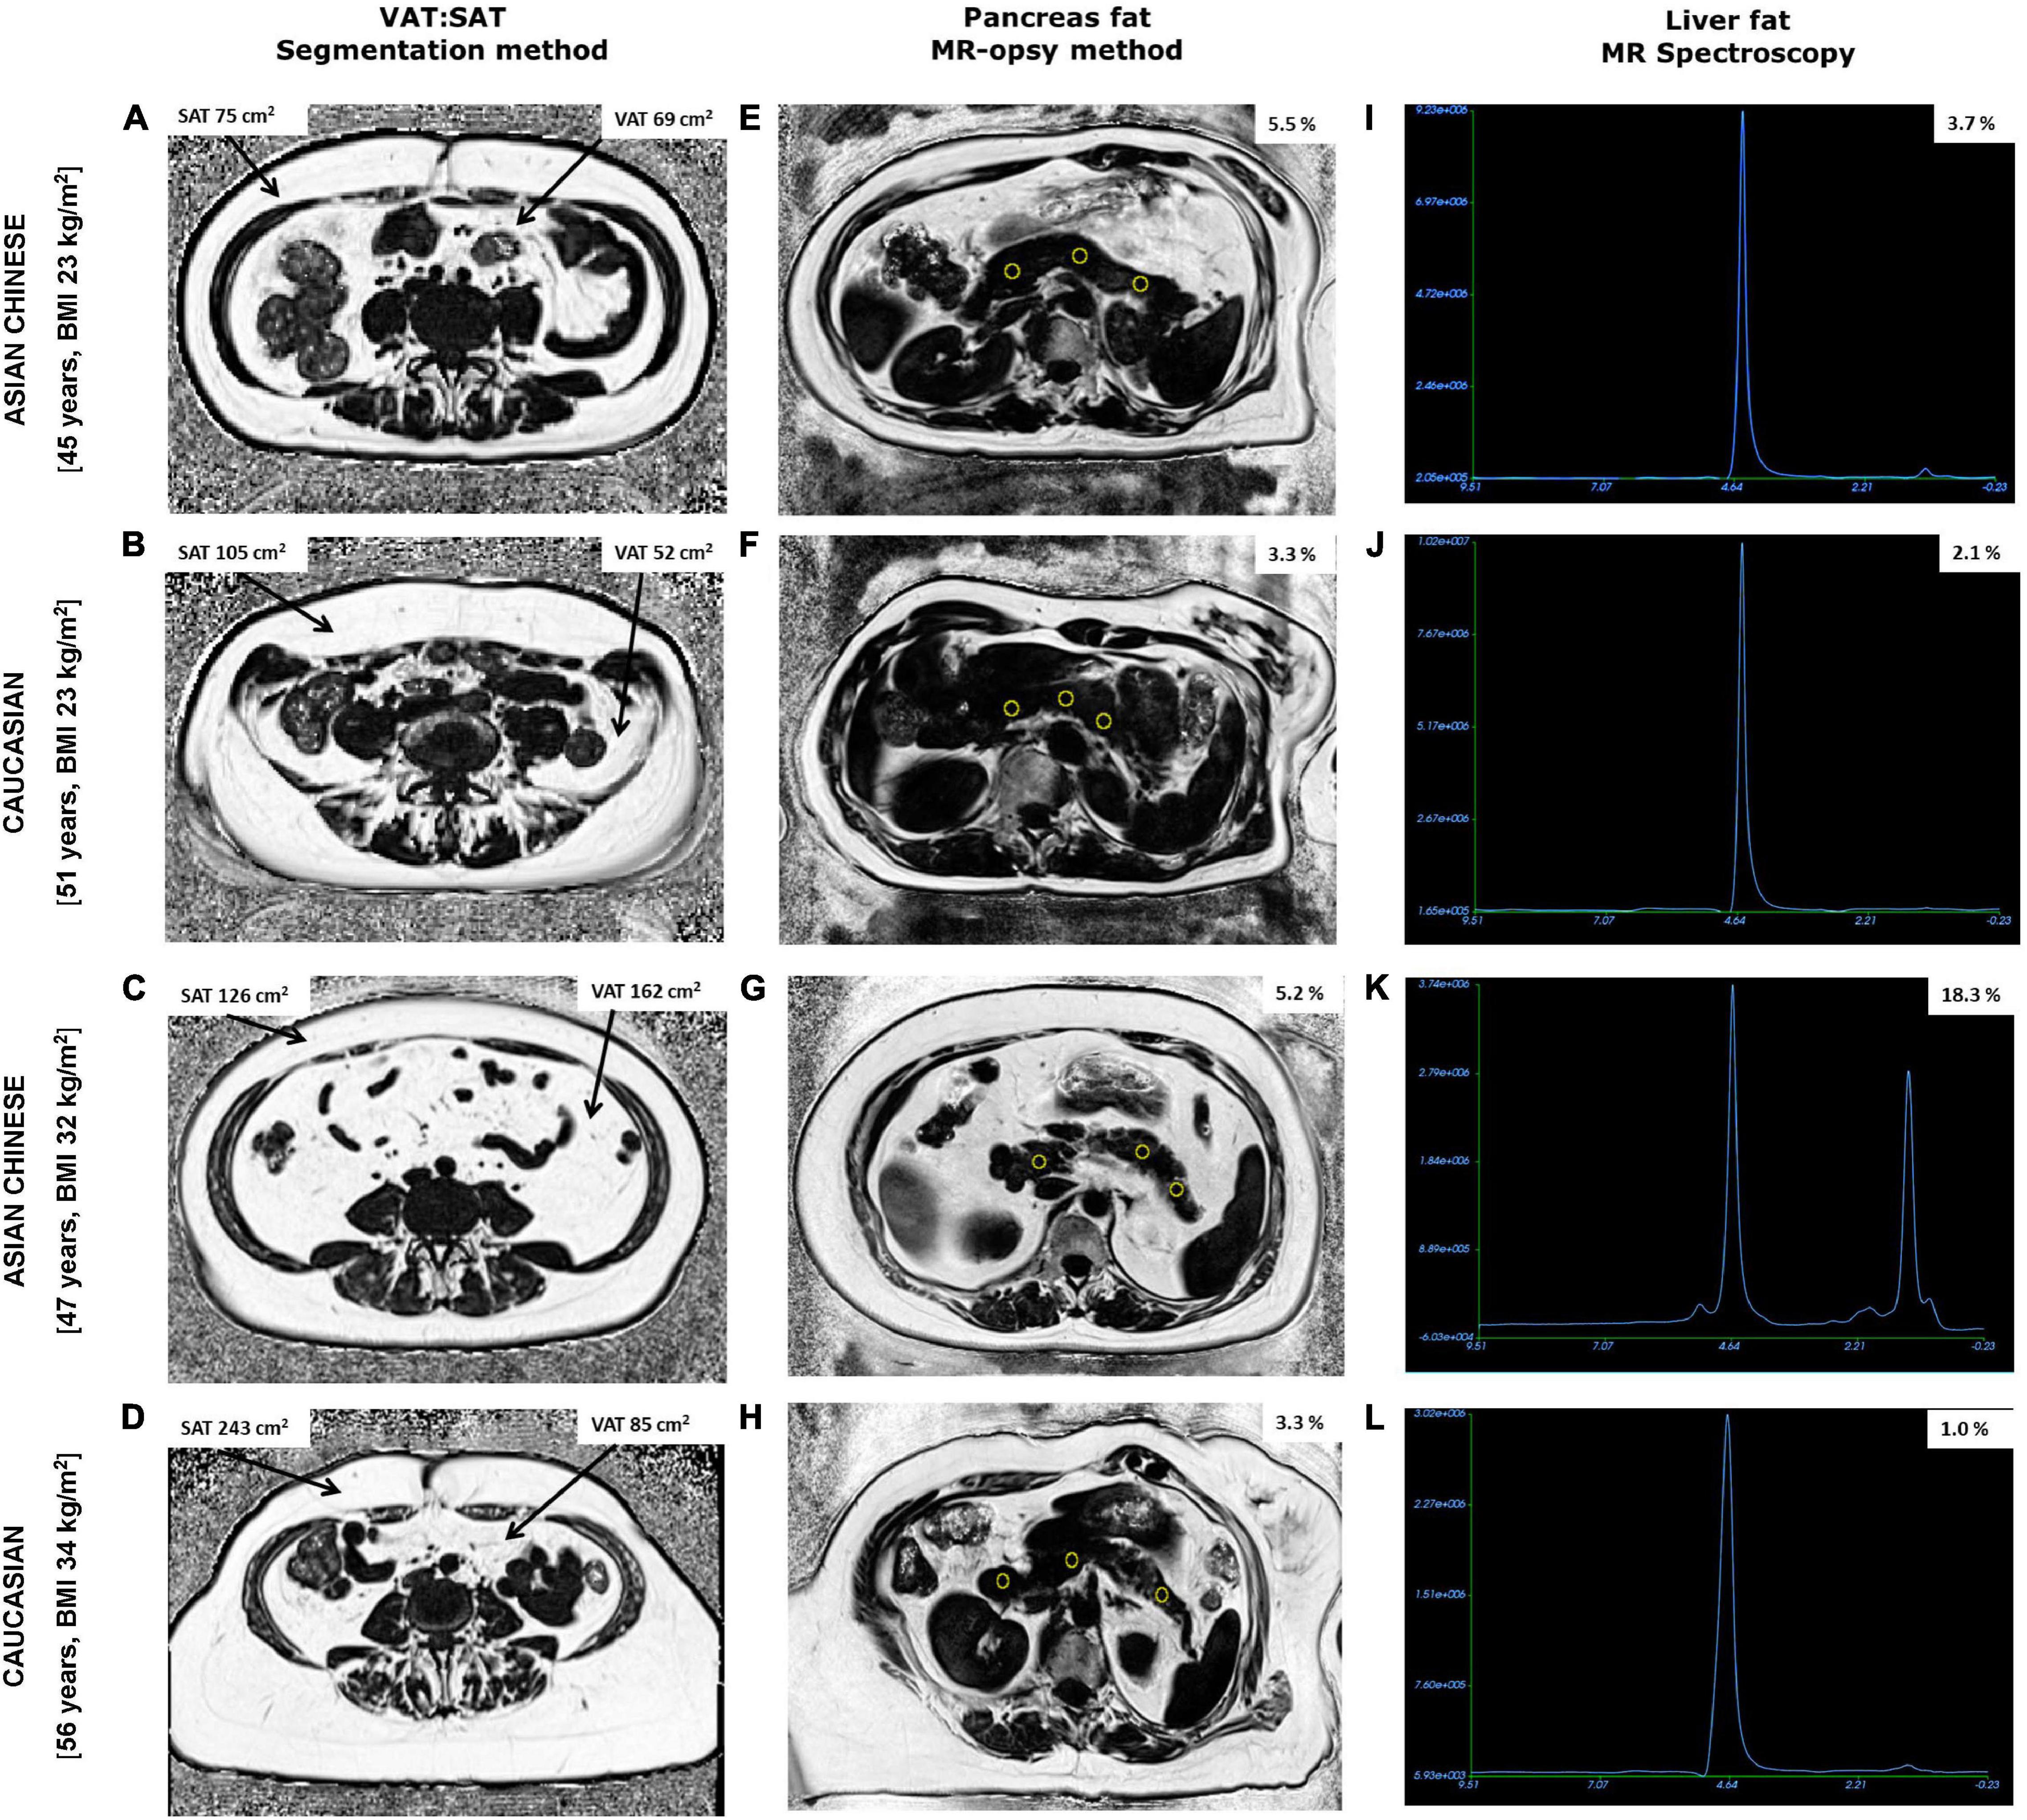
Figure 2. Fat fraction maps obtained from abdominal MRI scans showing subcutaneous (SAT), visceral adipose tissue (VAT), and pancreas fat along with MR spectroscopy of liver fat from two Chinese and two Caucasian women. Chinese women aged 45 years, BMI 23 kg/m2 (A,E,I) and 47 years, BMI 32 kg/m2 (C,G,K) had lower SAT and higher pancreas fat compared to older BMI matched Caucasian women aged 51 years, BMI 23 kg/m2 (B,F,J) and 56 years, BMI 34 kg/m2 (D,H,L), respectively. Notably, VAT, % pancreas and % liver fat were higher in both Chinese women compared with BMI matched Caucasian counterparts exhibiting the TOFI profile.
Mean MRI-assessed % pancreas fat (determined in 65 of 68 women) was 4.2 ± 1.9% (Table 1). Mean pancreas volume was 74.0 ± 19.6 cm3, and PVI was 41.5 ± 10.7. Notably, 39% (n = 25; mean age: 49 ± 12 years; BMI: 28.7 ± 4.4 kg/m2) of women were identified with pancreas fat above our chosen threshold of 4.5% with mean pancreas volume and PVI of 77.3 ± 18.6 cm3 and 41.5 ± 9.6, respectively. Similarly, mean MRS-assessed % liver fat (measured in 67 of 68 women) was lower than the 5.6% threshold (mean: 4.2 ± 4.8%, Table 1) with 22% (n = 15; mean age: 50.1 ± 13.0 years; BMI: 28.9 ± 3.6 kg/m2) of women identified with elevated liver fat.13% of women (n = 9, mean age: 52.8 ± 12.2 years; BMI: 29.4 ± 3.9 kg/m2) had both fatty liver and pancreatic fat above the chosen cut offs.
Comparisons of organ fat between the two ethnic groups showed no significant difference in mean % pancreas fat (P > 0.05, Table 1). However, linear regression (Supplementary Figure 1) revealed that at a fixed BMI in the lean range between 20 and 25 kg/m2 Chinese women had ∼1% higher predicted pancreas fat than their Caucasian counterparts (range: 3–3.5 vs. 1.8–2.7%). Notably, there were similar numbers of Chinese (n = 13) and Caucasian (n = 12) women with % pancreas fat above the chosen threshold, despite the Chinese subcohort being 2 BMI units lower (mean BMI: 27.9 ± 5.2 vs. 30.0 ± 3.3 kg/m2; P = 0.35) and 10 years younger (mean age: 44 ± 11 vs. 54 ± 12 years; P = 0.06) than Caucasian. Mean pancreas volume and mean PVI were not significantly different between ethnicities in the full cohort (Table 1). Also similarly, no difference in either pancreas volume (Chinese: 68.1 ± 20.5 cm3; Caucasian: 77.3 ± 18.6 cm3) or PVI (Chinese: 38.4 ± 9.6; Caucasian: 41.5 ± 9.6) was observed in Chinese and Caucasian women with pancreas fat above the chosen 4.5% threshold.
Again, while there was no significant difference in mean % liver fat between the two ethnicities, linear regression analysis showed, as for % pancreas fat, that at a fixed BMI in the lean range of between 20 and 25 kg/m2 (Supplementary Figure 1) Chinese women had ∼2% higher predicted liver fat than their Caucasian counterparts (range: 3–3.5 vs. 1.3–1.5%). Twice as many Chinese (n = 10) had elevated liver fat (Caucasian, n = 5), despite the Chinese subcohort being 3 BMI units lower (mean BMI: 27.9 ± 4.9 vs. 30.8 ± 3.5 kg/m2; P = 0.10) and 10 years younger (mean age: 44 ± 12 vs. 55 ± 12 years; P = 0.03) than their Caucasian counterparts.
Mean concentrations of all blood biochemical markers were within the normal range in the full cohort. However, TC (P = 0.004), LDL-C (P = 0.02), HDL-C (P = 0.001), total- (P = 0.006), and HMW adiponectin (P = 0.005) were significantly lower, while GLP-1 (P = 0.04) and glucagon (P = 0.05) were significantly higher, in Chinese compared to Caucasian women.
Associations between MR-VAT, % pancreas and % liver fat depots with FPG and log HOMA2-IR were strengthened by age and % TBF, and independent of ethnicity. The adjusted models showed that despite significant improvement in the relationships with addition of these covariates, the variance, i.e., beta coefficient, attributed to the depots themselves weakened to non-significance in the overall relationships (Table 2 and Supplementary Table 1). FPG was significantly and positively associated with MR-VAT (r = 0.47, P < 0.0001) and notably % pancreas fat (r = 0.46, P < 0.0001) in the full cohort, unlike % liver fat (r = 0.21, P = 0.09) (Supplementary Figure 2). While both MRI measurements had the strongest correlation with FPG, these relationships were strengthened when linear models were adjusted for age, % TBF and ethnicity (both, r = 0.54, P < 0.0001). Interestingly, it was age that explained the most significant variance in FPG in both the adjusted models. Although non-significant for MR-VAT (Table 2) the beta coefficient between % pancreas fat and FPG (Table 2) remained statistically significant in all women. The adjusted model improved the relationship between % liver fat with FPG (r = 0.54, P = 0.009) with the most significant independent predictors being age and % TBF in the full cohort (Supplementary Table 1). Again, the only significant positive relationship with log HOMA2-IR was observed in the full cohort with MR-VAT (r = 0.24, P = 0.05). Adjusted models, however, significantly improved relationships with IR and expectedly were mainly driven by % TBF (Supplementary Table 1).
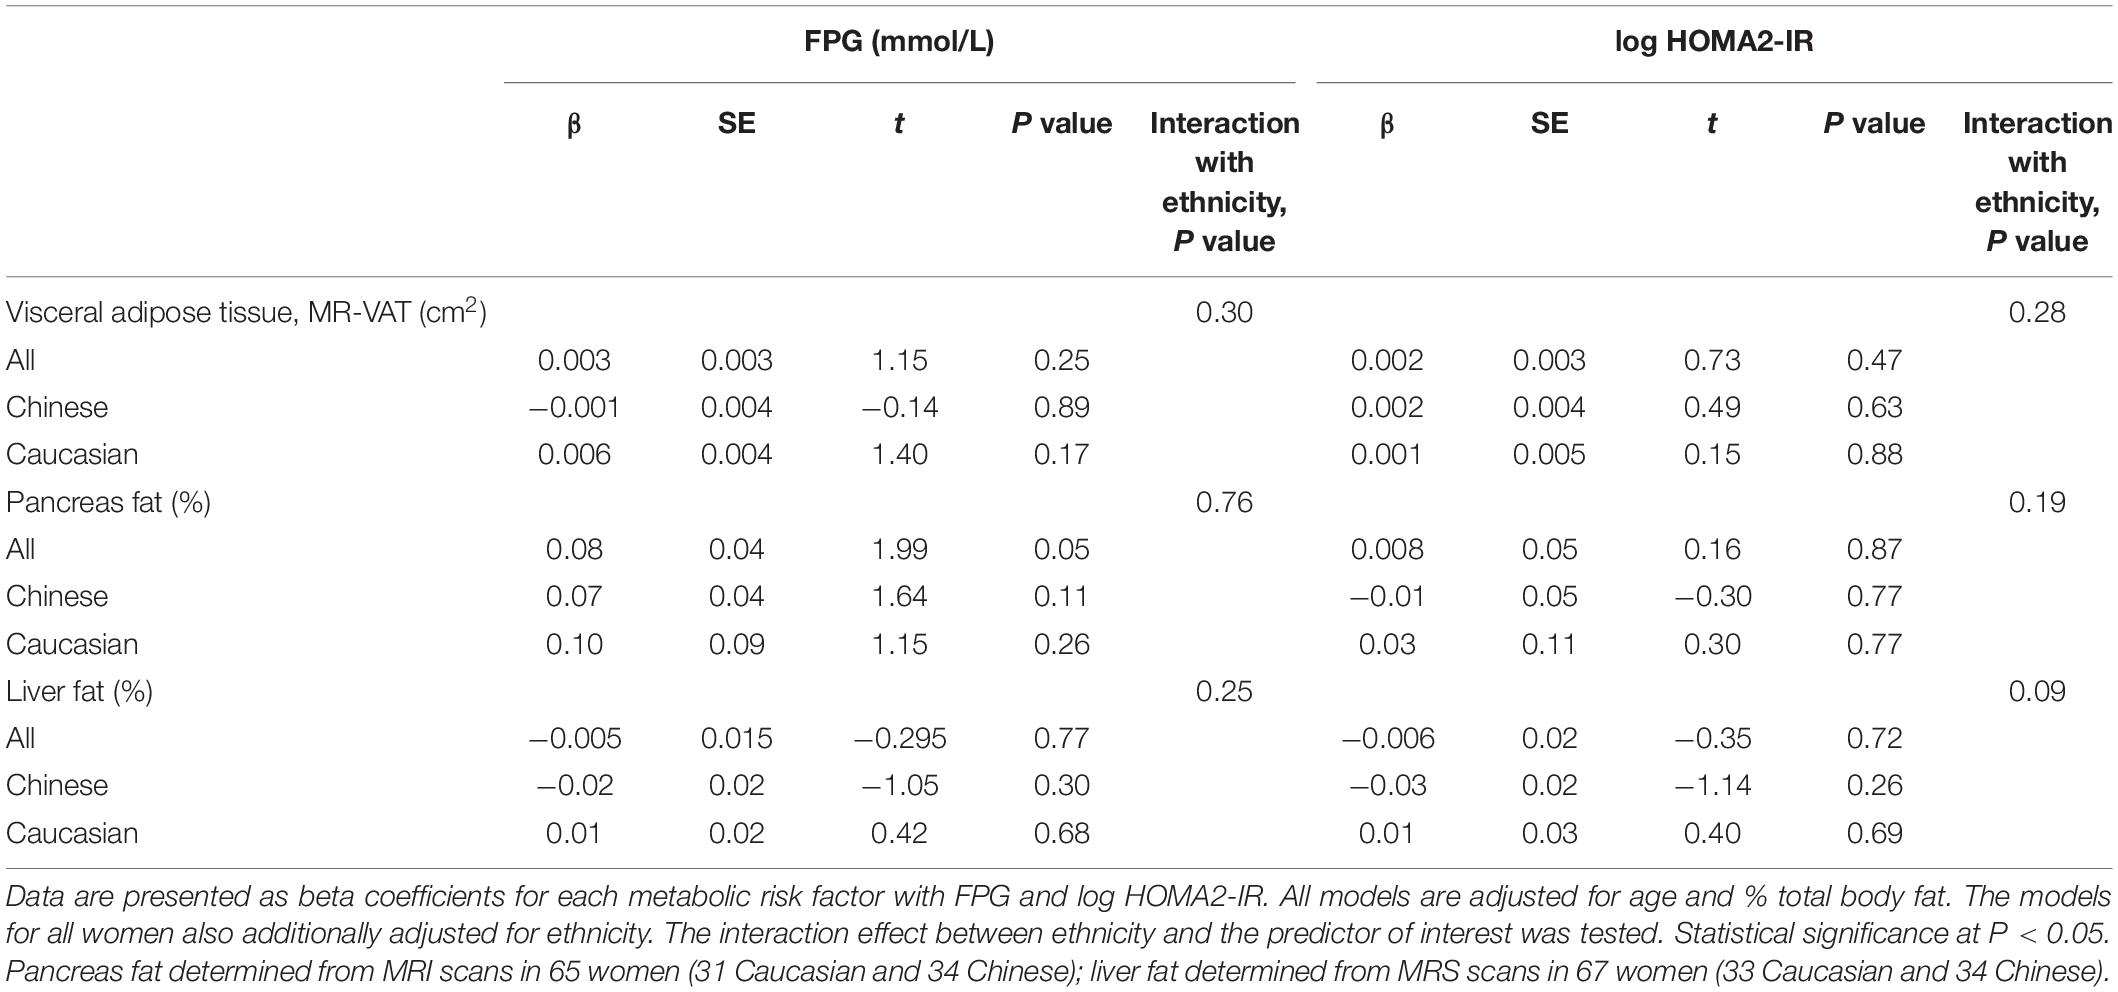
Table 2. Relationships between fasting plasma glucose, and insulin resistance (log HOMA2-IR) with visceral adipose tissue, pancreas, and liver fat in the MR cohort.
Of the clinical risk markers, age and % pancreas fat positively, while liver enzyme AST negatively, contributed to the variance in the model for predicting FPG (P < 0.0001) (Table 3, with all significant independent predictors Table 4). Notably, ethnicity did not contribute to the model (P = 0.20). On the contrary, ethnicity explained the greatest variance in the model for IR (log HOMA2-IR), which was higher in Chinese, followed by % TBF, amylin and C-peptide concentrations (P < 0.0001) (Table 3).
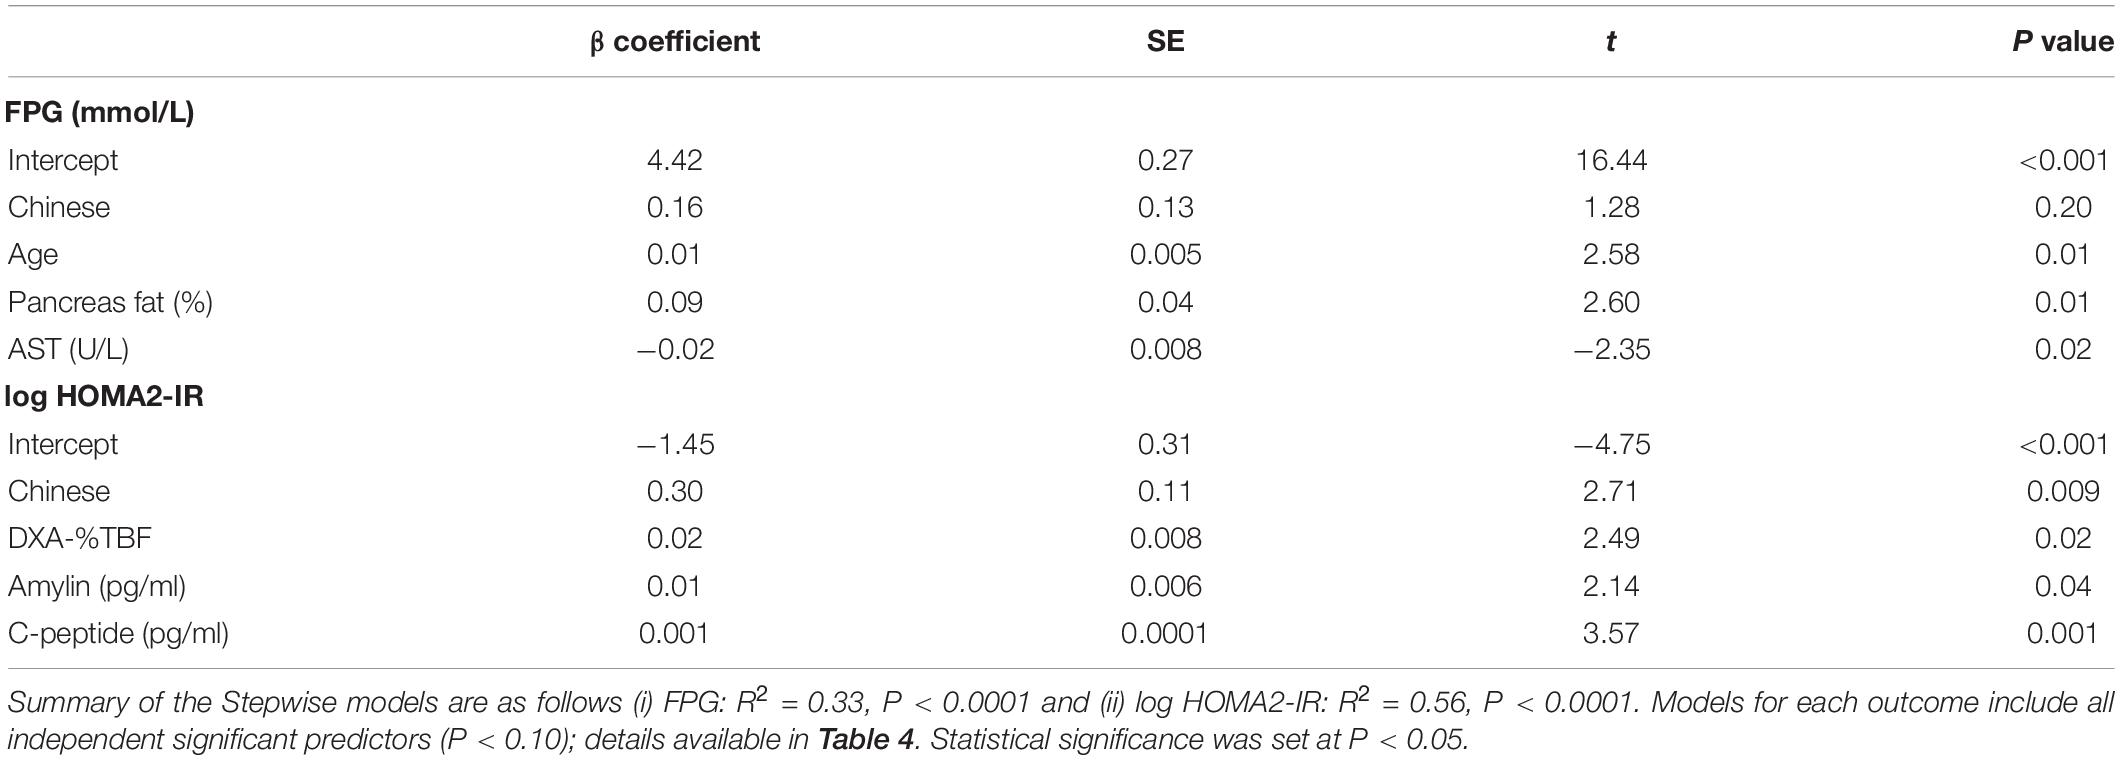
Table 3. Stepwise linear regression models, adjusted for ethnicity, with significant independent metabolic risk factors that predict (i) fasting plasma glucose and (ii) insulin resistance (log HOMA2-IR) in women (n = 68) from the MR study.
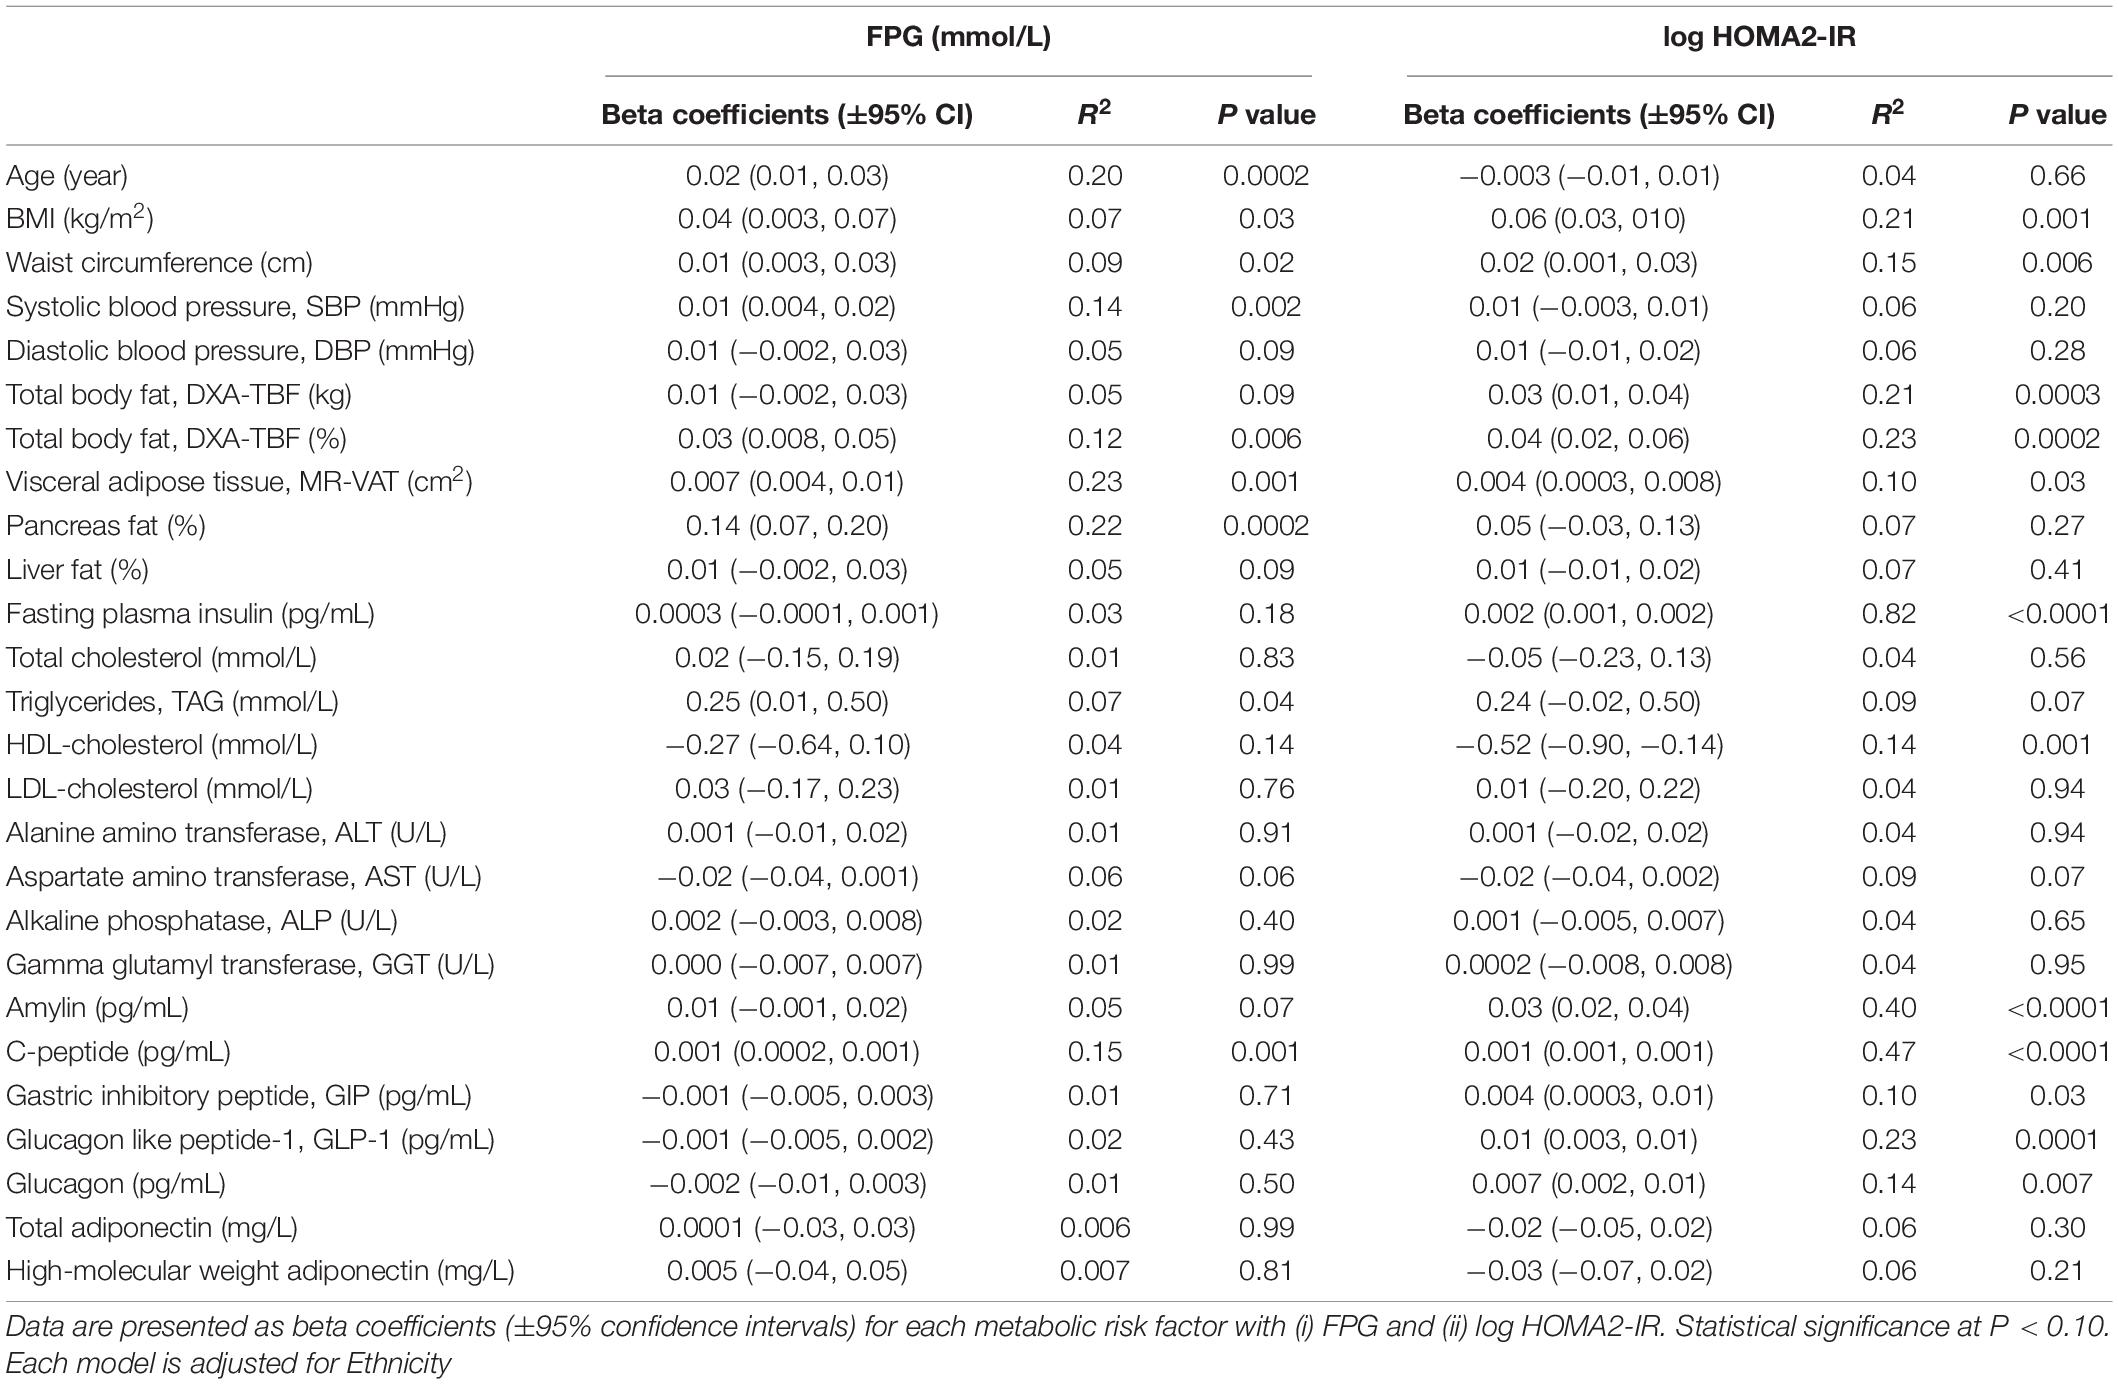
Table 4. Association between (i) fasting plasma glucose (FPG) and (ii) insulin resistance (calculated using HOMA2-IR) with individual metabolic risk factors in n = 68 women that underwent MR imaging using single predictor regression models.
In the TOFI_Asia MR cohort, comprising healthy and dysglycaemic Chinese and Caucasian women with similar BMI and % TBF, we show the importance of phenotypic characterisation of MRI/S quantified ectopic fat and highlight the need for early markers of T2D risk, aligning with and in accordance to the recent joint position statement from the International Atherosclerosis Society and the International Chair on Cardiometabolic Risk Working Group on Visceral Adiposity (Neeland et al., 2019). Multivariate analysis revealed MRI-assessed % pancreas fat as a positive predictor of increased FPG, and pancreatic glucoregulatory peptides amylin, that is involved in muscle glycogenolysis (Young et al., 1993), and C-peptide, a component of proinsulin, as predictors of IR. Additional linear relationships with non-adipose % pancreas fat suggest that it may be an early T2D risk marker, particularly in Chinese characterised by TOFI, which contributes to increased IR and/or declining beta-cell function to alter glucose metabolism and requires further investigation.
Recent studies have demonstrated ethnic variability in abdominal and visceral adiposity (Lear et al., 2007; Nazare et al., 2012; Chen et al., 2018), including the wider TOFI_Asia study (Sequeira et al., 2020), and shown increased risk of dysglycaemia associated with these compartments. Although accumulation of pancreas fat is postulated to result in damage to the beta-cell in preclinical studies (Lee et al., 2009), causal associations with beta-cell dysfunction, and glucose intolerance in humans remains to be established. The pancreas plays a key role in T2D, characterised by chronic hyperglycaemia in the context of IR and/or beta-cell dysfunction. Insulin secretion (IS) in response to a glucose challenge is complex and dependent not only on co-existing plasma glucose concentration but also beta-cell responsiveness to changing glucose levels and the rate of insulin clearance, both modulated by the prevailing IR (Del Prato et al., 2002). In IR, increased beta-cell response to glucose and reduced insulin clearance are adaptive mechanisms to maintenance normal glucose tolerance.
Previous work in dysglycaemic individuals, including Chinese and Caucasians, has reported increased pancreas fat (Lingvay et al., 2009; Ou et al., 2013; Gaborit et al., 2014; Kim et al., 2014; Lim et al., 2014; Wang et al., 2014; Macauley et al., 2015; Steven et al., 2016) and decreased beta-cell function (Tushuizen et al., 2007; Heni et al., 2010; Lim et al., 2011; Szczepaniak et al., 2012; Yokota et al., 2012). There are, however, inconsistent findings regarding the association between pancreatic fat and glucose metabolism (Tushuizen et al., 2007; Lê et al., 2011; van der Zijl et al., 2011), possibly due to varied methodologies in determination of pancreas fat and/or the heterogeneity in distribution of fat within the pancreas itself (Schwenzer et al., 2008; Lee et al., 2009; Smits and van Geenen, 2011) which often precludes comparisons between studies. In our current study we adopted the MR-opsy method (Al-Mrabeh et al., 2017), and though mean % pancreas fat was below the threshold adopted for internal comparisons between ethnicities in our cohort, a wide range was observed with pancreas fat an important predictor of FPG compared to the other adipose tissue compartments and liver. There were no ethnic differences observed in mean pancreas volume or index; however, the mean levels observed were concordant to those previously reported (Macauley et al., 2015) in healthy normoglycaemic individuals.
Furthermore, a significant association between FPG with pancreas and liver fat in the cohort was observed, notably with some participants with raised FPG (≥5.6 mmol/L) even when fat infiltration in these organs was low to possibly demonstrate that even small amounts of ectopic fat, likely representative of early stage deposition, may increase T2D susceptibility. Intrahepatic fat inhibits insulin suppression of hepatic glucose output to consequently result in increased basal IS, which exacerbates liver fat content and increases circulating plasma TAG concentration. Exposure of pancreatic beta-cells to excess fatty acids, derived from circulating and locally deposited TAG, inhibits glucose-mediated IS with consequent increase in plasma glucose. The degree of beta-cell decompensation is thought to occur based on a personal fat threshold which when exceeded exacerbates T2D risk (Taylor and Holman Rury, 2015).
Alongside % pancreas fat and age, lower concentration of AST predicted higher FPG in this MR study. Elevated liver function enzymes ALT and GGT, but not AST, have previously been associated with increased risk of T2D in meta-analyses (Fraser et al., 2009; Kunutsor et al., 2013). However, AST, like ALT, catalyses the transfer of amino groups to generate by-products during gluconeogenesis and amino acid metabolism, so it is not unexpected that lower concentrations may be associated with variable FPG. The concordance of findings reiterated in LAR and Stepwise regression analyses without ethnicity included in the model (Supplementary Tables 2A,B) additionally emphasises that % pancreas fat is indeed a strong predictor of FPG. Furthermore, significant variability in IR in the multiple regression models (also concordant with results from Supplementary Tables 2A,B) was explained by % TBF, pancreatic glucose regulating peptides amylin and C-peptide. While amylin decreases glucagon-stimulated hepatic glucose output, and shown to regulate muscle glycogenolysis, this does not occur during insulin-induced hypoglycaemic states (Aronoff et al., 2004). It is notable that the most significant contribution to variation in IR was ethnicity, with HOMA2 assessed IR greater by 0.3 units in the Chinese.
Phenotypic characterisation also revealed that Chinese women in the cohort although younger, and of lower bodyweight and stature, had similar BMI, % TBF, MR-VAT (cm2) and non-adipose tissue % pancreas and % liver fat than the Caucasian women. Conversely, abdominal SAT (cm2) was lower. Outwardly lean, low BMI Chinese women were also observed with greater propensity to TOFI than their lean Caucasian counterparts, with fixed BMI cut-points of 20 and 25 kg/m2 associated with greater pancreas fat and greater liver fat content in the Chinese subcohort. Also, lower protective circulating HDL-C and glucose regulating total- and HMW adiponectin were observed in Chinese than Caucasian women. Circulating peptides GLP-1 and glucagon, also involved in glucose regulation, were also higher. Although not possible to draw conclusions from this smaller cohort, it is important to highlight that some of the observed differences are in line with previous reports, in larger cohort studies, showing that Asians are at a greater risk of T2D than Caucasians due to differential fat partitioning (Lear et al., 2007; Lê et al., 2011; Nazare et al., 2012; Chen et al., 2018).
Strengths of our study include a healthy, primarily normoglycaemic, cohort from both ethnicities, in which we evaluated relationships between body fat compartments and ectopic lipid deposition in the absence of significant comorbidities. Pancreas fat determined by the MR-opsy method was averaged from the head, body, and tail of the pancreas to account for potential heterogeneity in fat distribution and was the most significant independent predictor of FPG in this cohort of women. In the absence of gold standard clamp technique to assess IR, the preferred HOMA2-IR method was used. Limitations include T1-weighting of the pancreas fat acquisition, which will overestimate the pancreatic fat, precluding direct comparison with other studies, however, they are internally consistent in comparing ethnicities. Causality cannot be confirmed from associations observed in this cross-sectional study and hence the authors are conducting longitudinal assessments in this cohort of women. Also, that these observations are from a single gender and may not be generalised to both genders due to likely gender-specific differences in energy substrate-utilisation patterns with dimorphism in glucose and fatty acid metabolism. Nonetheless, methodologies used for data collection and analyses are robust and validated.
De-identified data will be shared and made available upon reasonable request to the corresponding author and subject to an approved proposal and data access agreement.
The study was reviewed and approved by the New Zealand Health and Disabilities Ethics Committee (16/STH/23). The study is registered with the Australian New Zealand Clinical Trials Registry ACTRN12616000362493. All participants provided written informed consent to participate in this study.
IS: study design and supervision, participant recruitment, data analyses and interpretation, manuscript preparation, and corresponding author. WY and LL: study design, participant recruitment, and data collection. YJ: senior statistician and advisor, data curation, and formal analysis. RM: study design, study advisor, and critical revision of manuscript. LP: study design, supervision of body composition (DXA), and critical revision of manuscript. GC: study design and methodology and critical revision of manuscript. CP: advisor MR methodology, software, and supervision. JL: development of MRI/S scan protocols and MRS processing methods. KH: supervised and reviewed MRI post-scan analysis and critical revision of manuscript. SP: funding, PI on project, study design and supervision, critical revision of manuscript, and senior author. All authors approved of the final version of the manuscript.
This study was funded by the New Zealand National Science Challenge High Value Nutrition (NSC-HVN) Program, Ministry for Business, Innovation and Employment (MBIE, grant nos. 3710040 and 3716382).
The authors declare that the research was conducted in the absence of any commercial or financial relationships that could be construed as a potential conflict of interest.
All claims expressed in this article are solely those of the authors and do not necessarily represent those of their affiliated organizations, or those of the publisher, the editors and the reviewers. Any product that may be evaluated in this article, or claim that may be made by its manufacturer, is not guaranteed or endorsed by the publisher.
We thank Hong Liu, Shaoping Zhang, Greeshma Amarsingh, and James Chuang, from the School of Biological Sciences, The University of Auckland, for their analytical expertise in adiponectin and peptide assays, study participants for their involvement and the clinical research staff at the Human Nutrition Unit, Body Composition Unit and Centre for Advanced MRI for their care of the participants.
The Supplementary Material for this article can be found online at: https://www.frontiersin.org/articles/10.3389/fphys.2022.819606/full#supplementary-material
Al-Mrabeh, A., Hollingsworth, K. G., Steven, S., Tiniakos, D., and Taylor, R. (2017). Quantification of intrapancreatic fat in type 2 diabetes by MRI. PLoS one 12:e0174660. doi: 10.1371/journal.pone.0174660
Alva, M. L., Hoerger, T. J., Zhang, P., and Gregg, E. W. (2017). Identifying risk for type 2 diabetes in different age cohorts: does one size fit all? BMJ Open Diabetes Res. Care 5:e000447. doi: 10.1136/bmjdrc-2017-000447
American Diabetes Association (2018). Classification and diagnosis of diabetes: standards of medical care in diabetes – 2018. Diabetes Care 41, S13–S27. doi: 10.2337/dc18-S002
Aronoff, S. L., Berkowitz, K., Shreiner, B., and Want, L. (2004). Glucose metabolism and regulation: beyond insulin and glucagon. Diabetes Spectr. 17, 183–190.
Barry, E., Roberts, S., Oke, J., Vijayaraghavan, S., Normansell, R., and Greenhalgh, T. (2017). Efficacy and effectiveness of screen and treat policies in prevention of type 2 diabetes: systematic review and meta-analysis of screening tests and interventions. BMJ 356:6538. doi: 10.1136/bmj.i6538
Chen, P., Hou, X., Hu, G., Wei, L., Jiao, L., Wang, H., et al. (2018). Abdominal subcutaneous adipose tissue: a favorable adipose depot for diabetes? Cardiovasc. Diabetol. 17:93. doi: 10.1186/s12933-018-0734-8
Colditz, G. A., Willett, W. C., Rotnitzky, A., and Manson, J. E. (1995). Weight gain as a risk factor for clinical diabetes mellitus in women. Ann. Intern. Med. 122, 481–486. doi: 10.7326/0003-4819-122-7-199504010-00001
Crane, J. C., Olson, M. P., and Nelson, S. J. (2013). SIVIC: open-source, standards-based software for DICOM MR Spectroscopy workflows. Int. J. Biomed. Imaging 2013:12. doi: 10.1155/2013/169526
de Bazelaire, C. M., Duhamel, G. D., Rofsky, N. M., and Alsop, D. C. (2004). MR imaging relaxation times of abdominal and pelvic tissues measured in vivo at 3.0 T: preliminary results. Radiology 230, 652–659. doi: 10.1148/radiol.2303021331
Del Prato, S., Marchetti, P., and Bonadonna, R. C. (2002). Phasic insulin release and metabolic regulation in type 2 diabetes. Diabetes 51, S109–S116. doi: 10.2337/diabetes.51.2007.s109
Fraser, A., Harris, R., Sattar, N., Ebrahim, S., Davey Smith, G., and Lawlor, D. A. (2009). Alanine aminotransferase, gamma-glutamyltransferase, and incident diabetes: the British Women’s Heart and Health Study and meta-analysis. Diabetes Care 32, 741–750. doi: 10.2337/dc08-1870
Gaborit, B., Abdesselam, I., Kober, F., Jacquier, A., Ronsin, O., Emungania, O., et al. (2014). Ectopic fat storage in the pancreas using 1H-MRS: importance of diabetic status and modulation with bariatric surgery-induced weight loss. Int. J. Obesity 39:480. doi: 10.1038/ijo.2014.126
Haldar, S., Chia, S. C., and Henry, C. J. (2015). “Body composition in asians and caucasians: comparative analyses and influences on cardiometabolic outcomes,” in Advances in Food and Nutrition Research, ed. J. Henry (Cambridge, MA: Academic Press), 97–154. doi: 10.1016/bs.afnr.2015.07.001
Hamilton, G., Yokoo, T., Bydder, M., Cruite, I., Schroeder, M. E., Sirlin, C. B., et al. (2011). In vivo characterization of the liver fat 1H MR spectrum. NMR Biomed. 24, 784–790. doi: 10.1002/nbm.1622
Heni, M., Machann, J., Staiger, H., Schwenzer, N. F., Peter, A., Schick, F., et al. (2010). Pancreatic fat is negatively associated with insulin secretion in individuals with impaired fasting glucose and/or impaired glucose tolerance: a nuclear magnetic resonance study. Diabetes/Metab. Res. Rev. 26, 200–205. doi: 10.1002/dmrr.1073
Hocking, S., Samocha-Bonet, D., Milner, K.-L., Greenfield, J. R., and Chisholm, D. J. (2013). Adiposity and insulin resistance in humans: the role of the different tissue and cellular lipid depots. Endocrine Rev. 34, 463–500. doi: 10.1210/er.2012-1041
Jo, A., and Mainous, A. G. III (2018). Informational value of percent body fat with body mass index for the risk of abnormal blood glucose: a nationally representative cross-sectional study. BMJ Open 8:e019200. doi: 10.1136/bmjopen-2017-019200
Kim, S. Y., Kim, H., Cho, J. Y., Lim, S., Cha, K., Lee, K. H., et al. (2014). Quantitative assessment of pancreatic fat by using unenhanced CT: pathologic correlation and clinical implications. Radiology 271, 104–112. doi: 10.1148/radiol.13122883
Kunutsor, S. K., Apekey, T. A., and Walley, J. (2013). Liver aminotransferases and risk of incident type 2 diabetes: a systematic review and meta-analysis. Am. J. Epidemiol. 178, 159–171. doi: 10.1093/aje/kws469
Lê, K.-A., Ventura, E. E., Fisher, J. Q., Davis, J. N., Weigensberg, M. J., Punyanitya, M., et al. (2011). Ethnic differences in pancreatic fat accumulation and its relationship with other fat depots and inflammatory markers. Diabetes Care 34, 485–490. doi: 10.2337/dc10-0760
Lear, S. A., Humphries, K. H., Kohli, S., Chockalingam, A., Frohlich, J. J., and Birmingham, C. L. (2007). Visceral adipose tissue accumulation differs according to ethnic background: results of the Multicultural Community Health Assessment Trial (M-CHAT). Am. J. Clin. Nutr. 86, 353–359. doi: 10.1093/ajcn/86.2.353
Lee, Y., Lingvay, I., Szczepaniak, L. S., Ravazzola, M., Orci, L., and Unger, R. H. (2009). Pancreatic steatosis: harbinger of type 2 diabetes in obese rodents. Int. J. Obesity 34, 396–400. doi: 10.1038/ijo.2009.245
Lim, E. L., Hollingsworth, K. G., Aribisala, B. S., Chen, M. J., Mathers, J. C., and Taylor, R. (2011). Reversal of type 2 diabetes: normalisation of beta cell function in association with decreased pancreas and liver triacylglycerol. Diabetologia 54, 2506–2514. doi: 10.1007/s00125-011-2204-7
Lim, S., Bae, J. H., Chun, E. J., Kim, H., Kim, S. Y., Kim, K. M., et al. (2014). Differences in pancreatic volume, fat content, and fat density measured by multidetector-row computed tomography according to the duration of diabetes. Acta Diabetol. 51, 739–748. doi: 10.1007/s00592-014-0581-3
Linder, N., Schaudinn, A., Garnov, N., Blüher, M., Dietrich, A., Schütz, T., et al. (2016). Age and gender specific estimation of visceral adipose tissue amounts from radiological images in morbidly obese patients. Sci. Rep. 6:22261. doi: 10.1038/srep22261
Lingvay, I., Esser, V., Legendre, J. L., Price, A. L., Wertz, K. M., Adams-Huet, B., et al. (2009). Noninvasive quantification of pancreatic fat in humans. J. Clin. Endocrinol. Metab. 94, 4070–4076. doi: 10.1210/jc.2009-0584
Macauley, M., Percival, K., Thelwall, P. E., Hollingsworth, K. G., and Taylor, R. (2015). Altered volume, morphology and composition of the pancreas in type 2 diabetes. PLoS One 10:e0126825. doi: 10.1371/journal.pone.0126825
Nazare, J.-A., Smith, J. D., Borel, A.-L., Haffner, S. M., Balkau, B., Ross, R., et al. (2012). Ethnic influences on the relations between abdominal subcutaneous and visceral adiposity, liver fat, and cardiometabolic risk profile: the international Study of Prediction of Intra-Abdominal Adiposity and Its Relationship With Cardiometabolic Risk/Intra-Abdominal Adiposity. Am. J. Clin. Nutr. 96, 714–726. doi: 10.3945/ajcn.112.035758
Neeland, I. J., Ross, R., Després, J.-P., Matsuzawa, Y., Yamashita, S., Shai, I., et al. (2019). Visceral and ectopic fat, atherosclerosis, and cardiometabolic disease: a position statement. Lancet Diabetes Endocrinol. 7, 715–725. doi: 10.1016/S2213-8587(19)30084-1
Nowotny, B., Kahl, S., Klüppelholz, B., Hoffmann, B., Giani, G., Livingstone, R., et al. (2018). Circulating triacylglycerols but not pancreatic fat associate with insulin secretion in healthy humans. Metabolism 81, 113–125. doi: 10.1016/j.metabol.2017.12.005
Ou, H.-Y., Wang, C.-Y., Yang, Y.-C., Chen, M.-F., and Chang, C.-J. (2013). The association between nonalcoholic fatty pancreas disease and diabetes. PLoS One 8:e62561. doi: 10.1371/journal.pone.0062561
Petäjä, E. M., and Yki-Järvinen, H. (2016). Definitions of normal liver fat and the association of insulin sensitivity with acquired and genetic NAFLD – a systematic review. Int. J. Mol. Sci. 17:633. doi: 10.3390/ijms17050633
Ramachandran, A., Chamukuttan, S., Shetty, S. A., Arun, N., and Susairaj, P. (2012). Obesity in Asia – is it different from rest of the world. Diabetes Metab. Res. Rev. 28, 47–51. doi: 10.1002/dmrr.2353
Reilly, J. J., El-Hamdouchi, A., Diouf, A., Monyeki, A., and Somda, S. A. (2018). Determining the worldwide prevalence of obesity. Lancet 391, 1773– 1774.
Rossi, A. P., Fantin, F., Zamboni, G. A., Mazzali, G., Rinaldi, C. A., Del Giglio, M., et al. (2011). Predictors of ectopic fat accumulation in liver and pancreas in obese men and women. Obesity 19, 1747–1754. doi: 10.1038/oby.2011.114
Schneider, C. A., Rasband, W. S., and Eliceiri, K. W. (2012). NIH Image to ImageJ: 25 years of image analysis. Nat. Methods 9, 671–675. doi: 10.1038/nmeth.2089
Schweitzer, L., Geisler, C., Pourhassan, M., Braun, W., Glüer, C.-C., Bosy-Westphal, A., et al. (2015). What is the best reference site for a single MRI slice to assess whole-body skeletal muscle and adipose tissue volumes in healthy adults? Am. J. Clin. Nutr. 102, 58–65. doi: 10.3945/ajcn.115.111203
Schwenzer, N. F., Machann, J., Martirosian, P., Stefan, N., Schraml, C., Fritsche, A., et al. (2008). Quantification of pancreatic lipomatosis and liver steatosis by MRI: comparison of in/opposed-phase and spectral-spatial excitation techniques. Invest. Radiol. 43, 330–337. doi: 10.1097/RLI.0b013e31816a88c6
Sequeira, I. R., Yip, W., Lu, L., Jiang, Y., Murphy, R., Plank, L., et al. (2020). Visceral adiposity and glucoregulatory peptides are associated with susceptibility to type 2 diabetes: the TOFI_Asia study. Obesity 28, 2368–2378.
Singh, R. G., Yoon, H. D., Wu, L. M., Lu, J., Plank, L. D., and Petrov, M. S. (2017). Ectopic fat accumulation in the pancreas and its clinical relevance: a systematic review, meta-analysis, and meta-regression. Metab. Clin. Exp. 69, 1–13. doi: 10.1016/j.metabol.2016.12.012
Smits, M. M., and van Geenen, E. J. M. (2011). The clinical significance of pancreatic steatosis. Nat. Rev. Gastroenterol. Hepatol. 8, 169–177. doi: 10.1038/nrgastro.2011.4
Steven, S., Hollingsworth, K. G., Small, P. K., Woodcock, S. A., Pucci, A., Aribisala, B., et al. (2016). Weight loss decreases excess pancreatic triacylglycerol specifically in type 2 diabetes. Diabetes Care 39, 158–165. doi: 10.2337/dc15-0750
Szczepaniak, L. S., Victor, R. G., Mathur, R., Nelson, M. D., Szczepaniak, E. W., Tyer, N., et al. (2012). Pancreatic steatosis and its relationship to β-cell dysfunction in humans: racial and ethnic variations. Diabetes care 35, 2377–2383. doi: 10.2337/dc12-0701
Taylor, R., Al-Mrabeh, A., Zhyzhneuskaya, S., Peters, C., Barnes, A. C., Aribisala, B. S., et al. (2018). Remission of human type 2 diabetes requires decrease in liver and pancreas fat content but is dependent upon capacity for β cell recovery. Cell Metab. 28, 547–556.e543.
Taylor, R., and Holman Rury, R. (2015). Normal weight individuals who develop type 2 diabetes: the personal fat threshold. Clin. Sci. 128, 405–410. doi: 10.1042/CS20140553
Tchernof, A., and Després, J.-P. (2013). Pathophysiology of human visceral obesity: an update. Physiol. Rev. 93, 359–404. doi: 10.1152/physrev.00033.2011
Tushuizen, M. E., Bunck, M. C., Pouwels, P. J., Bontemps, S., van Waesberghe, J. H. T., Schindhelm, R. K., et al. (2007). Pancreatic fat content and β-cell function in men with and without type 2 diabetes. Diabetes Care 30, 2916–2921. doi: 10.2337/dc07-0326
van der Zijl, N. J., Goossens, G. H., Moors, C. C. M., van Raalte, D. H., Muskiet, M. H. A., Pouwels, P. J. W., et al. (2011). Ectopic fat storage in the pancreas, liver, and abdominal fat depots: impact on β-cell function in individuals with impaired glucose metabolism. J. Clin. Endocrinol. Metab. 96, 459–467. doi: 10.1210/jc.2010-1722
Wang, C.-Y., Ou, H.-Y., Chen, M.-F., Chang, T.-C., and Chang, C.-J. (2014). Enigmatic ectopic fat: prevalence of nonalcoholic fatty pancreas disease and its associated factors in a Chinese population. J. Am. Heart Assoc. 3:e000297. doi: 10.1161/JAHA.113.000297
Yokota, K., Fukushima, M., Takahashi, Y., Igaki, N., and Seino, S. (2012). Insulin secretion and computed tomography values of the pancreas in the early stage of the development of diabetes. J. Diabetes Invest. 3, 371–376. doi: 10.1111/j.2040-1124.2012.00212.x
Young, A. A., Cooper, G. J., Carlo, P., Rink, T. J., and Wang, M. W. (1993). Response to intravenous injections of amylin and glucagon in fasted, fed, and hypoglycemic rats. Am. J. Physiol. Endocrinol. Metab. 264, E943–E950. doi: 10.1152/ajpendo.1993.264.6.E943
Keywords: liver fat, pancreas fat, visceral adipose tissue, type 2 diabetes, magnetic resonance imaging and spectroscopy
Citation: Sequeira IR, Yip WC, Lu LWW, Jiang Y, Murphy R, Plank LD, Cooper GJS, Peters CN, Lu J, Hollingsworth KG and Poppitt SD (2022) Pancreas Fat, an Early Marker of Metabolic Risk? A Magnetic Resonance Study of Chinese and Caucasian Women: TOFI_Asia Study. Front. Physiol. 13:819606. doi: 10.3389/fphys.2022.819606
Received: 21 November 2021; Accepted: 17 February 2022;
Published: 31 March 2022.
Edited by:
Natalie Luhtala, Salk Institute for Biological Studies, United StatesReviewed by:
Dominik H. Pesta, German Aerospace Center (DLR), GermanyCopyright © 2022 Sequeira, Yip, Lu, Jiang, Murphy, Plank, Cooper, Peters, Lu, Hollingsworth and Poppitt. This is an open-access article distributed under the terms of the Creative Commons Attribution License (CC BY). The use, distribution or reproduction in other forums is permitted, provided the original author(s) and the copyright owner(s) are credited and that the original publication in this journal is cited, in accordance with accepted academic practice. No use, distribution or reproduction is permitted which does not comply with these terms.
*Correspondence: Ivana R. Sequeira, aS5zZXF1ZWlyYUBhdWNrbGFuZC5hYy5ueg==; orcid.org/0000-0001-5414-9925
Disclaimer: All claims expressed in this article are solely those of the authors and do not necessarily represent those of their affiliated organizations, or those of the publisher, the editors and the reviewers. Any product that may be evaluated in this article or claim that may be made by its manufacturer is not guaranteed or endorsed by the publisher.
Research integrity at Frontiers
Learn more about the work of our research integrity team to safeguard the quality of each article we publish.