
95% of researchers rate our articles as excellent or good
Learn more about the work of our research integrity team to safeguard the quality of each article we publish.
Find out more
ORIGINAL RESEARCH article
Front. Physiol. , 01 March 2022
Sec. Metabolic Physiology
Volume 13 - 2022 | https://doi.org/10.3389/fphys.2022.817542
This article is part of the Research Topic Hepatic Glucose and Lipid Metabolism View all 8 articles
 Xiaochen Yu†
 Ziyu Meng†Ting Fang†Xiaohuan LiuYing Cheng
 Linxin XuXiangyang LiuXiaoyu Li
 Mei XueTing Li
 Bei Sun*
 Liming Chen*
Increases in glucose production and decreases in hepatic glycogen storage induce glucose metabolic abnormalities in type 2 diabetes (T2DM). Empagliflozin, a sodium-dependent glucose transporter 2 (SGLT2) inhibitor, is an effective hypoglycemic drug; however, the effects of empagliflozin on hepatic gluconeogenesis and glycogenesis are still unclear. In this study, we investigated the effects and mechanisms of empagliflozin on hepatic gluconeogenesis and glycogenesis in vivo and in vitro. Empagliflozin was administered via gavage to db/db mice for 8 weeks, and human hepatocyte HL7702 cells were treated with empagliflozin after palmitic acid (PA) stimulation. Compared with the control db/db mice, empagliflozin-treated mice showed a significant reduction in urine glucose levels, blood glucose levels, body weight and intraperitoneal glucose tolerance test (IPGTT) blood glucose levels. Moreover, the expression levels and activities of key gluconeogenesis enzymes PEPCK and G6Pase were dramatically reduced in the empagliflozin-treated mice, and the protein expression levels of AMPK/CREB/GSK3β signalling pathway-related molecules were significantly changed. In HL7702 cells, empagliflozin ameliorated glucose production and PEPCK and G6Pase expression and activity. Empagliflozin could also prevent the decreases in glycogen content and regulate the protein expression levels of AMPK/CREB/GSK3β signalling pathway-related molecules. Then, we selected the AMPK agonist AICAR and inhibitor compound C to further verify the effects of the AMPK signalling pathway on hepatic gluconeogenesis and glycogen synthesis. The results of the 5-Aminoimidazole-4-carboxamide1-β-D-ribofuranoside (AIACR) intervention in HL7702 cells were consistent with those of empagliflozin treatment, and the effects of empagliflozin were abolished by compound C. In summary, empagliflozin could maintain glucose homoeostasis by reducing gluconeogenesis and increasing glycogenesis through the AMPK/CREB/GSK3β signalling pathway.
In recent years, the number of T2DM patients has increased rapidly worldwide. One of the major pathophysiological changes in T2DM is active endogenous glucose production (Kahn et al., 2014). Previous studies have indicated that insulin resistance influences insulin signal transduction and inhibits hepatic gluconeogenesis and glucose production (Schenk et al., 2008). Because of reduced insulin secretion and insulin resistance, hepatic glycogen synthesis is reduced in T2DM (Velho et al., 1996).
The liver plays an important role in maintaining the homeostasis of glucose uptake, decomposition, and storage as well as gluconeogenesis and glycogenolysis (Park et al., 2018). Hepatic glucose production accounts for approximately 90% of endogenous glucose production (Moore et al., 2012). After overnight fasting, most of the glucose released into the circulation originates from hepatic gluconeogenesis while approximately 20% of the glucose originates from renal gluconeogenesis (Alsahli and Gerich, 2017). Gluconeogenesis is mainly regulated by phosphoenolpyruvate carboxykinase (PEPCK) and glucose-6-phosphatase (G6Pase), which are both key enzymes in the process of gluconeogenesis. PEPCK and G6Pase are upregulated by glucagon during fasting but downregulated by insulin during hyperglycaemia (Wang et al., 2014).
AMP-activated protein kinase (AMPK) is an indispensable cellular energy sensor that is widely involved in the regulation of various physiological processes, including glucose and lipid metabolism, mitochondrial homeostasis and autophagy (Herzig and Shaw, 2018). AMPK is activated by phosphorylation of Thr172 in the alpha subunit, which then improves glucose homeostasis by inhibiting gluconeogenesis-related genes (Kim et al., 2008; Agius et al., 2020). Previous studies have demonstrated that phosphorylated AMPK induces an increase in the phosphorylation level of CREB-regulated transcription coactivator 2 (TORC2), which inhibits the activity of cAMP-responsive element binding protein (CREB) to decrease hepatic gluconeogenesis (Koo et al., 2005). Glycogen synthase kinase-3β (GSK3β) and glycogen synthase (GS) regulate glycogen synthesis (Basu et al., 2005). GS is a key enzyme for regulating the final step of glycogen synthesis, whose activity is regulated by GSK3β (Liu et al., 2015). Increased AMPK phosphorylation levels induce an increase in the phosphorylation level of GSK3β, which results in the inactivation of GSK3β and a higher expression level of GS and ultimately increases glycogen synthesis (Horike et al., 2008).
Sodium-dependent glucose transporter 2 inhibitors, including canagliflozin, dapagliflozin and empagliflozin, are effective hypoglycemic drugs. SGLT2 is a transporter with low affinity and high capacity, and it is mainly expressed in the renal proximal convoluted tubule S1 segment and responsible for reabsorbing glucose from renal tubular filtration fluid (Han et al., 2008). Previous studies have reported that the hypoglycaemic effect of SGLT2 inhibitors is independent of insulin, and they mainly depend on the reduction of renal glucose reabsorption to increase glycosuria reduction (Heerspink et al., 2018). In addition, SGLT2 inhibitors can also promote body weight loss and cardiovascular benefits (Xu et al., 2017; Li et al., 2019; Xue et al., 2019).
Recent studies have demonstrated that SGLT2 inhibitors can increase the phosphorylation level of AMPK in vivo (Zhou et al., 2018; Chiang et al., 2020). AMPK is activated through phosphorylation of Thr172 in the alpha subunit to maintain glucose homeostasis (Agius et al., 2020). However, the exact effects and molecular mechanism of SGLT2 inhibitors on hepatic gluconeogenesis are still unknown. In this study, we investigated the effects and molecular mechanism of empagliflozin on hepatic gluconeogenesis and glycogen synthesis in vivo and in vitro to more comprehensively demonstrate the pharmacological effects of empagliflozin.
The db/db mice was the BKS background. In the db/db mice, the leptin receptor was mutated to disrupt the leptin signalling pathway, which resulted in significant obesity and higher fasting blood glucose levels at 6 weeks with increased water intake and urine volume. When the mice were 8–12 weeks old, the above symptoms were the most obvious, which was also accompanied by diabetic nephropathy and other complications. As the control group, db/m mice were heterozygous mice in the same background without metabolic disorder symptoms. Six-week-old db/m and db/db male mice were obtained from the Model Animal Research Center of Nanjing University. Ad libitum access to water and chow was provided, and the mice were housed at a constant room temperature of 20 ± 2°C under a 12 h light/dark cycle in the Experimental Animal Center of Tianjin Medical University, Chu Hsien-I Memorial Hospital. After adjusting to the environment for 2 weeks, twelve db/db mice were randomly divided into two groups (n = 6 mice/group) and fed a normal diet. According to the equivalent dose conversion formula of pharmacological experimental animal body surface area, we calculated the equivalent doses for humans and mice. One group of db/db mice was gavaged with 3.8 mg/kg/d empagliflozin for 8 weeks, and the other group of mice was gavaged with the same volume of distilled water. As a control group, db/m mice were fed a normal diet. Urine glucose levels, blood glucose levels and body weights were measured every 2 weeks. IPGTT was performed in each group of mice after empagliflozin treatment. Blood samples from the mouse tail vein were measured by a glucose analyser (Roche ACCU-CHEK, Basel, Switzerland). Urine glucose levels were measured by electrode method with a routine urine analyser at the Department of Clinical Laboratory of Tianjin Medical University, Chu Hsien-I Memorial Hospital (Roche Cobas U411, Basel, Switzerland). After empagliflozin treatment for 8 weeks, the mice were sacrificed under anaesthesia with 5% isoflurane inhalation. Liver tissues and blood samples were collected for further study. Our animal experiments were approved by the Experimental Animals Ethics Committee of Tianjin Medical University, Chu Hsien-I Memorial Hospital and Tianjin Institute of Endocrinology.
The human liver normal cell line HL7702 was purchased from ATCC (Manassas, VA, United States). HL7702 cells were cultured in RPMI 1640 medium (Gibco, New York, NY, United States) supplemented with 10% FBS (ExCell Bio, Shanghai, China), 500 μL penicillin 10,000 U/mL and streptomycin 10,000 μU/mL in cell culture incubators at 37°C, 95% air and 5% CO2. In some experiments, HL7702 cells were treated with 8 μmol/L empagliflozin for 24 h. HL7702 cells were also treated with 0.75 mmol/L PA (Sigma-Aldrich, P9767, St. Louis, MO, United States) for 24 h (Gao et al., 2010; Fang et al., 2019). Cell viabilities were detected using a cell counting kit-8 (CCK8, Vazyme, A311-01, Nanjing, China) assay at 450 nm according to the instructions.
In the 5-Aminoimidazole-4-carboxamide1-b-D-ribofuranoside (AIACR) treatment experiment, HL7702 cells were divided into four groups: normal control group, PA intervention group, PA combination with empagliflozin intervention group, and PA combination with 10 μmol/L AIACR (MCE, HY-13417, Trenton, NJ, United States) intervention group. In the Compound C treatment experiment, HL7702 cells were divided into four groups: normal control group, PA intervention group, PA combination with empagliflozin intervention group, and PA combination with empagliflozin and 2 μmol/L Compound C (Sigma-Aldrich, 171261, St. Louis, MO, United States) intervention group.
Total RNA was isolated from liver tissues and cells by TRIzol Reagent (Invitrogen, 10296010, Carlsbad, CA, United States) and reverse transcribed into cDNA (Thermo Fisher Scientific, EP0442, Waltham, MA, United States). The primers were obtained from Tsing Ke Biological Technology (Beijing, China). RT-PCR was performed using a SYBR Green PCR reagent kit (Sangon Biotech, Shanghai, China) and the CFX Manager system (Bio-Rad, Berkeley, CA, United States). The relative expression levels of genes were normalised to β-actin. The primer sequences are listed in Supplementary Table 1.
Tissue and cell proteins were separated by 10% SDS/PAGE gels and then transferred to nitrocellulose membranes (BioTrace™ NT, New York City, NY, United States). After blocking with 5% skim milk, the membrane was incubated with primary antibodies at 4°C overnight. The antibodies are listed as follows: total-AMPK (Abcam, ab80039, 1:2000, Cambridge, United Kingdom), phospho-AMPK at Thr172 (Abcam, ab23875, 1:2000, Cambridge, United Kingdom), total-CREB (Abcam, ab32515, 1:2000, Cambridge, United Kingdom), phospho-CREB at Thr133 (Abcam, ab32096, 1:2000, Cambridge, United Kingdom), total-GSK3β (Proteintech, 22104-1-AP, 1:1000, Wuhan, China), phospho-GSK3β at Ser389 (Proteintech, 14850-1-AP, 1:1000, Wuhan, China), PEPCK (Proteintech, 16754-1-AP, 1:1000, Wuhan, China), G6PASE (Novus, NBP1-80533, 1:1000, Littleton, CO, United States), and β-actin (Bioworld, BS6007M, 1:4000, Minneapolis, MN, United States). Then, HRP-conjugated secondary antibody (Sungene Biotech, LK 2001, 1:5000, Tianjin, China) was incubated for 1 h at room temperature. Finally, the protein bands were developed by an ECL kit (Advansta, Menlo Park, CA, United States). The quantification of protein bands was analysed by ImageJ software.
Periodic acid-schiff staining was used to detect glycogen deposits in the liver. Mouse liver tissues were fixed with 4% paraformaldehyde, mounted in paraffin, and sectioned at 4 μm. Paraffin sections were dewaxed in xylene and alcohol, and then rinsed three times in water. The paraffin sections were placed in periodic acid solution at room temperature and rinsed once with water. The sections were placed in Schiff reagent in the dark under dry conditions at room temperature and then rinsed with water. The sections were dyed with hematoxylin for 3 min (Leagene Biotechnology, Beijing, China). A neutral gum seal was used to dry the sections for subsequent microscopic observation. HL7702 cells were fixed with 4% paraformaldehyde and then subjected to PAS staining as described above.
The cells were collected and then disrupted by ultrasonication. The glucose production of each group was detected by a glucose content test kit (Solarbio, BC2505, Beijing, China). Standardised values for total protein content were measured from whole cell extracts (Lin et al., 2009).
The PEPCK and G6Pase activities were measured by detecting the rates of NADH decline at 340 nm by enzyme activity assay kit (Cablebridge Biotechnology, MS3500 and MS3501, Shanghai, China) according to the manufacturer’s protocols (Perez-Mendoza et al., 2014).
GraphPad Prism 5.0 software was used to analyse the statistical data, which are shown as the means ± SD. We used one-way ANOVA followed by Bonferroni’s test for comparisons among three or more groups. P < 0.05 was considered statistically significant.
Compared with db/db mice, the level of urinary glucose excretion was significantly increased after empagliflozin treatment (Li et al., 2021; Supplementary Figure 1A). The blood glucose level of Empa-treated mice was lower than that of db/db mice (Li et al., 2021; Supplementary Figure 1B). A decrease in the overall body weight of the Empa-treated group was observed compared with the db/db group (Figure 1A). In the IPGTT experiment, the blood glucose levels of the Empa-treated mice were significantly decreased at 0, 15, 30, 60, and 120 min relative to the db/db mice (Figure 1B). These results indicated that urinary glucose excretion, blood glucose levels and body weight could be significantly reduced by empagliflozin.
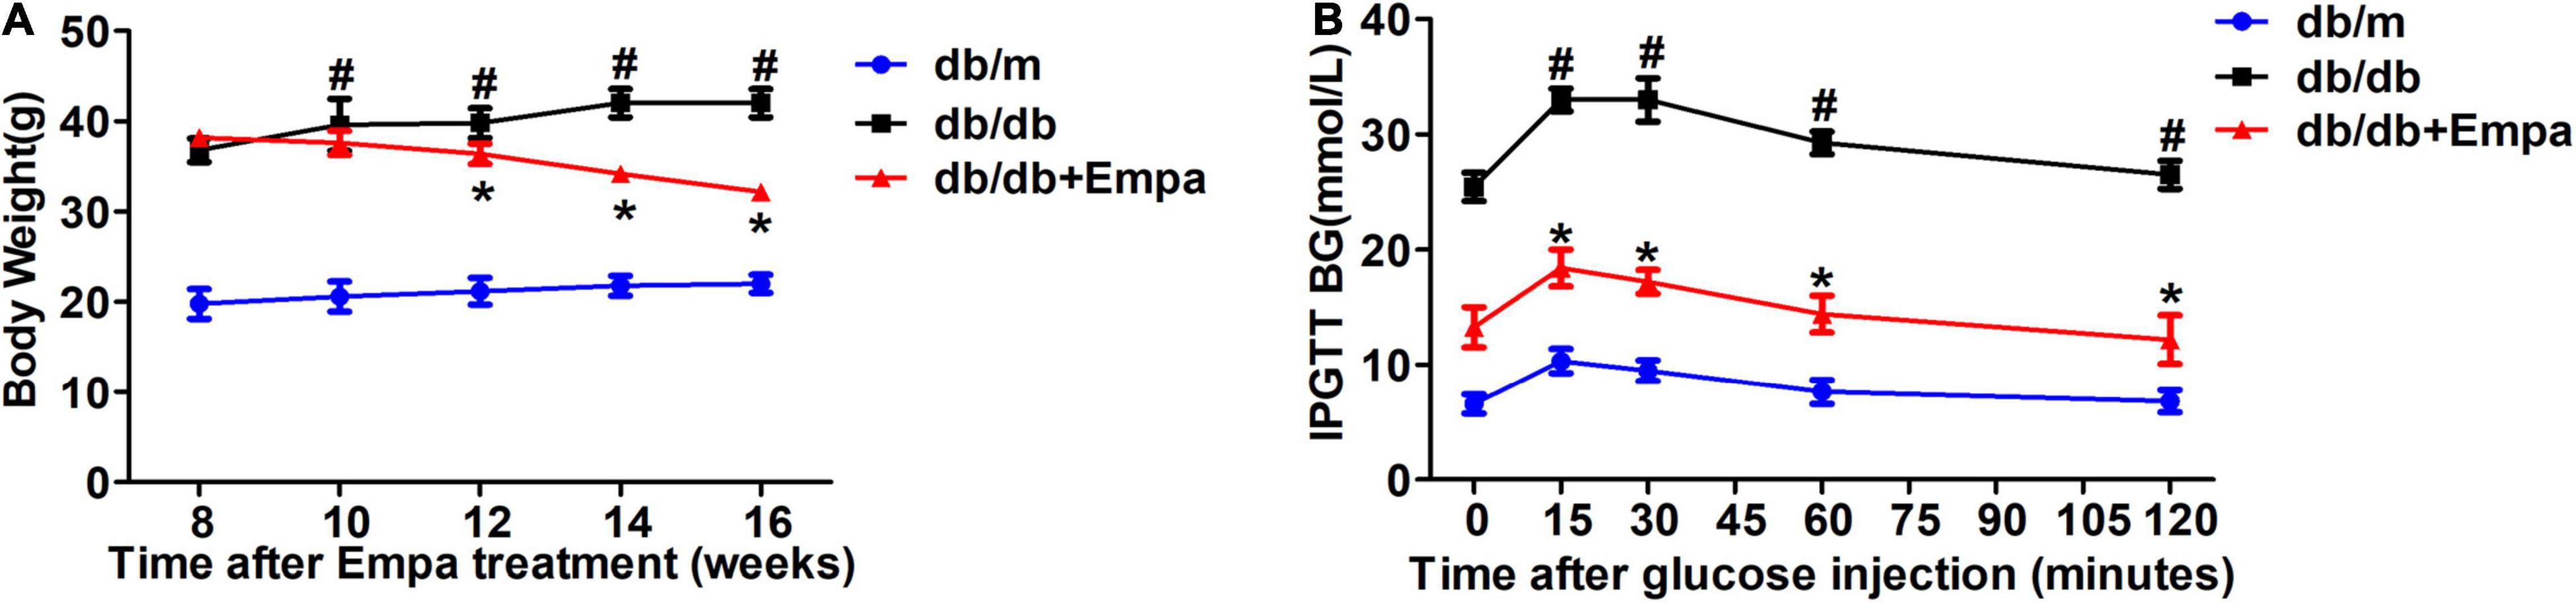
Figure 1. Effects of empagliflozin on blood glucose and body weight. (A) Body weight. (B) Intraperitoneal glucose tolerance test (IPGTT). n = 6 mice/group. *P < 0.05, db/db vs. db/db+Empa; #P < 0.05, db/db vs. db/m.
To further investigate the underlying molecular mechanisms of the hypoglycaemic effect of empagliflozin from the perspective of liver, we first measured the activities and expression levels of key enzymes involved in hepatic gluconeogenesis of hepatic tissues. Compared with db/db mice, the activities of PEPCK and G6Pase in Empa-treated mice were significantly decreased (Figure 2A). Then, the expression levels of key gluconeogenesis enzymes in the three groups of mice were detected. The relative mRNA expression levels of Pepck, G6pase, Fbp1 (fructose-bisphosphatase 1) and Pcx (pyruvate carboxylase) in the Empa-treated mice were significantly lower than those in the db/db mice (Figure 2B). The relative protein expression levels of PEPCK and G6PASE were also consistent with the mRNA expression levels (Figures 2C,D). In addition, the PAS staining results showed that the reduced glycogen in db/db mice was restored after empagliflozin treatment (Figure 2E). Compared with that in db/m mice, the phosphorylation level of AMPK was significantly reduced in db/db mice. After empagliflozin treatment, the phosphorylation level of AMPK was significantly increased, although the phosphorylation level of CREB was significantly inhibited compared with that of the db/db mice. Furthermore, empagliflozin also increased the phosphorylation level of GSK3β (Figures 2F,G). These findings demonstrated that empagliflozin partially reduced hepatic gluconeogenesis and increased glycogen contents by the AMPK/CREB/GSK3β signalling pathway in vivo.
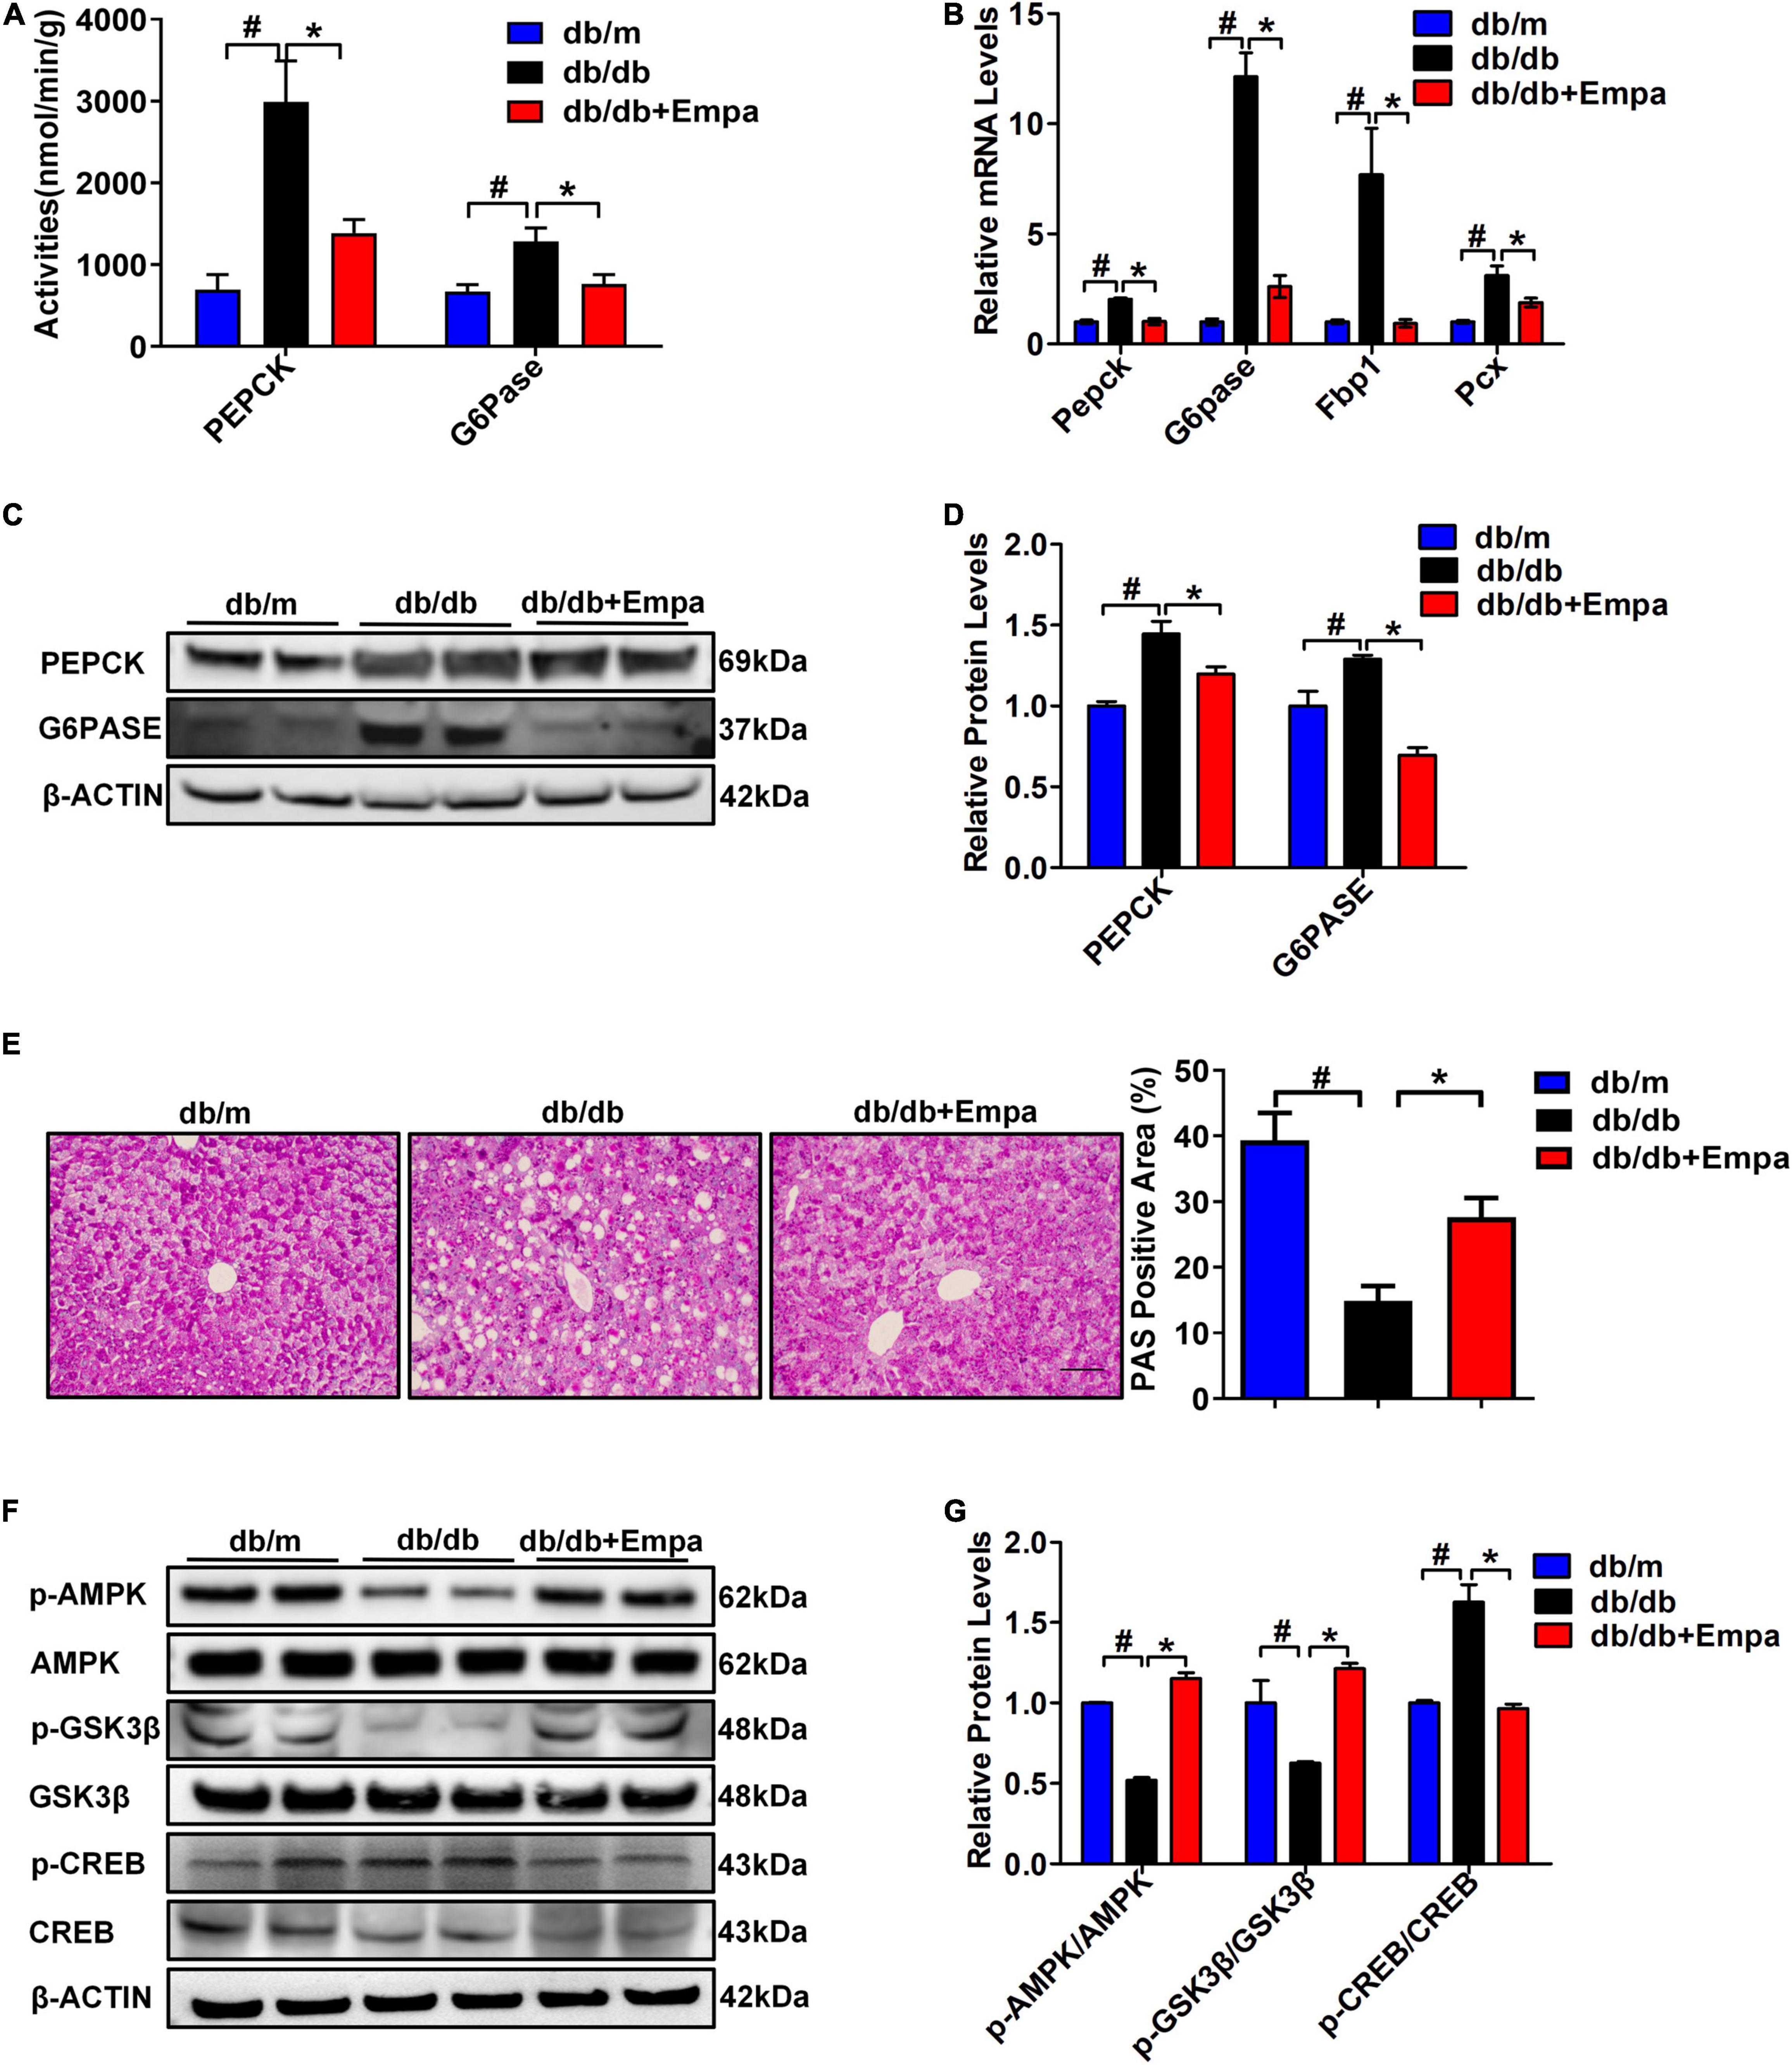
Figure 2. Empagliflozin partially suppressed hepatic gluconeogenesis and promoted glycogen synthesis. (A) Activities of PEPCK and G6Pase in hepatic tissues (n = 6 samples/group). (B) Relative mRNA expression levels of Pepck, G6pase, Pcx, and Fbp1 in the liver were measured by RT-PCR (n = 6 samples/group). (C) Relative protein expression levels of PEPCK and G6PASE in the liver were determined by western blotting. (D) Protein quantitative statistics (n = 6 samples/group). (E) Hepatic PAS staining, scale bar = 100 μm (n = 6 samples/group). (F) Relative protein expression levels of p-AMPK, AMPK, p-GSK3β, GSK3β, p-CREB, and CREB in the liver were determined by western blotting. (G) Protein quantitative statistics (n = 6 samples/group). *P < 0.05, db/db vs. db/db+Empa; #P < 0.05, db/db vs. db/m.
Palmitic acid treatment increased the relative mRNA expression levels of PEPCK and G6PASE in HL7702 cells. Different concentrations of 0 mmol/L, 0.25 mmol/L, 0.5 mmol/L, and 0.75 mmol/L PA were selected to treat HL7702 cells under the same conditions for 24 h. The highest mRNA expression levels of PEPCK and G6PASE were observed in the 0.75 mmol/L PA intervention group (Supplementary Figures 2A,B). Then, we selected 0.75 mmol/L PA for the following experiments. According to the results of the CCK-8 assay, 8 μmol/L empagliflozin was used to treat HL7702 cells (Supplementary Figure 2C). The glucose production content of the empagliflozin combination with PA group was significantly reduced compared with that of the PA treatment group (Figure 3A). The activities of PEPCK and G6Pase were also significantly decreased after empagliflozin combination with PA treatment (Figure 3B). Compared with the PA group, the relative mRNA and protein expression levels of PEPCK and G6PASE were obviously decreased in the empagliflozin combination with PA group (Figures 3C–E). PA reduced the GSK3β phosphorylation level and the glycogen content. The PAS staining results showed that the glycogen content of the empagliflozin combination with PA group was significantly increased compared with that of the PA treatment group (Figure 3F). Then we measured the protein expression levels of AMPK/CREB/GSK3β signalling pathway-related molecules, which are involved in the regulation of gluconeogenesis and glycogen synthesis. PA inhibited AMPK phosphorylation, while empagliflozin obviously activated the AMPK signalling pathway. The phosphorylation level of CREB was reduced after empagliflozin treatment. The phosphorylation level of GSK3β was increased in the Empa-treated group (Figures 3G,H). These results indicated that empagliflozin could rectify the enhanced gluconeogenesis and prevent reduced glycogen synthesis in vitro.
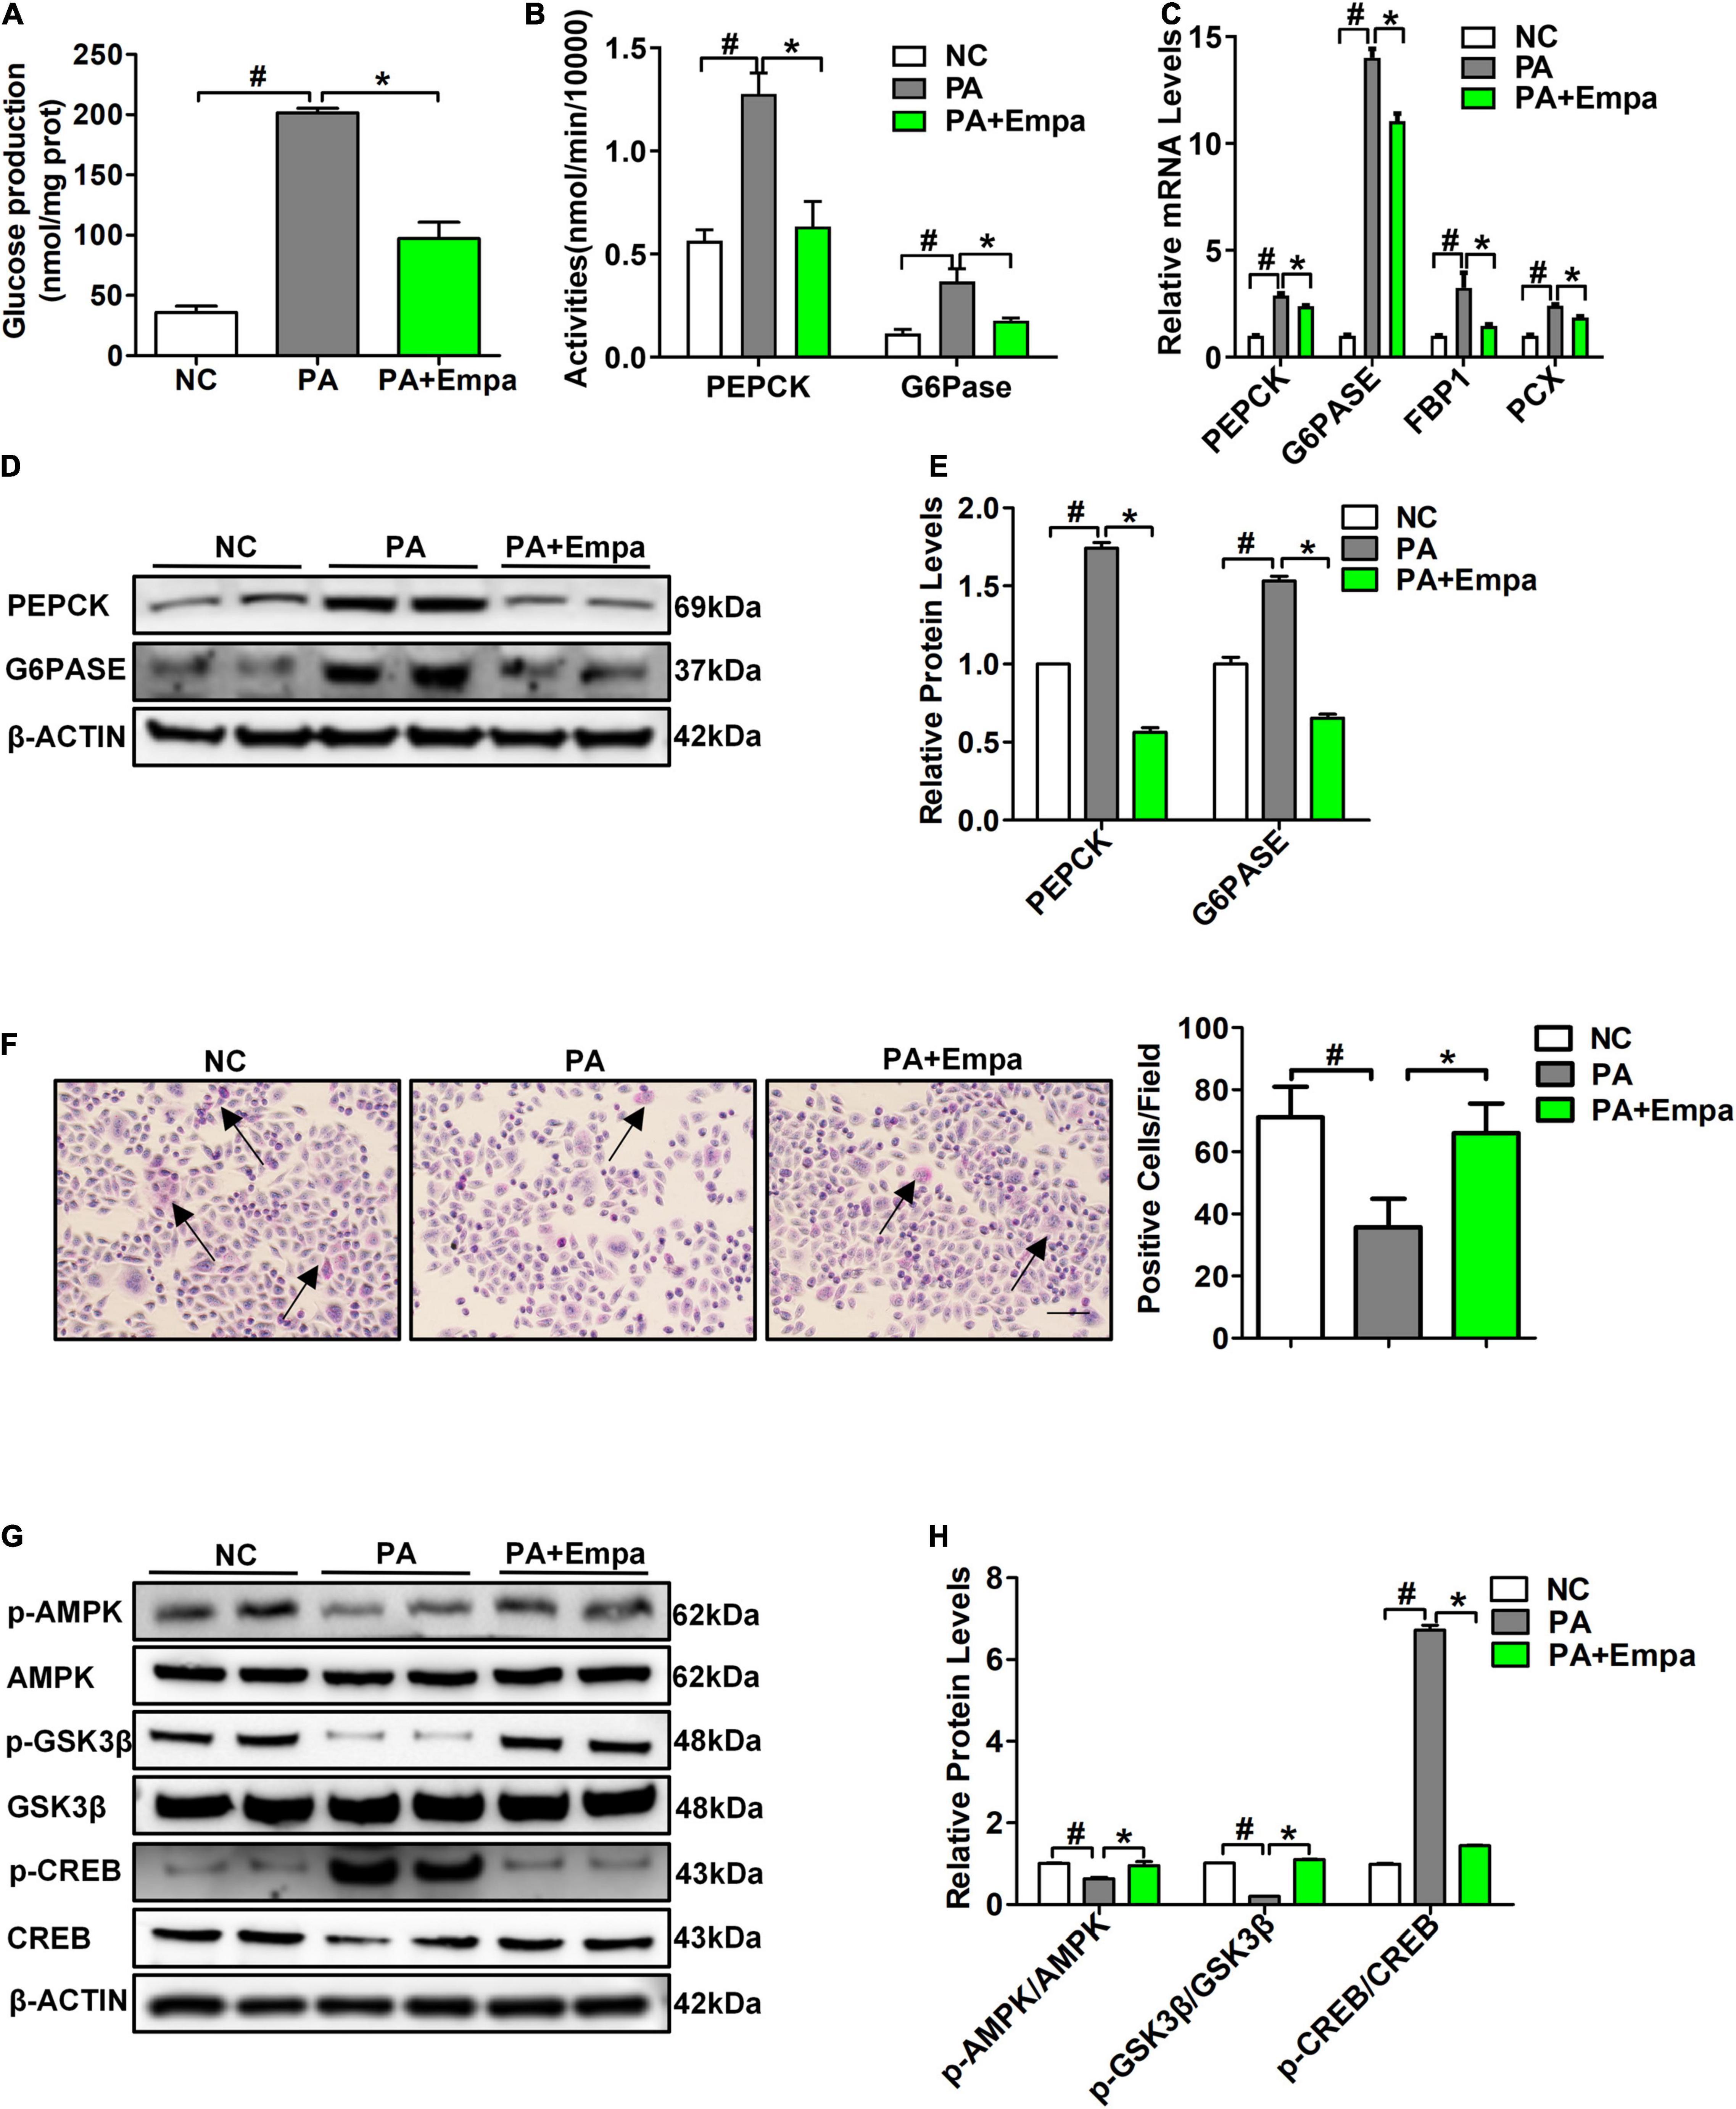
Figure 3. Empagliflozin inhibited gluconeogenesis and promoted glycogen synthesis in HL7702 cells. (A) Glucose production levels (n = 3 samples/group). (B) PEPCK and G6Pase activities (n = 3 samples/group). (C) Relative mRNA expression levels of PEPCK, G6PASE, FBP1, and PCX were measured by RT-PCR (n = 3 samples/group). (D) Relative protein expression levels of PEPCK and G6PASE were determined by western blotting (n = 3 samples/group). (E) Protein quantitative statistics (n = 3 samples/group). (F) PAS staining, scale bar = 100 μm (n = 6 samples/group). (G) Relative protein expression levels of p-AMPK, AMPK, p-GSK3β, GSK3β, p-CREB, and CREB were determined by western blotting. (H) Protein quantitative statistics (n = 3 samples/group). *P < 0.05, PA vs. PA+Empa; #P < 0.05, NC vs. PA. Arrows indicate the areas of focus for PAS staining.
To further verify the role of empagliflozin in activating the AMPK signalling pathway, AIACR, an activator of AMPK, was used to stimulate HL7702 cells in the empagliflozin and PA treatment groups. We found that both empagliflozin and AIACR could significantly reduce glucose production in HL7702 cells after PA treatment (Figure 4A). The activities of PEPCK and G6Pase in HL7702 cells were also consistent with the production of glucose (Figure 4B). Compared with the PA-treated group, the phosphorylation levels of AMPK were also obviously increased after empagliflozin and AIACR treatments. The phosphorylation levels of CREB were simultaneously reduced in both the Empa- and AIACR-treated groups. Both empagliflozin and AIACR could also increase the phosphorylation level of GSK3β. The protein expression levels of PEPCK and G6PASE were also decreased in the Empa- and AIACR-treated groups, which directly indicated the inhibition of gluconeogenesis (Figures 4C,D).
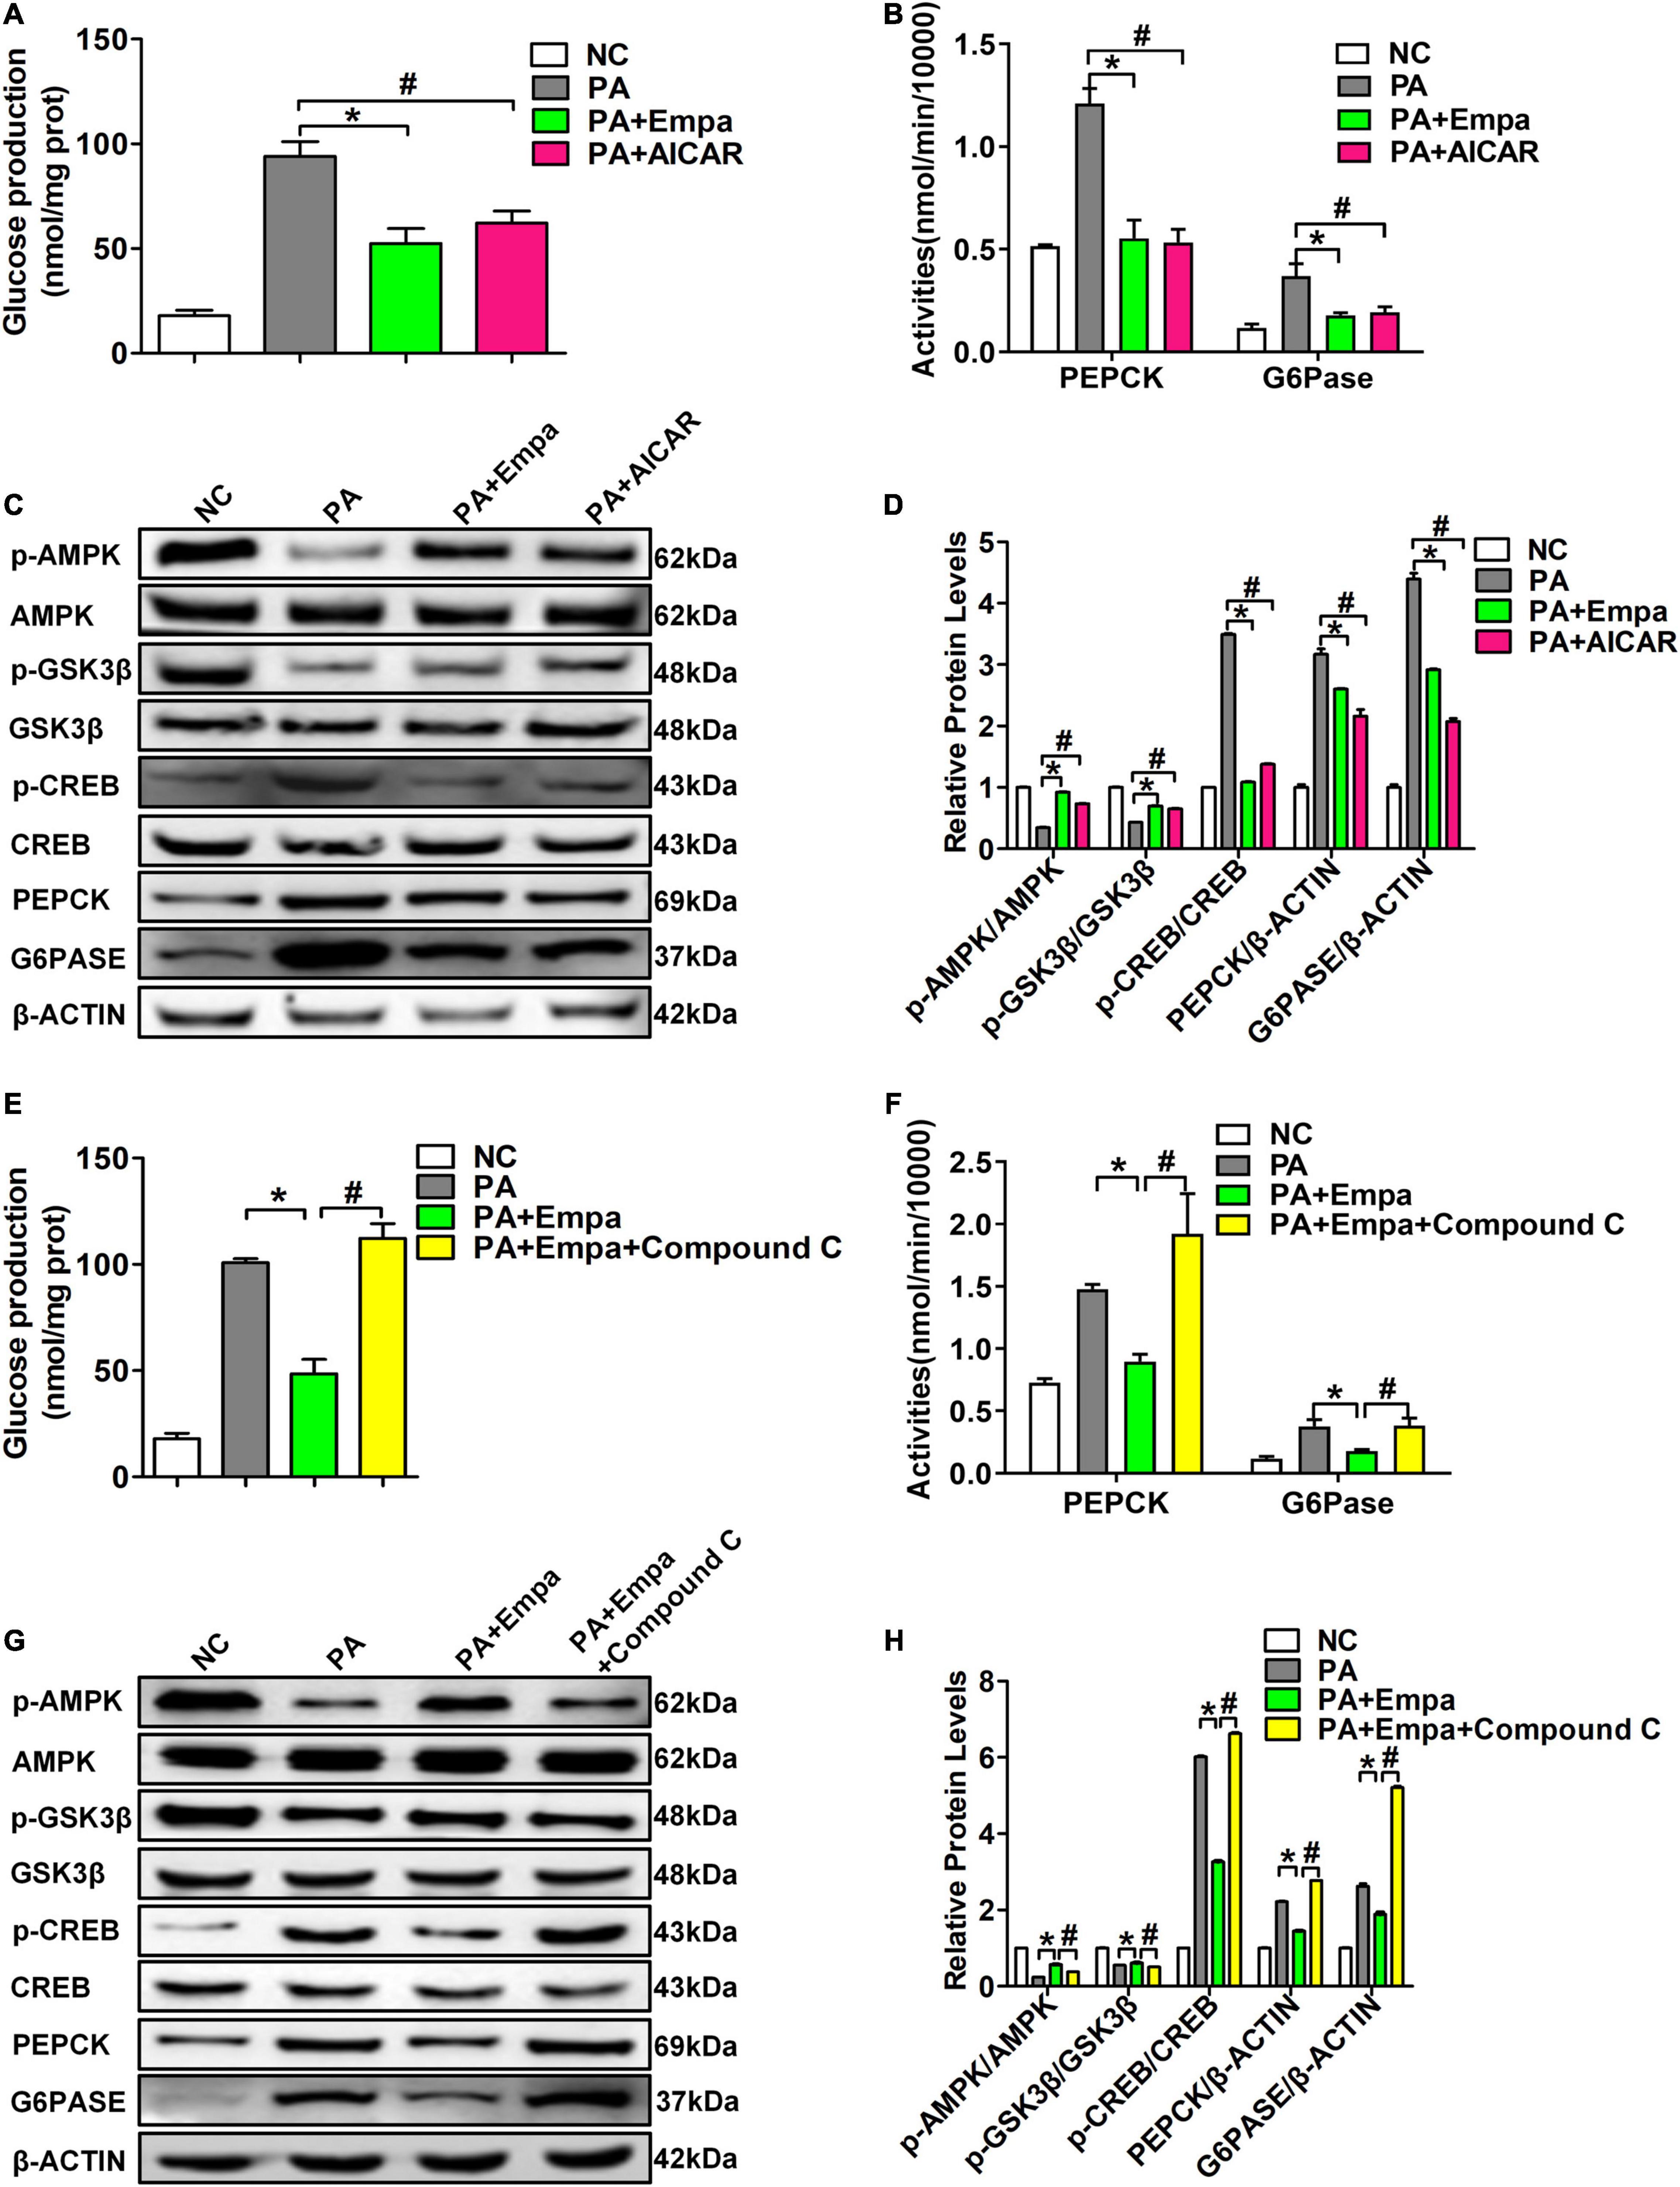
Figure 4. 5-Aminoimidazole-4-carboxamide1-b-D-ribofuranoside (AIACR) and compound C could regulate the AMPK signalling pathway under empagliflozin treatment in vitro. HL7702 cells were treated with the AMPK agonist AICAR and empagliflozin and PA. (A) Glucose production levels (n = 3 samples/group). (B) PEPCK and G6Pase activities (n = 3 samples/group). (C) Relative protein expression levels of p-AMPK, AMPK, p-GSK3β, GSK3β, p-CREB, CREB, PEPCK, and G6PASE were determined by western blotting. (D) Protein quantitative statistics (n = 3 samples/group). *P < 0.05, PA vs. PA+Empa; #P < 0.05, PA vs. PA+AIACR. HL7702 cells were treated with the AMPK inhibitor compound C and empagliflozin and PA. (E) Glucose production levels (n = 3 samples/group). (F) PEPCK and G6Pase activities (n = 3 samples/group). (G) Relative protein expression levels of p-AMPK, AMPK, p-GSK3β, GSK3β, p-CREB, CREB, PEPCK, and G6PASE were determined by western blotting. (H) Protein quantitative statistics (n = 3 samples/group). *P < 0.05, PA vs. PA+Empa; #P < 0.05, PA+Empa vs. PA+Empa+Compound C.
Compound C has been demonstrated to be a highly selective inhibitor of the AMPK signalling pathway. Compound C prevented the effect of empagliflozin in inhibiting the activities of PEPCK and G6Pase and the production of glucose in PA-treated HL7702 cells (Figures 4E,F). Compound C also abolished AMPK activation by empagliflozin in PA-treated HL7702 cells. The phosphorylation level of CREB was significantly increased by compound C. Compound C also decreased the phosphorylation level of GSK3β and increased the expression levels of PEPCK and G6Pase (Figures 4G,H). These results suggested that empagliflozin downregulated hepatic gluconeogenesis and upregulated glycogen synthesis by the AMPK/CREB/GSK3β signalling pathway in vitro.
The liver can effectively maintain the homeostasis of energy metabolism, especially in terms of glucose and lipids. When hungry or fasting, the liver can regulate the blood glucose level by glycogenolysis or gluconeogenesis in vivo (Tsintzas et al., 2013). The increase in endogenous glucose production and the decrease in hepatic glycogen storage contributed to metabolic abnormalities in T2DM (Biddinger and Kahn, 2006). Therefore, inhibition of hepatic glucose production may have a positive effect on the treatment of T2DM (Wu et al., 2005). Increasing hepatic glycogen synthesis and storage may also be beneficial for T2DM treatment. In this study, we demonstrated that empagliflozin could reduce hepatic gluconeogenesis and increase hepatic glycogen synthesis in vivo and in vitro, thus demonstrating the unique pharmacological effect of empagliflozin in addition to its role in hypoglycemia.
Glucose metabolism is a very complex process that is regulated by many mechanisms. As shown in Figure 1 and Supplementary Figure 1, we first selected a T2DM mouse model to investigate the effects of empagliflozin on glucose metabolism in vivo. Empagliflozin significantly reduced urinary glucose excretion and blood glucose levels, which suggested that empagliflozin had an obvious regulatory role in glucose metabolism (Figure 1 and Supplementary Figure 1). Next, we further explored the underlying mechanism by which empagliflozin regulates glucose metabolism. Most glucose utilisation and production are derived from hepatic gluconeogenesis in vivo. Hepatic gluconeogenesis is mainly regulated by some key enzymes, including PEPCK, G6Pase, PCX, and FBP1. As the rate-limiting enzymes of hepatic gluconeogenesis, the activities and expression levels of PEPCK and G6Pase were all significantly decreased after empagliflozin treatment, which suggested that empagliflozin influenced hepatic gluconeogenesis. Interestingly, we also found that empagliflozin could promote glycogen synthesis (Figures 2A–E). What are the molecular mechanisms by which empagliflozin regulates gluconeogenesis and glycogen synthesis? Previous studies have demonstrated that SGLT2 inhibitors can promote AMPK phosphorylation (Zhou et al., 2018; Chiang et al., 2020). We next tested the relative expression levels of AMPK/CREB/GSK3β signalling pathway-related molecules that are involved in the regulation of gluconeogenesis and glycogen synthesis. The relative expression levels of p-AMPK/AMPK, p-GSK3β/GSK3β, and p-CREB/CREB were all significantly changed (Figures 2F,G). Previous studies have demonstrated that activation of the AMPK signalling pathway inhibits the expression of TORC2, thus preventing it from binding with CREB to reduce CREB transcription levels and inhibit gluconeogenesis (Koo et al., 2005). Interestingly, activated AMPK could also induce an increase in the phosphorylation level of GSK3β, which results in an increase in the glycogen synthesis level (Horike et al., 2008). The above results preliminarily suggested that empagliflozin could induce the downregulation of PEPCK and G6Pase activities to inhibit hepatic gluconeogenesis via the AMPK/CREB signalling pathway and promote glycogen synthesis by activating the AMPK/GSK3β signalling pathway in vivo.
To further investigate whether empagliflozin can act on hepatocytes, we next selected PA in combination with empagliflozin to stimulate the human liver cell line HL7702 in vitro. As shown in Figure 3, empagliflozin significantly negatively regulated glucose production and the activities and expression levels of PEPCK and G6Pase in HL7702 cells. The changes in glycogen content were also consistent with those in vivo. The relative expression levels of p-AMPK/AMPK, p-GSK3β/GSK3β, and p-CREB/CREB were all significantly changed in vitro (Figure 3). The above results demonstrated that empagliflozin could rectify enhanced gluconeogenesis and prevent reduced glycogen synthesis in hepatocytes. Next, we selected the specific AMPK agonist AICAR and the inhibitor compound C to further verify the effects of the AMPK signalling pathway on hepatic gluconeogenesis and glycogen synthesis. As shown in Figure 4, the results of the AIACR intervention were consistent with those of empagliflozin treatment in HL7702 cells, and the effects of empagliflozin treatment could be abolished by compound C, which further demonstrated that empagliflozin could regulate gluconeogenesis and glycogen synthesis by the AMPK signalling pathway (Figure 4).
In the process of maintaining glucose homeostasis, insulin and glucagon are highly effective regulatory factors for blood glucose, which are secreted by islet cells (Campbell and Newgard, 2021). Recently, clinical studies have reported that empagliflozin can decrease endogenous glycerol-gluconeogenesis in T2DM patients with obesity, which was partially consistent with our experimental results (Neeland et al., 2020). In this study, we systematically demonstrated that empagliflozin can inhibit hepatic gluconeogenesis and promote glycogen synthesis by the AMPK/CREB/GSK3β signalling pathway in vivo and in vitro. However, there were still some constraints in this study. First, although we have demonstrated that empagliflozin inhibits hepatic gluconeogenesis and promotes glycogen synthesis by activating AMPK, whether AMPK is directly activated by empagliflozin is still worthy of further investigation. Second, the sequence of gluconeogenesis and glycogen synthesis that are regulated by empagliflozin is still unknown and will represent an interesting research focus in the future. Third, although we focused on tAMPK/CREB/GSK3β, empagliflozin might reduce hepatic gluconeogenesis and increase glycogen synthesis by different signalling pathways; thus, additional signalling pathways should be further studied.
In addition to traditional renal and cardiovascular benefits, empagliflozin could partially inhibit hepatic gluconeogenesis and promote glycogen synthesis by the AMPK/CREB/GSK3β signalling pathway in vivo and in vitro. This study focused on the hepatic benefits of empagliflozin, which showed the pharmacological effects of empagliflozin more comprehensively. Our findings provide new insights into empagliflozin as a rising star of hypoglycaemic drugs for T2DM treatment and thus provide a foundation for further research focusing on glucose metabolism.
The original contributions presented in the study are included in the article/Supplementary Material, further inquiries can be directed to the corresponding author/s.
The animal study was reviewed and approved by the Experimental Animals Ethics Committee of Tianjin Medical University, Chu Hsien-I Memorial Hospital and Tianjin Institute of Endocrinology.
XY, ZM, and TF performed the experiment, analyzed the data, and wrote the manuscript. XhL, YC, LX, XyL, and XL assisted in the experiments. MX and TL helped to analyze the data. LC and BS designed the experiment, evaluated and reviewed the manuscript structure, ideas, and science. All authors read and approved the final manuscript.
This work was supported by the Natural Science Foundation of Tianjin (Grant Numbers 18JCYBJC26100, 18JCZDJC35500, and 19JCQNJC11400), National Natural Science Foundation of China (Grant Numbers 81970697 and 31800722), National Key Research and Development Program of China (Grant Number 2019YFA0802503), Tianjin Health Commission Science and Technology Project (Grant Numbers KJ20040 and QN20025), and Scientific Research Program of Tianjin Education Commission (Grant Number 2020KJ187).
The authors declare that the research was conducted in the absence of any commercial or financial relationships that could be construed as a potential conflict of interest.
All claims expressed in this article are solely those of the authors and do not necessarily represent those of their affiliated organizations, or those of the publisher, the editors and the reviewers. Any product that may be evaluated in this article, or claim that may be made by its manufacturer, is not guaranteed or endorsed by the publisher.
We are also grateful to American Journal Experts (verification code: DF8A-FCE1-F804-5DA5-546F) for editing the revised manuscript, and Tianjin Key Medical Discipline (Specialty) Construction Project.
The Supplementary Material for this article can be found online at: https://www.frontiersin.org/articles/10.3389/fphys.2022.817542/full#supplementary-material
Supplementary Figure 1 | Effects of empagliflozin on urinary glucose excretion and fasting blood glucose. (A) Urine glucose excretion. (B) Fasting blood glucose (n = 6 mice/group). *P < 0.05, db/db vs. db/db+Empa; #P < 0.05, db/db vs. db/m.
Supplementary Figure 2 | Effects of different concentrations of empagliflozin and PA in HL7702 cells. (A,B) Relative mRNA expression levels of PEPCK and G6PASE in HL7702 cells treated with different concentrations of PA for 24 h (n = 3 samples/group). (C) The viabilities of HL7702 cells treated with different concentrations of empagliflozin was detected by CCK-8 assay (n = 3 samples/group). *P < 0.05, 0.75 mmol/L PA vs. NC.
AMPK, AMP-activated protein kinase; AIACR, 5-Aminoimidazole-4-carboxamide1-b-D-ribofuranoside; CREB, cAMP-responsive element binding protein; FBP1, fructose-bisphosphatase 1; G6Pase, glucose-6-phosphatase; GS, glycogen synthase; GSK3β, glycogen synthase kinase-3β; IPGTT, intraperitoneal glucose tolerance tests; PA, palmitic acid; PAS, periodic acid-schiff; PEPCK, phosphoenolpyruvate carboxykinase; PCX, pyruvate carboxylase; SGLT2, sodium-dependent glucose transporters 2; T2DM, type 2 diabetes; TORC2, CREB-regulated transcription coactivator 2.
Agius, L., Ford, B. E., and Chachra, S. S. (2020). The metformin mechanism on gluconeogenesis and AMPK activation: the metabolite perspective. Int. J. Mol. Sci. 21:3240. doi: 10.3390/ijms21093240
Alsahli, M., and Gerich, J. E. (2017). Renal glucose metabolism in normal physiological conditions and in diabetes. Diabetes Res. Clin. Pract. 133, 1–9. doi: 10.1016/j.diabres.2017.07.033
Basu, R., Chandramouli, V., Dicke, B., Landau, B., and Rizza, R. (2005). Obesity and type 2 diabetes impair insulin-induced suppression of glycogenolysis as well as gluconeogenesis. Diabetes 54, 1942–1948. doi: 10.2337/diabetes.54.7.1942
Biddinger, S. B., and Kahn, C. R. (2006). From mice to men: insights into the insulin resistance syndromes. Annu. Rev. Physiol. 68, 123–158. doi: 10.1146/annurev.physiol.68.040104.124723
Campbell, J. E., and Newgard, C. B. (2021). Mechanisms controlling pancreatic islet cell function in insulin secretion. Nat. Rev. Mol. Cell Biol. 22, 142–158. doi: 10.1038/s41580-020-00317-7
Chiang, H., Lee, J. C., Huang, H. C., Huang, H., Liu, H. K., and Huang, C. (2020). Delayed intervention with a novel SGLT2 inhibitor NGI001 suppresses diet-induced metabolic dysfunction and non-alcoholic fatty liver disease in mice. Br. J. Pharmacol. 177, 239–253. doi: 10.1111/bph.14859
Fang, Q. H., Shen, Q. L., Li, J. J., Yang, Y., Guo, J. J., Cheng, Y., et al. (2019). Inhibition of microRNA-124a attenuates non-alcoholic fatty liver disease through upregulation of adipose triglyceride lipase and the effect of liraglutide intervention. Hepatol. Res. 49, 743–757. doi: 10.1111/hepr.13330
Gao, D., Nong, S., Huang, X., Lu, Y., Zhao, H., Lin, Y., et al. (2010). The effects of palmitate on hepatic insulin resistance are mediated by NADPH Oxidase 3-derived reactive oxygen species through JNK and p38MAPK pathways. J. Biol. Chem. 285, 29965–29973. doi: 10.1074/jbc.M110.128694
Han, S., Hagan, D. L., Taylor, J. R., Xin, L., Meng, W., Biller, S. A., et al. (2008). Dapagliflozin, a selective SGLT2 inhibitor, improves glucose homeostasis in normal and diabetic rats. Diabetes 57, 1723–1729. doi: 10.2337/db07-1472
Heerspink, H. J. L., Kosiborod, M., Inzucchi, S. E., and Cherney, D. Z. I. (2018). Renoprotective effects of sodium-glucose cotransporter-2 inhibitors. Kidney Int. 94, 26–39. doi: 10.1016/j.kint.2017.12.027
Herzig, S., and Shaw, R. J. (2018). AMPK: guardian of metabolism and mitochondrial homeostasis. Nat. Rev. Mol. Cell Biol. 19, 121–135. doi: 10.1038/nrm.2017.95
Horike, N., Sakoda, H., Kushiyama, A., Ono, H., Fujishiro, M., Kamata, H., et al. (2008). AMP-activated protein kinase activation increases phosphorylation of glycogen synthase kinase 3beta and thereby reduces cAMP-responsive element transcriptional activity and phosphoenolpyruvate carboxykinase C gene expression in the liver. J. Biol. Chem. 283, 33902–33910. doi: 10.1074/jbc.M802537200
Kahn, S. E., Cooper, M. E., and Del Prato, S. (2014). Pathophysiology and treatment of type 2 diabetes: perspectives on the past, present, and future. Lancet 383, 1068–1083. doi: 10.1016/S0140-6736(13)62154-6
Kim, Y. D., Park, K. G., Lee, Y. S., Park, Y. Y., Kim, D. K., Nedumaran, B., et al. (2008). Metformin inhibits hepatic gluconeogenesis through AMP-activated protein kinase-dependent regulation of the orphan nuclear receptor SHP. Diabetes 57, 306–314. doi: 10.2337/db07-0381
Koo, S. H., Flechner, L., Qi, L., Zhang, X., Screaton, R. A., Jeffries, S., et al. (2005). The CREB coactivator TORC2 is a key regulator of fasting glucose metabolism. Nature 437, 1109–1111. doi: 10.1038/nature03967
Li, C., Zhang, J., Xue, M., Li, X., Han, F., Liu, X., et al. (2019). SGLT2 inhibition with empagliflozin attenuates myocardial oxidative stress and fibrosis in diabetic mice heart. Cardiovasc. Diabetol. 18:15. doi: 10.1186/s12933-019-0816-2
Li, T., Fang, T., Xu, L., Liu, X., Li, X., Xue, M., et al. (2021). Empagliflozin alleviates hepatic steatosis by activating the AMPK-TET2-autophagy pathway in vivo and in vitro. Front. Pharmacol. 11:622153. doi: 10.3389/fphar.2020.622153
Lin, Y., Lu, J., Zhang, J., Walter, W., Dang, W., Wan, J., et al. (2009). Protein acetylation microarray reveals that NuA4 controls key metabolic target regulating gluconeogenesis. Cell 136, 1073–1084. doi: 10.1016/j.cell.2009.01.033
Liu, T. Y., Shi, C. X., Gao, R., Sun, H. J., Xiong, X. Q., Ding, L., et al. (2015). Irisin inhibits hepatic gluconeogenesis and increases glycogen synthesis via the PI3K/Akt pathway in type 2 diabetic mice and hepatocytes. Clin. Sci. 129, 839–850. doi: 10.1042/CS20150009
Moore, M. C., Coate, K. C., Winnick, J. J., An, Z., and Cherrington, A. D. (2012). Regulation of hepatic glucose uptake and storage in vivo. Adv. Nutr. 3, 286–294. doi: 10.3945/an.112.002089
Neeland, I. J., Rocha, N. A., Hughes, C., Ayers, C. R., Malloy, C. R., and Jin, E. S. (2020). Effects of empagliflozin treatment on glycerol-derived hepatic gluconeogenesis in obese adults: a randomized clinical trial. Obesity 28, 1254–1262. doi: 10.1002/oby.22854
Park, B. Y., Jeon, J. H., Go, Y., Ham, H. J., Kim, J., Yooet, E. K., et al. (2018). PDK4 deficiency suppresses hepatic glucagon signaling by decreasing cAMP levels. Diabetes 67, 2054–2068. doi: 10.2337/db17-1529
Perez-Mendoza, M., Rivera-Zavala, J. B., and Diaz-Munoz, M. (2014). Daytime restricted feeding modifies the daily variations of liver gluconeogenesis: adaptations in biochemical and endocrine regulators. Chronobiol. Int. 31, 815–828. doi: 10.3109/07420528.2014.908898
Schenk, S., Saberi, M., and Olefsky, J. M. (2008). Insulin sensitivity: modulation by nutrients and inflammation. J. Clin. Invest. 118, 2992–3002. doi: 10.1172/JCI34260
Tsintzas, K., Norton, L., Chokkalingam, K., Nizamani, N., Cooper, S., Stephens, F., et al. (2013). Independent and combined effects of acute physiological hyperglycaemia and hyperinsulinaemia on metabolic gene expression in human skeletal muscle. Clin. Sci. 124, 675–684. doi: 10.1042/CS20120481
Velho, G., Petersen, K. F., Perseghin, G., Hwang, J. H., Rothman, D. L., Pueyo, M. E., et al. (1996). Impaired hepatic glycogen synthesis in glucokinase-deficient (MODY-2) subjects. J. Clin. Invest. 98, 1755–1761. doi: 10.1172/JCI118974
Wang, Q., Wang, N., Dong, M., Chen, F., Li, Z., and Chen, Y. (2014). GdCl3 reduces hyperglycaemia through Akt/FoxO1-induced suppression of hepatic gluconeogenesis in Type 2 diabetic mice. Clin. Sci. 127, 91–100. doi: 10.1042/CS20130670
Wu, C., Okar, D. A., Kang, J., and Lange, A. J. (2005). Reduction of hepatic glucose production as a therapeutic target in the treatment of diabetes. Curr. Drug Targets Immune Endocr. Metabol. Disord. 5, 51–59. doi: 10.2174/1568008053174769
Xu, L., Nagata, N., Nagashimada, M., Zhuge, F., Ni, Y., Chen, G., et al. (2017). SGLT2 inhibition by empagliflozin promotes fat utilization and browning and attenuates inflammation and insulin resistance by polarizing M2 macrophages in diet-induced obese mice. EBioMedicine 20, 137–149. doi: 10.1016/j.ebiom.2017.05.028
Xue, M., Li, T., Wang, Y., Chang, Y., Cheng, Y., Lu, Y., et al. (2019). Empagliflozin prevents cardiomyopathy via sGC-cGMP-PKG pathway in type 2 diabetes mice. Clin. Sci. 133, 1705–1720. doi: 10.1042/CS20190585
Keywords: SGLT2 inhibitor, empagliflozin, gluconeogenesis, glycogenesis, AMPK/CREB/GSK3β signalling pathway
Citation: Yu X, Meng Z, Fang T, Liu X, Cheng Y, Xu L, Liu X, Li X, Xue M, Li T, Sun B and Chen L (2022) Empagliflozin Inhibits Hepatic Gluconeogenesis and Increases Glycogen Synthesis by AMPK/CREB/GSK3β Signalling Pathway. Front. Physiol. 13:817542. doi: 10.3389/fphys.2022.817542
Received: 18 November 2021; Accepted: 07 February 2022;
Published: 01 March 2022.
Edited by:
Aijun Qiao, University of Alabama at Birmingham, United StatesReviewed by:
Xi Lou, University of Alabama at Birmingham, United StatesCopyright © 2022 Yu, Meng, Fang, Liu, Cheng, Xu, Liu, Li, Xue, Li, Sun and Chen. This is an open-access article distributed under the terms of the Creative Commons Attribution License (CC BY). The use, distribution or reproduction in other forums is permitted, provided the original author(s) and the copyright owner(s) are credited and that the original publication in this journal is cited, in accordance with accepted academic practice. No use, distribution or reproduction is permitted which does not comply with these terms.
*Correspondence: Bei Sun, c3VuX3BlaXBlaTIyMEBob3RtYWlsLmNvbQ==; Liming Chen, eGZ4MjIwODFAdmlwLjE2My5jb20=
†These authors have contributed equally to this work
Disclaimer: All claims expressed in this article are solely those of the authors and do not necessarily represent those of their affiliated organizations, or those of the publisher, the editors and the reviewers. Any product that may be evaluated in this article or claim that may be made by its manufacturer is not guaranteed or endorsed by the publisher.
Research integrity at Frontiers
Learn more about the work of our research integrity team to safeguard the quality of each article we publish.