
94% of researchers rate our articles as excellent or good
Learn more about the work of our research integrity team to safeguard the quality of each article we publish.
Find out more
ORIGINAL RESEARCH article
Front. Physiol., 10 March 2022
Sec. Cardiac Electrophysiology
Volume 13 - 2022 | https://doi.org/10.3389/fphys.2022.812535
This article is part of the Research TopicComputational Methods in Cardiac ElectrophysiologyView all 17 articles
 Víctor Peris-Yagüe1,2
 Tony Rubio3,4
 Funsho E. Fakuade3,4,5
 Niels Voigt3,4,5
 Stefan Luther1,3,4
 Rupamanjari Majumder1,3,4*
State of the art mathematical models are currently used to bridge the gap between basic research conducted in the laboratory and preclinical research conducted on large animals, which ultimately paves the way for clinical translation. In this regard, there is a great need for models that can be used alongside experiments for in-depth investigation and validation. One such experimental model is the porcine atrium, which is commonly used to study the mechanisms of onset and control of atrial fibrillation in the context of its surgical management. However, a mathematical model of pig atria is lacking. In this paper, we present the first ionically detailed mathematical model of porcine atrial electrophysiology, at body temperature. The model includes 12 ionic currents, 4 of which were designed based on experimental patch-clamp data directly obtained from literature. The formulations for the other currents are adopted from the human atrial model, and modified for porcine specificity based on our measured restitution data for different action potential characteristics: resting membrane potential, action potential amplitude, maximum upstroke velocity and action potential duration and different levels of membrane voltage repolarization. The intracellular Ca2+ dynamics follows the Luo-Rudy formulation for guinea pig ventricular cardiomyocytes. The resulting model represents “normal” cells which are formulated as a system of ordinary differential equations. We extend our model to two dimensions to obtain plane wave propagation in tissue with a velocity of 0.58 m/s and a wavelength of 8 cm. The wavelength reduces to 5 cm when the tissue is paced at 200 ms. Using S1-S2 cross-field protocol, we demonstrate in an 11.26 cm square simulation domain, the ability to initiate single spiral waves (rotation period ≃ 180 ms) that remain stable for more than 40 s. The spiral tip exhibits hypermeander. In agreement with previous experimental results using pig atria, our model shows that early repolarization is primarily driven by a calcium-mediated chloride current, IClCa, which is completely inactivated at high pacing frequencies. This is a condition that occurs only in porcine atria. Furthermore, the model shows spatiotemporal chaos with reduced repolarization.
Atrial fibrillation (AF) is the most common sustained form of cardiac arrhythmia occurring in humans. Its effective treatment requires a detailed understanding of the underlying mechanisms at the genetic, molecular, cellular, tissue and organ levels. To study the complex mechanisms underlying the development, maintenance and termination of cardiac arrhythmias, preclinical research models are required. These models range from in vitro cell cultures to in vivo small and large animal hearts. However, translational research necessitates a proper understanding of the results from animal experiments in the human context, for which it is very important that the preclinical results are well-understood and validated. Currently, this is achieved through simulations of state-of-the-art mathematical models alongside experimentation on large animals. In particular, a model that is extensively used by experimentalists to advance surgical management of AF, is that of the pig atria. However, until now, an ionically detailed mathematical model for pig atrial tissue has been lacking, and researchers have been forced to rely on mathematical models from other animal species to understand their experimental observations.
Typical large animal heart models include that of dog, sheep, goat, pig, etc. In studies on cardiac arrhythmias, especially atrial fibrillation (AF) it is a challenge to find the right animal model. This is mainly because the reliable inducibility of sustained AF requires some form of chronic intervention, which is often associated with a large cost of maintenance and time limitations. The porcine atrial model overcomes this challenge by providing an acute, reliable and reproducible model for sustained AF (Lee et al., 2016). This model can be used at length to test experimental procedures and drugs that are intended for translational purposes under various disease conditions. To make matters more favorable, the cardiac anatomy, electrophysiology and coronary circulation of pigs are very similar to those of humans (e.g., heart mass: 148–383 g in humans vs. 250–400 g in pigs; heart to body mass ratio: 0.4 in humans vs. 0.32 in pigs; heart rate: 60–80 in humans vs. 68–100 in pigs, etc.) For a detailed comparison of human and pig parameters, we refer the reader to Table 1 of Clauss et al. (2020). Thus, an electrophysiologically detailed mathematical model of the porcine atria is definitely a important tool to have in translational research.
In this study, we present the first detailed mathematical model of the pig atria, based on experimental patch-clamp data from literature and our own restitution experiments on pig atrial tissue, using sharp-electrode technique. In two dimensions, we demonstrate its ability to produce and sustain stable meandering spiral waves. We characterize the spatiotemporal meander pattern, report the dominant frequencies and the effect of system size on the stability of the spiral pattern. In particular, we highlight some fundamental differences in the role of Cl− currents and Ca2+ dynamics in the early repolarisation phase of AP in pigs with respect to humans, a crucial difference to be accounted for in the translatability of results, from pigs to humans, in future in vitro and in vivo experiments. We further go on to propose a model for AF using an altered set of parameters that allows us to have a state of electric turbulence in pig atrial tissue.
All animal care and use procedures were carried out exclusively by appropriately trained staff and were in accordance with the German Animal Welfare Act and reported to the local animal welfare officers. The handling of the animals prior to the experiments and the humane, animal welfare procedures strictly followed animal welfare regulations, in accordance with German legislation, local regulations and the recommendations of the Federation of European Laboratory Animal Science Associations (FELASA). All scientists and technicians involved have been accredited by the responsible ethics committee (Lower Saxony State Office for Consumer Protection and Food Safety - LAVES).
Trabecular muscles were isolated and excised from a whole right atria, and placed in a custom-built recording chamber under continuous perfusion of heated (37°C) and carbonated (5% CO2, 95% O2) Tyrode's solution containing (in mM): NaCl 126.7, KCl 5.4, MgCl2 1.1, CaCl2 1.8, NaHPO4 0.42, NaHCO3 22, glucose 5.5, pH = 7.45 at least 45 min before measurement, for accommodation.
Borosilicate glass capillaries (Hilgenberg, Germany) were pulled using a horizontal pipette puller (Zeitz, Germany). Electrical resistance was 30–40 MΩ. Pipettes were backfilled with 3M KCl.
Tissues were electrically stimulated with a 1 ms monophasic pulse using a custom-made electrode (FHC, USA). Pulse amplitude was pre-defined as 30% higher than the value necessary to trigger an action potential. After successful tissue impalement, and after reaching steady state activity, the tissue was then subjected to a train of electrical stimulation at increasing frequencies (0.25, 0.5, 1, 2, 3, and 4 Hz). AP onset at 5 Hz proved difficult and inconsistent.
Membrane potential signals were amplified using a Sec-05-X (npi, Germany) amplifier, digitized using LabChart PowerLab, and acquired and saved with LabChart Pro 7 software (both: ADInstruments, New Zealand).
Analysis was performed using LabChart pro and GraphPad Prism 7 (GraphPad Software Inc., USA). The average value of 10 consecutive action potentials were calculated in LabChart Pro. The following parameters were measured: resting membrane potential (RMP), action potential maximum upstroke velocity (dV/dtmax), action potential amplitude (APA) and the action potential duration at 20, 50 and 90% of repolarisation (APD20, APD50, and APD90, respectively).
The fitting of IV curves from experimental data by Li et al. (2004) was carried out by minimization of the squared error between the simulated and experimental data using Python's Scipy module (Virtanen et al., 2020). For this purpose, a function was created in Python that would recreate the patch-clamp experiments as in Li et al. (2004), and output the simulated IV curve. The morphology of each individual current and its gating variables was initially taken directly from the human atrial model by Courtemanche et al. (1998) and corrected accordingly to match experimental data. Fitting was done by matching normalized IV curves first, and then adjusting conductance values to match the non-normalized experimental IV curves.
Overall AP morphology and restitution curves were later matched by re-adjusting conductance values of the different currents, and simulating AP evolution for stimulation at different cycle lengths. Slight changes were made to currents not fitted from Li et al. (2004) to better adjust experimental restitution curves. See the Results section for detailed explanations of each individual current.
We developed a mathematical model for a native atrial cardiomyocyte, isolated from the excised atrium of a healthy adult pig. The equivalent electrical circuit representing the cell membrane is shown in Figure 1.
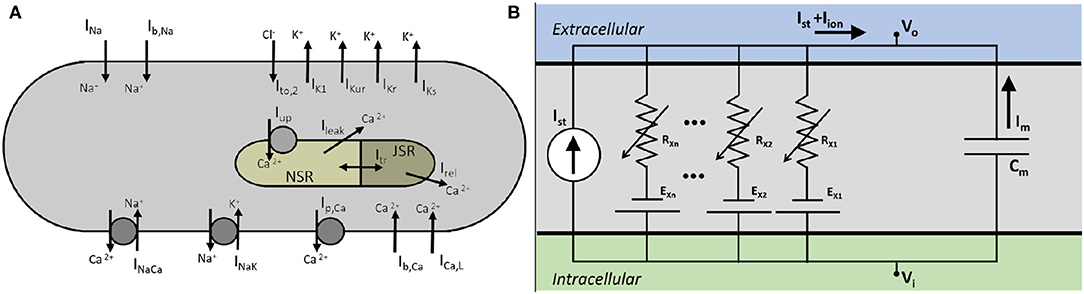
Figure 1. (A) Schematics of a pig atrial cardiomyocyte model, showing transmembrane currents and the basic structure of the Ca2+ dynamics. (B) Electrical circuit equivalent of the cell.
It consists of a membrane capacitance, Cm, connected in parallel with several nonlinear conductances (GX) and batteries (EX). The net current (Iion) flowing across the cell membrane at any instant is the sum of individual currents flowing through the various branches of the circuit. Thus, the time-evolution of the transmembrane voltage V can be described using the following ordinary differential equation. (Equation 1)
Here Istim represents the external stimulus current that needs to be applied to the cell membrane to invoke an action potential (AP). We describe Iion as a sum of 12 ionic currents (Equation 2):
V is measured in millivolts (mV), time (t) in milliseconds (ms), Cm in picofarads (pF), and all currents in picoamperes per picofarad (pA/pF). All conductances GX are measured in nanosiemens per picofarad (nS/pF), and intracellular and extracellular ionic concentrations ([X]i, [X]o) are expressed in milimolar (mM). The fast Na+ current is represented by INa, the inward rectifier K+ current by IK1, ultrarapid rectifier K+ current is given by IKur, rapid and slow delayed rectifier K+ currents by IKr, IKs, respectively, L-Type Ca2+ current by ICa, L, Ca2+ pump current by Ip, Ca, the Sodium-Potassium and Sodium-Calcium pump currents by INaK, INaCa, respectively, and the background Na+ and Ca2+ currents by Ib, Na, Ib, Ca, respectively. Uniquely in the pig atrial model, the transient outward current is represented only by a calcium-mediated chloride current, IClCa.
The formulation of subcellular Ca2+ uptake and release by the sarcoplasmic reticulum (SR) is retained from the work of Luo and Rudy (1994). The three main currents involved are the Ca2+ uptake current, Iup, the Ca2+ release current Irel and the Ca2+ transfer current between the network SR (NSR) and junctional SR (JSR), Itr. The model also includes a leak current from the SR into the cytoplasm, Iup, leak, as described by Courtemanche et al. in their model for the human atrial cardiomyocyte (Courtemanche et al., 1998).
To invoke action potentials in tissue, we applied a stimulus current of 7 nA for 4 ms. The mathematical description of each ionic current is provided in the Supplementary Appendix, together with a list of model parameters and initial values.
We describe the fast Na+ current according to the Courtemanche-Ramirez-Nattel (CRN) model for human atrial cardiomyocytes (Courtemanche et al., 1998), which uses a Hodgkin-Huxley type formulation (see Equation 3) taken from the Luo-Rudy model (Luo and Rudy, 1994):
Here m is the activation gate; h and j are the two inactivation gates. In order to make the model pig-specific, we used Equation (3) to fit experimentally obtained INa current-voltage (IV) characteristics and/or current traces from patch-clamp measurements.
However, in the absence of these experimental data, we followed an alternative approach. Since INa is the dominant active current during the upstroke phase of an AP, (the other current being the inward rectifier, IK1, which is orders of magnitude smaller than INa), we considered it to be primarily responsible for the AP amplitude (APA) and maximum upstroke velocity (). Thus, we used the complete model (considering all currents, pumps and exchangers) to fit experimentally obtained APA and data, at various pacing frequencies, i.e., APA- and restitution, by tuning only the INa.
Numerical fitting of these restitution data, using Equation (3) to describe INa instructed us to apply the following adaptations: (i) raise the maximum channel conductance (gNa) by 80% with respect to humans; (ii) increase the time constant of activation (τm) by a factor 1.7; and (iii) increase the time constant of inactivation (τh, τj) by a factor 2. The kinetics of the activation and inactivation gates are shown in Figures 2A,B. With the applied modifications, the INa current traces turned out to be as in Figure 2C and the IV curve, as shown in Figure 2D.
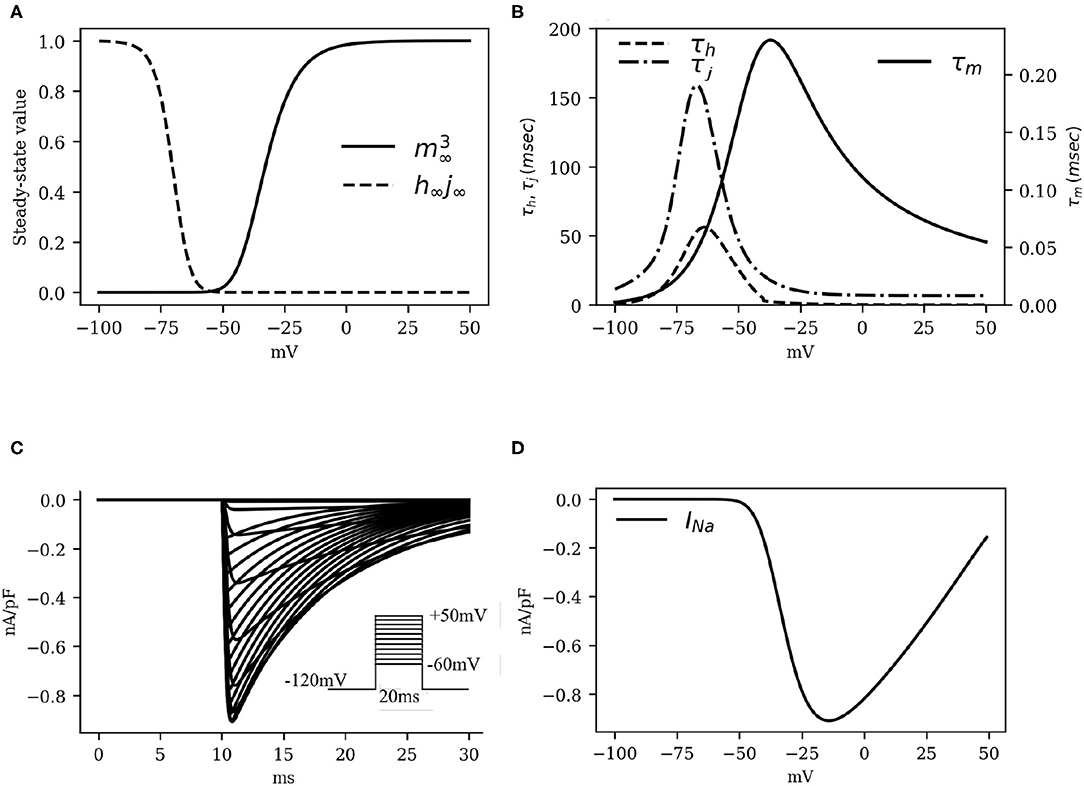
Figure 2. The kinetics of the fast Na+ current INa. (A) Activation and inactivation characteristics of the steady state gating variables m (raised to cubic power), h and j (combined as the product h∞j∞). (B) Voltage dependence of the time constants for activation (τm) and fast and slow inactivation (τh and τj, respectively). (C) Simulated traces of INa (traces at 5mV steps from minimum to maximum in the inset). (D) INa Current-Voltage characteristics.
The L-type Ca2+ currrent (ICa, L) was modeled according to previous literature (Courtemanche et al., 1998; Ramirez et al., 2000; Pandit et al., 2001; Majumder et al., 2016), based on the Hodgkin-Huxley formalism:
Here gCa, L is the channel conductance, d and f the voltage-gated activation and inactivation variables, respectively, and fCa is a calcium-mediated gating variable defined by:
In particular, the gating behavior of ICa, L follows the human CRN model, with a +5mV shift in the activation kinetics to decrease the activation window along with the overall ICa, L that is necessary for the fitting of action potential duration restitution properties. As ICa, L is considered to be largely responsible for the plateau phase of the action potential, decreasing (increasing) this current by small amounts can lead to sharp decrease (increase) in the action potential duration without lowering (raising) the resting membrane potential by substantial amounts. Our patch-clamp measurements showed that the amplitude of ICa, L was ≃3.25±0.75 pA/pF. This value imposed a constraint on the choice of gCaL. The kinetics of L-type Ca2+ channel, as well as the IV characteristics of the ICaL are shown in Figure 3.

Figure 3. The kinetics of the fast L-type Ca2+ current ICaL. (A) Activation and inactivation characteristics of the steady state gating variables d and f. (B) Voltage dependence of the time constants for activation (τd) and voltage-gated inactivation (τf). (C) Simulated traces of ICaL (traces at 5mV steps from minimum to maximum in the inset). Intracellular Ca2+ concentration was kept constant at . (D) ICaL Current-Voltage characteristics.
The IK1 is known to play a major role in determining the resting membrane potential (RMP) of excitable cardiac cells in many animal species, with the current reversing its direction of flow close to the actual RMP value. Given that our sharp-electrode measurements on pig atrial tissue suggested a more depolarised (positive) RMP value than that reported in human atrial cardiomyocytes (Courtemanche et al., 1998), we modified the parameters of the CRN IK1 formulation to make the current pig-specific.
To this end, (i) we shifted the reversal potential of IK1 by –5 mV, as has been done previously in some large animal models, such as the sheep (Butters et al., 2013), (ii) we reduced the maximum channel conductance of IK1 by 9% relative to the human model (Courtemanche et al., 1998), (iii) we decreased the slope of activation of the IK1 IV curve by 10%; and (iv) we shifted the half-rise potential by +10 mV. Thus, IK1 in the pig atrial model is described according to Equation (6). These adjustments enabled us to fit the shape of the action potential duration restitution curves at the 80–90% repolarization, while trying to balance the effects of ICa, L and other rectifier currents. The IV curve for IK1 as shown in Figure 4.
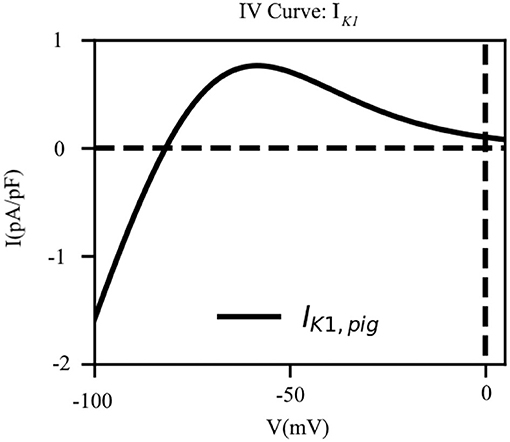
Figure 4. The current-voltage characteristic of the inward rectifier K+ current (IK1). The direction of flow of the current across the cell membrane reverses at EK = −81.76mV which is close to our experimentally measured resting membrane potential.
Recent work by Ehrlich et al. (2006), indicates that pig atrial tissue exhibits a bi-exponential inactivation. Pandit et al. (2011) developed a model for the ultrarapid K+ current, that reproduces the experimental data of Ehrlich et al. (2006). We used the formulation of Pandit et al. (2011) to describe IKur in our model for the pig atrial tissue (see Equation 7)
Here gKur is the channel conductance, ua the activation gate, EK the reversal potential of K+, and ui, f and ui, s the fast and slow inactivation components, respectively. (a, b) = (0.25, 0.75) are weights applied to the inactivation gates. It is interesting to note that the approach by Pandit et al. is similar to that of Aguilar et al. for the human atria. However, in the latter case, the inactivation of IKur is given by ui = ui, f·ui, s instead of a sum of the variables (Aguilar et al., 2017). The conductance of IKur is described according to Equation (8).
Here gKur, amp is an adjustable parameter whose value is determined during the final stages of model development (see section 3.2, for more details). Figures 5A,B show the activation and inactivation kinetics of IKur, whereas, a comparison between the current-voltage characteristics, as measured in experiments by Ehrlich et al. (2006) and that produced using our model, is presented in Figure 5C.
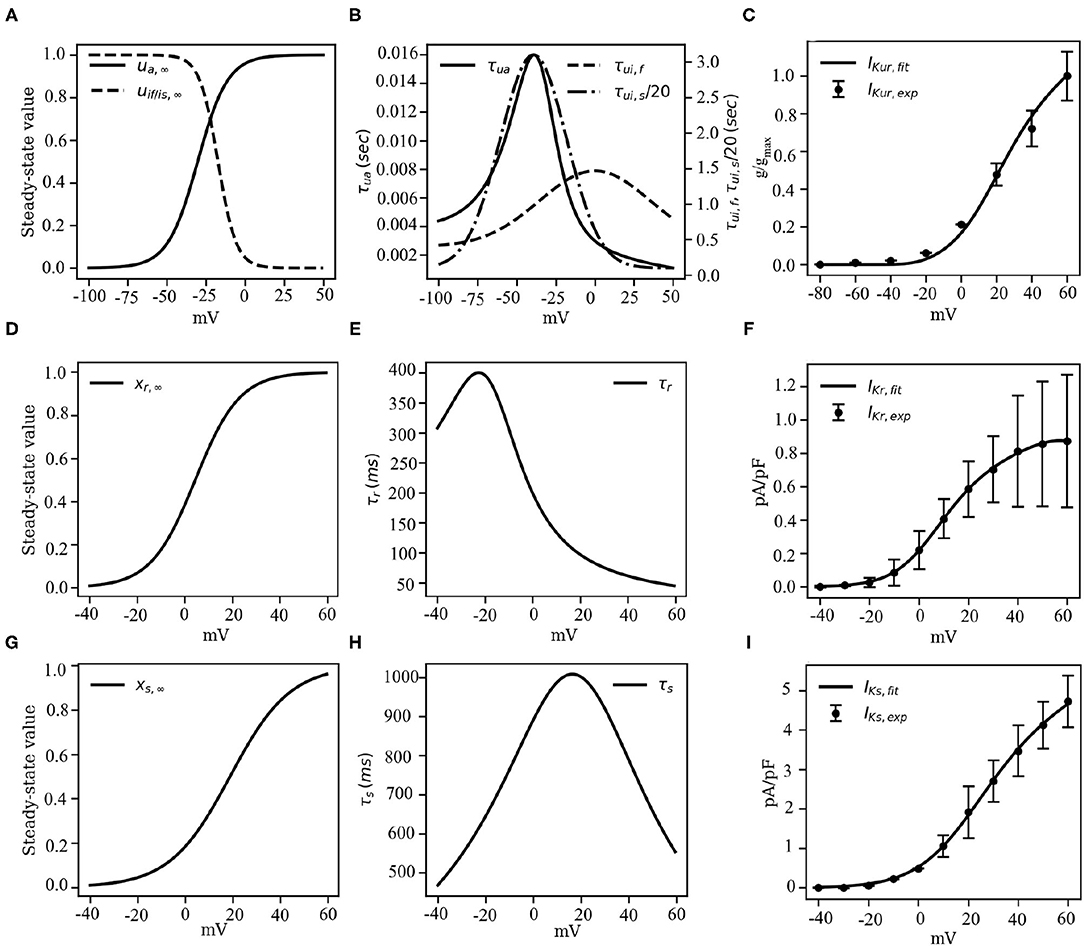
Figure 5. Channel kinetics and current-voltage characteristics of the rectifying K+ currents IKur, IKr and IKs. (A) Voltage-dependence of steady-state activation (us, ∞) and inactivation (uif, ∞ of uis, ∞) probabilities of IKur. (B) Voltage-dependence of the time constants of activation (τui) and inactivation (τuf or τus) of IKur, reduced by a factor of 20. (C) Comparison between the model-generated IV curve for IKur and the IV curve reported by Ehrlich et al. (2006) based on experiments. (D) Voltage-dependence of steady-state activation (xr, ∞) probability of IKr. (E) Voltage-dependence of the time constant of activation (τr) of IKr. (F) Comparison between the model-generated IV curve for IKr and the experimentally obtained IV curve from Li et al. (2004). (G) Voltage-dependence of steady-state activation (xs, ∞) probability of IKs. (H) Voltage-dependence of the time constant of activation (τs) of IKs. (I) Comparison between the model-generated IV curve for IKs and the experimentally obtained IV curve from Li et al. (2004).
The rapid delayed rectifier current (IKr) was formulated similar to the original CRN model (Courtemanche et al., 1998), but with altered half-rise voltage (V1/2), slope of the correction value, and the steady-state of the single gating variable, such that the obtained IV characteristic curve matches with the experimental IV curve of Li et al. (2004):
Initially, the conductance gKr was set at 0.0065pA/pF to match the non-normalized IV curve. However, this value was tuned during the final stages of model development to match the pig atrial APD restitution curves at the tissue level. The steady-state value (xr, ∞) of the gating variable xr is described according to Equation (10):
Note that, V1/2 of xr, ∞ is shifted by +20mV relative to the CRN model, whereas, the slope of the xr kinetic is slightly decreased (Courtemanche et al., 1998). The gating behavior of xr is described in Figures 5D,E. Unavailability of sufficient experimental data led us to retain the temporal dynamics of the gating variable xr from the CRN model (Courtemanche et al., 1998). Figure 5F shows the comparison between the experimental and simulated IV curves for IKr.
We retained the slow delayed rectifier current formulation from the original CRN model (Courtemanche et al., 1998):
The maximum channel conductance gKs was adjusted to fit the restitution properties. The gating variable xs, and time constant τs are described according to Equations (12) and (13), respectively.
Here, parameters p1 and p2 have values 18.802 and 12.6475 mV, respectively, obtained by fitting experimental data from Li et al. (2004). The close resemblance of these values with those used in the human atrial tissue model (Courtemanche et al., 1998) suggests that electrophysiologically, human atrial IKs and pig atrial IKs are very similar. Figures 5G,H show the steady state kinetic and time constant, respectively, of IKs, whereas, the model-generated IV curve is compared with experimental data from Li et al. in Figure 5I.
Ito in most species is composed of two components: a potassium current (Ito, 1) and a chloride current (Ito, 2, also referred to as IClCa).
Although the presence of IClCa has been reported in multiple species and tissues (Zygmunt and Gibbons, 1991; Gomis-Tena and Saiz, 1998; Ramirez et al., 2000; Xu et al., 2002; Bondarenko et al., 2004; Wang and Sobie, 2008), including human atria (Wang et al., 1987, 1993), it is generally observed that Ito, 1 forms the predominant component, scoring over IClCa in both strength and duration of activity, as a transient outward current (Wang et al., 1993; Bondarenko et al., 2004). However, in a study by Li et al. (2004), it was reported that pig atrial Ito is unique, in the sense that it is a completely calcium-driven chloride current (Li et al., 2003, 2004; Schultz et al., 2007). Thus, in our model, we incorporated this feature by modeling IClCa according to Equation (15), and experimental data from Li et al. (2004).
For the choice of formulation of IClCa we considered various candidates (Gomis-Tena and Saiz, 1998; Ramirez et al., 2000; Bondarenko et al., 2004; Wang and Sobie, 2008). In the end, we decided to use Equation (15), which is a formulation for IClCa in a canine atrial model (Ramirez et al., 2000). The reason for choosing this formulation was that it allowed a fairly accurate reproduction of the bell shape of the IV curve and the same general upward trend present in the experimental data of Li et al. (2004).
Here gClCa is the channel conductance, ECl the Cl− reversal potential and qCa the sole gating variable of the channel, which follows the typical gating behavior of a Hodgkin-Huxley-type gating variable:
Fn is the flux of Ca2+ into the myoplasm. Fn shows a strong correlation with the sharp release of Ca2+ from the SR in the initial stages of AP (through the SR release current, Irel), giving IClCa the fast dynamics of a transient outward current. Also, the inactivation of Irel gives IClCa a significant bell-shape in its IV curve, something universally observed in IClCa (Tseng and Hoffman, 1989; Gomis-Tena and Saiz, 1998; Hiraoka et al., 1998; Ramirez et al., 2000). In the case of our model, we shifted the inactivation of Irel by +40mV and increased the slope of inactivation to fit experimental results from Li et al. (2004).
Figure 6 shows the IV curve for IClCa, as obtained using our model of the pig atrial tissue, overlaid on experimental data from Li et al. (2004). The simulated current activated earlier than in experiments, but with a good overall qualitative behavior.
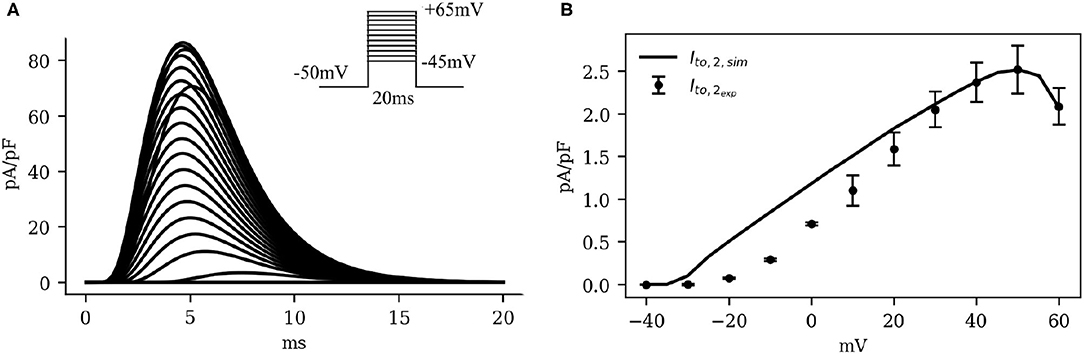
Figure 6. (A) Simulated traces (traces at 5mV steps from minimum to maximum in the inset) and (B) Current-voltage characteristics of IClCa, showing experimental data (dots with error bars) from Li et al. (2004), overlaid on the model-generated curve (solid). Note the significant bell-shape of the curve at high positive voltage values.
Table 1 presents a summary of all currents adjusted in the model, along with references to the experimental data used and the parameters adjusted.
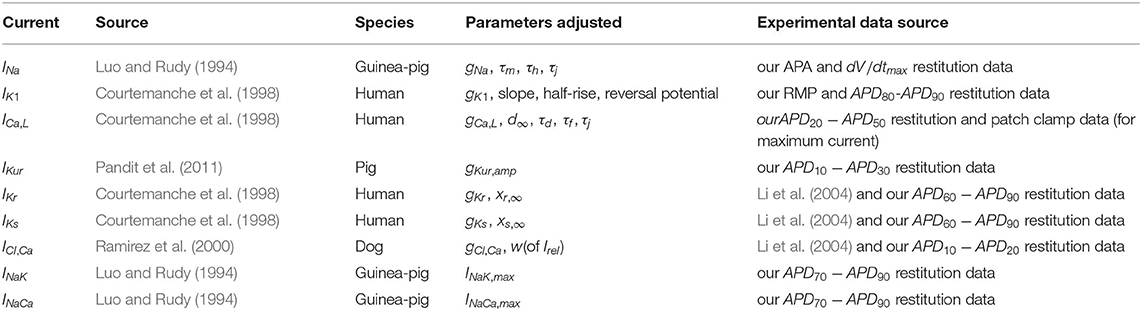
Table 1. Summary of currents.
The cell model thus developed reflects ionic current properties obtained from different cell samples patched under different experimental conditions and by different groups around the world. It is unreasonable to expect that the resulting model would represent the electrophysiology of a real porcine atrial cell just by combining these currents. We need some degree of tuning to ensure that the resulting cell responds electrophysiologically in the same way as an average cell isolated from a porcine tissue sample. Therefore, we move to the next step in model development, i.e., tuning with restitution. Refining a model to ensure that it is able to reproduce the electrical properties of the heart at tissue and organ level requires detailed studies of model restitution. In cardiac electrophysiology, restitution refers to the property by which parameters such as the duration of an electrical action potential (APD) or the conduction velocity (CV) of a propagating signal vary with time between successive stimuli applied to excitable cardiac tissue. In order to study restitution, the model was extended to higher spatial dimension.
To simulate wave propagation in 1 dimension and above, we added a diffusion term to Equation 1, such that the spatiotemporal evolution of the voltage is given by
We used a value 0.00126 cm2/ms for the diffusion coefficient D. This choice of D allowed our model to reproduce the experimentally observed conduction velocity of 58 cm/s from Jang et al. (2019).
For numerical integration of Equation (17), we used a Forward Time Centered Space (FTCS) scheme, with a space differential Δx = Δy = 0.022 cm. The timestep chosen for the simulations was Δt = 0.02 ms and all coding was done using Python or C, with MPI-based parallelization.
The amount of time, during an action potential, when the membrane voltage of an excited cardiac cell is more positive than a chosen threshold, is called the action potential duration (APD) at that threshold. Typically, this threshold value is measured on the basis of degree of repolarisation of the cell membrane. Thus, APDX refers to the amount of time during an AP, when the cell membrane is more than X% repolarised, or, less than X% depolarised.
When cardiac tissue is electrically stimulated using a train of pulses at a particular frequency, the morphology of the AP adapts to the applied pacing frequency. This reflects in the APA, RMP, and APD values at all possible levels of repolarization. Such studies are conducted to investigate the restitution behavior of the model or the tissue sample. We performed sharp-electrode measurements on pig atrial tissue to obtain APD restitution (APDR) data. We used these data to make final adjustments to the model, to perfect its electrical response to high frequency stimulation. In both experiments and simulations, pig atrial tissue was stimulated at 0.25, 0.5, 1, 2, 3, 4Hz, and action potentials were recorded.
We adjusted model parameters to find the most optimal parameter set that simultaneously fit each of these restitution curves with minimal deviation from measurement. Specifically, we adjusted the maximum conductance values of several currents. The final selection of conductance values is listed in Table 2.
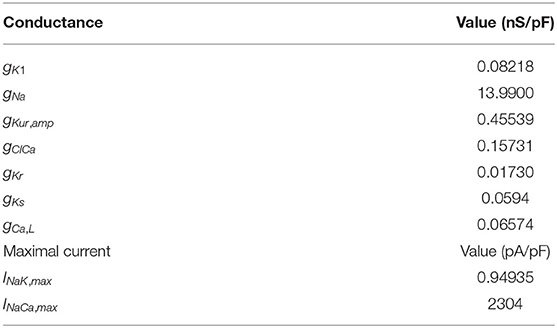
Table 2. Conductance values and maximal currents after fitting restitution data.
The overlays of our experimental and simulated data for each of the following parameters: APA, RMP, , and APDX, for X = 10, 20, 30, 40, 50, 60, 70, 80, and 90% repolarization are shown in Figure 7.
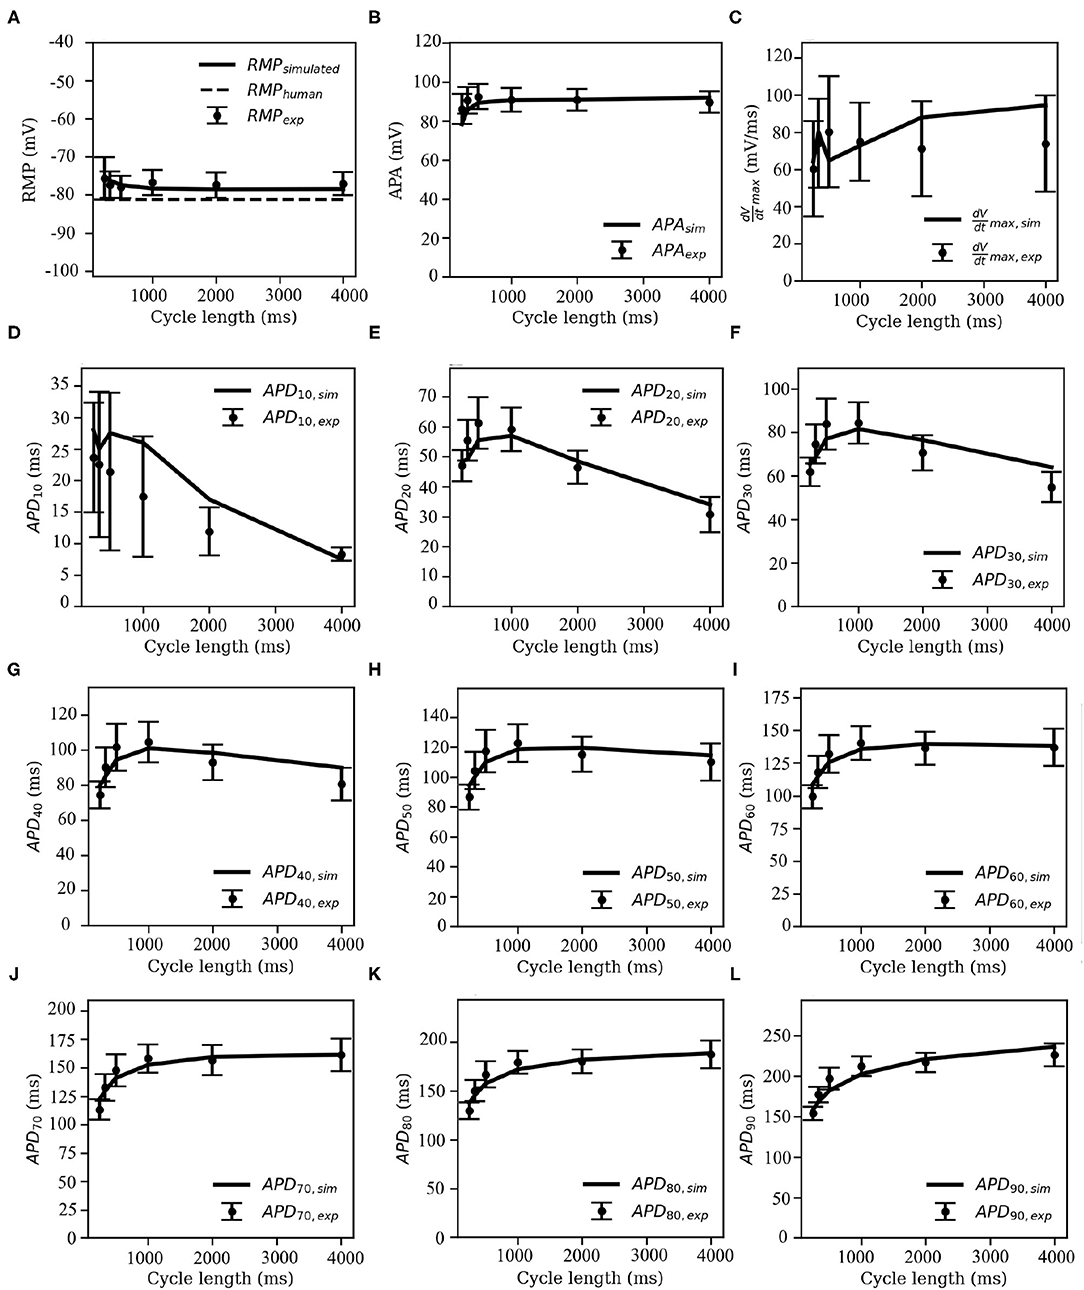
Figure 7. Restitution curves for (A) resting membrane potential (RMP), (B) action potential amplitude (APA), (C) maximum upstroke velocity (), and (D–L) action potential duration (APDX), at X = 10, 20, 30, 40, 50, 60, 70, 80, and 90% repolarisation of the membrane voltage. Solid black lines indicate the model-generated data, whereas the markers (with error bars) represent our data obtained from sharp-electrode experiments.
Note that pig APDR curves show an interesting feature that distinguishes the model from most other mammalian species that we know of. In the early stages of repolarisation (i.e., up to APD50), an overall downward trend is observed for stimulation cycle lengths greater than 1,000 ms (see Figures 7D–H). This could be due to inactivation of IClCa at high pacing frequencies: slower and lesser calcium uptake causes a decrease in IClCa, which significantly slows down initial AP repolarization, causing an overall higher early APD at high pacing frequencies with respect to low-frequency pacing.
To test this hypothesis, we measured intracellular calcium flux and IClCa in simulated restitution experiments. Figure 8 shows the resulting restitution curves for peak calcium flux and peak IClCa at different stimulation cycle lengths in the simulated model. A clear dependence of peak values on cycle length can be observed, and both quantities decrease significantly with a decrease in cycle length. This is indeed indicative of an initial AP repolarization phase that is heavily dependent on calcium dynamics. To the best of our knowledge, this behavior is exclusive to the pig, and might have profound implications in the translatability of studies on arrhythmia control and termination from pigs to other species.
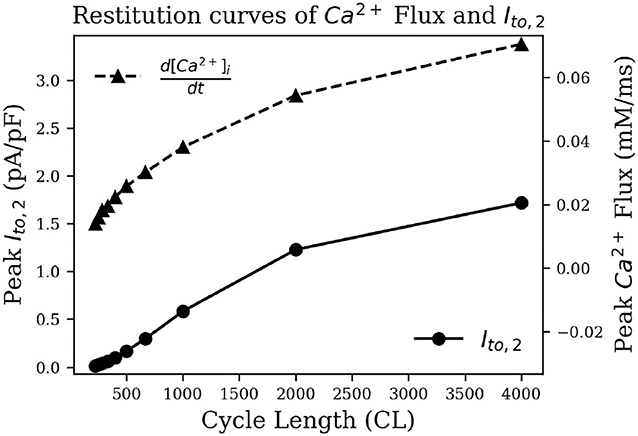
Figure 8. Restitution curve of peak intracellular calcium flux (dashed) and peak IClCa (solid).
To summarize, the pig atrial model is capable of reproducing experimentally recorded porcine APs at different pacing frequencies within experimental deviations (Figures 9A,E–G). The discrepancies between the experimental traces show the variable nature of electrophysiology, in particular in the atria (Cherry and Fenton, 2007), and the model is good at finding a compromise and reproducing an AP with average traits within experimental tolerances. Figures 9B–D show the temporal evolution of each of the transmembrane currents considered in Equation (2). With this basic model, we now begin our study of electrical wave propagation at the tissue level.
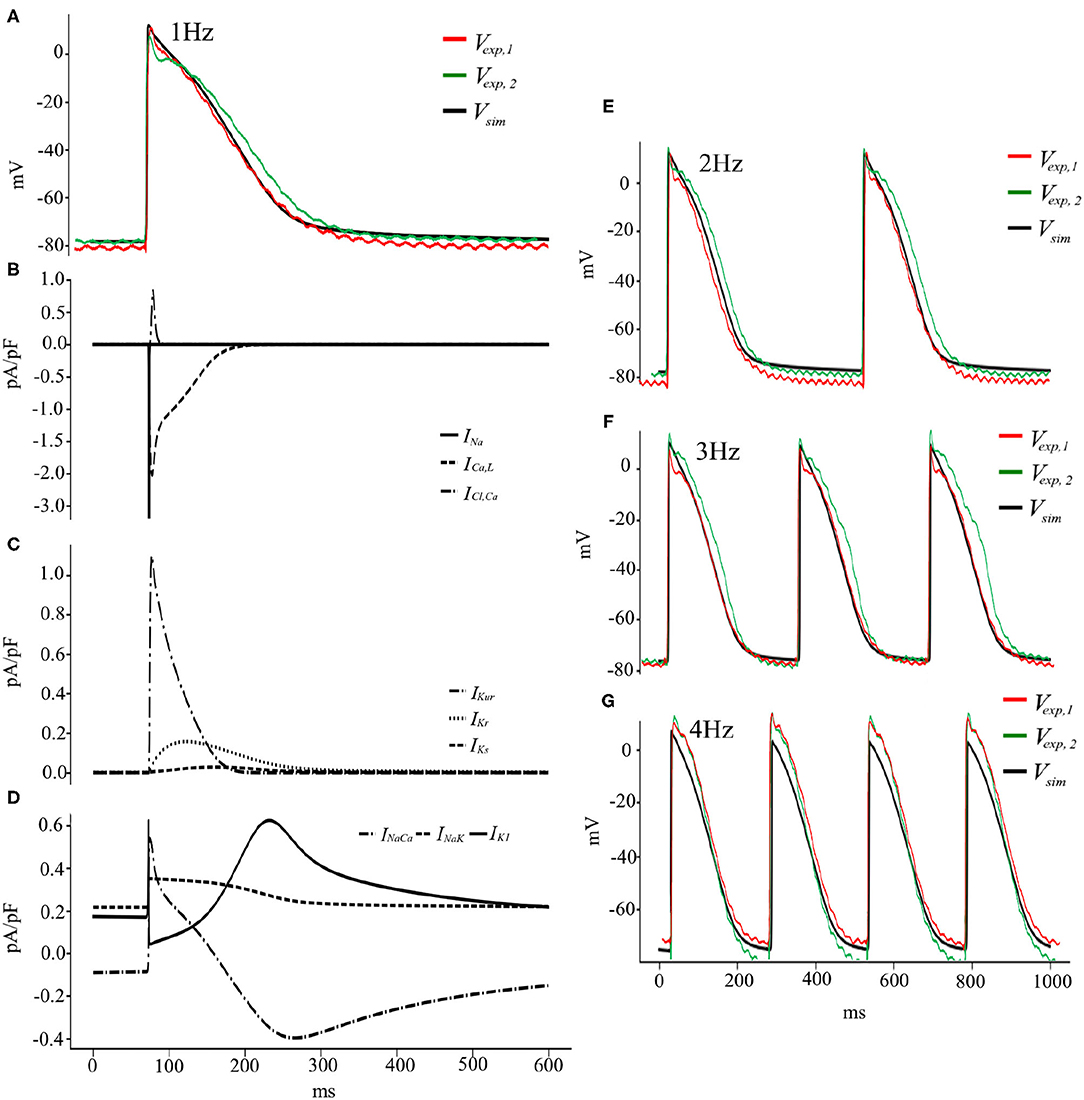
Figure 9. (A) Voltage and Current traces (B–D) of a pig atrial action potential at 1 Hz pacing. Simulated (solid black) and experimentally measured (green and red) traces of AP recordings from cardiac tissue. (E–G) Voltage traces, both simulated (black) and experimental (green and red), at pacing frequencies of 2, 3, and 4 Hz, respectively.
Electrical stimulation of a quiescent 2D domain containing pig atrial cardiomyocytes leads to propagation of an excitation wave. Our studies confirm that at frequencies below 5 Hz, the paced waves propagate with uniform and identical wavefront and waveback conduction velocity. Electrical pacing at higher frequencies does not lead to 1:1 capture. This is because the effective refractory period of the cells is approximately 215 ms. Figure 10A shows snapshots of plane wave propagation through a 2D domain containing identical pig atrial cardiomyocytes. The simulated wavelength (WL, estimated as WL = (t|back, −40mV−t|wavefront) × CV) and CV restitution curves are presented in Figures 10B,C.
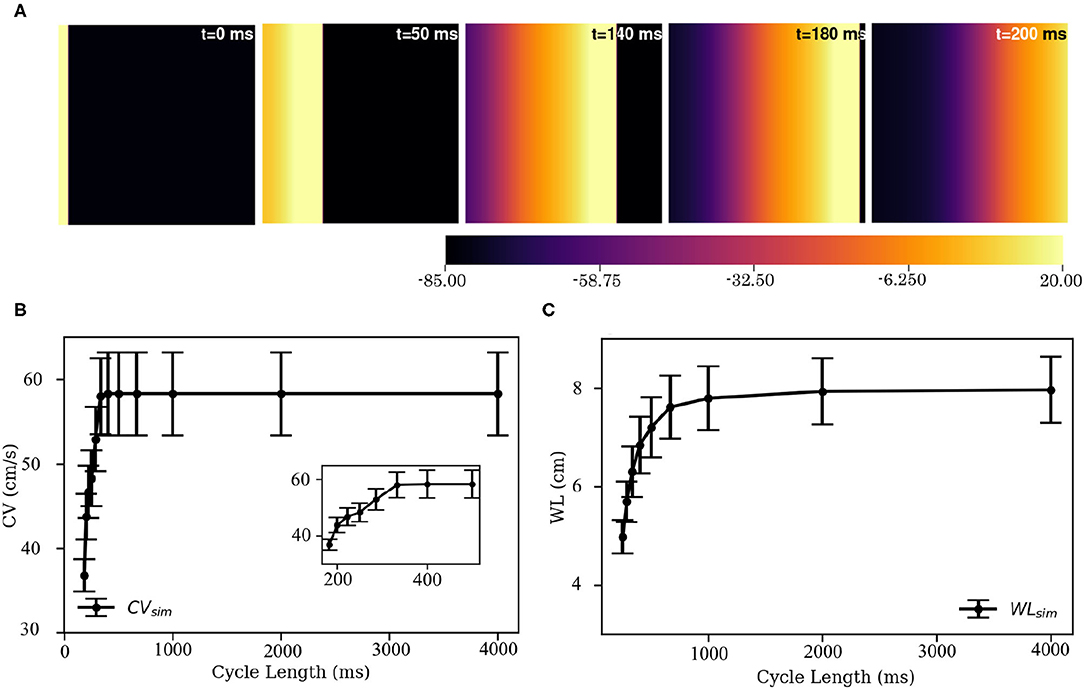
Figure 10. Propagation of a plane wave through simulated 2D pig atrial tissue. (A) Shows snapshots of the propagating wave at different times. (B,C) Show the conduction velocity (CV) and wavelength (WL) restitution curves, as obtained from simulations.
Using the reported parameter set in our 2D model, we produced a spiral wave that survived for more than 40 s of simulation time. To initiate a spiral wave in a domain containing 512 × 512 grid points, we used the S1–S2 cross field protocol. We applied a line stimulus along the left edge of the domain to initiate a plane wave (S1) propagating toward the right (Figure 10A). As the waveback of the S1 wave crossed x = 256, a second stimulus (S2) is applied in the region y ≤ 256 (Figure 11A, t = 240 ms). This leads to propagation of the S2 wave in the region that has recovered from excitation. With time, as the wave S1 wave moves out of the domain, more excitable tissue becomes available and a spiral prototype is formed (Figure 11A, t = 280 ms). Figure 11A shows the spatiotemporal formation and evolution of the spiral.
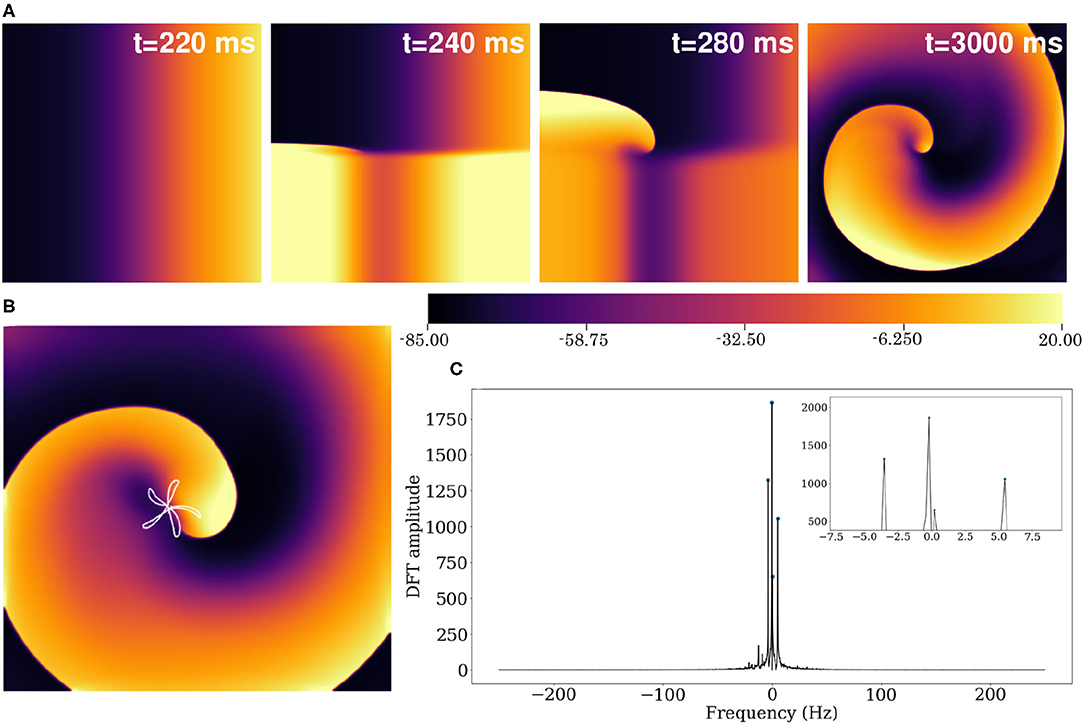
Figure 11. (A) Formation of spiral waves in a 2D pig atrial tissue of size 11.26 × 11.26 cm2. Here t = 0 is considered as the time instant at which the S1 wave is initiated (as in Figure 10A). (B) Hypocycloid pattern of the spiral tip trajectory. (C) Amplitude of the Discrete Fourier Transform (DFT) of the tip trajectory. The sampling frequency is Fs = 500 Hz, and the corresponding resolution Δf = 0.2089 Hz. The inset shows the 4 main peaks of the DFT.
The spiral wave in the pig atrial tissue model meanders with a shifting hypocycloidal trajectory. The trajectory of the tip of the spiral was traced by connecting the points of intersection of the isopotential line V = −35 mV and the line dV/dt = 0 at each snapshot, spaced 10 ms apart in time. An analysis of the tip trajectory shows that the basic pattern contains 5 outward petals enclosing a center (see Figure 11B), which shifts in space at the end of every 5 rotational cycles. A Fourier analysis of the tip trajectory reveals the existence of 4 fundamental frequencies (see Figure 11C), of which f0 = 5.426Hz and f1 = −3.548Hz are the dominant ones. These contribute to the construction of the basic hypocycloidal pattern, through superposition of the two counter-rotating circular orbits at the given frequencies, where the radii of the orbits are proportional to the heights of the peaks obtained from the Fourier Transform of the trajectory.
A visual impression of the spatio-temporal distribution of membrane tension during spiral wave evolution (Supplementary Video S1) indicated the occurrence of wavelength fluctuations, as opposed to a constant, uniform wavelength observed during plane wave propagation. To quantify this effect, we measured APD90 from every 8th node within the simulation domain in X- and Y- directions. We excluded points from the region that was close to the spiral tip.
Figure 12 shows the restitution curves of APD90 in the simulated spirals, both with respect to Cycle Length (CL) (Figure 12A) and Diastolic Interval (DI) (Figure 12B). Figure 12A shows the presence of alternans for cycle lengths in the range ≡ 165-215 ms. This is consistent with the restitution curve in Figure 12B, which focuses on the region with slope ≃1, a known predictor of the presence of alternans (Nolasco and Dailen, 1968). In a previous work Fakuade et al. (2021) demonstrated the occurrence of alternans at low stimulation frequencies in patients suffering from postoperative AF. Thus, our model can be used to develop useful insights into the origin and control of this alternans in pig atria.
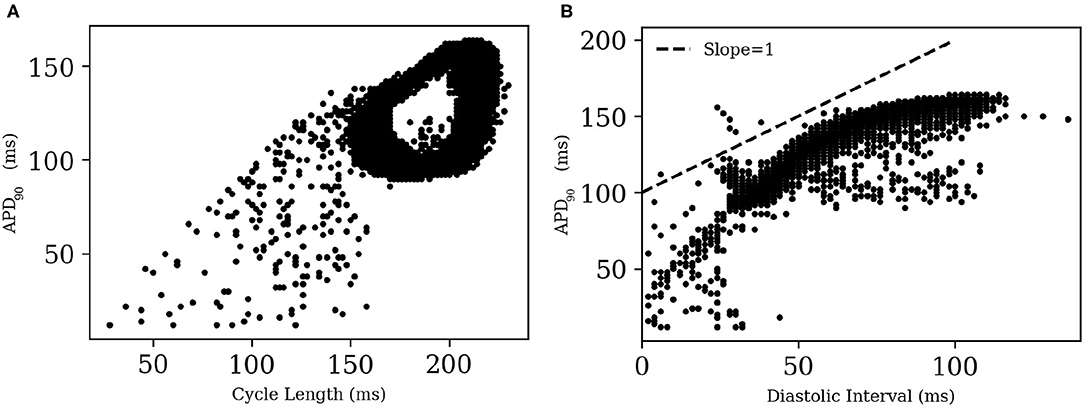
Figure 12. Restitution curves for APD90 in (A) a simulated spiral with respect to Cycle Length and (B) Diastolic Interval. The dashed line in (B) indicates the region of slope = 1.
To test if the unique current IClCa is responsible for alternans in the pig atrial model, we followed an approach that was first proposed by Gomis-Tena et al. (2003). Accordingly, we inhibited the IClCa (by 50 and 90% in two separate cases) in pig atrial model and re-initiated the spiral. However, unlike Gomis-Tena et al. (2003), alternans continued to exist in our model. APs in the simulated spiral have a duration of at most ≃ 225 ms. Referring back to Figure 8, we can see that IClCa is naturally already shut off at such small cycle lengths, and any further inactivation will obviously have a negligible effect on the behavior of the resulting spiral.
Finally, we arrive at the most challenging question. Is it possible to use this model to study atrial fibrillation, with the spiral waves actually breaking up? The answer is, yes. The model does exhibit a state of sustained chaotic electrical activity in an altered parameter regime. Spiral wave breakup could be initiated by suppressing the repolarization reserve. In particular, a reduction of 75% in the value of gKr, max could lead to a state characterized by more than six spiral waves. The spatiotemporal evolution of the spiral breakup state is demonstrated in Figure 13 and in Supplementary Video S2.
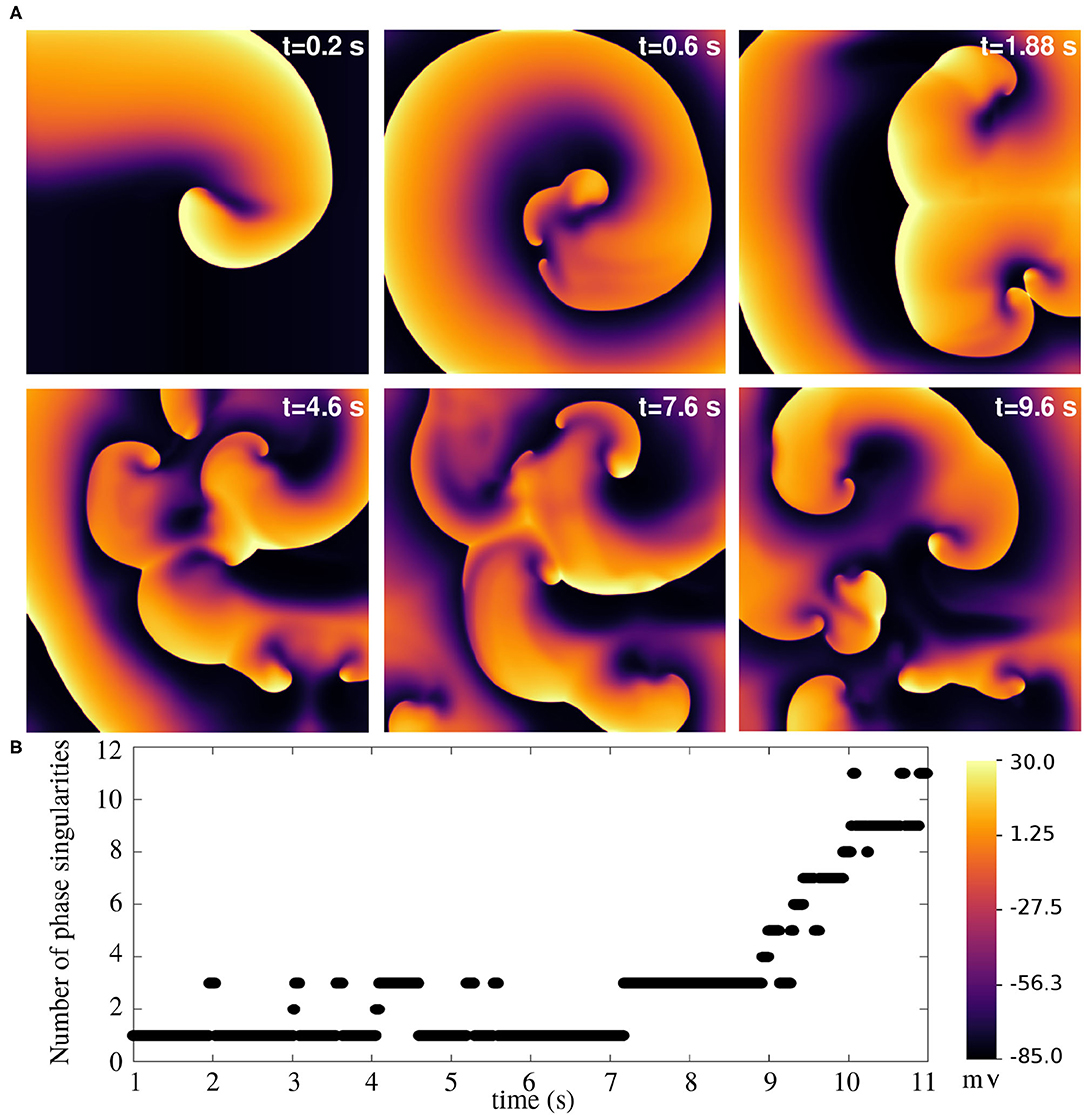
Figure 13. Spiral wave breakup in a 2D pig atrial tissue of size 11.26 × 11.26 cm2 with GKr,max reduced to 0.25x its value in the healthy pig model. (A) Pseudocolour plots of the membrane voltage distribution at different times demonstrates the occurrence of multiple spiral waves in the domain. (B) Quantification of number of spiral waves in the domain at various times, measured as the number of phase singularities (one located at each spiral tip).
In this study, we present the first complete mathematical model of the pig atrial tissue. It is built upon experimental data on pig atria as obtained from literature, and new sharp-electrode data that was produced in our laboratory. The model is numerically stable over long timescales, and is capable of reproducing pig atrial action potentials that can be compared closely with experiments. In particular, the AP characteristics, namely APD, CV, RMP, APA, and show excellent agreement with experiments, not only for a single evoked AP, but also for the full extent of their respective restitution curves. This confirms that our model is capable of reproducing the exact electrical response as can be expected from healthy pig atrial cardiomyocytes.
Our model takes into consideration the uniqueness of the constitution of the transient outward current. In most mammalian tissue, this current is found to be predominantly K+ based. However, in pig atria, this current is solely Cl−-based and activated by the flow of Ca2+ ions. The unique dynamics of this current results in a downward trend of the early repolarization APD restitution curves; a feature that is not observed in most mammalian species. Our model reproduces this experimental trend in early APD restitution curves for large cycle lengths, and attributes the trend to the inactivation of the IClCa at low cycle lengths (Li et al., 2004).
In 2D, we demonstrate the model's ability to sustain stable spiral waves and spiral wave breakup, which adds to the suitability of the model for in silico studies of AF in extended media. To study spiral wave dynamics in the default model representing healthy heart tissue, we used simulation domains that are physically large compared to realistic tissue sizes. Our motivation for choosing such domains is based on the concept presented by Panfilov (2006). He showed that the pattern of stabilization of re-entries in cardiac tissue is not determined by the actual size of the heart per se, but by the effective size measured as heart size scaled by the wavelength of electrical activity. This means that in healthy tissue, where the wavelength of electrical activity is relatively large, it is difficult (almost impossible) to obtain self-sustaining spirals. In our default model, the wavelength of the spiral was so large that it was not possible to obtain stable spirals in tissue domains smaller than 8.5 x 8.5 cm. A Fourier analysis of the tip trajectory shows that there are 4 fundamental frequencies responsible for the dynamics of the intact spiral wave. Of these frequencies, one is associated with wave meander at fmeander≃ 0.1 Hz, two are associated with the hypocycloid pattern, f0 = 5.426 Hz and f1 = 3.548 Hz, with one of those frequencies also being the frequency of rotation of the spiral arm (and thus setting the average stimulation frequency). Furthermore, our model points to the occurrence of alternans in 2D in the presence of spiral waves, between the cycle lengths of 165 ms and 215 ms. This may explain the difficulty encountered in experiments with evoking consistent APs at a pacing frequency of 5 Hz. To understand the underlying basis of this alternans, we tested an approach suggested by Gomis-Tena et al. (2003), who inhibited the Ca2+-activated Cl− current in their canine model to inhibit alternans. Our model, however, failed to show suppression of alternans by similar inhibition of the IClCa, suggesting that the alternans was not driven by the Cl− current.
The model presented here has the same general limitations as any other ionically-detailed mathematical model of cardiac electrophysiology. We have tried to incorporate as much porcine specificity to the model as is allowed by the available experimental data. However, there are quite a few currents for which direct validation was not possible, forcing us to resort to indirect methods for model development. In our model, as listed in detail in Table 1, experimental data on current voltage characteristics was available for currents like IKur, IKr, IKs and Ito. For the remaining currents, we found little or no clear information from literature. For INa, we had to rely on the APA- and dV/dtmax restitution curves for obtaining the correct value of gNa, assuming that the channel kinetics were the same as in the human atrial cell model. For IK1 we relied on the RMP restitution curve and the APD restitution curves at 80–90% repolarization to formulate the current. We had no information about the Ca2+ dynamics. Therefore, it was adopted in its entirety from the Luo-Rudy dynamic model. Same applied for the pump and exchanger currents, whose maximum values we tuned based on our APD restitution data at 70–90% repolarization. Regarding the L-type Ca2+ current, the only information we had was our own data from patch-clamp recordings, which verfied that the maximum conductance used was in line with what we had chosen for the model. As previously discussed by Cherry and Fenton (2007), detailed mathematical models need to be treated with extreme considerations to appreciate their ability to correctly reproduce phenomena outside the general experimental conditions they were modeled after, and their main utility should be in developing new hypotheses in the study of already-known phenomena, rather than for the study of the dynamics of novel, unverified phenomena.
The model falls prey to the natural variability found in cardiac tissue, especially in the atria. The atrial cavities are particularly complex, more so than the ventricles, when it comes to heterogeneity and anisotropy, and the properties of cardiomyocytes are known to be affected by factors like age or sex (Cherry and Fenton, 2007). In the context of this project, this is evidently palpable in the description of IKur given in the two published papers used as sources in this model, which differ significantly, and it highlights some of the compromises that researchers must make when building a general model. In addition to intrinsic ionic heterogeneities in the heart tissue, structural factors are also known to play an important role in destabilizing reentrant electrical waves in the atria, leading to AF. A recent study by Roy et al. (2018) demonstrates how the gradients in the atrial wall thickness and tissue fibrosis can cause drifting of spiral waves across the left and right atria, resulting in AF. In another study Boyle et al. (2019) report that in patients with persistent AF who develop atrial fibrosis targeted ablation of fibrotic patches can reduce the risk of sustained AF, thereby indicating that structural heterogeneities, such as those introduced by fibrosis, play a major role in stabilizing AF.
Some of the limitations of the model come from the fact that it relies on experiments from literature for the description of individual currents, which sometimes have incomplete data (lack of information of the time dynamics of the currents, for example Li et al., 2004), or which have fundamentally different experimental setups (Li et al., 2004; Ehrlich et al., 2006). However, this model provides a good basis to start, and can be develeoped further, as and when new experimental data become available. Another important limitation of the model lies in its description of the Ca2+ dynamics, which is mostly taken from the human atrial model of Courtemanche et al.. The CRN model itself adapts the description of the Ca2+ dynamics from the Luo-Rudy model for guinea pig ventricular cardiomyocytes (Courtemanche et al., 1998). Thus the Ca2+-dynamics cannot be called state-of-the-art. Although it does give rise to physiologically relevant pig atrial action potentials, the model does not provide any significant insight to the fundamental role that Ca2+ plays in mediating IClCa (Ito) and early AP repolarization. It would therefore be of great interest to make detailed experimental measurements on Ca2+ dynamics specific for the pig atria, with the aim of building a more accurate mathematical description to elucidate the mechanisms underlying the dynamics of IClCa and to make more accurate predictions of its behavior in arrhythmias.
Proposing the single cell model is just the first step. We have taken one step further to extend the model to 2D, where at least we can expect it to reproduce electrophysiological behavior of monolayer cell cultures. The next steps would include incorporation of natural cellular heterogeneity of cardiac tissue, together with structural heterogeneity, such as fibrosis. These are currently not addressed in our paper. Furthermore, we are trying to develop an anatomically detailed 3D atrial model of the pic heart, based on DTMRI data, which would describe the intrinsic fiber anisotropy. A study of AF in such anisotropic, realistic heart geometries would have a huge impact on the advancement of arrhythmia research.
The original contributions presented in the study are included in the article/Supplementary Material, further inquiries can be directed to the corresponding author/s.
The animal study was reviewed and approved by Federation of European Laboratory Animal Science Associations (FELASA). All scientists and technicians involved have been accredited by the responsible Ethics Committee (Lower Saxony State Office for Consumer Protection and Food Safety-LAVES).
VP-Y and RM: designed and developed the model and wrote the article. TR, FF, and NV: conceived and carried out the restitution experiments. VP-Y, RM, SL, TR, FF, and NV: read and reviewed the manuscript. SL and NV: acquired funding. All authors contributed to the article and approved the submitted version.
This work was supported by research grants from the DZHK to NV (81X4300102 and SE181) and from the Deutsche Forschungsgemeinschaft (DFG) to NV (VO 1568/3-1, VO 1568/4-1, IRTG1816, SFB1002, and under Germany's Excellence Strategy—EXC 2067/1—390729940), and to SL [German Center for Cardiovascular Research (DZHK), Project MD 28 grant no. 81Z0300403/81Z0300114 and German Research Foundation (Research Centre SFB 1002, Project C3)]. The funders had no role in study design, data collection and analysis, decision to publish, or preparation of the manuscript.
The authors declare that the research was conducted in the absence of any commercial or financial relationships that could be construed as a potential conflict of interest.
All claims expressed in this article are solely those of the authors and do not necessarily represent those of their affiliated organizations, or those of the publisher, the editors and the reviewers. Any product that may be evaluated in this article, or claim that may be made by its manufacturer, is not guaranteed or endorsed by the publisher.
VP-Y would like to thank Prof. Blas Echebarria for useful discussions.
The Supplementary Material for this article can be found online at: https://www.frontiersin.org/articles/10.3389/fphys.2022.812535/full#supplementary-material
Aguilar, M., Feng, J., Vigmond, E., Comtois, P., and Nattel, S. (2017). Rate-dependent role of ikur in human atrial repolarization and atrial fibrillation maintenance. Biophys. J. 112, 1997–2010. doi: 10.1016/j.bpj.2017.03.022
Bondarenko, V., Szigeti, G., Bett, G., Kim, S., and Rasmusson, R. (2004). Computer model of action potential of mouse ventricular myocytes. Am. J. Physiol. Heart Circ. Physiol. 287, H1378–H1403. doi: 10.1152/ajpheart.00185.2003
Boyle, P., Zghaib, T., Zahid, S., Ali, R., Deng, D., Franceschi, W., et al. (2019). Computationally guided personalized targeted ablation of persistent atrial fibrillation. Nat. Biomed. Eng. 3, 870–879. doi: 10.1038/s41551-019-0437-9
Butters, T. D., Aslanidi, O. V., Zhao, J., Smaill, B., and Zhang, H. (2013). A novel computational sheep atria model for the study of atrial fibrillation. Interface Focus 3, 20120067. doi: 10.1098/rsfs.2012.0067
Cherry, E. M., and Fenton, F. H. (2007). A tale of two dogs: analyzing two models of canine ventricular electrophysiology. Am. J. Physiol. Heart Circ. Physiol. 292, H43–H55. doi: 10.1152/ajpheart.00955.2006
Clauss, S., Schüttler, D., Bleyer, C., Vlcek, J., Shakarami, M., Tomsits, P., et al. (2020). Characterization of a porcine model of atrial arrhythmogenicity in the context of ischaemic heart failure. PLoS ONE 15, e0232374. doi: 10.1371/journal.pone.0232374
Courtemanche, M., Ramirez, R., and Nattel, S. (1998). Ionic mechanisms underlying human atrial action potential properties: insights from a mathematical model. Am. J. Physiol. Heart Circ. Physiol. 275, H301–H321. doi: 10.1152/ajpheart.1998.275.1.H301
Ehrlich, J. R., Hoche, C., Coutu, P., Metz-Wiedmann, C., Dittrich, W., Hohnloser, S. H., et al. (2006). Properties of a time-dependent potassium current in pig atrium-evidence for a role of kv1.5 in repolarization. J. Pharmacol. Exp. Ther. 319, 898–906. doi: 10.1124/jpet.106.110080
Fakuade, F., Steckmeister, V., Seibertz, F., Gronwald, J., Kestel, S., Menzel, J., et al. (2021). Altered atrial cytosolic calcium handling contributes to the development of postoperative atrial fibrillation. Cardiovasc. Res. 117, 1790–1801. doi: 10.1093/cvr/cvaa162
Gomis-Tena, J., and Saiz, J. (1998). Role of ca-activated cl currents in the heart: a computer model. Comput. Cardiol. 26, 109–112.
Gomis-Tena, J., Saiz, J., and Ferrero, J. (2003). Inhibition of atrial action potentials alternans by calcium-activated chloride current blockade - simulation study. Comput. Cardiol. 30, 421–424. doi: 10.1109/CIC.2003.1291182
Hiraoka, M., Kawano, S., Hirano, Y., and Furukawa, T. (1998). Role of cardiac chloride currents in changes in action potential characteristics and arrhythmias. Cardiovasc. Res. 40, 23–33. doi: 10.1016/S0008-6363(98)00173-4
Jang, J., Whitaker, J., Leshem, E., Ngo, L. H., Neisius, U., Nakamori, S., et al. (2019). Local conduction velocity in the presence of late fadolinium enhancement and myocardial wall thinning. Circ. Arrhythm. Electrophysiol. 12, e007175. doi: 10.1161/CIRCEP.119.007175
Lee, A., Miller, J., Voeller, R., Zierer, A., Lall, S., Schuessler, R. Jr, R. D., et al. (2016). A simple porcine model of inducible sustained atrial fibrillation. Innovations (Phila) 11, 76–78. doi: 10.1097/imi.0000000000000230
Li, G.-R., Du, X.-L., Siow, Y. L., Karmin, O., Tse, H.-F., and Lau, C.-P. (2003). Calcium-activated transient outward chloride current and phase 1 repolarization of swine ventricular action potential. Cardiovasc. Res. 58, 89–98. doi: 10.1016/S0008-6363(02)00859-3
Li, G.-R., Sun, H., To, J., Tse, H.-F., and Lau, C.-P. (2004). Demonstration of calcium-activated transient outward chloride current and delayed rectifier potassium currents in swine atrial myocytes. J. Mol. Cell Cardiol. 36, 495–504. doi: 10.1016/j.yjmcc.2004.01.005
Luo, C., and Rudy, Y. (1994). A dynamic model of the cardiac ventricular action potential. Circ. Res. 74, 1071–1096. doi: 10.1161/01.RES.74.6.1071
Majumder, R., Jangsangthong, W., Feola, I., Ypey, D. L., Pijnappels, D. A., and Panfilov, A. V. (2016). A mathematical model of neonatal rat atrial monolayers with constitutively active acetylcholine-mediated k+ current. PLoS Comput. Biol. 12, e1004946. doi: 10.1371/journal.pcbi.1004946
Nolasco, J., and Dailen, R. W. (1968). A graphic method for the study of alternation in cardiac action potentials. J. Appl. Physiol. 25, 191–196. doi: 10.1152/jappl.1968.25.2.191
Pandit, S., Clark, R., Gile, W., and Demir, S. (2001). A mathematical model of action potential heterogeneity in adult rat left ventricular myocytes. Biophys. J. 81, 3029–3051. doi: 10.1016/S0006-3495(01)75943-7
Pandit, S. V., Zlochiver, S., Filgueiras-Rama, D., Mironov, S., Yamazaki, M., Ennis, S. R., et al. (2011). Targeting atrioventricular differences in ion channel properties for terminating acute atrial fibrillation in pigs. Cardiovasc. Res. 89, 843–851. doi: 10.1093/cvr/cvq359
Panfilov, A. V.. (2006). Is heart size a factor in ventricular fibrillation? or how close are rabbit and human hearts? Heart Rhythm. 3, 862–864. doi: 10.1016/j.hrthm.2005.12.022
Ramirez, R., Nattel, S., and Courtemanche, M. (2000). Mathematical analysis of canine atrial action potentials: rate, regional factors, and electrical remodeling. Ame. J. Physiol. Heart Circ. Physiol. 279, H1767–H1785. doi: 10.1152/ajpheart.2000.279.4.H1767
Roy, A., Varela, M., and Aslanidi, O. (2018). Image-based computational evaluation of the effects of atrial wall thickness and fibrosis on re-entrant drivers for atrial fibrillation. Front. Physiol. 9, 1352. doi: 10.3389/fphys.2018.01352
Schultz, J.-H., Volk, T., Bassalaý, P., Hennings, C. J., Hübner, C. A., and Ehmke, H. (2007). Molecular and functional characterization of kv4.2 and kchip2 expressed in the porcine left ventricle. Eur. J. Physiol. 454, 195–207. doi: 10.1007/s00424-006-0203-1
Tseng, G.-N., and Hoffman, B. F. (1989). Two components of transient outward current in canine ventricular myocytes. Circ. Res. 64, 633–647. doi: 10.1161/01.RES.64.4.633
Virtanen, P., Gommers, R., Oliphant, T. E., Haberland, M., Reddy, T., Cournapeau, D., et al. (2020). SciPy 1.0: fundamental algorithms for scientific computing in python. Nat. Methods 17, 261–272. doi: 10.1038/s41592-020-0772-5
Wang, L. J., and Sobie, E. A. (2008). Mathematical model of the neonatal mouse ventricular action potential. Am. J. Physiol. Heart Circ. Phisiol. 294, H2565–H2575. doi: 10.1152/ajpheart.01376.2007
Wang, Z., Fermini, B., and Nattel, S. (1987). Two types of transient outward currents in adult human atrial cells. Am. J. Physiol. 252, H142–H148. doi: 10.1152/ajpheart.1987.252.1.H142
Wang, Z., Fermini, B., and Nattel, S. (1993). Delayed rectifier outward current and repolarization in human atrial myocytes. Circ. Res. 73, 276–285. doi: 10.1161/01.RES.73.2.276
Xu, Y., Dong, P.-H., Zhang, Z., Ahmmed, G. U., and Chiamvimonvat, N. (2002). Presence of a calcium-activated chloride current in mouse ventricular myocytes. Am. J. Physiol. Heart Circ. Physiol. 283, H302–H314. doi: 10.1152/ajpheart.00044.2002
Keywords: ionic model, pig atria, spiral waves, large animal, cardiac electrophysiology
Citation: Peris-Yagüe V, Rubio T, Fakuade FE, Voigt N, Luther S and Majumder R (2022) A Mathematical Model for Electrical Activity in Pig Atrial Tissue. Front. Physiol. 13:812535. doi: 10.3389/fphys.2022.812535
Received: 10 November 2021; Accepted: 28 January 2022;
Published: 10 March 2022.
Edited by:
Richard David Walton, Université de Bordeaux, FranceReviewed by:
Arun V. Holden, University of Leeds, United KingdomCopyright © 2022 Peris-Yagüe, Rubio, Fakuade, Voigt, Luther and Majumder. This is an open-access article distributed under the terms of the Creative Commons Attribution License (CC BY). The use, distribution or reproduction in other forums is permitted, provided the original author(s) and the copyright owner(s) are credited and that the original publication in this journal is cited, in accordance with accepted academic practice. No use, distribution or reproduction is permitted which does not comply with these terms.
*Correspondence: Rupamanjari Majumder, cnVwYW1hbmphcmkubWFqdW1kZXJAZHMubXBnLmRl
Disclaimer: All claims expressed in this article are solely those of the authors and do not necessarily represent those of their affiliated organizations, or those of the publisher, the editors and the reviewers. Any product that may be evaluated in this article or claim that may be made by its manufacturer is not guaranteed or endorsed by the publisher.
Research integrity at Frontiers
Learn more about the work of our research integrity team to safeguard the quality of each article we publish.