 Xiaolong Gao1,2†Shihui Lin1,2†Mo Zhang1,2Mingxin Lyu1,2Yafeng Liu3Xuan Luo1,2Weiwei You1,2Caihuan Ke1,2*
- 1State Key Laboratory of Marine Environmental Science, College of Ocean and Earth Sciences, Xiamen University, Xiamen, China
- 2Fujian Key Laboratory of Genetics and Breeding of Marine Organisms, Xiamen University, Xiamen, China
- 3College of Life Science and Technology, Huazhong University of Science and Technology, Wuhan, China
The light environments of natural water sources have specific characteristics. For the majority of aquatic organisms, vision is crucial for predation, hiding from predators, communicating information, and reproduction. Electroretinography (ERG) is a diagnostic method used for assessing visual function. An electroretinogram records the comprehensive potential response of retinal cells under light stimuli and divides it into several components. Unique wave components are derived from different retinal cells, thus retinal function can be determined by analyzing these components. This review provides an overview of the milestones of ERG technology, describing how ERG is used to study visual sensitivity (e.g., spectral sensitivity, luminous sensitivity, and temporal resolution) of fish, crustaceans, mollusks, and other aquatic organisms (seals, sea lions, sea turtles, horseshoe crabs, and jellyfish). In addition, it describes the correlations between visual sensitivity and habitat, the variation of visual sensitivity as a function of individual growth, and the diel cycle changes of visual sensitivity. Efforts to identify the visual sensitivity of different aquatic organisms are vital to understanding the environmental plasticity of biological evolution and for directing aquaculture, marine fishery, and ecosystem management.
Principles of Visual Electrophysiology
The retina is an important tissue that perceives external optical information and converts it to visual information. In vertebrates, after entering the eye, light passes through the refractive medium in front of the retina before reaching the retina. The photoreceptor cells at the outer end of the retina convert light photon signals into electrical signals, which ultimately form visual signals through integrative processing using bipolar cells, optic ganglion cells, horizontal cells, and amacrine cells. These visual signals are transmitted to the optical center via the optic nerve to produce vision (Evans and Browman, 2004; Lorber et al., 2016).
Using a specific electronic instrument, electroretinography (ERG) records electrical potential changes in the retina when it is subjected to light stimuli. Flash ERG is commonly described in terms of several discrete components (Figure 1B). Under light stimuli, the retina initially produces a small negative wave (also referred to as the a-wave). If the intensity of light stimuli is large enough, an early receptive potential (ERP), composed of two oppositely polarized waves, will appear before the a-wave. This is followed by a positive b-wave and a set of rhythmic wavelets with higher frequencies and lower amplitudes superimposed on the rising branch of the b-wave (also referred to as oscillating potentials). A positive wave with slower rise, called a c-wave, also occurs. As the light stimulus ends, a positive upward protrusion, or d-wave, can be detected. All these waves are derived from different components (i.e., cells) of the retina (Figure 1A). The a-wave is mainly derived from photoreceptor cells; light absorption by these cells triggers conformational changes of photosensitizing pigments, thereby triggering the cascade of G proteins and closure of the cGMP-activated cation channel, which reduces the influx of Na+ and Ca2+ and leads to hyperpolarization of the membrane (Graham and Klistorner, 1998). The b-wave is primarily associated with the activity of depolarized bipolar cells (Pardue and Peachey, 2014). The c-wave consists of the superposition of two oppositely polarized potentials; one is the positive potential resulting from hyperpolarization of the retinal pigment epithelium apical membrane, and the other is the negative potential resulting from Müller glial cells (Tarchick et al., 2016). The d-wave is an off-response associated with the activity of photoreceptors and Müller cells (Ueno et al., 2006). The ERP originates from the outer segment of the photoreceptor and results from intramolecular electron transfer, which is triggered by changes in the configuration of visual pigment molecules during light stimuli (Fei and Fang, 1989). Oscillatory potentials are related to the action between bipolar cells, amacrine cells, and ganglion cells in the inner retina. The amplitude of a–d waves varies with the duration and intensity of light stimuli and the adaptive conditions of the retina. However, the b-wave is a positive phase response that is most sensitive to variations of external factors, thus it can indirectly reflect the activity of photoreceptors. Therefore, the amplitude of the b-wave is often treated as the response amplitude of a set of light stimuli (Brown, 1969; Rager, 1979; Gacic et al., 2014; Hayasaka et al., 2021).
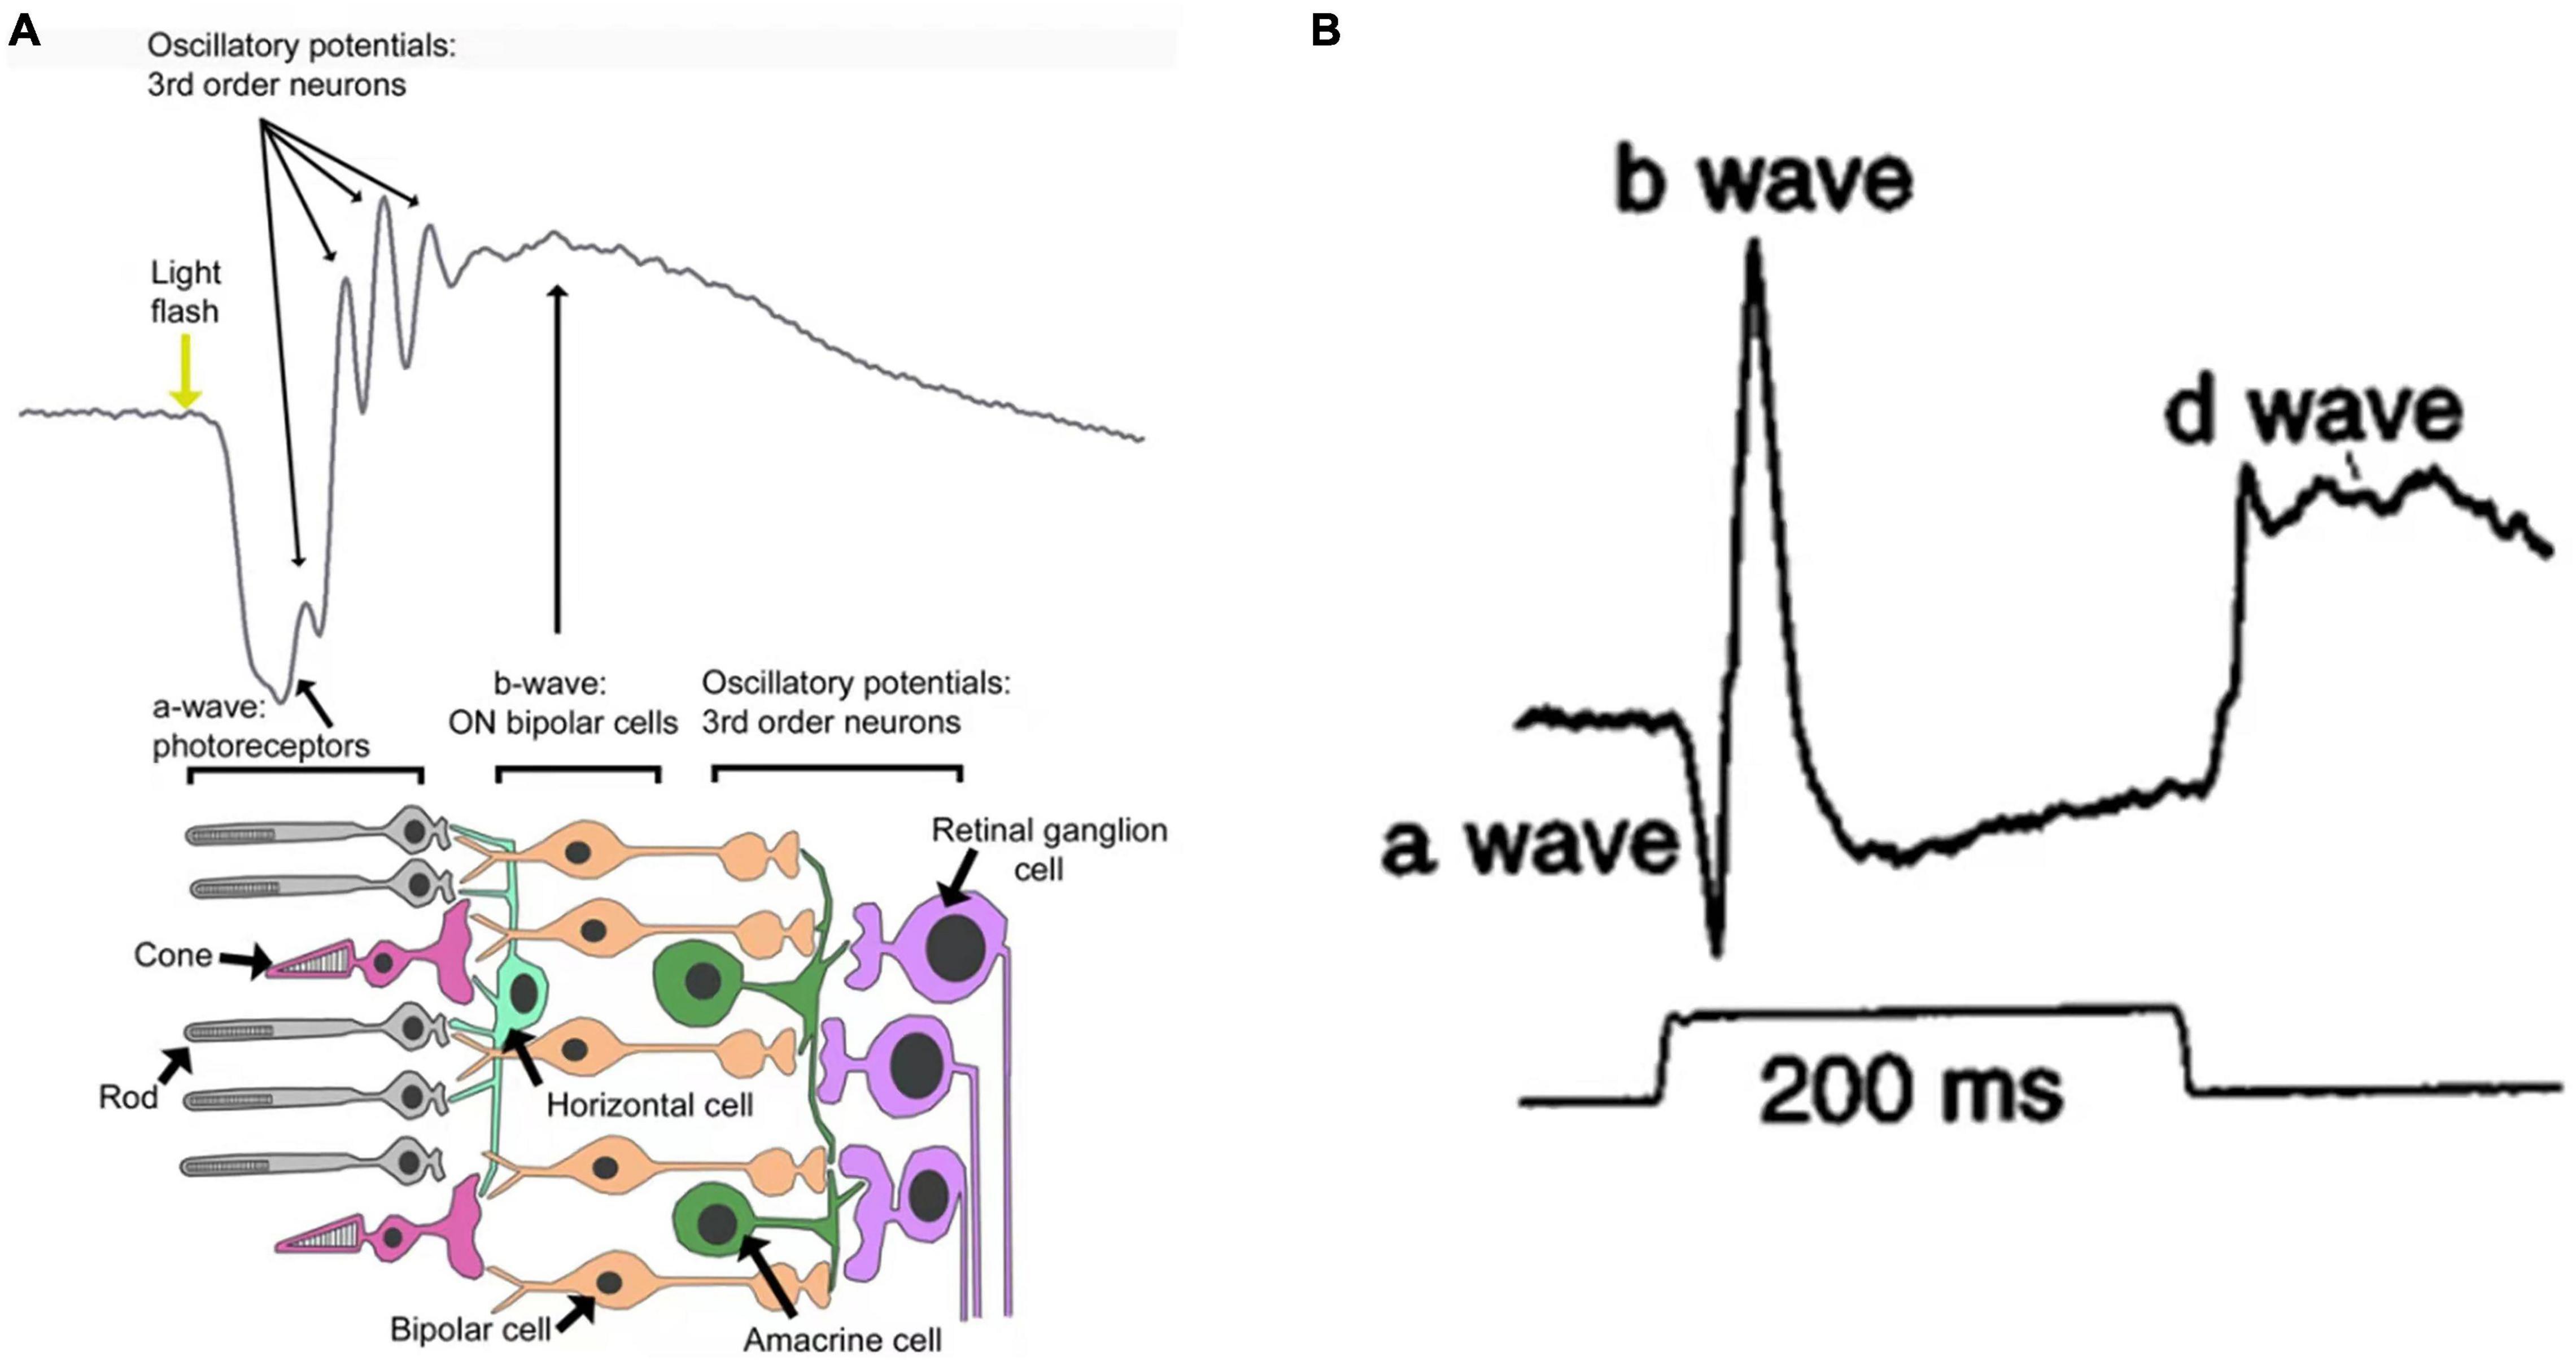
Figure 1. (A) Schematic representation of a flash electroretinogram (ERG) and the retinal events contributing to it (Cameron et al., 2008). (B) Primate photopic ERG responses to 200 ms stimuli (Bush and Sieving, 1996).
Milestones
The use of ERG dates back more than 100 years. Holmgren (1865) was the first researcher to use a galvanometer to connect electrodes to the front and rear of the eyeball. He was able to measure a rapid current change when an eyeball isolated from a frog was subjected to light stimuli, with the current appearing positive on the corneal side. Through subsequent experiments, Holmgren (1870), found that after an eyeball isolated from an animal was transversely cut, the potential difference was also measurable from the vitreous side to the posterior sclera, and a change in potential also occurred during light stimuli. This result indicated that the retina was the source of the electrostatic potential of the eye. Kühne and Steiner (1880) detected a change in potential in the retina isolated from the eyeballs of animals, but not in the eyeball without the retina, supporting the premise that the retina was the source of the signal.
The components and origins of ERG signals have been studied extensively. As observed in previous studies, Gotch and Francis (1903) reported that a more rapid negative potential occurred before the positive potential. Ishihara (1906) described a slowly rising positive wave following the appearance of the positive potential on the ERG. Einthoven and Jolly (1908) referred to the first negative wave as an a-wave, the positive wave that occurred subsequently as a b-wave, and the wave that occurred after the cessation of light stimuli as a d-wave. They further indicated that these waves might originate from the superposition of two components. However, referring to all components of the ERG profile, Granit (1933) proposed the “three waveguide range.” He argued that the ERG signal originated from superimposition of three components (PI, PII, and PIII) and inferred that PI was a type of c-wave, PII was a type of b-wave, and PIII was associated with both a- and b-waves. Adrian (1946) reported double b-waves and referred to the first as a photopic b-wave and the latter as a scotopic b-wave. He showed that the photopic b-wave was associated with cone cells and the scotopic b-wave was associated with rod cells. Riggs and Johnson (1949) found that some small amplitude waves were superimposed on the b-wave as measured by ERG. Heck and Rendahl (1957) identified four peaks of these small amplitude waves, and Yonemura et al. (1962) referred to these small amplitude waves as oscillatory potentials. Dawson et al. (1968) reported that the shape and quantity of oscillating potentials depended on the experimental conditions. Brown and Murakami (1964) described a wave with almost no latent period under strong light, which he referred to as the ERP.
The progress of microelectrode intracellular recording techniques promoted further studies of the origin of ERG components. Murakami and Kaneko (1967) recorded two PIII components using a step-by-step recording technique and named them distal PIII and proximal PIII, respectively. They also proposed that a-waves originated from the synapses of the photoreceptor cells. Based on microelectrode recordings in cells, Miller and Dowling (1970) found that the light-induced action potential of Müller cells mostly coincided with b-waves. Subsequent studies revealed that the potential changes of Müller cells were triggered by an increase in the concentration of extracellular potassium ions, due to the depolarization of retinal neurons, instead of being directly induced by light, and that the generation of b-waves reflected the light-induced depolarization of ON bipolar cells (Stockton and Slaughter, 1989; Gurevich and Slaughter, 1993; Hood and Birch, 1996). In addition, the activation of Nav channels on cone bipolar cells and rod bipolar cells affects b-waves measured using ERG (Mojumder et al., 2008; Smith et al., 2013).
The progress of ERG research is closely related to the development of instruments. The ERG profiles of aquatic animals are usually recorded with a metal wire placed on the corneal surface or a glass electrode penetrating the eye. Cotton core electrodes (Northmore and Muntz, 1970; Matsuda and Wilder, 2010) and metal electrodes (Horodysky et al., 2013; Kopperud and Grace, 2017; Warrington et al., 2017; Kingston et al., 2019) can also be used. After the 1960s, glass microelectrodes began to be used in numerous applications (Karita et al., 1973; Clark, 1975; Mccormick et al., 2019; Venkatraman et al., 2020; Hayasaka et al., 2021). Metal electrodes are generally made of platinum or tungsten rods, silver wires, or silver-silver chloride (Hanyu and Ali, 1964; Yang et al., 1990), whereas glass microelectrodes are generally filled with ionic solutions (e.g., KCl solution) and then connected to an external metal wire. Other kinds of electrodes, such as stainless steel electrodes (Fuentespardo et al., 1997) and polyethylene pipe steel electrodes (Weber, 1982), are less commonly used. To date, tungsten halogen lamps (Weber, 1982), xenon lamps (Karita et al., 1973; Clark, 1975; King-Smith and Cronin, 1996), and light-emitting diodes (LEDs) (Vetter et al., 2019; Hasenei et al., 2020) are the main light sources used in ERG studies, and the light intensity and wavelength range are controlled by neutral filters and interference filters.
Application of Electroretinographys in Studies of Vision in Aquatic Organisms
For the majority of aquatic organisms, vision is crucial for predation, hiding from predators, communicating information, and reproduction (Johnsen, 2005; Mccormick and Allan, 2016; Butler et al., 2019). Even slight changes of light intensity and spectral composition may impact the feeding, survival, and growth of aquatic organisms (Villamizar et al., 2011). Efforts to measure the visual sensitivity of aquatic organisms help us to assess the effects of light conditions on the growth and development of cultured species. The reliance of aquatic animals on color vision and visual sensitivity must be considered when constructing fish facilities and improving fish yield efficiency (Browman, 2005). Therefore, electrophysiological data can be used to describe the visual sensitivity of aquatic organisms (Figure 2), which in turn provides direct data relevant to aquaculture, marine fishery, and ecosystem management (Hasenei et al., 2020).
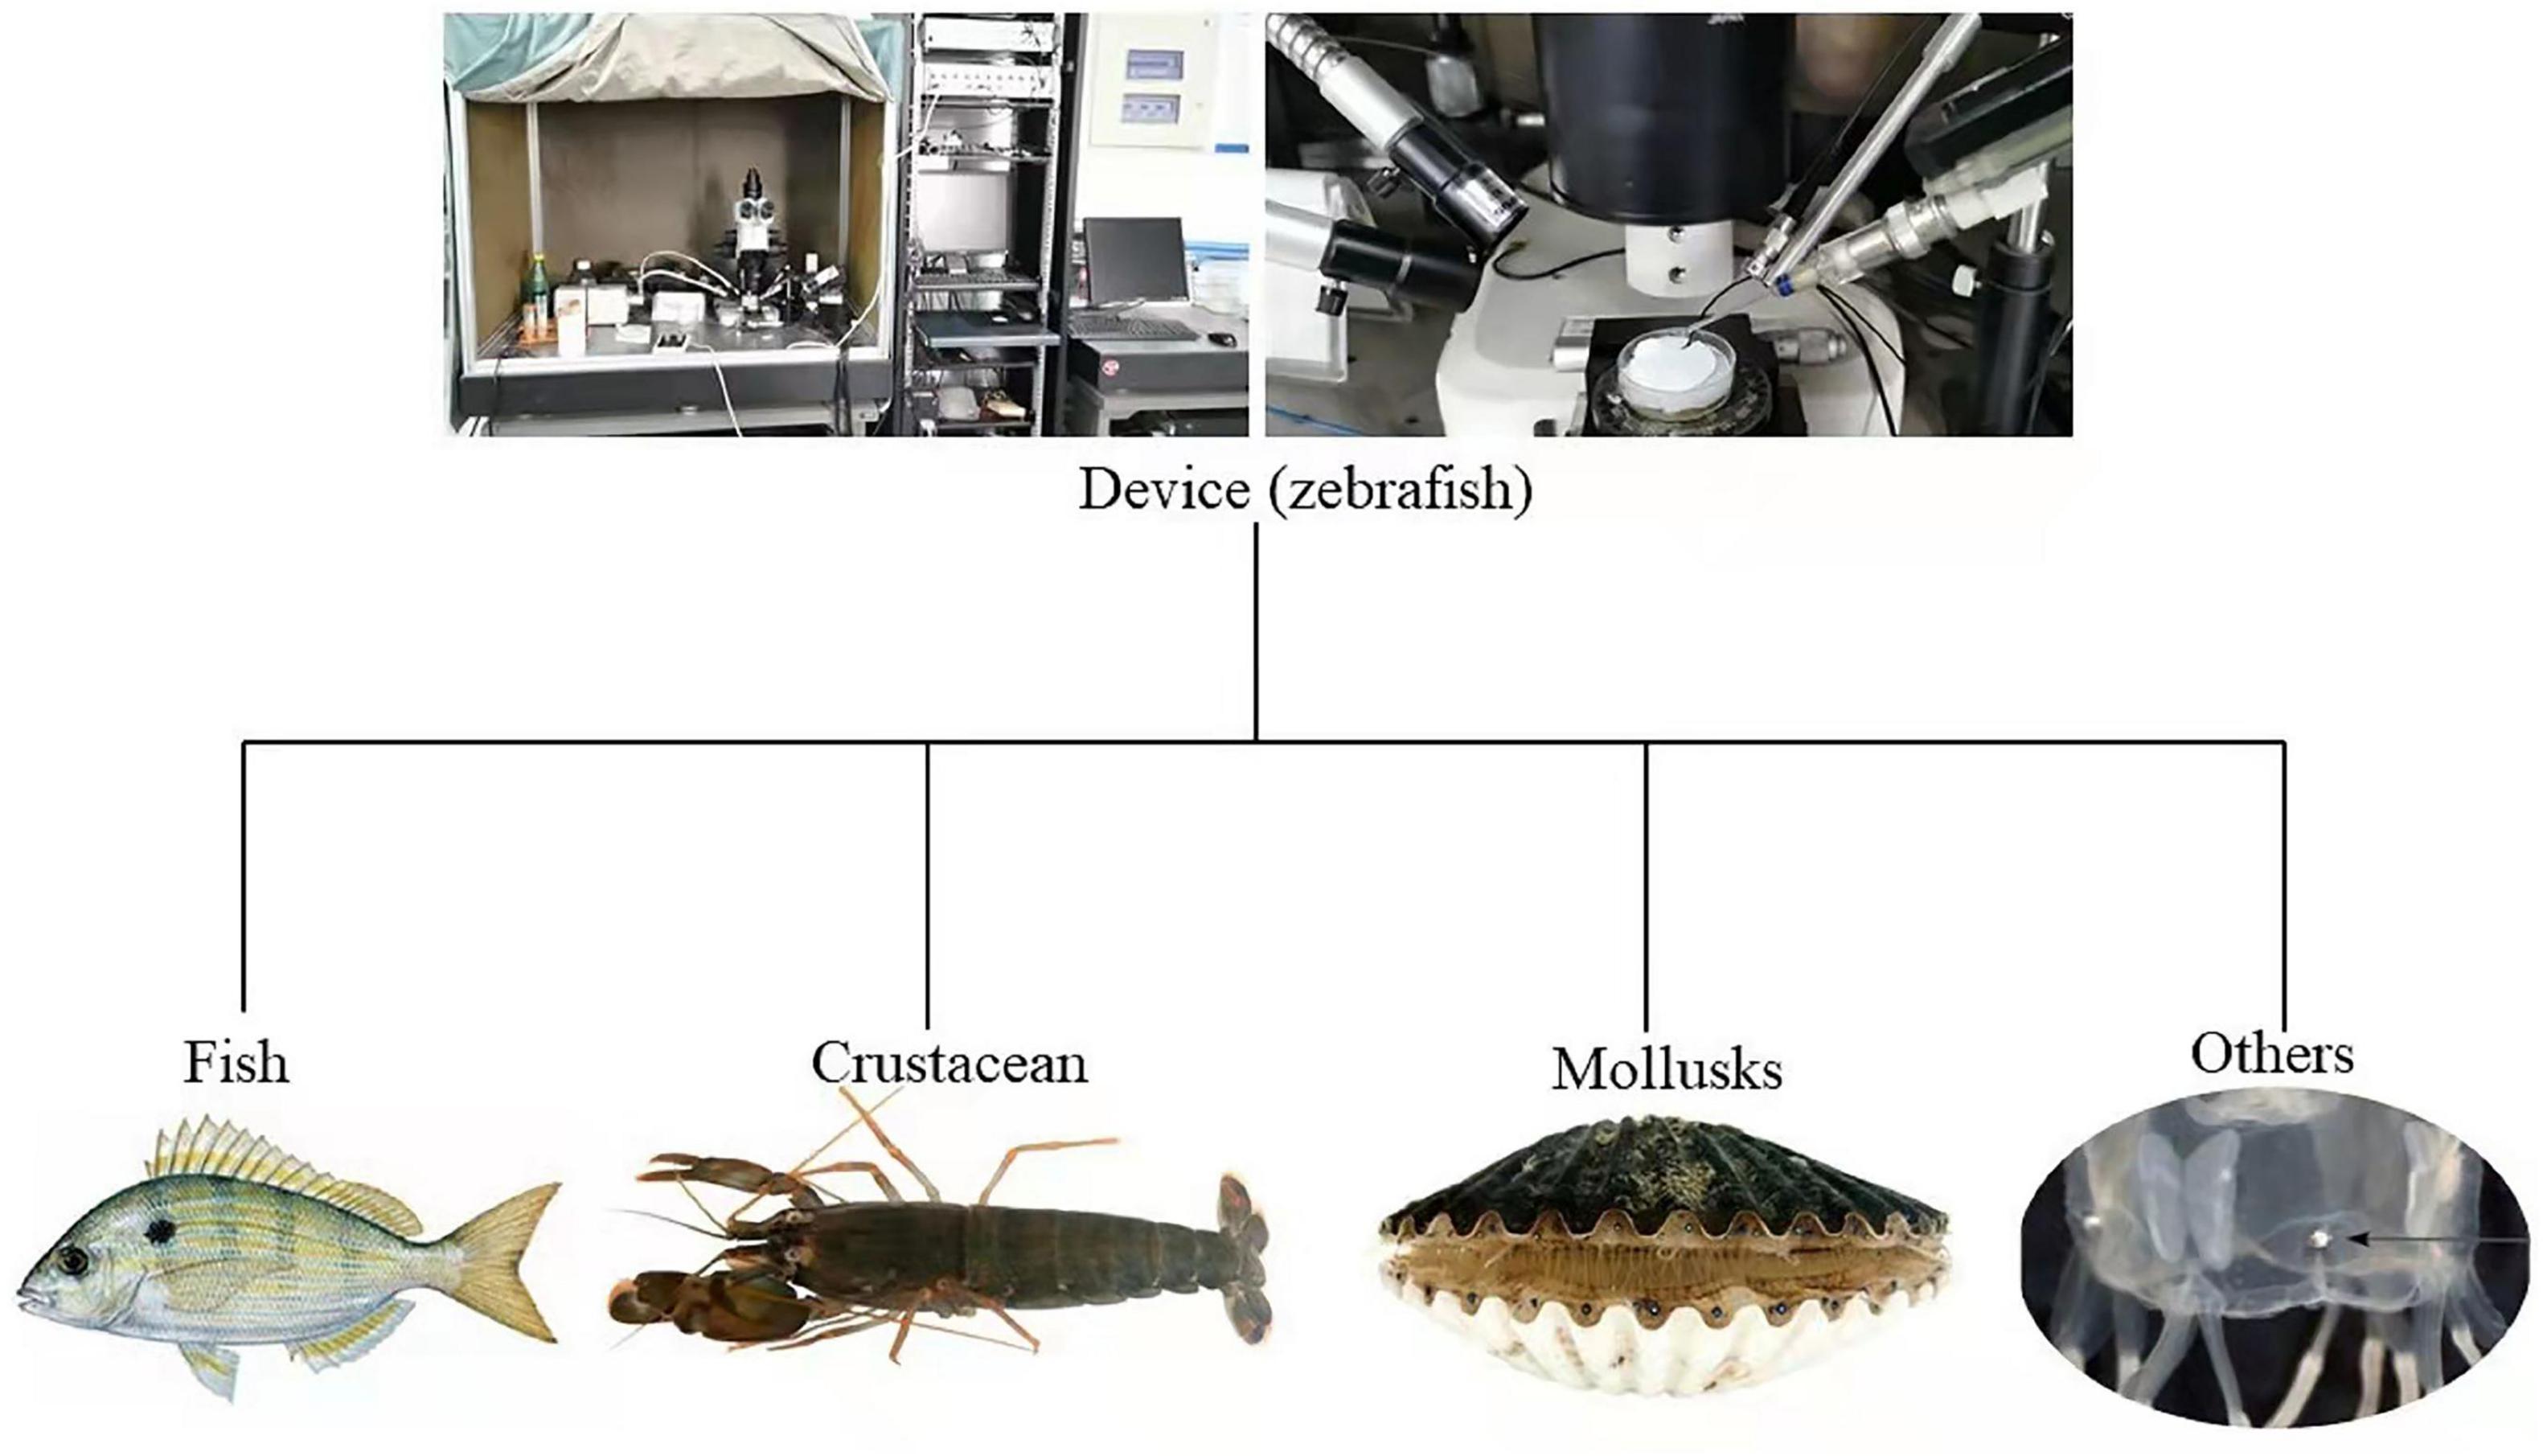
Figure 2. Part of the device diagram for electroretinogram testing of aquatic animals discussed in this review (Coates et al., 2006; Mccomb et al., 2013; Kingston et al., 2017, 2019; Liu et al., 2021).
Visual sensitivity includes spectral sensitivity, luminous sensitivity, and temporal resolution as well as contrast and polarization sensitivities. The b-wave amplitude of an electroretinogram indicates the response of the retina to a variety of light stimuli, and luminous sensitivities can be expressed by two indicators: K50 [the irradiance required to generate 50% of the peak amplitude (Vmax)] and dynamic range (the irradiance difference required to generate 5% and 95% of the Vmax). Spectral sensitivity can be expressed as the reciprocal of the irradiance required to generate the standard reaction. Temporal resolution is a measure of the integration time of the eye, which can reflect the ability of an organism to track moving objects. The highest frequency at which the signal produced by the eye and the light stimuli of the set irradiance retain the same phase is defined as the critical flicker-fusion frequency (CFF) (Hayasaka et al., 2021). Studies of visual sensitivity often involve separating the photoreceptor cell cone from the rod signals, and rods and cones can be distinguished according to their characteristics. The rod is sensitive to dark light and light at higher frequencies, whereas the cone is sensitive to bright light and light at lower frequencies. During adaptation to darkness, the sensitivity of the rod to light is 1,000 times greater than that of the cone. Rods can be bleached by bright light, so that use of dark-adapted blue light stimuli can separate the rod from the cone signals. In addition, adaption to different light spectral components diminishes the function of cones, which allows differentiation of different types of cones. As an alternative method, the two types of photoreceptor cell signals can be separated by temporal resolution, and high frequency flicker stimuli can accurately separate cone cell signals (Fei and Fang, 1989; Cameron et al., 2008).
Application of Electroretinography in Studies of Fish Visual Functions
Types of Photoreceptors
Photoreceptors are the retinal cells that convert light (photon) signals into electrical signals to propagate photoelectrical conversion. Vertebrate photoreceptors are classified into cone and rod cells. The outer segments of rod cells are rod-shaped and contain rhodopsin, which is sensitive to light and mainly responsible for dark vision. The outer segments of cone cells are conical and are responsible for photopic vision and color vision, and different cones have opsins that are sensitive to different wavelengths.
The zebrafish, Danio rerio, has four types of cone cells: ultraviolet wavelength, short wavelength, medium wavelength, and long wavelength. When the CFF of D. rerio was measured by ERG, no signal was detectable at 3 days post-fertilization (dpf); signals appeared at 4–12 dpf, but the amplitude was lower than that of adults and there was no response under low light intensity. The CFF-light intensity function curve at 15–24 dpf was similar to that of adult zebrafish, which was consistent with morphological data. Thus, these results suggested that photoreceptors began to develop at 2 dpf and that complete rod cells first appeared at 12 dpf (Branchek, 1984; Branchek and Bremiller, 1984). Variations of spectral sensitivity were observed in D. rerio under dark adaptation during development, and the spectral sensitivities at 6–8 and 13–15 dpf were due to cone cells, with very little contribution by rod cells. Measurement of the spectral sensitivities of the retina at 21–24 and 27–29 dpf showed that both rod and cone cells were functioning. The spectral sensitivity of D. rerio adults was mostly due to rod cells and ultraviolet-type cone cells (Bilotta et al., 2001).
Using the b-wave amplitude of the electroretinogram as an indicator of the response to light stimuli, Lu et al. (2021) analyzed the spectral sensitivity of D. rerio adults under dark adaptation. They identified spectral sensitivity peaks at 500 and 365 nm. After cone and rod cells were separated under photopic and scotopic conditions, the b-wave amplitude of D. rerio increased with age under dark adaptation with the same light stimuli. However, under light adaptation, no significant change in the b-wave amplitude was detected in any age group (Nadolski et al., 2020). Brockerhoff et al. (2003) discovered a cone mutant of D. rerio called no optokinetic response f, which had impaired cone function and normal rods. Electroretinography results confirmed the lack of an ERG response when the mutant was under light adaptation. Under dark adaptation, the b-wave amplitude was consistent with that of wild-type fish. Compared with wild-type D. rerio juveniles at 6 dpf, the mutant had smaller visual-motor and optokinetic responses under light adaptation. Subsequent to dark adaptation, the two responses of mutant and wild-type fish were consistent, which suggested that rod cells were involved in the visual behavior response, even though they are immature in the early developmental stage (Venkatraman et al., 2020).
Variations of Visual Sensitivities
In different aquatic zones in nature, the spectral composition (color) and intensity (brightness) usually vary with depth due to light refraction, scattering, and absorption. In clean coastal waters, green light has a strong penetrating ability, while blue light can penetrate deeper into the water column. Dissolved organic matter and suspended particles in estuaries and freshwater areas cause light at shorter wavelengths to scatter and be absorbed, which also happens fast for yellow and red light, and is why coastal light appears typically greenish (Horodysky et al., 2013). Given differences in habitat and behaviors of aquatic organisms, visual sensitivity also varies among different types of animals.
Generally, nearshore benthic fishes are more sensitive to light intensity than pelagic fishes, but less sensitive than deep sea species. For instance, the benthic-dwelling flounder, Paralichthys dentatus, has greater luminous sensitivity than pelagic fish such as Morone saxatilis, Pomatomus saltatrix, and Rachycentron canadum (Horodysky et al., 2010; Horodysky et al., 2013). The spectral sensitivity and dynamic range of pelagic fishes are lower than those of nearshore fishes. Fish living in the same body of water at different depths may also have different spectral sensitivities, which are closely associated with the spectral composition of the marine environment. Several groups reported (Matsumoto et al., 2009; Horodysky et al., 2013; Mccomb et al., 2013) that the range of spectral sensitivities of Chaetodipterus faber, Tautoga onitis, and Centropristis striata living in temperate coral reefs was 400–600 nm. Chaetodipterus faber, which inhabits shallow water, tends to be more sensitive to the light (green) at longer wavelengths, whereas T. onitis and C. striata, which live in deep water, tend to be more sensitive to the light (blue) at shorter wavelengths.
Visual sensitivity is also associated with lifestyle. In the same habitat, species that are active at night generally have lower temporal resolutions, while species that are active during the day have higher temporal resolutions (Matsumoto et al., 2009; Mccomb et al., 2010). In low visibility environments, organisms may exhibit prolonged integration times of the retina, which means that temporal resolution is reduced to capture light to the greatest extent possible (Warrant, 1999; Kalinoski et al., 2014; Ryan et al., 2017). Matsumoto et al. (2009) used an exponential function to fit the frequencies of the flicker stimulations and ERG amplitude, treated the slope of the exponential function as the temporal resolution, and found that the dark-adapted temporal resolution of the tuna, Thunnus orientalis, was significantly lower than that of the mackerel, Scomber japonicas. The former tended to be more active during the day and was insensitive to light intensity, with the irradiance required to generate a half response of the maximum ERG amplitude being 1.38 quanta cm–2s–1. The luminous sensitivity of the perch, Siniperca chuatsi, which becomes accustomed to preying at night under light adaptation conditions, is much lower than that under dark adaptation; the irradiance at which the ERG signal appears under light adaptation is 1,000 times greater than that under dark adaptation (Liang et al., 1994).
Aquatic organisms also adapt to the environment by optimizing their visual system. Mccomb et al. (2010) found that three species of coastal sharks (Sphyrna tiburo, Sphyrna lewini, and Carcharhinus acronotus) had scotopic spectral sensitivity peaks that fit the spectral range of their environment during the high predation period at dusk. The temporal resolution of T. onitis and the diel cycle invariance of luminous and spectral sensitivities are consistent with this species’ dormant lifestyle at night (Horodysky et al., 2013). Lampreys are usually active at night, and their temporal resolution and contrast sensitivity correspond to their lifestyles and habitats. For example, the temporal resolutions of parasitic Mordacia mordax and M. praecox are lower than 50 Hz. Moreover, the temporal resolution of parasitic species at all temperatures and light intensities is higher than that of non-parasitic species, and their response to flickering square-wave white light stimuli at a frequency of 5 Hz decreases with decreasing contrast levels. As temperature increases, the contrast sensitivity of lampreys also increases, which suggests that ambient temperature restricts the visual function of poikilotherms (Warrington et al., 2017).
Most fish species exhibit a diel rhythm cycle with respect to their visual sensitivity (Bassi and Powers, 1987; Li and Dowling, 1998; Kunz, 2006). The b-wave and d-wave amplitudes of D. rerio juveniles (5 dpf) are normal during the day but substantially disappear at night. Even under total darkness, the amplitude is high during subjective days and low during subjective nights, which can be attributed to the fact that the activity of the photoreceptor outer segment decreases and synaptic ribbons in the cone pedicles disassemble (Emran et al., 2010). The ERG amplitude of the tarpon, Megalops atlanticus, also shows a diel rhythm cycle, with the highest visual sensitivity at midnight and the lowest at noon. Under continuous darkness, the visual sensitivity during subjective nights is significantly higher than during subjective days, which suggests that it may be directly regulated by an endogenous biological clock (Kopperud and Grace, 2017).
The visual sensitivity of fish also varies among different developmental stages. Visual sensitivity in the juvenile stage is lower than that in the adult stage. The peak wavelengths of dark-adapted spectral sensitivity in juvenile T. orientalis is 474–494 nm, and the luminous sensitivity tends to increase with growth stage (Matsumoto et al., 2011). Sexually mature three-spined sticklebacks (Gasterosteus aculeatus) show higher sensitivity to the red spectrum (Shao et al., 2014). The male cichlid, Astatotilapia burtoni, exhibits a change in body color during courtship. Compared with non-sexually mature females, the sexually mature female A. burtoni is more sensitive to wavelengths similar to those of the male’s body color during courtship. Subsequent to stimulative ovulation, females also have a higher visual sensitivity compared to pre-injection measurements (Butler et al., 2019).
Effects of Environmental Factors on Visual Sensitivity
The variation of environmental factors also impacts vision. Hypoxia reduces visual sensitivity. Stenslokken et al. (2008) reported that severe hypoxia irreversibly impaired the vision of the shark, Hemiscyllium ocellatum. Acute hypoxia affects the rods and cones of the goldfish, Carassius auratus, to varying extents; the effect of acute hypoxia on b-waves under light adaptation is faster than that on b-waves under dark adaptation, which suggests that the signaling pathway of cones tends to be more sensitive to hypoxia than the signaling pathway of rods (Wei et al., 1995). Temperature can also affect the sensitivity of the retina. For example, rapid cooling may damage the retina of the catshark, Scyliorhinus canicula, because the ERG waves do not appear after timely rewarming. The b-wave amplitudes of the carp, Carassius gibelio, increased significantly after rewarming, but it did not fully recover to the original value. However, the visual sensitivity of the eel, Anguilla, did not differ significantly as a function of temperature. Subsequent to rewarming, the b-wave amplitude exceeded the initial level (Gacic et al., 2015). The composition of feed also affects visual sensitivity. Compared with a group of bass (Dicentrarchus labrax) fed with 0% or 1.5% taurine, the peak of spectral sensitivity of D. labrax fed with 5% taurine gradually shifted to longer wavelengths. The light intensity required to reach 75% of the ERG amplitude peak differed significantly among fish fed with feed containing different amounts of taurine (Brill et al., 2019).
In aquaculture and fisheries, the effects of anomalous light on the visual sensitivities of aquatic organisms need to be considered. Strong light may affect the visual sensitivity of fish, and different light periods and wavelengths during the rearing process may also affect the fish growth. ERG can be used to assess the visual sensitivity trends of fish as they adapt to different background light conditions. Dixon et al. (2004) found that compared with natural light, continuous acclimation under blue, green, and orange light reduced the sensitivities of D. rerio juveniles (6–10 dpf) to ultraviolet stimuli. Continued dark rearing also reduced the visual sensitivity of D. rerio and affected early visual development (Saszik and Bilotta, 1999). However, the negative effects from rearing under dark conditions resumed after placing D. rerio under normal light (Saszik and Bilotta, 2001). The retina is also susceptible to light during development, but its structure and function show a certain plasticity. The peak of spectral sensitivity of M. atlanticus adapted to red light (at long wavelengths) for 2–4 months was significantly different from that of the fish adapted to blue light (at short wavelengths); subsequent to dark adaptation, the irradiance required for light stimuli to achieve a response was less than that of light adaptation (Schweikert and Grace, 2018). The frequency and intensity of light stimuli also affect fish behavior. After strobe light stimuli, the visual sensitivity of the carp, Hypophthalmichthys molitrix, and H. nobilis was reduced (Vetter et al., 2019). After exposure to strong light (approximately 2,000 μmol⋅m–2⋅s–1) for 15 min, the visual sensitivity of the halibut, Hippoglossus stenolepis, decreased (Brill et al., 2008), and the decrease may have been irreversible (Magel et al., 2017).
Application of Electroretinographys in Studies of Crustacean Visual Function
Types of Photoreceptors
Photoreceptors are evolutionarily classified into ciliary and rhabdom types according to the structural characteristics of their membranes. There are various types of invertebrate photoreceptor systems; primitive types include the ocellus of protozoa, and more developed types include the camera eyes of cephalopods. Despite structural differences, their cells consist of three parts: a photosensory part, cell body, and axon (Huang, 1988). In crustaceans, photoreceptors are monocular and compound. Compound eyes are composed of the ommatidium, and its outside to inside structure consists of a refraction system, photosensitive system, and pigment cells. In the photosensitive system, the protruding microvilli of the retinula cells comprise the rhabdom. The structure of crustacean eyes is also associated with light intensity. Light and dark adaptation trigger changes in the ultrastructure of eyes, the most obvious being migration of pigments and changes in the position, size, and shape of the rhabdom. After light adaptation, pigment particles are distributed across the photoreceptor cells, the diameter of the rhabdome shrinks, and the microvilli arrangement is disordered; after dark adaptation, the diameter of the rhabdome enlarges, the microvilli arrangement is regular, and the pigment particles are only distributed at the distal and proximal ends of cells (Meyer-Rochow, 1999, 2001; Matsuda and Wilder, 2014).
Factors Impacting Visual Sensitivity
The visual sensitivity of crustaceans is closely associated with habitat. Analogous to the absorbance characteristics of rhodopsin, crustacean spectral sensitivity is modified by the attenuation of light by the dioptric apparatus and the length and absorption coefficient of the rhabdom (Johnson et al., 2002). Unlike direct measurement of the absorbance of the visual pigment, total response of the retinal photosensitive layer to light stimulation, as measured by ERG, considers the light filtering of other eye parts (Bryceson, 1986). Nearshore species are generally more sensitive to light at long wavelengths than oceanic species, and the peak of spectral sensitivity of shallow water species is different from that of deep sea species, which coincides with the spectral composition of the habitat. The shrimp species, Neomysis integer, Praunus flexuosus, and P. inermis, are offshore species, and their peak wavelengths of spectral sensitivity are 515, 530, and 535 nm, respectively; Mysis mixta and M. relicta sp. II are pelagic species, and their peak values are 510 and 520 nm, respectively (Lindstrom, 2000). Three shallow-water decapods (Crangon allmani, Pandalus montagui, and Nephrops norvegicus) are most sensitive to light in the range of 510 to 525 nm, whereas the peaks of spectral sensitivity of two deep sea decapods [Paromola cuvieri and Chaceon (Geryon) affinis] are below 500 nm (Johnson et al., 2002). The peak of spectral sensitivity of deep sea creatures is generally in the blue region of the visible spectrum. Frank et al. (2012) used ERG to identify the spectral sensitivity of eight benthic crustaceans and found that the spectral sensitivity peaks ranged from 470 to 497 nm. The squat lobsters, Euumunida picta and Gastroptychus spinifer, are also sensitive to light at ultraviolet wavelengths, which may be associated with deep sea bioluminescence.
Differences in spectral sensitivity are also closely associated with phylogeny. Under the same spectral distribution, Audzijonyte et al. (2005) found that the peak wavelength of spectral sensitivity of the lake species, M. relicta (564 nm), was higher than that of bay species, Mysis salemaai (545 nm). The spectral sensitivity of M. relicta collected from four geographically isolated areas also differed, and the difference was not related to the spectral distribution, but rather to the geographic location (saltwater/freshwater). Donner et al. (2016) examined the visual sensitivities of three species of mysids (M. relicta, M. salemaai, and Mysis segerstralei) and reported that the peak spectral sensitivity of lake populations was greater than that of brackish water species, and that this difference had minimal effects from the light environment. As the light intensity in a habitat becomes weaker with increasing depth, the luminous sensitivity of crustaceans increases and the temporal resolution tends to decrease, but there are some exceptions. Some species that are distributed in deeper zones have a much higher temporal resolution. For example, the CFFs of krill (Nematobrachion flexipes and N. sexspinosus) distributed at 400–600 m were 44 and 56 HZ, respectively, which may be due to the bioluminescence of most of the live prey (Frank, 1999, 2000; Johnson et al., 2000). The temporal resolution of crabs is generally lower than that of shrimp. Of the collected benthic crustaceans in their study, Frank et al. (2012) found that the CFFs of two shrimp, (Heterocarpus ensifer and Eugonatonotus crassus) were within the range of 16 to 24 Hz, whereas the CFFs of four crab species (G. spinifer, E. picta, Munidopsis erinacea, and Bathynectes longipes) were slightly lower (10–14 Hz), presumably due to the less mobile lifestyle of crabs.
Like most fish species, strong light stimuli reduces the electroretinogram saturated amplitude of crustaceans, which is associated with the intensity and duration of light stimuli. However, an animal’s visual sensitivity can recover to a certain extent. A moderate increase in adaptation to strong light over a long period of time will relieve the damage caused by strong light stimuli, and this process is associated with the rate at which light intensity increases (Viljanen et al., 2017). For two populations of M. relicta, the peak amplitude of ERG decreased after 2–3 weeks of strong light exposure, and the sensitivity to light intensity recovered at a slow rate under dark adaptation. Based on these results, the researchers suggested that recovery of retinal sensitivities of marine populations is limited by the regeneration rate of 11-cis retinal, whereas that of retinal sensitivity of lake populations is limited by the photoreceptor membrane turnover (Feldman et al., 2020).
Diel Cycle Changes in Visual Sensitivity
The visual sensitivity of crustaceans also follows a circadian rhythm. For example, Cai and Zheng (1990) found that the luminous sensitivity of the crab, Orithyia sinica, followed a circadian rhythm, whereas the spectral sensitivity curves and peak values during the day and at night generally remained the same. The luminous sensitivity of the crab, Poriunus trituberculaius, and the prawn, Penaeus japonicas, showed no change with circadian rhythm, and the spectral sensitivity curves and peak values during the day and at night were perfectly matched. These differing results may be associated with changes in light conditions in the animal habitat. In another study, ERG analyses were performed on the retina and laminar ganglion of the eyestalk of the crayfish, Procambarus clarkia. The luminous sensitivity of the two tissues during the day was lower than that at night, with a cycle approximately 22–23 h. When day was treated as a dark condition and night was treated as a light condition, the ERG waves at night remained higher than those during the day (Aréchiga and Rodríguez-Sosa, 1998). Pigment dispersion hormone (PDH), which functions as a non-photosynchronizer, can synchronize the circadian rhythm of P. clarkia. Studies showed that injection of PDH into an isolated eyestalk could advance or delay the circadian response of its visual photoreceptor depending on the time of treatment (Verde et al., 2007; Solis-Chagoyan et al., 2012a). Hormones can depolarize the potential of the photoreceptor membrane receptors. In a diel cycle, the light sensitivity varies from photoreceptor to photoreceptor. When the eyestalk isolated from P. clarkia was injected with PDH during the subjective day, ERG activation was slow, with a longer latency (the duration from light stimuli to the time when the ERG signal reached 10% of the peak amplitude) and half-time of activation (the duration from the time when the ERG signal reached 10% of the peak amplitude to the time when it reached 50% of the peak amplitude) when compared with the results for subjective night (Barriga-Montoya et al., 2010). Barriga-Montoya et al. (2017) reported that when subjected to light stimuli, the recovery of visual sensitivity was associated with a circadian rhythm, and the recovery of visual sensitivity with PDH depended on the duration of the circadian rhythm.
The amplitude at which photoreceptors show an electric response to light is also affected by melatonin, and the release of melatonin generally shows a circadian rhythm. At a low concentration of endogenous melatonin, the ERG amplitude increased when P. clarkia was injected with melatonin, and this induced effect was similar to the ERG response level observed at a high concentrations of endogenous melatonin (Solis-Chagoyan et al., 2012b). Melatonin synchronizes the cycle and phase of the circadian rhythm, thus the use of exogenous melatonin at different times may have specific effects on the rhythm phase. The phase advances and slows during a subjective day, but there is no phase change during a subjective night (Solis-Chagoyan et al., 2008).
Application of Electroretinography in Studies of Mollusk Visual Function
Types of Photoreceptors
Most photosensitive organs of mollusks are less structurally organized, but cephalopods have highly developed camera-type eyes. With a simpler retina structure compared to vertebrates, the retina of cephalopods consists of a rhabdom layer, melanin layer, optic cell nuclear layer, and nerve fiber layer. There is only one type of photoreceptor cell (rod cells), and two visual pigments are present in the cephalopod retina: rhodopsin in the outer segment of the photoreceptor-type cell and retinal pigment in the myelin corpuscle membrane of the inner segment. Due to the lack of color-differentiating cone cells, cephalopods are generally considered to be color blind. Scallops also have complex photosensitive organs. In their typical mirror eye, the retina is divided into a distal and a proximal retina. The distal retina consists of ciliary photoreceptor cells, which are homologous to rods and vertebral cells of vertebrates; the proximal retina consists of microvilli photoreceptor cells, which are homologous to those of invertebrates (Speiser et al., 2011; Sun, 2015). The retina of gastropods contains some photoreceptor cells with microvilli and cilia. Electrophysiological measurements revealed that the spectral sensitivity of various gastropods only had a single peak, with a wavelength range of 475 to 496 nm (Gillary, 1974; Chernorizov et al., 1992, 1994; Zhukov et al., 2006; Shepeleva, 2013). Gao et al. (2016c) used histological methods to divide the eye tissue of the abalone, Haliotis discus hannai from outside to inside into a retinal pigment epithelial cell layer, outer nuclear layer, photoreceptor inner segment, inner nuclear layer, melanin particle deposition layer, and optical fiber layer.
Measurement of the Spectral Sensitivities of Mollusks
Hamasaki (1968a) anesthetized octopus (Octopus vulgaris and O. briareus) samples for ERG analysis and found a continuous negative wave on the recorded electroretinogram. The amplitude and light adaptation state were associated with light stimuli intensity; as the stimuli intensity decreased, the negative wave amplitude decreased and the latency of the response increased. Under dark adaptation or with adaptation to different spectral components, the peaks of spectral sensitivity were approximately 480 nm, which suggested that there was only one visual pigment in octopus (Hamasaki, 1968b). The peak of spectral sensitivity of the cuttlefish, Sepiella maindroni de Rochebrune, appeared at 490 nm when the ERG recording was performed with adaptation to background light at different intensities and wavelengths, but the peak did not shift and the curve shape stayed the same (Zheng and Cai, 1981). Yamamoto et al. (1985) classified the process of Sepiella japonica development from egg laying to hatching into 40 stages. ERG readings were first observed at Stage 34 when the photoreceptor cells began to differentiate into inner and outer segments. From Stage 35 to 36, the density and arrangement of microvilli tended to be more regular, leading to the formation of the rhabdome and an increase in the ERG amplitude; by Stage 39, the ERG amplitude reached the individual adult level. In another study, the ERG amplitude of Sepia officinalis decreased as the body size increased, and its sensitivity to blue light was 100 times greater than that of yellow light (Groeger et al., 2006).
The squid, Euprymna scolopes, has a bioluminescent organ containing symbiotic photobacteria (Vibrio fischeri), which has a photosensitive function. In an ERG test, this organ generated a positive amplitude signal under light stimuli, which was opposite the negative amplitude generated from eyes under light stimuli. However, this difference was not associated with the presence or absence of photobacteria. The ERG amplitude of photogenic tissue was only associated with the size of the bioluminescent organ; the larger the photogenic organ, the greater the response amplitude (Tong et al., 2009). Spectral responses of the scallop Amusium japonicum spanned 433–700 nm, with a peak of approximately 470–520 nm. These values indicate that this organism is well-adapted to the light environment of a shallow sea habitat. Its CFF was 1.3–1.5 Hz, indicating that only slow-moving objects could be detected (Kanmizutaru et al., 2005). The range of spectral sensitivities of the larvae of the oyster, Magallana gigas, is 500 to 650 nm, with a peak at 620 nm (Kim et al., 2021). As a typical diurnal nocturnal creature, the movement and feeding behaviors of abalone follow an obvious circadian rhythm (Gao et al., 2020). However, Gao et al. (2016d) found that abalone showed phototaxis toward darkness (red and orange light at long wavelengths) but hide from blue and green light at short wavelengths. Under blue and green light, the growth, survival, and feed conversion ratio of abalone were significantly lower than those under red and orange lights (Gao et al., 2016b). Under blue and green lights at short wavelengths, the larval metamorphosis and survival rate of H. discus hannai were significantly higher than those under red and orange lights (Gao et al., 2016a,2017). This finding suggests that in diverse stages of growth and development, abalone are sensitive to different spectral components to a varying extent, and therefore electrophysiological technology may provide the best way to assess the spectral sensitivity of abalone.
Certain gastropods are able to regenerate their eyes. For example, the ERG results of retina from a regenerated eye of the snail, Achatina fulica, with or without morphological abnormality, was similar to that of a normal eye. In different age groups, the ERG signals of regenerated eyes resembled, but were all slightly lower than, those of normal eyes. Under recurring stimuli, the amplitudes of the signals from regenerated eyes decreased, but the extent of the amplitude was greater than that of a normal eye. Additionally, during the period of recovery, the amplitude of the response decreased with age (Flores et al., 1983; Tartakovskaya et al., 2003).
Application of Electroretinography in Studies of Visual Functions of Other Aquatic Animals
When spectral sensitivity is measured by flash-ERG, it usually takes a long time to record. During this period, the amplitude of ERG components may be subject to various parameters, such as changes in the eyes, the electrode position, or the metabolic state of the retina. Another alternative is to use flicker-ERG, in which the intensity of the monochromatic test light is adjusted to generate an ERG amplitude identical to the fixed reference light stimuli. This alternative has some strengths when used for spectral sensitivity measurements: any ERG change that occurs during the test may also be reflected in the response to the test and reference lights. In addition, it only requires one measurement for each specific test wavelength, thereby shortening the test duration (Neitz and Jacobs, 1984; Jacobs et al., 1996).
When the spectral sensitivity of sea turtles was measured by flicker-ERG, at least two visual pigments were found in adult Dermochelys coriacea, Caretta, and Chelonia mydas, which were sensitive to the longer wavelengths, with peaks at 580 nm. Dermochelys coriacea showed higher sensitivity in the short wavelength region, with a peak at 500 nm. In contrast, the ERG results of C. mydas and C. caretta had a secondary peak at approximately 520 nm. When C. caretta and D. coriacea hatchlings were assessed using flicker-ERG, both species had peak sensitivities between 520 and 540 nm and a secondary peak at UV wavelengths was detected, but the sensitivity of D. coriacea to light at wavelengths higher than 520 nm was significantly lower than that of C. caretta (Levenson et al., 2004; Crognale et al., 2008; Horch et al., 2008).
Color vision is based on the extent to which the visual system can respond to light at different wavelengths, and it is based on two or more photoreceptor types. Most marine mammals have no color vision. For example, the seal, Phoca vitulina, only has rods and only a few cones, so it likely is color blind. Compared to terrestrial mammals, marine mammals lack cones sensitive to blue light, which may have resulted from prolonged adaptation to the marine environment (Peichl and Moutairou, 1998; Griebel and Peichl, 2003). This also coincides with the electrophysiological results for P. vitulina. The flicker-ERG test results revealed whether it was adapted to different spectral conditions, with the ERG amplitude having only one peak at 510 nm (Crognale et al., 1998). Levenson et al. (2006) used flicker-ERG at different frequencies and found that its peak of spectral sensitivity was at 502.5 nm, where rod cells play a dominant role. However, early behavioral studies suggested that the sea lion, Zalophus californianus, could identify color, which was supported by comparison of cone signals and rod signals (Griebel and Schmid, 1992; Griebel and Peichl, 2003). However, Scholtyssek et al. (2015) conducted follow-up behavioral studies and maintained that previous experiments may have neglected the effects of brightness and contrast, so Z. californianus may identify color based on brightness. Oppermann et al. (2016) conducted behavioral studies to show that Z. californianus could identify different colors, and further inferred that the low light intensity used by Scholtyssek et al. (2015) (in which cones cannot function) may explain their conclusion that Z. californianus is color blind.
Electroretinography has also been used to detect visual sensitivity of jellyfish. The form of the crystallin lens eyes of Tripedalia cystophora resembles that of vertebrates and cephalopods. Crystallin lens eyes include lower and upper lens eyes, and both have similar spectral sensitivities, with the peak corresponding to blue and green light at a wavelength of 500 nm (Coates et al., 2006). The visual system of the horseshoe crab, Limulus Polyphemus, exhibits a circadian rhythm. Under the natural light cycle, the ERG results showed that the visual sensitivity rhythm of L. polyphemus coincided with the circadian cycle. Even when L. polyphemus was fed in darkness for 1 year, its visual sensitivity followed the circadian rhythm. The circadian rhythm in subjective days was higher than those in subjective nights, and the rhythmic phase of the electroretinogram revealed an advance or delay of phases depending on exposure to short durations of different lighting conditions (Barlow, 1983; Watson et al., 2008). Information about components of the visual system of an increasing number of aquatic organisms is becoming available, and ERG can be used to further identify retinal functions, study how aquatic organisms adapt to different habits, and determine how to protect endangered species.
Prospects
This review focused on the use of ERG in studies of visual sensitivities of aquatic organisms. ERG can accurately reflect the response of the retina to light, and data acquisition is quick and precise. The variations of ERG waveforms caused by different light stimuli are extremely useful for observing the visual function characteristics of aquatic organisms, including spectral sensitivity, luminous sensitivity, and temporal resolution. Considering the enormous differences in body size, eye size, and form of aquatic organisms, the first step when studying a species is to reasonably reconstruct the characteristics of the eyes. For example, electrodes that can tightly fit the eyes and record data with a high signal-to-noise ratio should be used. Second, information about the general composition of visual organs and the retinal structures of aquatic organisms is incomplete, so there is an urgent need to describe the basic parameters, such as visual formation stages, retinal structure, and cell type and function, using anatomy, histology, and scanning or transmission electron microscopy. These parameters are crucial elements of ERG analysis. Third, the parameters of ERG light stimuli should be selected so that they can be adjusted according to the species being studied. The International Society for Clinical Visual Electrophysiology has published a set of standards for clinical ERG, but they are derived from human clinical research. Limited data are available for aquatic animals. To effectively assess the function of cone or rod cells, the durations of light and dark adaptations must be considered, the duration of flicker stimuli should be shorter than the integration time of photoreceptors, and the interval of stimuli must not affect the current state of retinal light adaptation. Fourth, ERG records the general response of retinal cells to light, but it is still difficult to associate the changes of a given ERG pattern with the specific changes of retinal light responses. Each waveform of the electroretinogram reflects the activity of different retinal cells, and wave components formed may overlap to some extent, thereby undermining the process of analyzing the functions of individual cells based on their unique wave components. To investigate the functions of specific retinal cells, efforts should be made to block the expression of certain neuronal functions using drugs, or to use models with loss of functions or mutations to isolate the corresponding wave components. We also need to develop a technique to accurately analyze the ERG waveform and associate the derived parameters with the activity of retinal cells in order to better describe the function of the retina. Finally, based on the retinal structure identified in aquatic organisms, the visual acuity of species dwelling in the same habitat could be inferred from the determination of ERG curves, and from comparisons and analyses of the characteristics of ERG curves of sibling species. This will, in turn, provide immediate guidance for the optimization of light conditions in aquaculture practice and the selection of lamps in the marine fishing industry.
Author Contributions
XG and CK conceptualized the study. SL, MZ, and ML conducted research and collected the data. YL, WY, and XL provided the materials and the device. SL and XG wrote the manuscript. CK had primary responsibility for the final content. All authors read and approved the final manuscript.
Funding
This research was supported by grants from the Chinese Ministry of Science and Technology through the National Key Research and Development Program of China (2018YFD0901400), the Fujian Ocean and Fisheries Research Grant (FJHJF-L-2020-7), the Earmarked Fund for the Modern Agro-industry Technology Research System (CARS-49), China Postdoctoral Science Foundation Grants (2019M650153 and 2021T140393), and the Outstanding Postdoctoral Scholarship from the State Key Laboratory of Marine Environmental Science at Xiamen University.
Conflict of Interest
The authors declare that the research was conducted in the absence of any commercial or financial relationships that could be construed as a potential conflict of interest.
Publisher’s Note
All claims expressed in this article are solely those of the authors and do not necessarily represent those of their affiliated organizations, or those of the publisher, the editors and the reviewers. Any product that may be evaluated in this article, or claim that may be made by its manufacturer, is not guaranteed or endorsed by the publisher.
References
Adrian, E. D. (1946). Rod and cone components in the electric response of the eye. J. Physiol. 105, 24–37.
Aréchiga, H., and Rodríguez-Sosa, L. (1998). Circadian clock function in isolated eyestalk tissue of crayfish. Proc. R. Soc. B-Biol. Sci. 265, 1819–1823. doi: 10.1098/rspb.1998.0507
Audzijonyte, A., Pahlberg, J., Väinölä, R., and Lindström, M. (2005). Spectral sensitivity differences in two Mysis sibling species (Crustacea. Mysida): Adaptation or phylogenetic constraints? J. Exp. Mar. Biol. Ecol. 325, 228–239. doi: 10.1016/j.jembe.2005.05.007
Barriga-Montoya, C., De La, O. M. A., Fuentes-Pardo, B., and Gomez-Lagunas, F. (2017). Desensitization and recovery of crayfish photoreceptors. Dependency on circadian time, and pigment-dispersing hormone. Comp. Biochem. Physiol. A Mol. Integr. Physiol. 203, 297–303. doi: 10.1016/j.cbpa.2016.10.008
Barriga-Montoya, C., Gomez-Lagunas, F., and Fuentes-Pardo, B. (2010). Effect of pigment dispersing hormone on the electrical activity of crayfish visual photoreceptors during the 24-h cycle. Comp. Biochem. Physiol. Mole. Integr. Physiol. 157, 338–345. doi: 10.1016/J.cbpa.2010.08.003
Bassi, C. J., and Powers, M. K. (1987). Circadian-rhythm in goldfish visual sensitivity. Investig. Ophthal. Vis. Sci. 28, 1811–1815.
Bilotta, J., Saszik, S., and Sutherland, S. E. (2001). Rod contributions to the electroretinogram of the dark-adapted developing zebrafish. Dev. Dyn. 222, 564–570. doi: 10.1002/dvdy.1188
Branchek, T. (1984). The development of photoreceptors in the zebrafish, brachydanio rerio .2. function. J. Comp. Neurol. 224, 116–122. doi: 10.1002/cne.902240110
Branchek, T., and Bremiller, R. (1984). The development of photoreceptors in the zebrafish, brachydanio rerio .1. structure. J. Comp. Neurol. 224, 107–115. doi: 10.1002/cne.902240109
Brill, R., Magel, C., Davis, M., Hannah, R., and Rankin, P. (2008). Effects of rapid decompression and exposure to bright light on visual function in black rockfish (Sebastes melanops) and Pacific halibut (Hippoglossus stenolepis). Fish. Bull. 106, 427–437.
Brill, R. W., Horodysky, A. Z., Place, A. R., Larkin, M. E. M., and Reimschuessel, R. (2019). Effects of dietary taurine level on visual function in European sea bass (Dicentrarchus labrax). PLoS One 14:e0214347. doi: 10.1371/journal.pone.0214347
Brockerhoff, S. E., Rieke, F., Matthews, H. R., Taylor, M. R., Kennedy, B., Ankoudinova, I., et al. (2003). Light stimulates a transducin-independent increase of cytoplasmic Ca2+ and suppression of current in cones from the zebrafish mutant nof. J. Neurosci. 23, 470–480.
Browman, H. I. (2005). Applications of sensory biology in marine ecology and aquaculture. Mar. Ecol. Prog. Ser. 287, 266–269.
Brown, K. T. (1969). The electroretinogram: its components and their origins. UCLA Med. Sci. 8, 319–378.
Brown, K. T., and Murakami, M. (1964). A new receptor potential of the monkey retina with no detectable latency. Nature 201, 626–628. doi: 10.1038/201626a0
Bryceson, K. P. (1986). The effect of screening pigment migration on spectral sensitivity in a crayfish reflecting superposition eye. J. Exp. Biol. 125, 401–404.
Bush, R. A., and Sieving, P. A. (1996). Inner retinal contributions to the primate photopic fast flicker electroretinogram. J. Opt. Soc. Am. Opt. Image Sci. Vis. 13, 557–565. doi: 10.1364/josaa.13.000557
Butler, J. M., Whitlow, S. M., Rogers, L. S., Putland, R. L., Mensinger, A. F., and Maruska, K. P. (2019). Reproductive state-dependent plasticity in the visual system of an African cichlid fish. Horm. Behav. 114:003. doi: 10.1016/j.yhbeh.2019.06.003
Cai, M. J., and Zheng, W. Y. (1990). Comparison of circadian rhythms in electroretinogram characteristics of several crustaceans. Oceanol. Limnol. Sin. 1990, 212–217.
Cameron, M. A., Barnard, A. R., and Lucas, R. J. (2008). The electroretinogram as a method for studying circadian rhythms in the mammalian retina. J. Genet. 87, 459–466. doi: 10.1007/s12041-008-0068-5
Chernorizov, A. M., Shekhter, E. D., Arakelov, G. G., and Zimachev, M. M. (1992). Vision of helix-lucorum L - the spectral sensitivity of the dark-adapted eye. Zhurnal Vysshei Nervnoi Deyatelnosti Imeni I P Pavlova 42, 1150–1155.
Chernorizov, A. M., Shekhter, E. D., Arakelov, G. G., and Zimachev, M. M. (1994). The vision of the snail: the spectral sensitivity of the dark-adapted eye. Neurosci. Behav. Physiol. 24, 59–62. doi: 10.1007/bf02355653
Clark, R. B. (1975). Components of the cephalopod electroretinogram. Exp. Eye Res. 20, 499–504. doi: 10.1016/0014-4835(75)90217-1
Coates, M. M., Garm, A., Theobald, J. C., Thompson, S. H., and Nilsson, D. E. (2006). The spectral sensitivity of the lens eyes of a box jellyfish, Tripedalia cystophora (Conant). J. Exp. Biol. 209, 3758–3765. doi: 10.1242/jeb.02431
Crognale, M. A., Eckert, S. A., Levenson, D. H., and Harms, C. A. (2008). Leatherback sea turtle Dermochelys coriacea visual capacities and potential reduction of bycatch by pelagic longline fisheries. Endang. Species Res. 5, 249–256. doi: 10.3354/esr00112
Crognale, M. A., Levenson, D. H., Ponganis, P. J., Deegan, J. F., and Jacobs, G. H. (1998). Cone spectral sensitivity in the harbor seal (Phoca vitulina) and implications for color vision. Can. J. Zool. Can. De Zool. 76, 2114–2118. doi: 10.1139/cjz-76-11-2114
Dawson, W. W., Stewart, H. L., Perry, N. W., and Childers, D. G. (1968). Pooling of visual evoked signals from humans–a demonstration of components above 100 Hz. Nature 220, 980–984. doi: 10.1038/220980a0
Dixon, L. J., Mcdowell, A. L., Houchins, J. D., and Bilotta, J. (2004). Effects of restricted spectral rearing on the development of zebrafish retinal physiology. Doc. Ophthalmol. 109, 17–33. doi: 10.1007/s10633-004-1124-y
Donner, K., Zak, P., Viljanen, M., Lindstrom, M., Feldman, T., and Ostrovsky, M. (2016). Eye spectral sensitivity in fresh- and brackish-water populations of three glacial-relict Mysis species (Crustacea): physiology and genetics of differential tuning. J. Comp. Physiol. Neuroethol. Sens. Neural Behav. Physiol. 202, 297–312. doi: 10.1007/s00359-016-1079-y
Einthoven, W., and Jolly, W. A. (1908). The form and magnitude of the electrical response of the eye to stimulation by light at various intensities. Q. J. Exp. Physiol. 1, 373–416.
Emran, F., Rihel, J., Adolph, A. R., and Dowling, J. E. (2010). Zebrafish larvae lose vision at night. Proc. Natl. Acad. Sci. U S A 107, 6034–6039. doi: 10.1073/pnas.0914718107
Evans, B. I., and Browman, H. I. (2004). “Variation in the development of the fish retina,” in Development of Form and Function in Fishes and the Question of Larval Adaptation, ed. J. J. Govoni (Baltimore, MD: American Fisheries Society Symposium), 145–166.
Fei, Y. J., and Fang, Q. X. (1989). Research and application of electroretinogram. New Prog. Ophthalmol. 1989, 38–42.
Feldman, T., Yakovleva, M., Viljanen, M., Lindstrom, M., Donner, K., and Ostrovsky, M. (2020). Dark-adaptation in the eyes of a lake and a sea population of opossum shrimp (Mysis relicta): retinoid isomer dynamics, rhodopsin regeneration, and recovery of light sensitivity. J. Comp. Physiol. Neuroethol. Sens. Neur. Behav. Physiol. 206:4. doi: 10.1007/s00359-020-01444-4
Flores, D. V., Salas, P. J. I., and Saavedra, J. P. (1983). Electroretinographic and ultrastructural-study of the regenerated eye of the snail cryptomphallus-aspersa. J. Neurob. 14, 167–176. doi: 10.1002/neu.480140302
Frank, T. M. (1999). Comparative study of temporal resolution in the visual systems of mesopelagic crustaceans. Biolog. Bull. 196, 137–144. doi: 10.2307/1542559
Frank, T. M. (2000). Temporal resolution in mesopelagic crustaceans. Philosoph. Transact. R. Soc. Lond. Series B-Biol. Sci. 355, 1195–1198. doi: 10.1098/rstb.2000.0666
Frank, T. M., Johnsen, S., and Cronin, T. W. (2012). Light and vision in the deep-sea benthos: II. Vision in deep-sea crustaceans. J. Exp. Biol. 215, 3344–3353. doi: 10.1242/jeb.072033
Fuentespardo, B., Solorzanogarcia, S., and Delaomartinez, A. (1997). Effects of complete and skeleton photoperiods on the circadian rhythm of the electroretinogram of the crayfish. Biolog. Rhythm Res. 28, 69–84. doi: 10.1076/brhm.28.3.5.69.13130
Gacic, Z., Bajic, A., Milosevic, M., Nikcevic, M., Mickovic, B., Hegedis, A., et al. (2014). Spectral sensitivity of the electroretinogram b-wave in dark-adapted Prussian carp (Carassius gibelio Bloch, 1782). Fish Physiol. Biochem. 40, 1899–1906. doi: 10.1007/s10695-014-9977-9
Gacic, Z., Miosevic, M., Mickovic, B., Nikcevic, M., and Damjanovic, I. (2015). Effects of acute cooling on fish electroretinogram: a comparative study. Comp. Biochem. Physiol. Mole. Integr. Physiol. 184, 150–155. doi: 10.1016/j.cbpa.2015.03.002
Gao, X., Li, X., Zhang, M., Chi, L., Song, C., and Liu, Y. (2016a). Effects of LED light quality on the growth, survival and metamorphosis of Haliotis discus hannai Ino larvae. Aquacult. Res. 47, 3705–3717. doi: 10.1111/are.12980
Gao, X., Zhang, M., Li, X., Shi, C., Song, C., and Liu, Y. (2016b). Effects of LED light quality on the growth, metabolism, and energy budgets of Haliotis discus discus. Aquaculture 453, 31–39. doi: 10.1016/j.aquaculture.2015.11.033
Gao, X., Zhang, M., Li, X., Song, C., and Liu, Y. (2016c). Light and electron microscopic study of the eye of Haliotis discus hannai Ino. J. Fish. Sci. China 2016, 1247–1254.
Gao, X., Zhang, M., Zheng, J., Li, X., Chi, L., Song, C., et al. (2016d). Effect of LED light quality on the phototaxis and locomotion behaviour of Haliotis discus hannai. Aquacult. Res. 47, 3376–3389. doi: 10.1111/are.12901
Gao, X., Zhang, M., Li, X., Song, C., and Liu, Y. (2017). Effects of light quality and intensity on the growth, survival and metamorphosis of Haliotis discus hannai Ino larvae. Aquacult. Res. 48, 3369–3382. doi: 10.1111/are.13164
Gao, X., Luo, X., You, W., and Ke, C. (2020). Circadian movement behaviours and metabolism differences of the Pacific abalone Haliotis discus hannai. J. Photochem. Photobiol. Biol. 211:111994. doi: 10.1016/j.jphotobiol.2020.111994
Gillary, H. L. (1974). Light-evoked electrical potentials from the eye and optic nerve of Strombus: response waveform and spectral sensitivity. J. Exp. Biol. 60, 383–396.
Gotch Francis. (1903). The time relations of the photo-electric changes in the eyeball of the frog. J. Physiol. 29, 388–410.
Graham, S. L., and Klistorner, A. (1998). Electrophysiology: A review of signal origins and applications to investigating glaucoma. Austr. New Zeal. J. Ophthal. 26, 71–85. doi: 10.1046/j.1440-1606.1998.00082.x
Granit, R. (1933). The components of the retinal action potential in mammals and their relation to the discharge in the optic nerve. J. Physiol. 77, 207–239. doi: 10.1113/jphysiol.1933.sp002964
Griebel, U., and Peichl, L. (2003). Color vision in aquatic mammals - facts and open questions. Aquat. Mam. 29, 18–30.
Griebel, U., and Schmid, A. (1992). Color-vision in the california sea lion (zalophus-californianus). Vision Res. 32, 477–482. doi: 10.1016/0042-6989(92)90239-f
Groeger, G., Chrachri, A., and Williamson, R. (2006). Changes in cuttlefish retinal sensitivity during growth. Vie Et Milieu-Life Env. 56, 167–173.
Gurevich, L., and Slaughter, M. M. (1993). Comparison of the wave-forms of the on bipolar neuron and the b-wave of the electroretinogram. Vision Res. 33, 2431–2435. doi: 10.1016/0042-6989(93)90122-d
Hamasaki, D. I. (1968a). The electroretinogram of the intact anesthetized octopus. Vision Res. 8, 247–258. doi: 10.1016/0042-6989(68)90012-6
Hamasaki, D. I. (1968b). The ERG-determined spectral sensitivity of the octopus. Vision Res. 8, 1013–1021. doi: 10.1016/0042-6989(68)90074-6
Hanyu, I., and Ali, M. A. (1964). Electroretinogram and its flicker fusion frequency at different temperatures in light-adapted salmon (salmo salar). J. Cell. Comp. Physiol. 63, 309–321. doi: 10.1002/jcp.1030630306
Hasenei, A., Kerstetter, D. W., Horodysky, A. Z., and Brill, R. W. (2020). Physiological limits to inshore invasion of Indo-Pacific lionfish (Pterois spp.): insights from the functional characteristics of their visual system and hypoxia tolerance. Biolog. Invas. 22, 2079–2097. doi: 10.1007/s10530-020-02241-5
Hayasaka, O., Anraku, K., Akamatsu, Y., Tseng, Y. C., Archdale, M. V., and Kotani, T. (2021). Threshold and spectral sensitivity of vision in medaka Oryzias latipes determined by a novel template wave matching method. Comp. Biochem. Physiol. A Mol. Integr. Physiol. 251:110808. doi: 10.1016/j.cbpa.2020.110808
Heck, J., and Rendahl, I. (1957). Components of the human electroretinogram; an analysis in normal eyes and in colour blindness; preliminary report. Acta Physiol. Scand. 39, 167–175. doi: 10.1111/j.1748-1716.1957.tb01418.x
Holmgren, F. (1865). En method att objectivera effecten av zjusintryck pâ retina. Ups Lakareforenings Forh 1, 177–191.
Hood, D. C., and Birch, D. G. (1996). b wave of the scotopic (rod) electroretinogram as a measure of the activity of human on-bipolar cells. J. Opt. Soc. Am. Opt. Image Sci. Vis. 13, 623–633. doi: 10.1364/josaa.13.000623
Horch, K. W., Gocke, J. P., Salmon, M., and Forward, R. B. (2008). Visual spectral sensitivity of hatchling loggerhead (Caretta caretta L.) and leatherback (Dermochelys coriacea L.) sea turtles, as determined by single-flash electroretinography. Mar. Freshw. Behav. Physiol. 41, 79–91. doi: 10.1080/10236240802106556
Horodysky, A. Z., Brill, R. W., Crawford, K. C., Seagroves, E. S., and Johnson, A. K. (2013). Comparative visual ecophysiology of mid-Atlantic temperate reef fishes. Biol. Open 2, 1371–1381. doi: 10.1242/bio.20136825
Horodysky, A. Z., Brill, R. W., Warrant, E. J., Musick, J. A., and Latour, R. J. (2010). Comparative visual function in four piscivorous fishes inhabiting Chesapeake Bay. J. Exp. Biol. 213, 1751–1761. doi: 10.1242/jeb.038117
Huang, C. F. (1988). Photoreceptor structures in vertebrates and invertebrates. Chin. J. Cell Biol. 1988, 10–15.
Ishihara, M. (1906). Versuch einer Deutung der Photo-elektrischen Schwankungen am Froschauge. Pflüger’s Archiv jür die Gesamte Physiologic des Menschen and der Tiere 1906, 569.
Jacobs, G. H., Neitz, J., and Krogh, K. (1996). Electroretinogram flicker photometry and its applications. J. Opt. Soc. Am. Opt. Image Sci. Vision 13, 641–648. doi: 10.1364/josaa.13.000641
Johnson, M. L., Gaten, E., and Shelton, P. M. J. (2002). Spectral sensitivities of five marine decapod crustaceans and a review of spectral sensitivity variation in relation to habitat. J. Mar. Biol. Assoc. U K 82, 835–842. doi: 10.1017/s0025315402006203
Johnson, M. L., Shelton, P. M. J., and Gaten, E. (2000). Temporal resolution in the eyes of marine decapods from coastal and deep-sea habitats. Mar. Biol. 136, 243–248. doi: 10.1007/s002270050682
Kalinoski, M., Hirons, A., Horodysky, A., and Brill, R. (2014). Spectral sensitivity, luminous sensitivity, and temporal resolution of the visual systems in three sympatric temperate coastal shark species. J. Comp. Physiol. Neuroethol. Sens. Neur. Behav. Physiol. 200, 997–1013. doi: 10.1007/s00359-014-0950-y
Kanmizutaru, T., Anraku, K., and Toyoda, S. (2005). Light perception capability of pallial eyes in Japanese moon scallop Amusium japonicum as determined by electroretinogram. Nippon Suisan Gakkaishi 71, 928–934. doi: 10.2331/suisan.71.928
Karita, K., Ito, S., and Tasaki, K. (1973). Fast and slow components in the electroretinogram of the gastropod. Tohoku J. Exp. Med. 109, 77–84. doi: 10.1620/tjem.109.77
Kim, H.-J., Suematsu, Y., Kaneda, H., and Satuito, C. G. (2021). Light wavelength and intensity effects on larval settlement in the Pacific oyster Magallana gigas. Hydrobiologia 848, 1611–1621. doi: 10.1007/s10750-021-04550-9
King-Smith, C., and Cronin, T. W. (1996). Pigment granule migration in crustacean photoreceptors requires calcium. Visual Neurosci. 13, 43–49. doi: 10.1017/s0952523800007112
Kingston, A. C. N., Chappell, D. R., Miller, H. V., Lee, S. J., and Speiser, D. I. (2017). Expression of G Proteins in the Eyes and Parietovisceral Ganglion of the Bay Scallop Argopecten irradians. Biol. Bull. 2017:83.
Kingston, A. C. N., Lucia, R. L., Havens, L. T., Cronin, T. W., and Speiser, D. I. (2019). Vision in the snapping shrimp Alpheus heterochaelis. J. Exp. Biol. 222:209015. doi: 10.1242/jeb.209015
Kopperud, K., and Grace, M. (2017). Circadian rhythms of retinal sensitivity in the Atlantic tarpon. Megalops atlanticus. Bull. Mar. Sci. 93, 285–300. doi: 10.5343/bms.2016.1045
Kühne, W., and Steiner, J. (1880). Uber das Elektromotorich Verhalten der Netzhaut. Untersuchungen Physiologies lnstitute der Universität Heidelberg 1880:327.
Kunz, Y. W. (2006). Review of development and aging in the eye of Teleost fish. Neuroembryol. Aging 4, 31–60. doi: 10.1159/000103451
Levenson, D. H., Eckert, S. A., Crognale, M. A., Deegan, J. F., and Jacobs, G. H. (2004). Photopic spectral sensitivity of Green and Loggerhead Sea Turtles. Copeia 2004, 908–914. doi: 10.1643/cp-03-217r1
Levenson, D. H., Ponganis, P. J., Crognale, M. A., Deegan, J. F., Dizon, A., and Jacobs, G. H. (2006). Visual pigments of marine carnivores: pinnipeds, polar bear, and sea otter. J. Comp. Physiol. A 192, 833–843. doi: 10.1007/s00359-006-0121-x
Li, L., and Dowling, J. E. (1998). Zebrafish visual sensitivity is regulated by a circadian clock. Vis. Neurosci. 15, 851–857. doi: 10.1017/s0952523898155050
Liang, X. F., Zheng, W. Y., and Wang, Y. L. (1994). Visual characteristics and adaptation to predation of the Mandarinfish: Electroretinogram spectral sensitivity and adaptation. Acta Hydrobiol. Sin. 1994, 247–253.
Lindstrom, M. (2000). Eye function of Mysidacea (Crustacea) in the northern Baltic Sea. J. Exp. Mar. Biol. Ecol. 246, 85–101. doi: 10.1016/s0022-0981(99)00178-1
Liu, Y. F., Wu, Y., and Lu, Q. W. (2021). System for measuring the electroretinogram of larval zebrafish. China Mod. Educ. Equip. 357, 57–59+66.
Lorber, B., Hsiao, W. K., and Martin, K. R. (2016). Three-dimensional printing of the retina. Curr. Opin. Ophthalmol. 27, 262–267. doi: 10.1097/icu.0000000000000252
Lu, K. X., Xu, L. X., and Qian, W. G. (2021). Research on the spectral sensitivity of dark-adapted zebrafish Danio rerio. J. Dal. Ocean Univ. 2021, 1–11.
Magel, C., Ryer, C., and Brill, R. (2017). Recovery of visual function in Pacific halibut (Hippoglossus stenolepis) after exposure to bright light. Fish. Bull. 115, 566–575. doi: 10.7755/fb.115.4.12
Matsuda, K., and Wilder, M. N. (2010). Difference in light perception capability and spectral response between juveniles and sub-adults of the whiteleg shrimp Litopenaeus vannamei as determined by electroretinogram. Fish. Sci. 76, 633–641. doi: 10.1007/s12562-010-0253-3
Matsuda, K., and Wilder, M. N. (2014). Eye structure and function in the giant freshwater prawn Macrobrachium rosenbergii. Fish. Sci. 80, 531–541. doi: 10.1007/s12562-014-0734-x
Matsumoto, T., Ihara, H., Ishida, Y., Okada, T., Kurata, M., Sawada, Y., et al. (2009). Electroretinographic analysis of night vision in juvenile pacific bluefin tuna (Thunnus orientalis). Biolog. Bull. 217, 142–150. doi: 10.1086/BBLv217n2p142
Matsumoto, T., Okada, T., Sawada, Y., and Ishibashi, Y. (2011). Changes in the scotopic vision of juvenile Pacific bluefin tuna (Thunnus orientalis) with growth. Fish Physiol. Biochem. 37, 693–700. doi: 10.1007/s10695-011-9469-0
Mccomb, D. M., Frank, T. M., Hueter, R. E., and Kajiura, S. M. (2010). Temporal resolution and spectral sensitivity of the visual system of three coastal shark species from different light environments. Physiolog. Biochem. Zool. 83, 299–307. doi: 10.1086/648394
Mccomb, D. M., Kajiura, S. M., Horodysky, A. Z., and Frank, T. M. (2013). Comparative visual function in predatory fishes from the indian river lagoon. Physiol. Biochem. Zool. 86, 285–297. doi: 10.1086/670260
Mccormick, L. R., Levin, L. A., and Oesch, N. W. (2019). Vision is highly sensitive to oxygen availability in marine invertebrate larvae. J. Exp. Biol. 222:200899. doi: 10.1242/jeb.200899
Mccormick, M. I., and Allan, B. J. M. (2016). Lionfish misidentification circumvents an optimized escape response by prey. Conserv. Physiol. 4:64. doi: 10.1093/conphys/cow064
Meyer-Rochow, V. B. (1999). Compound eye: Circadian rhythmicity, illumination, and obscurity. Tokyo: Springer, 97–124.
Meyer-Rochow, V. B. (2001). The crustacean eye: Dark/light adaptation, polarization sensitivity, flicker fusion frequency, and photoreceptor damage. Zool. Sci. 18, 1175–1197. doi: 10.2108/zsj.18.1175
Miller, R. F., and Dowling, J. E. (1970). Intracellular responses of the Müller (glial) cells of mudpuppy retina: their relation to b-wave of the electroretinogram. J. Neurophysiol. 33, 323–341.
Mojumder, D. K., Sherry, D. M., and Frishman, L. J. (2008). Contribution of voltage-gated sodium channels to the b-wave of the mammalian flash electroretinogram. J. Physiol. Lond. 586, 2551–2580. doi: 10.1113/jphysiol.2008.150755
Murakami, M., and Kaneko, A. (1967). Differentiation of PIII subcomponents in cold-blooded vertebrate retinas. Vision Res. 6, 627–636.
Nadolski, N. J., Wong, C. X. L., and Hocking, J. C. (2020). Electroretinogram analysis of zebrafish retinal function across development. Doc. Ophthalmol. 2020:9783. doi: 10.1007/s10633-020-09783-y
Neitz, J., and Jacobs, G. H. (1984). Electroretinogram measurements of cone spectral sensitivity in dichromatic monkeys. J. Opt. Soc. Am. Opt. Imag. Sci. Vision 1, 1175–1180. doi: 10.1364/josaa.1.001175
Northmore, D. P., and Muntz, W. R. (1970). Electroretinogram determinations of spectral sensitivity in a teleost fish adapted to different daylengths. Vision Res. 10, 799–816. doi: 10.1016/0042-6989(70)90159-8
Oppermann, D., Schramme, J., and Neumeyer, C. (2016). Rod-cone based color vision in seals under photopic conditions. Vision Res. 125, 30–40. doi: 10.1016/j.visres.2016.04.009
Pardue, M. T., and Peachey, N. S. (2014). Mouse b-wave mutants. Documenta Ophthalmol. 128, 77–89. doi: 10.1007/s10633-013-9424-8
Peichl, L., and Moutairou, K. (1998). Absence of short-wavelength sensitive cones in the retinae of seals (Carnivora) and African giant rats (Rodentia). Eur. J. Neurosci. 10, 2586–2594. doi: 10.1046/j.1460-9568.1998.00265.x
Rager, G. (1979). The cellular origin of the b-wave in the electroretinogram – a developmental approach. J. Comp. Neurol. 188, 225–244. doi: 10.1002/cne.901880203
Riggs, L. A., and Johnson, E. P. (1949). Electrical responses of the human retina. J. Exp. Psychol. 39, 415–424. doi: 10.1037/h0058902
Ryan, L. A., Hemmi, J. M., Collin, S. P., and Hart, N. S. (2017). Electrophysiological measures of temporal resolution, contrast sensitivity and spatial resolving power in sharks. J. Comp. Physiol. A Neuroethol. Sens. Neural. Behav. Physiol. 203, 197–210. doi: 10.1007/s00359-017-1154-z
Saszik, S., and Bilotta, J. (1999). Effects of abnormal light-rearing conditions on retinal physiology in larvae zebrafish. Investig. Ophthal. Vis. Sci. 40, 3026–3031.
Saszik, S., and Bilotta, J. (2001). Constant dark-rearing effects on visual adaptation of the zebrafish ERG. Internat. J. Dev. Neurosci. 19, 611–619. doi: 10.1016/s0736-5748(01)00051-x
Scholtyssek, C., Kelber, A., and Dehnhardt, G. (2015). Why do seals have cones? Behavioural evidence for colour-blindness in harbour seals. Anim. Cogn. 18, 551–560. doi: 10.1007/s10071-014-0823-3
Schweikert, L. E., and Grace, M. S. (2018). Altered environmental light drives retinal change in the Atlantic Tarpon (Megalops atlanticus) over timescales relevant to marine environmental disturbance. Bmc Ecol. 18:157. doi: 10.1186/s12898-018-0157-0
Shao, Y. T., Wang, F.-Y., Fu, W.-C., Yan, H. Y., Anraku, K., Chen, I. S., et al. (2014). Androgens increase iws opsin expression and red sensitivity in male three-spined sticklebacks. PLoS One 9:100330. doi: 10.1371/journal.pone.0100330
Shepeleva, I. P. (2013). The spectral sensitivity of the eye of a gastropod pulmonate mollusc Radix peregra (Müller, 1774) (Basommatophora, Lymnaeidae). Ruthenica: Russ. Malacol. J. . 23, 177–180.
Smith, B. J., Tremblay, F., and Cote, P. D. (2013). Voltage-gated sodium channels contribute to the b-wave of the rodent electroretinogram by mediating input to rod bipolar cell GABA(c) receptors. Exp. Eye Res. 116, 279–290. doi: 10.1016/j.exer.2013.09.006
Solis-Chagoyan, H., Alvarado, R., Figueroa, A., Mendoza-Vargas, L., and Fuentes-Pardo, B. (2012a). Pigment dispersing hormone modulates spontaneous electrical activity of the cerebroid ganglion and synchronizes electroretinogram circadian rhythm in crayfish Procambarus clarkii. Comp. Biochem. Physiol. Mole. Integr. Physiol. 161, 450–455. doi: 10.1016/j.cbpa.2012.01.003
Solis-Chagoyan, H., Figueroa, A., Mendoza-Vargas, L., Pardo, B. F., and Jimenez-Rubio, G. (2012b). Simultaneous effect of melatonin on supraoesophageal ganglion spontaneous electrical activity and photoreceptor electroretinogram amplitude in crayfish. Crustaceana 85, 1241–1251. doi: 10.1163/156854012x651358
Solis-Chagoyan, H., Mendoza-Vargas, L., and Fuentes-Pardo, B. (2008). Melatonin modulates the ERG circadian rhythm in crayfish. Comp. Biochem. Physiol. Mole. Integr. Physiol. 149, 373–379. doi: 10.1016/j.cbpa.2008.01.040
Speiser, D. I., Loew, E. R., and Johnsen, S. (2011). Spectral sensitivity of the concave mirror eyes of scallops: potential influences of habitat, self-screening and longitudinal chromatic aberration. J. Exp. Biol. 214, 422–431. doi: 10.1242/jeb.048108
Stenslokken, K.-O., Milton, S. L., Lutz, P. L., Sundin, L., Renshaw, G. M. C., Stecyk, J. A. W., et al. (2008). Effect of anoxia on the electroretinogram of three anoxia-tolerant vertebrates. Comparat. Biochem. Physiol. Part A Mole. Integr. Physiol. 150, 395–403. doi: 10.1016/j.cbpa.2008.03.022
Stockton, R. A., and Slaughter, M. M. (1989). B-wave of the electroretinogram-a reflection of on bipolar cell-activity. J. Gen. Physiol. 93, 101–122. doi: 10.1085/jgp.93.1.101
Sun, Y. (2015). Genomic study on genetic basis of eye development and visual function in scallop. Doctor (In Chinese). Qingdao: Ocean University Of China.
Tarchick, M. J., Bassiri, P., Rohwer, R. M., and Samuels, I. S. (2016). Early Functional and Morphologic Abnormalities in the Diabetic Nyx(nob) Mouse Retina. Investig. Ophthal. Vis. Sci. 57, 3496–3508. doi: 10.1167/iovs.15-18775
Tartakovskaya, O. S., Borisenko, S. L., and Zhukov, V. V. (2003). Role of the age factor in eye regeneration in the gastropod Achatina fulica. Biol. Bull. 30, 228–235. doi: 10.1023/a:1023847510325
Tong, D., Rozas, N. S., Oakley, T. H., Mitchell, J., Colley, N. J., and Mcfall-Ngai, M. J. (2009). Evidence for light perception in a bioluminescent organ. Proc. Natl. Acad. Sci. U S A 106, 9836–9841. doi: 10.1073/pnas.0904571106
Ueno, S., Kondo, M., Ueno, M., Miyata, K., Terasaki, H., and Miyake, Y. (2006). Contribution of retinal neurons to d-wave of primate photopic electroretinograms. Vision Res. 46, 658–664. doi: 10.1016/j.visres.2005.05.026
Venkatraman, P., Mills-Henry, I., Padmanabhan, K. R., Pascuzzi, P., Hassan, M., Zhang, J., et al. (2020). Rods Contribute to Visual Behavior in Larval Zebrafish. Invest Ophthalmol. Vis. Sci. 61:11. doi: 10.1167/iovs.61.12.11
Verde, M. A., Barriga-Montoya, C., and Fuentes-Pardo, B. (2007). Pigment dispersing hormone generates a circadian response to light in the crayfish, Procambarus clarkii. Compar. Biochem. Physiol. Mole. Integr. Physiol. 147, 983–992. doi: 10.1016/j.cbpa.2007.03.004
Vetter, B. J., Rogers, L. S., and Mensinger, A. F. (2019). The effect of light stimuli on dark-adapted visual sensitivity in invasive silver carp Hypophthalmichthys molitrix and bighead carp H. nobilis. J. Fish Biol. 95, 256–262. doi: 10.1111/jfb.13880
Viljanen, M. L. M., Nevala, N. E., Calais-Grano, C. L., Lindstrom, K. M. W., and Donner, K. (2017). Increasing the illumination slowly over several weeks protects against light damage in the eyes of the crustacean Mysis relicta. J. Exp. Biol. 220, 2798–2808. doi: 10.1242/jeb.155101
Villamizar, N., Blanco-Vives, B., Migaud, H., Davie, A., Carboni, S., and Sanchez-Vazquez, F. J. (2011). Effects of light during early larval development of some aquacultured teleosts: A review. Aquaculture 315, 86–94. doi: 10.1016/j.aquaculture.2010.10.036
Warrant, E. J. (1999). Seeing better at night: life style, eye design and the optimum strategy of spatial and temporal summation. Vision Res. 39, 1611–1630. doi: 10.1016/s0042-6989(98)00262-4
Warrington, R. E., Hart, N. S., Potter, I. C., Collin, S. P., and Hemmi, J. M. (2017). Retinal temporal resolution and contrast sensitivity in the parasitic lamprey Mordacia mordax and its non-parasitic derivative Mordacia praecox. J. Exp. Biol. 220, 1245–1255. doi: 10.1242/jeb.150383
Watson, W. H., Bedford, L., and Chabot, C. C. (2008). Rhythms of locomotion expressed by Limulus polyphemus, the American horseshoe crab: II. Relationship to circadian rhythms of visual sensitivity. Biolog. Bull. 215, 46–56. doi: 10.2307/25470682
Weber, C. (1982). Electrical-activities of a type of electroretinogram recorded from the ocellus of a jellyfish, polyorchis-penicillatus (hydromedusae). J. Exp. Zool. 223, 231–243. doi: 10.1002/jez.1402230305
Wei, J. Y., Wang, H. L., and Yang, X. L. (1995). Different effects of acute hypoxia on rod and cone signals of crucian carp retina. Chin. J. Appl. Physiol. 1995, 193–196.
Yamamoto, M., Takasu, N., and Uragami, I. (1985). Ontogeny of the visual-system in the cuttlefish, sepiella-japonica .2. intramembrane particles, histofluorescence, and electrical responses in the developing retina. J. Comparat. Neurol. 232, 362–371. doi: 10.1002/cne.902320308
Yang, X. L., Fan, T. X., and Li, J. D. (1990). Electroretinographic b-wave merely reflects the activity of the rod system in the dark-adapted carp retina. Vision Res. 30, 993–999. doi: 10.1016/0042-6989(90)90108-w
Yonemura, D., Aoki, T., and Tsuzuki, K. (1962). Electroretinogram in diabetic retinopathy. Archiv. Ophthal. 68, 19–24.
Zheng, W. Y., and Cai, M. J. (1981). Electrophysiological study on the adaptation characteristics of electroretinogram in Sepiella japonica. Mar. Sci. 1981, 37–40.
Keywords: aquatic animals, electroretinogram (ERG), visual sensitivity, photoreceptor, diel rhythm
Citation: Gao X, Lin S, Zhang M, Lyu M, Liu Y, Luo X, You W and Ke C (2022) Review: Use of Electrophysiological Techniques to Study Visual Functions of Aquatic Organisms. Front. Physiol. 13:798382. doi: 10.3389/fphys.2022.798382
Received: 20 October 2021; Accepted: 07 January 2022;
Published: 27 January 2022.
Edited by:
Xiaotong Wang, Ludong University, ChinaReviewed by:
Dong Zhang, Chinese Academy of Fishery Sciences, ChinaWeiqun Lu, Shanghai Ocean University, China
Copyright © 2022 Gao, Lin, Zhang, Lyu, Liu, Luo, You and Ke. This is an open-access article distributed under the terms of the Creative Commons Attribution License (CC BY). The use, distribution or reproduction in other forums is permitted, provided the original author(s) and the copyright owner(s) are credited and that the original publication in this journal is cited, in accordance with accepted academic practice. No use, distribution or reproduction is permitted which does not comply with these terms.
*Correspondence: Caihuan Ke, chke@xmu.edu.cn
†These authors have contributed equally to this work