 Anna McCann
 Adrian Luca
 Patrizio Pascale
 Etienne Pruvot
 Jean-Marc Vesin
94% of researchers rate our articles as excellent or good
Learn more about the work of our research integrity team to safeguard the quality of each article we publish.
Find out more
ORIGINAL RESEARCH article
Front. Physiol., 29 September 2022
Sec. Cardiac Electrophysiology
Volume 13 - 2022 | https://doi.org/10.3389/fphys.2022.1001060
This article is part of the Research TopicAtrial Fibrillation: Technologies for Investigation, Monitoring and Treatment, Volume IIView all 16 articles
Background: Signal processing tools are required to efficiently analyze data collected in body-surface-potential map (BSPM) recordings. A limited number of such tools exist for studying persistent atrial fibrillation (persAF). We propose two novel, spatiotemporal indices for processing BSPM data and test their clinical applicability through a comparison with the recently proposed non-dipolar component index (NDI) for prediction of single-procedure catheter ablation (CA) success rate in persAF patients.
Methods: BSPM recordings were obtained with a 252-lead vest in 13 persAF patients (8 men, 63 ± 8 years, 11 ± 13 months sustained AF duration) before undergoing CA. Each recording was divided into seven 1-min segments of high signal quality. Spatiotemporal ventricular activity (VA) cancellation was applied to each segment to isolate atrial activity (AA). The two novel indices, called error-ratio, normalized root-mean-square error (ERNRMSE) and error-ratio, mean-absolute error (ERABSE), were calculated. These indices quantify the capacity of a subset of BSPM vest electrodes to accurately represent the AA, and AA dominant frequency (DF), respectively, on all BSPM electrodes over time, compared to the optimal principal component analysis (PCA) representation. The NDI, quantifying the fraction of energy retained after removal of the three largest PCs, was also calculated. The two novel indices and the NDI were statistically compared between patient groups based on single-procedure clinical CA outcome. Finally, their predictive power for univariate CA outcome classification was assessed using receiver operating characteristic (ROC) analysis with cross-validation for a logistic regression classifier.
Results: Patient clinical outcomes were recorded 6 months following procedures, and those who had an arrhythmia recurrence at least 2 months post-CA were defined as having a negative outcome. Clinical outcome information was available for 11 patients, 6 with arrhythmia recurrence. Therefore, a total of 77 1-min AA-BSPM segments were available for analysis. Significant differences were found in the values of the novel indices and NDI between patients with arrhythmia recurrence post-ablation and those without. ROC analysis showed the best CA outcome predictive performance for ERNRMSE (AUC = 0.77 ± 0.08, sensitivity = 76.2%, specificity = 84.8%).
Conclusion: Significant association was found between the novel indices and CA success or failure. The novel index ERNRMSE additionally shows good predictive power for single-procedure CA outcome.
In contrast to the many studies that have analyzed the 12-lead electrocardiogram (ECG) for the study of atrial fibrillation (AF), relatively few have developed AF analysis tools for body-surface potential map (BSPM) signals. Despite the development of these 12-lead ECG based indices, to our knowledge, the use of ECG for AF in clinical practice is still limited to its diagnosis (Lankveld et al., 2014). The traditional 12-lead ECG was designed to capture mainly ventricular activity (VA), therefore, BSPM signals could harbor additional information from the atrial activity (AA) relevant for AF analysis.
Various studies have performed analyses of BSPM data for the study of AF. For example (Bonizzi et al., 2010), applied principal component analysis (PCA) to BSPM data and proposed two novel parameters derived from the resulting PCA mixing matrices to quantify complexity and stationarity in BSPM recordings, finding a significant inverse correlation between the two. It was additionally found that these parameters formed clusters for organized vs. disorganized AF, but no further clinical application was proposed by the authors. The study in (Di Marco et al., 2012) proposed four parameters to quantify spatial organization, variability, spectral concentration, and spectral variability of BSPM signals. They found that greater spatial organization was associated with reduced variability of spatial organization over time, and that lower spectral variability was associated with increased spectral concentration. However, the clinical impact of the parameters was not assessed. Later (Meo et al., 2018), proposed the non-dipolar component index (NDI), which was calculated as the residual variance not accounted for by the first three principal components (PCs) of concatenated TQ segments of BSPM signals. It was found that the NDI correlated with AF complexity and AF termination at the end of catheter ablation (CA) procedures. However, correlation with clinical CA outcome was not reported, and the NDI leaves unexploited the temporal variability of BSPM signals found to be indicative of AF organization in (Bonizzi et al., 2010; Di Marco et al., 2012). These parameters do however show promise for capturing information from BSPM signals relevant for the computational analysis of AF signals. Additionally, they are all linked in that they use PCA in the computation of their indices. However, insufficient attention has been paid to the temporal aspect of the data, with most of the parameters using concatenated TQ segments. While this method has merit as it eliminates the possibility of interfering VA, it precludes a temporal analysis, and we aim to address this with our novel indices.
Despite the above research, the use of BSPM for persAF treatment remains limited in clinical practice, and there are not many tools available for its efficient analysis. Apart from its use in electrocardiographic imaging (ECGI), the clinical advantage of BSPM over 12-lead ECG signal analysis for AF remains unclear. In this study, we draw on the above research to propose two novel indices also employing PCA: error ratio, normalized root-mean square error (ERNRMSE) and error ratio, mean absolute error (ERABSE), which exploit spatiotemporal information in BSPM recordings. The indices make use of the full set of BSPM electrodes by measuring how well only a subset of electrodes can represent AA on all BSPM electrodes compared to the optimal PCA-representation. The indices also encapsulate the temporal variability of the AA using long-duration BSPM recordings. We hypothesized that when subsets can represent AA nearly as well as the optimal PCA-representation, the AF is more organized and stable with time, and thus more likely to respond well to CA treatment. When the optimal PCA representation is much better than the electrode subset representation, we hypothesized that this could be indicative of a disorganized AF that is more variable over time, manifested as greater spatial variability in the recorded AA on the BSPM vest. In this way, we aim to provide additional tools which efficiently utilize the large amount of data incurred when working with BSPM recordings and show their clinical relevance for persAF disease quantification through correlation with and prediction of single-procedure CA outcome. We first discuss the study population and BSPM signal acquisition and pre-processing. An overview of the novel indices and BSPM vest electrode subset selection required for their calculation is then given. The statistical cross-validation protocol used to evaluate their clinical relevance is then presented. Finally, the results, implications, and limitations of the study are discussed.
We studied a total of 13 patients admitted for CA of drug-refractory persAF. Their baseline characteristics are reported in Table 1. The CA endpoint was complete pulmonary vein isolation (PVI). Electrical cardioversion was performed on patients still in AF after PVI completion to restore sinus rhythm (SR). Patients were then monitored throughout a follow up period and divided into two groups: 1) SR and arrhythmia recurrence (AR), according to whether they experienced an AR within 6 months, but at least 2 months after undergoing CA. The study protocol was approved by the Lausanne University Hospital Human Research Ethics Committee, and all patients provided written informed consent.
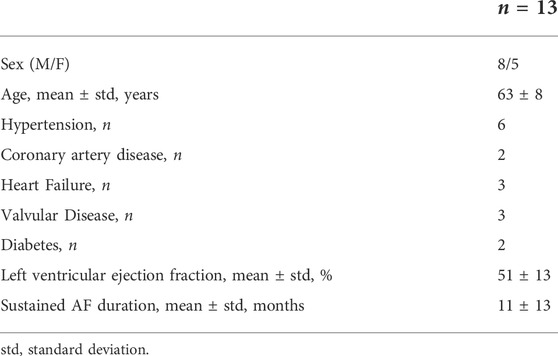
TABLE 1. Study population baseline characteristics.
BSPMs were recorded with a 252-lead vest (CardioInsight™, Medtronic, MN, United States) at a sampling frequency of 1 kHz in persAF patients the day before undergoing CA at Lausanne University Hospital in Switzerland. A schematic of the vest is shown in Figure 1. Mean signal recording duration was 17 ± 4 min. Electrode contact and signal quality varied considerably over the course of the recording duration. Recordings were therefore visually inspected, and 1-min segments with good signal quality were extracted from the long duration recordings for further analysis. Remaining leads with poor signal quality were removed (up to 30 leads), and signals from high quality leads were used to estimate BSPM signals at the removed locations using interpolation. Recordings were then processed for removing baseline drift and high frequency noise (bandpass filter 1–30 Hz). R-peaks were detected and QRST delineation was performed in each lead using an open source ECG delineation toolbox (Pilia et al., 2021). In order to evaluate BSPM signals free of ventricular interference and enable a temporal analysis, the spatiotemporal method for QRST cancellation was applied (Stridh and Sornmo, 2001). This method, which operates on a single-beat, multi-lead basis, was chosen due to its exploitation of multiple leads and its tested performance (Langley et al., 2006). Clustering was applied to QRST complexes across all leads, so that the complexes used in each ensemble average had similar shapes. The extracted 1-min atrial activity BSPM segments (AA-BSPM) devoid of VA were then further normalized to have zero mean and unit variance, and low-pass filtered by a 10th order Butterworth filter with a cutoff frequency of 30 Hz to eliminate signal discontinuities introduced by spatiotemporal VA cancellation. An example of a BSPM signal before and after AA extraction is shown in Figure 2.
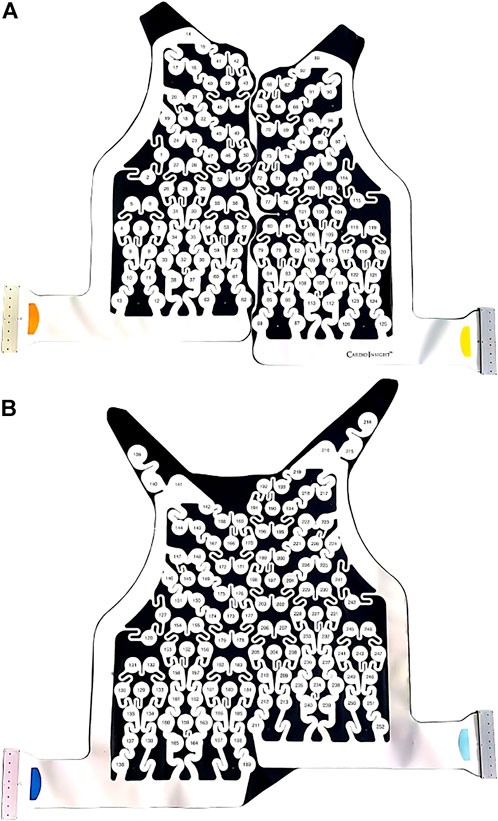
FIGURE 1. CardioInsight™ BSPM vest with 252 unipolar electrodes. The reference electrode is not shown. (A) Anterior part of vest with 126 electrodes. (B) Posterior part of vest with 126 electrodes.
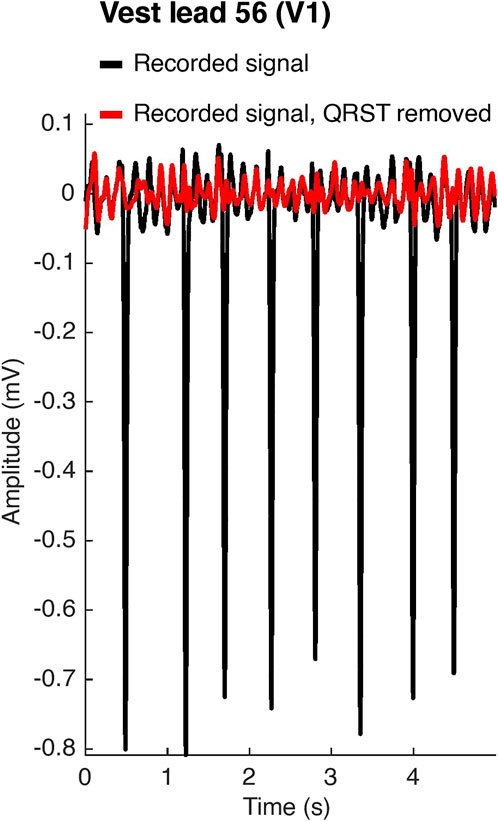
FIGURE 2. Atrial activity extraction. In black, the original recorded signal on vest lead 56, which corresponds to lead V1 of the standard 12-lead ECG configuration. In red, the signal after spatiotemporal QRST cancellation.
The power spectral densities (PSD) of all AA-BSPM segments were computed using a Welch periodogram (2-s Hamming window with a 4,096 Fast Fourier transform per window and 50% window overlap) to determine the body surface distribution of the atrial DF. The DF was defined as the highest peak in the power spectrum.
The purpose of this section is to describe how only a subset of vest electrode signals may be used to reconstruct the signals on all vest electrodes, as this is an important concept in the development of the novel indices ERNRMSE and ERABSE (elaborated in Section 2.5). Each AA-BSPM segment may be represented by a matrix
whose known solution is A = S+X, where (⋅)+ and ‖ ⋅‖F denote the Moore-Penrose pseudoinverse and the Frobenius norm of a matrix, respectively. Then, to represent the full BSPM signal matrix X as accurately as possible, one should aim to find a subset S of vest electrode signals such that the AA-BSPM segment X is best represented by S, most commonly in terms of the Frobenius norm:
Finding the subset S is thought to be an NP-hard problem, with
where Vk contains the first k columns of V. Then the minimum approximation error
The purpose of this section is to describe the different subsets of vest electrodes we used for the calculation of the novel indices ERNRMSE and ERABSE, which will be elaborated in the next section. We also describe the characterization of the vest electrode subsets in terms of their capacity to accurately represent AA-BSPM signal information on all vest electrodes and compare this to the optimal PCA representation, as this is an important concept for the understanding of the novel indices.
1) Sequential: This algorithm was first proposed by (Lux et al., 1978) and later used by (Guillem et al., 2008, 2009) for selecting electrode subsets from a wider array of body vest electrodes. As its name suggests, this sequential approach greedily chooses electrodes one after the other, at each step picking the column containing the electrode signal which minimizes the reconstruction error, i.e., Eq. 2. This algorithm is in no way guaranteed to be optimal, since at each step it only considers that one additional electrode must be selected, rather than considering the entire subset. However, it can be relatively efficient (Farahat et al., 2011; Altschuler et al., 2016) and in general has had good performance for electrode selection. Therefore, it was chosen for use in this study. We call SEQk the subset of k vest electrodes (columns) chosen sequentially from the BSPM signal matrix X, for k = 8 : 30 electrodes. The lower limit of k = 8 electrodes was chosen to equal the number of independent leads used in the standard ECG, and the upper limit of k = 30 electrodes was chosen as a result of suggestions that roughly 30 electrodes are necessary to accurately represent AA in AF (Guillem et al., 2009).
2) Standard ECG: A subset of BSPM vest electrodes closest to the positions of the six precordial leads plus two limb leads used in the standard 12-lead ECG was extracted. We refer to this subset, which contains eight electrodes, as ECG8.
3) Augmented ECG: Additionally, there have been suggestions that posterior electrodes may be desirable to better capture left atrial activity in AF. Therefore, a subset of vest electrodes closest to the augmented ECG suggested in (Petrutiu et al., 2009) consisting of the eight electrodes in the ECG8 subset plus three posterior electrodes, V8, V9, and V10 in the same horizontal plane as V6, was tested. We refer to this subset, which contains 11 electrodes, as ECG11.
Subsets were compared regarding how well they could represent the full BSPM signal matrix as follows. SEQ8:30, ECG8, ECG11, and PCA8:30 subset reconstructions were calculated for 5-s windows of each AA-BSPM segment. Given
The second was the mean absolute difference (ABSE) across all electrodes between the atrial DF on each vest electrode signal of X and
where L = 252 vest electrodes in our case. The above measures were calculated on 5-s windows of the 1-min AA-BSPM segments extracted from each patient and then averaged over all windows, for
The purpose of this section is to combine the concepts discussed in Sections 2.3, 2.4 to introduce the novel indices ERNRMSE and ERABSE. These indices quantify the capacity of a subset of BSPM vest electrodes to accurately represent the AA, and the atrial DF, respectively, on all BSPM electrodes over time, compared to the optimal PCA representation of the same rank as the electrode subset.
For the calculation of the indices, the 1-min AA-BSPM segments were divided into windows of 5-s as in Section 2.4. The SEQ8 and SEQ11 subsets were obtained for the first window, and reconstructions were obtained on subsequent windows using these subsets and the corresponding matrices A from Eq. 1 determined for the first window. Concretely, for the first 5-s window, the solution to Eq. 1 is
The second index, ERABSE, is given by the ratio of the mean-absolute error between the atrial DFs extracted on each electrode of the subset vs. PCA reconstructions:
The above indices were calculated on each 5-s window following the first window of the 1-min AA-BSPM segments, then averaged across all windows, for one value per 1-min AA-BSPM segment. We chose to calculate these indices for the SEQ8 and SEQ11 subsets to allow a direct comparison with the standard and augmented ECG subsets, ECG8 and ECG11.
We hypothesized more organized, easier to treat forms of AF should have lower error ratios (ER), indicating stability in the AF dynamics between windows. This is because for lower ERs, the subset of electrodes chosen for the first window and A1 permit a reconstruction of the ith window that is closer to the optimal PCA reconstruction of the same rank. As a comparison to another BSPM index utilizing PCA for AF analysis, we calculated the NDI proposed by (Meo et al., 2018), which was found to be useful for quantifying AF complexity, choosing patients eligible for AF ablation and assessing therapy impact. The NDI was calculated as the residual variance not accounted for by the first three PCs of each AA-BSPM window. Note also that this index uses only PCA and therefore is not dependent on any particular subset of electrodes.
The purpose of this section is to describe how the different electrode subsets introduced in Section 2.4 were compared in terms of their capacity to accurately represent AA-BSPM signal information on all vest electrodes compared to the optimal PCA representation. We also describe the methods used to quantify the relationship between the indices ERNRMSE, ERABSE and NDI, and single-procedure CA success rate.
Calculated values of continuous parameters are expressed as mean ± standard deviation. The statistical distributions of all parameters were checked using a Lilliefors test. Statistical inter-group differences were calculated as mean p-values across 3-folds, with 20% of the parameter values left out of each fold. One-way analysis of variance (ANOVA) was used for normally distributed data, or Wilcoxon’s rank sum test was used for non-normally distributed data. Statistical tests were performed across folds to reduce the likelihood of chance group differences due to a small data set, and statistical significance was considered for p-values less than 0.05. For comparing the different electrode subsets in terms of their capacity to accurately represent AA-BSPM segments, we checked for statistical differences of the NRMSE and ABSE parameters calculated using the different electrode subsets (SEQk, ECG8, ECG11), or using the corresponding number of PCs (PCAk). For comparing the relationships between single-procedure CA outcome and ERNRMSE, ERABSE, and NDI, we checked for statistical differences between these indices calculated for AA-BSPM segments associated with AR and SR outcome groups.
For indices ERNRMSE, ERABSE, and NDI displaying statistically significant differences between groups, univariate logistic regression classifiers were used to test their predictive power for single-procedure CA outcome. We used group-wise 3-fold cross-validation (CV) to ensure that indices calculated from different AA-BSPM segments of the same patient were only assigned to either the train or test set (80/20) for each fold. The resulting receiver operating curves (ROC) were analyzed to obtain area under the curve (AUC) to compare the predictive power of each index. We reported the AUC for AA-BSPM segment-wise classification as mean ± standard deviation over all CV folds, and the sensitivity and specificity were reported for the optimal classification threshold value determined through ROC analysis. The sensitivity and specificity were the fraction of true positive and true negative cases correctly identified, respectively, where AR was considered a positive case, and SR was considered a negative case.
At the time of this study, clinical outcome information was available for 11 patients, six of whom experienced an AR (55%) (3.4 ± 0.9 months post-CA). Therefore, only BSPM data from 11 patients were available for the part of the study associating the novel indices to CA outcome. Patients experiencing an AR were offered repeat procedures, however, in this study, only signals recorded prior to the first procedure and associated clinical outcomes were analyzed. Seven high quality 1-min AA-BSPM segments were extracted from the long duration BSPM recordings of each patient. Therefore, 91 1-min AA-BSPM segments were available for the analysis with results described in Section 3.2, and 77 AA-BSPM segments for the results described in Sections 3.3, 3.4, with each segment associated with an SR or AR outcome.
A representation of the spatial distributions of the SEQ8, SEQ11, ECG8, and ECG11 subsets used for AA-BSPM reconstruction is shown in Figure 3. For each subset type, the color of each electrode represents its occurrence in all the subsets used to calculate NRMSE and ABSE, that is, in what ratio of the tested subsets the electrode was included. It can be seen in Figures 3A,B, that for SEQ subsets, both anterior and posterior electrodes were included in the subsets, with certain torso regions (upper and lower) being less represented in the subsets, while the mid-section regions were in general more represented. For the ECG subsets, the same subset of electrodes was applied to each 5-s window of AA-BSPM data, as seen in Figures 3C,D.
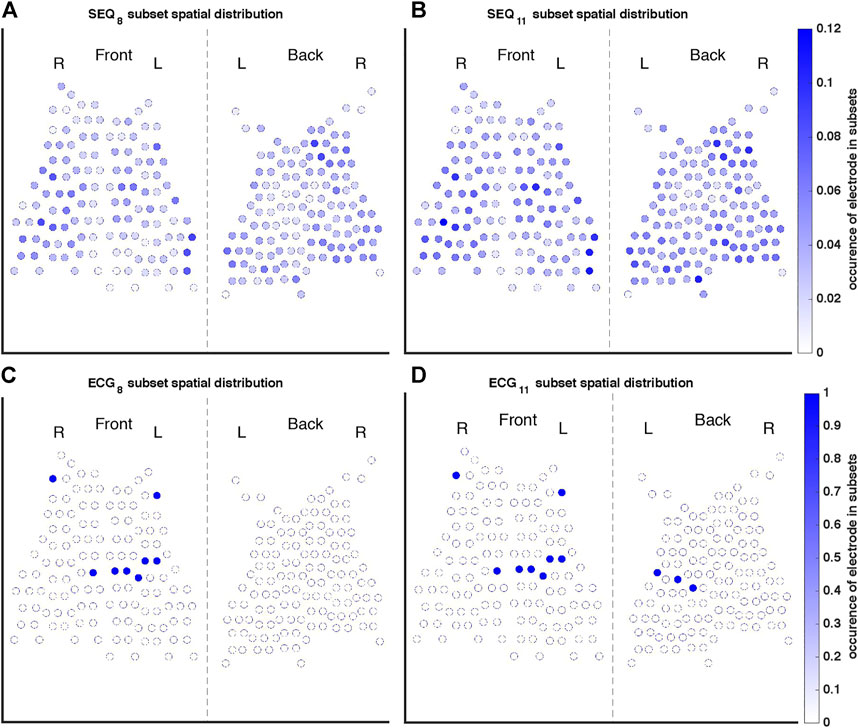
FIGURE 3. Occurrence of each electrode in the (A) SEQ8, (B) SEQ11, (C) ECG8, and (D) ECG11 subsets. The color of each electrode indicates its occurrence in all of the subsets used to calculate reconstruction performance measures, where, for example, one indicates the electrode was present in every subset tested, and 0.1 indicates the electrode was present in 10% of subsets.
The similarity between reconstructed and original BSPM signals is shown in Figure 4. A 5-s window of a signal recorded on vest lead 57, close to the position of precordial lead V1, as well as its optimal least-squares reconstructions using the ECG8 and SEQ8 subsets associated with the window and its PCA8 reconstruction are demonstrated in Figure 4A. It can be seen that morphological characteristics of the signal were mostly captured in the reconstructed signals, however, the amplitude of the recorded signal was not perfectly reconstructed. The power spectral densities of the original and reconstructed signals are shown in Figure 4B. It can be seen that the DF was correctly captured on this electrode. The NRMSE and ABSE as a function of number of electrodes included in the subsets are shown in Figures 4C,D, taken as a mean across all patients, with error bars representing the 95% confidence interval. In addition, the PCAk reconstruction obtained for k PCs equaling the number of electrodes is shown. As expected, reconstructions using ECG8 and ECG11 subsets had higher NRMSE and ABSE values than reconstructions using SEQ8 and SEQ11, and this difference was statistically significant (p < 0.01). In addition, it can be seen that PCAk reconstruction consistently performed better than SEQk reconstruction, and this difference was also statistically significant for k = 8 : 30, (p < 0.01). An example showing the DF of each electrode for original recorded AA-BSPM and AA-BSPM using ECG8, SEQ8, and PCA8 reconstruction is shown in the Supplementary Materials, where it can be seen that spatial differences in the original DFs at different parts of torso were mostly captured by SEQ8 and PCA8 reconstruction, and to a lesser extent by ECG8 reconstruction.
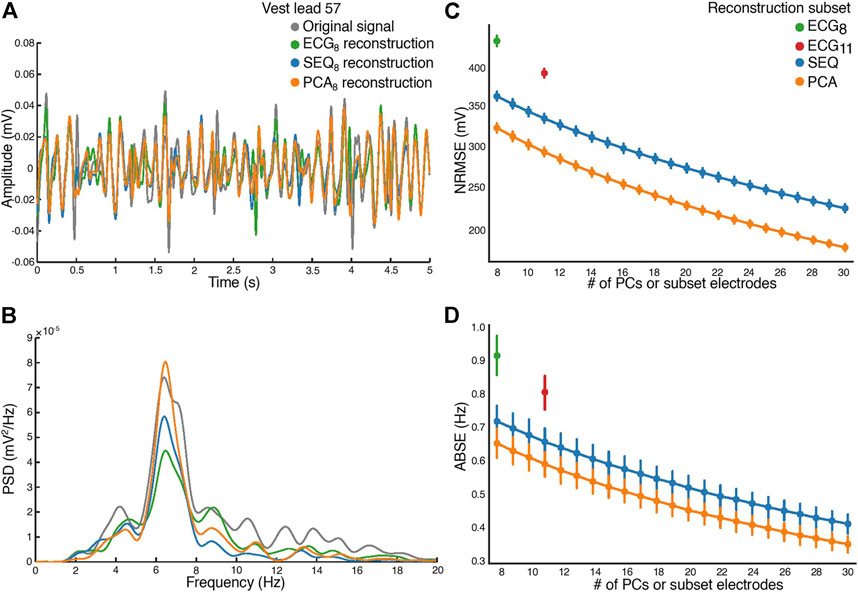
FIGURE 4. Atrial activity reconstruction. (A) A 5-s window of the original recorded (in grey) and reconstructed signals, for vest electrode 57, close to V1. Reconstruction with the ECG8 subset (green), SEQ8 subset (blue), and PCA8 (orange). (B) The corresponding power spectral densities (PSD) of the original recorded and reconstructed signals. (C) Normalized root-mean square reconstruction error (NRMSE), and (D) mean absolute error (ABSE), as a function of number of principal components or vest electrodes used in subset for reconstruction.
For the analysis of ERNRMSE and ERABSE, only the indices calculated using SEQ8, SEQ11, PCA8, and PCA11 were used, to allow for comparison with ECG8 and ECG11. Shown in Figure 5 are the (A) ERNRMSE, (B) ERABSE, and (C) NDI values according to CA outcome. The associated mean ± standard deviation values of the indices are shown in Table 2. There was a statistically significant difference in the NDI value between the SR and AR groups, with NDI greater in the SR group. Greater ERNRMSE values were associated with AR following single-procedure CA, while lower ERNRMSE values were associated with SR, for all electrode subsets tested. Finally, for ERABSE, greater values were again observed for AR than SR, with statistical significance only for the ECG8 and SEQ11 subsets.
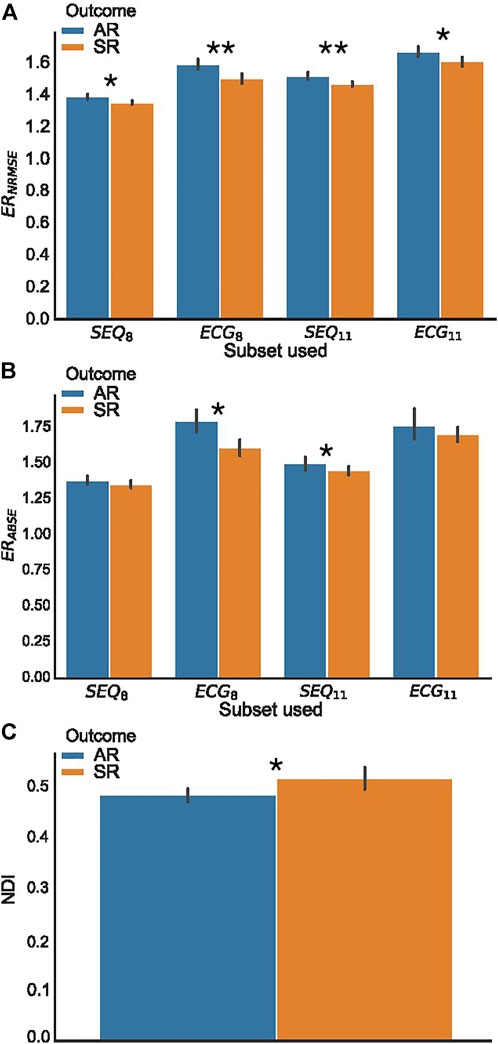
FIGURE 5. BSPM analysis indices, grouped according to clinical outcome. (A) Error ratio NRMSE to PCA (ERNRMSE); (B) Error ratio ABSE to PCA (ERABSE); (C) Non-dipolar component index (NDI). Significant differences between AR and SR outcome means are indicated by asterisks. (*p < 0.05, **p < 0.01.).
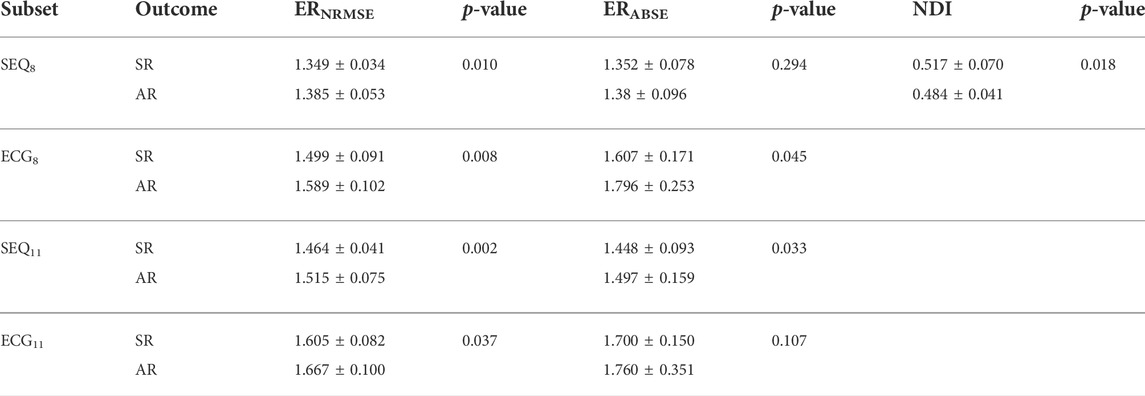
TABLE 2. ERNRMSE, ERABSE, and NDI values by vest electrode subset (not applicable for NDI) and single procedure CA outcome, expressed as mean ± standard deviation. p-values were computed as means across three folds of data, in which a p-value for the statistical significance between index values by outcome was computed using 80% of the AA-BSPM segments in each fold.
A summary of the ROC analysis of the NDI, ERNRMSE, and ERABSE parameters for prediction of CA outcome is shown in Table 3. Note that sensitivity and specificity values are shown for segment-wise classification. It can be seen that ERNRMSE displayed the most consistent performance across folds and electrode subsets, with AUC = 0.77 ± 0.08, sensitivity = 76.2%, and specificity = 84.8% for ERNRMSE calculated with the SEQ11 electrode subset. Despite the associations between NDI and ERABSE and CA outcome, the predictive performances of these indices were not as consistent as for ERNRMSE. The ROC curves associated with ERNRMSE calculated for each subset are shown in Figure 6. The ROC curves associated with NDI and ERABSE (for statistically significant subsets) are shown in the Supplementary Materials.
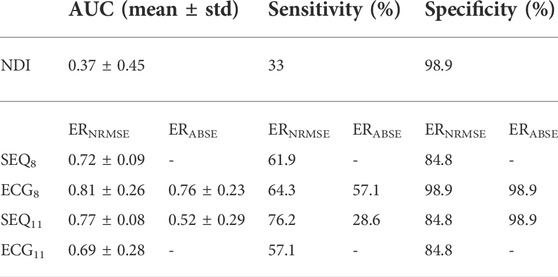
TABLE 3. Predictive power of BSPM indices for CA outcome, for each of the tested subsets. Sensitivity and specificity indicate the rate of detection of arrhythmia recurrence and sinus rhythm 6 months post single-procedure CA, respectively. AUC, area under the curve.
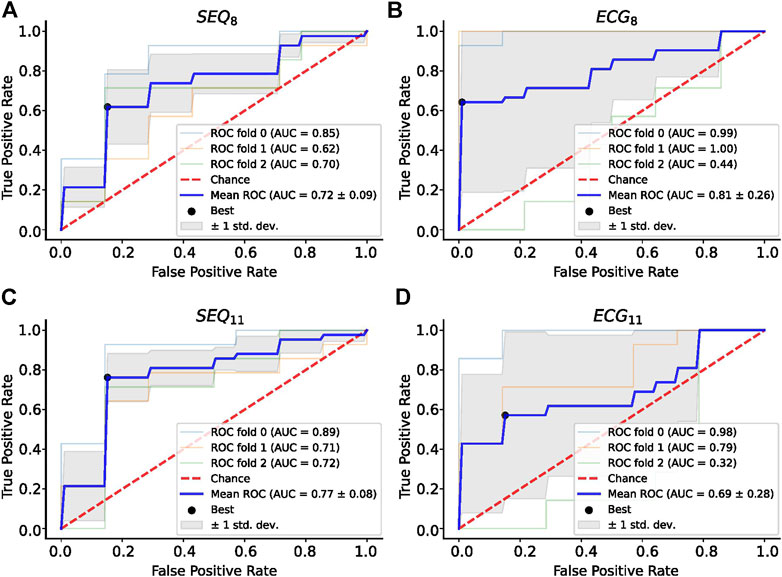
FIGURE 6. ROC Analysis for ERNRMSE for predicting CA outcome calculated with (A) SEQ8; (B) ECG8; (C) SEQ11; and (D) ECG11 vest electrode subsets. The optimal tradeoff between true positive rate and false positive rate is indicated by a black dot.
To further test the efficacy of ERNRMSE, we repeated the statistical comparison and predictive performance analysis for SEQ subsets with 8–30 electrodes, to see whether performance changed for different numbers of electrodes included in the SEQ subset. The results are shown in Figures 7, 8. It can be seen in Figure 7A that the ERNRMSE was greater in the AR group than SR group when calculated with all SEQ8:30 subsets. However, this difference was only statistically significant for ERNRMSE calculated with SEQ8:24 subsets, as shown in Figure 7B, with the p-values from significance testing transformed as
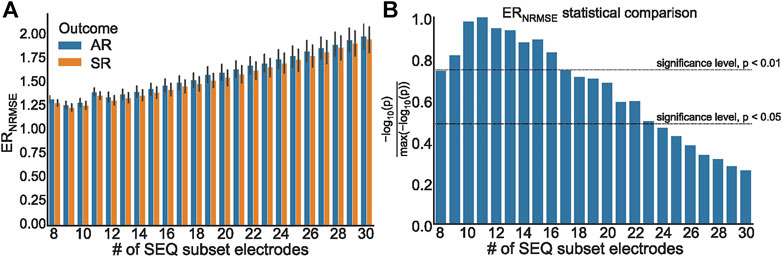
FIGURE 7. (A) ERNRMSE values grouped according to clinical outcome, calculated with SEQ8:30 subsets; (B) Representation of p values associated with statistical comparison of ERNRMSE mean values for AR and SR patient groups. The p = 0.05 and p = 0.01 significance levels are indicated by dashed lines.
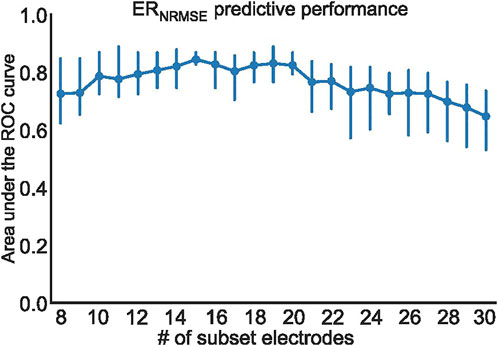
FIGURE 8. Mean and standard deviation of the area under the ROC curve (AUC) computed using three cross-validation folds, for ERNRMSE performance for predicting CA outcome when calculated with SEQ8:30 electrodes.
In this study, we developed two novel, fully spatiotemporal indices for the efficient processing of long-duration BSPM signals collected from patients with persAF. The use of spatiotemporal ventricular activity cancellation rather than short, nonconsecutive TQ segments allowed the incorporation of a temporal component in the analysis. By combining PCA and the temporal component, a true spatiotemporal characterization was achieved. To the best of our knowledge, this is the first study to propose indices exploiting temporal irregularity in long-duration BSPM recordings for persAF analysis, with a view to predicting AR following single procedure CA. The selection of which electrodes to use for the calculation of the novel indices can be automatically performed using the sequential subset selection method, or can be adapted for different subsets of electrodes, such as the standard or augmented ECG lead configurations. Finally, in our study, we have investigated the relationship between the proposed novel indices and their correlation with and predictive power for CA outcome. We found that a mean AUC of up to 0.8 may be achieved for predicting arrhythmia recurrence in persAF patients who underwent single-procedure CA for the novel index ERNRMSE.
PCA-based indices have been used extensively in ECG signal processing (Castells et al., 2007), with applications including extraction of atrial fibrillatory waves, quantification of AF spatial complexity and organization, and efficient analysis of BSPM data. In this study, we have included a framework for understanding how PCA-based reconstruction of AA-BSPM signals compares to reconstruction using a subset of vest electrode signals. The use of vest electrode reconstruction was based on previous studies, which have demonstrated that the full BSPM signal matrix may be projected onto a smaller matrix containing only a subset of BSPM vest electrode signals (Lux et al., 1978; Guillem et al., 2008, 2009; Feng et al., 2019). The resulting reconstruction error between the original and projected matrices has been shown to depend on the number of electrodes included in the subset, as well as the type of BSPM signals. For example, in (Guillem et al., 2009), it was found that with the same number of electrodes, reconstruction error was lower for ventricular than atrial activity. In our study, as the number of electrodes included in the ECG or SEQ subsets increased, the NRMSE and ABSE both decreased, in line with results from (Guillem et al., 2009). We also showed for the first time in our study the same trend for optimal PCA reconstruction. It can be noted that for all numbers of electrodes tested, there is a greater overlap between the ABSE values than NRMSE values between the different subset types. This could be because the reconstruction method used optimizes for NRMSE, and not ABSE.
Regarding the comparison of different BSPM electrode subsets, it was found that SEQ subsets more accurately represent BSPM signal data than standard and augmented ECG subsets in both signal domains, manifested through lower NRMSE and ABSE values for both k = 8 and k = 11 electrodes included in the vest subset. This reinforces the idea that standard ECG electrode configurations are not optimal in terms of accurately representing the full BSPM signal matrix. Since results from previous works have suggested that the addition of posterior electrodes may be useful to better reflect left atrial activity in AF (Ihara et al., 2007; Petrutiu et al., 2009; Buttu et al., 2013; Guillem et al., 2013), we did include the augmented ECG11 subset. Interestingly, it was found that the decrease in reconstruction error between the ECG8 and ECG11 subsets was greater than the decrease in error between the SEQ8 and SEQ11 subsets, lending support to the argument that the addition of carefully positioned posterior electrodes may indeed be beneficial for representing AA-BSPM data. Additionally, it was found that PCA-based reconstruction performs better than electrode subset based reconstruction, in both the temporal and frequency domains. This is to be expected, since PCA explicitly optimizes for the reconstruction criterion. However, this remains an important result since to our knowledge, the gap between electrode subset and PCA reconstruction had not been previously investigated. We hypothesized that this gap may contain useful information related to AF signal analysis.
The finding in our study that ERNRMSE, ERABSE, and NDI all show statistically significant differences between AA-BSPM segments associated with AR or SR outcomes demonstrates that each of these indices shows some potential to be used as computational tools for AF disease management. Since calculation of ERNRMSE and ERABSE required selection of a subset of vest electrodes, these indices were calculated for standard and augmented ECG subsets (ECG8 and ECG11, respectively), as well as for sequentially chosen subsets (SEQ8 and SEQ11), which differ between AA-BSPM segments, to test the robustness of the indices with respect to both which and how many electrodes were included in the subsets.
Many previous studies have investigated capturing AF information using surface recorded ECG signals, however, most often using a single or limited number of leads. This prevents the exploitation of the spatial diversity of multi-lead ECGs and is dependent on the available electrode signal containing information representative of the underlying AF. Since electrode placement cannot be exact, and patient anatomy varies widely, this is not always guaranteed. Further, it has already been shown that inclusion of multiple leads is beneficial, leading to greater correlation between calculated 12-lead ECG indices and AF complexity and outcomes in (Meo et al., 2013; Zarzoso et al., 2016). The idea in this study was therefore to add to the limited number of BSPM indices for AF analysis, integrating both temporal and spatial information.
In (Bonizzi et al., 2010), it was shown that reconstruction error using the PCA rank-3 approximation of TQ segments of BSPM signals recorded during AF was capable of separating AA signals into clusters based on levels of AF organization, with greater reconstruction error corresponding to higher AF complexity and lower stationarity. Later, (Di Marco et al., 2012), using PCA-based indices, found that higher spatial organization, indicating easier to treat forms of AF, was correlated with more temporally stable atrial activation patterns. We hypothesized that lower ERNRMSE values would therefore be observed among SR patients, indicating more stability in the AF dynamics between BSPM windows, and this was indeed the case. The finding that ERNRMSE displayed greater values in AR AA-BSPM segments than SR segments for all four electrode subsets lends support to its use as a robust index for predicting single-procedure AF outcome. Further, also in (Di Marco et al., 2012), it was found that greater temporal variability was associated with lower spectral concentration. Therefore, we hypothesized again that lower ERABSE values would be observed for SR patients. While the ERABSE calculated for AR patients was greater than that for SR patients, this difference was only statistically significant for two of the electrode subsets tested, potentially making it less robust than ERNRMSE. This lower robustness could relate to the finding discussed above that there was a greater overlap in ABSE values calculated for subset vs. PCA reconstruction.
The NDI was unexpectedly found to be greater for SR segments than AR segments, meaning that the remaining variance unexplained by the first three PCs of the BSPM signal data was on average greater for SR segments than AR segments. This is contrary to the result in (Meo et al., 2018), which found smaller NDI values in concatenated TQ segments of BSPM data collected from patients with successful procedural CA outcome. Several key differences in our study could explain the contradictory results, including our use of longer duration AA-BSPM segments rather than concatenated TQ segments. Additionally, the study in (Meo et al., 2018) compared NDI values calculated for procedural outcomes, while in this study we used single-procedure clinical outcomes. Future studies testing the NDI may shed light on this discrepancy.
The clinical impact of the indices tested in this study depends not only on their association with CA outcomes but also their ability to predict CA outcomes. Therefore, we tested classification performance of univariate logistic regression classifiers for ERNRMSE, ERABSE, and NDI. The use of group-wise CV was important to ensure AA-BSPM segments extracted from the same patient were included only in either the train or test set of each fold. Reporting both mean and standard deviation values of the AUC for each classifier also gave an indication of the CA outcome prediction model variance for different folds of the data. These were important features of our methodology considering the small-size of our data set.
Importantly, only ERNRMSE displayed consistent results in predictive power across tested vest electrode subsets. The AUCs for this index calculated with each subset (SEQ8: 0.72 ± 0.09, ECG8: 0.81 ± 0.26, SEQ11: 0.77 ± 0.08, ECG11: 0.69 ± 0.28) were as good or better than the AUC associated with NDI (0.69), found in (Meo et al., 2018), and the model variance was not reported in their study. Additionally, the (Meo et al., 2018) study also tested prediction performance for NDI combined with clinical parameters, achieving an AUC of 0.7. Our results were also as good or better than those described in (Lankveld et al., 2016), in which predictive performance varied from AUC = 0.76 ± 0.15 for 12-lead ECG derived complexity parameters alone to AUC = 0.79 ± 0.13 for ECG plus clinical parameters. Additionally, the results were in line with those obtained in (Zeemering et al., 2018), for which an AUC of 0.66, 95% confidence interval [0.64–0.67] was obtained for the best ECG parameter studied (dominant atrial frequency in lead II). The study also reported better performance when several ECG parameters were combined (AUC 0.78 [0.76–0.79]), and best performance for combining ECG plus clinical parameters (AUC = 0.81 [0.79–0.82]). It is important to note that the variance across CV folds was less for ERNRMSE calculated with SEQ subsets compared to ECG subsets, and in general lower than model variances reported in other studies. This result was also found to be true in our additional analysis calculating ERNRMSE with SEQ8:30 electrodes, finding high predictive performance for nearly all numbers of electrodes included in the subset. That ERNRMSE showed the best results and lowest variance when calculated with SEQ electrode subsets could indicate that when working with BSPM signals, an informed patient or segment specific selection of subset electrodes may be useful, for example using the sequential algorithm. This is logical given the nonstationary nature of BSPM recordings in AF. This was further supported by the lack of a clear pattern of specific electrodes included in the SEQ subsets as seen in Figure 3; rather, certain regions of the vest contain electrodes picked by the sequential algorithm more often than other regions. The finding that specificity was generally higher than sensitivity across all indices tested could indicate that this index would be more useful for selecting which patients would be most likely to benefit from CA, as opposed to selecting those least likely to benefit. Note that specificity was also higher than sensitivity for the NDI in the original study (Meo et al., 2018). The other two indices appear less robust to predict CA outcome, with low AUC and sensitivity values for NDI. For ERABSE, the results appear more promising, but still displaying relatively low sensitivity and more variable AUC values across CV folds than ERNRMSE.
These results all point towards the potential value of ERNRMSE as a clinically useful tool that could be used to analyze BSPM data in persAF. If confirmed by future studies, the use of ERNRMSE could be important in assisting in prediction of successful CA outcomes, which would be useful for improving informed decision making regarding treatment for persAF. This would be particularly important given the low success rate of CA for treating persAF. Finally, the added clinical value of using BSPM data in AF remains unclear, as evidenced by its being largely limited to research use (Salinet et al., 2021). However, if indices calculated using BSPM data, such as ERNRMSE, could be shown to be consistently associated with and good predictors of CA outcomes, this could confirm the validity of using BSPM data for AF analysis.
The study population, at 13 patients, and 11 patients with clinical outcome data, was small; however, the effort in obtaining BSPM recordings is considerable, due to the high number of electrodes which are used. The use of group-wise CV on segments of data extracted from each patient did however permit a robust analysis using this data set. In addition, the randomized inclusion criteria enhances our conclusions on BSPM AF characterization, though this may not be representative of the general characteristics of a wider population. Given the variation in experimental set up and parameters used, comparing with parameters from previous studies was challenging, and a more systematic study would be required for integration of the contributions of this work into clinical practice. Further, the small size of the population precluded the analysis of correlation with clinical indices, or whether the proposed indices could be combined with clinical indices for predicting CA outcome, as it has been shown previously in several studies that combining ECG-based indices with clinical parameters yields the best clinical performance (Lankveld et al., 2016; Meo et al., 2018; Zeemering et al., 2018). Additionally, the follow-up duration was relatively limited, and again due to the small study size, the impact of anti-arrhythmic medications could not be assessed since these were used by most patients. Finally, while we have shown the usefulness of the proposed indices for predicting CA outcome, we were unable to examine these indices for quantifying AF complexity due to a lack of available simultaneous intracardiac recordings.
In this study, we have proposed two novel indices for AF analysis with BSPM signals, ERNRMSE and ERABSE. We have shown clinical applicability by demonstrating correlation between the novel indices and single-procedure CA outcome and also promising outcome prediction performance. However, only ERNRMSE values were found to be statistically greater for the AR patient group than SR patient group, and demonstrate consistently high CA outcome predictive performance when calculated with ECG subsets, and independent of the number of electrodes included in the SEQ subset used for its calculation. These results, combined with previous studies also employing PCA-based methods, suggest that continued study of BSPM signals for AF analysis is warranted.
The original contributions presented in the study are included in the article/Supplementary Materials, further inquiries can be directed to the corresponding author.
The studies involving human participants were reviewed and approved by Lausanne University Hospital Human Research Ethics Committee. The patients/participants provided their written informed consent to participate in this study.
AM, AL, EP, and J-MV conceived and designed the study and were in charge of manuscript writing. AM, AL, and J-MV performed the analyses. EP and PP performed CA procedures, provided a clinical interpretation of the results, and both contributed to data acquisition. All authors contributed to the article and approved the submitted version.
This study was supported in part by grant 2018-322 of the Personalized Health and Related Technologies (PHRT) initiative of the Swiss ETH domain.
The authors would like to thank Medtronic Switzerland for their technical assistance with data collection.
The authors declare that the research was conducted in the absence of any commercial or financial relationships that could be construed as a potential conflict of interest.
All claims expressed in this article are solely those of the authors and do not necessarily represent those of their affiliated organizations, or those of the publisher, the editors and the reviewers. Any product that may be evaluated in this article, or claim that may be made by its manufacturer, is not guaranteed or endorsed by the publisher.
The Supplementary Material for this article can be found online at: https://www.frontiersin.org/articles/10.3389/fphys.2022.1001060/full#supplementary-material
Altschuler J., Bhaskara A., Fu G., Mirrokni V., Rostamizadeh A., Zadimoghaddam M. (2016). “Greedy column subset selection: New bounds and distributed algorithms,” in Proc. Int. Conf. Mach. Learn. (PMLR), 2539–2548. doi:10.5555/3045390.3045658
Bonizzi P., de la Salud Guillem M., Climent A. M., Millet J., Zarzoso V., Castells F., et al. (2010). Noninvasive assessment of the complexity and stationarity of the atrial wavefront patterns during atrial fibrillation. IEEE Trans. Biomed. Eng. 57, 2147–2157. doi:10.1109/TBME.2010.2052619
Buttu A., Pruvot E., Van Zaen J., Viso A., Forclaz A., Pascale P., et al. (2013). Adaptive frequency tracking of the baseline ECG identifies the site of atrial fibrillation termination by catheter ablation. Biomed. Signal Process. Control 8, 969–980. doi:10.1016/j.bspc.2013.02.005
Castells F., Laguna P., Sörnmo L., Bollmann A., Roig J. M. (2007). Principal component analysis in ECG signal processing. EURASIP J. Adv. Signal Process. 2007, 1–16. doi:10.1155/2007/74580
Civril A. (2014). Column subset selection problem is UG-hard. J. Comput. Syst. Sci. 80, 849–859. doi:10.1016/j.jcss.2014.01.004
Di Marco L. Y., Bourke J. P., Langley P. (2012). Spatial complexity and spectral distribution variability of atrial activity in surface ECG recordings of atrial fibrillation. Med. Biol. Eng. Comput. 50, 439–446. doi:10.1007/s11517-012-0878-8
Farahat A. K., Ghodsi A., Kamel M. S. (2011). “An efficient greedy method for unsupervised feature selection,” in Proc. IEEE int. Conf. Data min. (IEEE), 161–170. doi:10.1109/ICDM.2011.22
Feng X., Bai B., Wu Z., Yang C., Wu Z. (2019). Leads selection of body surface potential mapping during atrial fibrillation: A sequential selection based on adapted botteron’s approach. IEEE Access 7, 158064–158074. doi:10.1109/ACCESS.2019.2949999
Guillem M. S., Bollmann A., Climent A. M., Husser D., Millet-Roig J., Castells F. (2009). How many leads are necessary for a reliable reconstruction of surface potentials during atrial fibrillation? IEEE Trans. Inf. Technol. Biomed. 13, 330–340. doi:10.1109/TITB.2008.2011894
Guillem M. S., Castells F., Climent A. M., Bodí V., Chorro F. J., Millet J. (2008). Evaluation of lead selection methods for optimal reconstruction of body surface potentials. J. Electrocardiol. 41, 26–34. doi:10.1016/j.jelectrocard.2007.07.001
Guillem M. S., Climent A. M., Millet J., Arenal Á., Fernández-Avilés F., Jalife J., et al. (2013). Noninvasive localization of maximal frequency sites of atrial fibrillation by body surface potential mapping. Circ. Arrhythm. Electrophysiol. 6, 294–301. doi:10.1161/CIRCEP.112.000167
Ihara Z., van Oosterom A., Jacquemet V., Hoekema R. (2007). Adaptation of the standard 12-lead electrocardiogram system dedicated to the analysis of atrial fibrillation. J. Electrocardiol. 40, e1–e8. doi:10.1016/j.jelectrocard.2006.04.006
Langley P., Rieta J. J., Stridh M., Millet J., Sornmo L., Murray A. (2006). Comparison of atrial signal extraction algorithms in 12-lead ECGs with atrial fibrillation. IEEE Trans. Biomed. Eng. 53, 343–346. doi:10.1109/TBME.2005.862567
Lankveld T. A., Zeemering S., Crijns H. J., Schotten U. (2014). The ECG as a tool to determine atrial fibrillation complexity. Heart 100, 1077–1084. doi:10.1136/heartjnl-2013-305149
Lankveld T., Zeemering S., Scherr D., Kuklik P., Hoffmann B. A., Willems S., et al. (2016). Atrial fibrillation complexity parameters derived from surface ECGs predict procedural outcome and long-term follow-up of stepwise catheter ablation for atrial fibrillation. Circ. Arrhythm. Electrophysiol. 9, e003354. doi:10.1161/CIRCEP.115.003354
Lux R. L., Smith C. R., Wyatt R. F., Abildskov J. (1978). Limited lead selection for estimation of body surface potential maps in electrocardiography. IEEE Trans. Biomed. Eng. 270, 270–276. doi:10.1109/TBME.1978.326332
Meo M., Pambrun T., Derval N., Dumas-Pomier C., Puyo S., Duchateau J., et al. (2018). Noninvasive assessment of atrial fibrillation complexity in relation to ablation characteristics and outcome. Front. Physiol. 9, 929. doi:10.3389/fphys.2018.00929
Meo M., Zarzoso V., Meste O., Latcu D. G., Saoudi N. (2013). Catheter ablation outcome prediction in persistent atrial fibrillation using weighted principal component analysis. Biomed. Signal Process. Control 8, 958–968. doi:10.1016/j.bspc.2013.02.002
Petrutiu S., Sahakian A. V., Fisher W., Swiryn S. (2009). Manifestation of left atrial events and interatrial frequency gradients in the surface electrocardiogram during atrial fibrillation: Contributions from posterior leads. J. Cardiovasc. Electrophysiol. 20, 1231–1236. doi:10.1111/j.1540-8167.2009.01523.x
Pilia N., Nagel C., Lenis G., Becker S., Dössel O., Loewe A. (2021). ECGdeli-an open source ECG delineation toolbox for MATLAB. SoftwareX 13, 100639. doi:10.1016/j.softx.2020.100639
Salinet J., Molero R., Schlindwein F. S., Karel J., Rodrigo M., Rojo-Álvarez J. L., et al. (2021). Electrocardiographic imaging for atrial fibrillation: A perspective from computer models and animal experiments to clinical value. Front. Physiol. 12, 653013. doi:10.3389/fphys.2021.653013
Stridh M., Sornmo L. (2001). Spatiotemporal QRST cancellation techniques for analysis of atrial fibrillation. IEEE Trans. Biomed. Eng. 48, 105–111. doi:10.1109/10.900266
Zarzoso V., Latcu D. G., Hidalgo-Muñoz A. R., Meo M., Meste O., Popescu I., et al. (2016). Non-invasive prediction of catheter ablation outcome in persistent atrial fibrillation by fibrillatory wave amplitude computation in multiple electrocardiogram leads. Arch. Cardiovasc. Dis. 109, 679–688. doi:10.1016/j.acvd.2016.03.002
Keywords: atrial fibrillation, catheter ablation, body surface potential mapping, spatiotemporal analysis, outcome stratification
Citation: McCann A, Luca A, Pascale P, Pruvot E and Vesin J-M (2022) Novel spatiotemporal processing tools for body-surface potential map signals for the prediction of catheter ablation outcome in persistent atrial fibrillation. Front. Physiol. 13:1001060. doi: 10.3389/fphys.2022.1001060
Received: 22 July 2022; Accepted: 08 September 2022;
Published: 29 September 2022.
Edited by:
Jose F. Rodriguez Matas, Politecnico di Milano, ItalyReviewed by:
Laura Martinez-Mateu, Rey Juan Carlos University, SpainCopyright © 2022 McCann, Luca, Pascale, Pruvot and Vesin. This is an open-access article distributed under the terms of the Creative Commons Attribution License (CC BY). The use, distribution or reproduction in other forums is permitted, provided the original author(s) and the copyright owner(s) are credited and that the original publication in this journal is cited, in accordance with accepted academic practice. No use, distribution or reproduction is permitted which does not comply with these terms.
*Correspondence: Anna McCann, YW5uYS5tY2Nhbm5AZXBmbC5jaA==
Disclaimer: All claims expressed in this article are solely those of the authors and do not necessarily represent those of their affiliated organizations, or those of the publisher, the editors and the reviewers. Any product that may be evaluated in this article or claim that may be made by its manufacturer is not guaranteed or endorsed by the publisher.
Research integrity at Frontiers
Learn more about the work of our research integrity team to safeguard the quality of each article we publish.