 Vijayakumar R. Kakade
 Marlene Weiss
 Lloyd G. Cantley*
- Section of Nephrology, Department of Internal Medicine, Yale University School of Medicine, New Haven, CT, United States
In the evolving landscape of highly multiplexed imaging techniques that can be applied to study complex cellular microenvironments, this review characterizes the use of imaging mass cytometry (IMC) to study the human kidney. We provide technical details for antibody validation, cell segmentation, and data analysis specifically tailored to human kidney samples, and elaborate on phenotyping of kidney cell types and novel insights that IMC can provide regarding pathophysiological processes in the injured or diseased kidney. This review will provide the reader with the necessary background to understand both the power and the limitations of IMC and thus support better perception of how IMC analysis can improve our understanding of human disease pathogenesis and can be integrated with other technologies such as single cell sequencing and proteomics to provide spatial context to cellular data.
Introduction
The predominant methods for cell identification during the pathological analysis of formalin-fixed paraffin-embedded (FFPE) samples from human renal core biopsy tissues include cell morphology and immunohistochemistry or immunofluorescence (IF). The limited amount of tissue obtained from renal biopsy confines the type of analysis performed, preventing extensive analysis at the molecular and cellular level. Thus, most analyses are descriptive, with few efforts to provide quantitative information about the tubular, stromal, and nonresident cell populations in disease states (Kretzler et al., 2002; Zhang and Parikh, 2019). Single-cell RNA sequencing and single nucleus RNA sequencing have markedly increased the depth of information gained from a single biopsy, but lack the spatial information needed to determine cell proximity and cell–cell interactions (Rost et al., 2017; Cippà et al., 2018; Wu et al., 2018, 2019; Lake et al., 2019; Deleersnijder et al., 2021). The large numbers of distinct cell populations and complex cellular arrangement of the human kidney make it particularly difficult to adequately analyze without high-resolution spatial information. To provide that spatial information on such a large number of cells, several platforms for multiplexed imaging have recently been developed, including serial immunofluorescence staining, staining with DNA-barcoded antibodies (CODEX, CO-Detection by indEXing), and staining with metal-tagged antibodies [multiplexed ion beam imaging (MIBI) and imaging mass cytometry (IMC)]. For a detailed comparison of the strengths and weaknesses of these technologies, please see the comprehensive review by Baharlou et al. (2019).
Imaging Mass Cytometry
Imaging mass cytometry (IMC) is a powerful analytical platform in which a high-resolution laser is combined with a mass cytometer that permits mass spectrometry-based, spatially preserved high-dimensional analysis of intact FFPE and frozen tissues at a resolution of 1 μm2 per pixel (Giesen et al., 2014; Bodenmiller, 2016; Guo et al., 2020). In IMC, a cocktail of validated antibodies against defined protein epitopes, each of which is covalently bound to a unique rare-earth metal, is hybridized on a tissue section. Pulsed ablation of 1 μm2 spots with a UV laser is performed, with the vaporized tissue analyzed by a mass spectrometer to identify the combination of heavy metals present in that 1 μm2 region. The quantity of each metal present at each 1 μm2 coordinate is used to reconstruct an artificial multilayer image of the initial tissue. Currently IMC can be employed for imaging up to 42 markers on a single section of tissue. The absence of endogenous signal for the heavy metals results in a very low background and improved signal-to-noise ratio, making IMC particularly appealing as compared to fluorescence-based antibody imaging (Zhang et al., 2018).
Applications of IMC
IMC has been used to characterize malignancies, yielding information about the identity, number of, and spatial relationships between immune and resident cells (Giesen et al., 2014; Bodenmiller, 2016; Bertocchi et al., 2021; Li et al., 2021). IMC has also been applied in infectious and autoimmune diseases research and in drug profiling. The 1 μm2 resolution provides the ability to identify basic subcellular localization of antigens (nucleus vs. cytoplasm), while the large number of antibodies that can be simultaneously analyzed supports both cell identification and cell activation state determination. The technique can therefore be employed to identify cellular markers that provide fundamental tissue architectural layout, as well as secondary cellular responses such as protein modifications, signaling pathway activation, cell injury states, and cell proliferation. IMC allows immune cell markers to be investigated in both healthy and diseased tissues with their distribution pattern and proximity to tissue resident cells spatially mapped (Giesen et al., 2014; Catena et al., 2020; Garcia-Melchor et al., 2021; Patel et al., 2021). Analysis of functional markers generates information on disease states and can potentially be used to identify biomarkers. Importantly, the linearity of the mass spectrometry detection of the heavy metals conjugated to each antibody provides a quantitative assessment of the relative expression levels for the respective antigens, allowing researchers to detect changes not just in cell numbers and localization, but also in cell differentiation and signaling pathway activation. This quantitative information, assigned to each pixel of the generated image, supports a more objective, machine-based evaluation of the tissue that is less subject to observer bias.
IMC has been employed to characterize disease pathophysiology by providing enhanced molecular profiling of biological tissues. With that aim, several research groups have focused on the pathogenesis of type 1 diabetes. Through analysis of 1,581 islets from 12 human donors and eight type 1 diabetic patients, using a panel of antibodies targeted against 35 biomarkers, Damond et al. (2019) found that beta cell destruction is preceded by a beta cell marker loss and by recruitment of cytotoxic and helper T cells. Similarly, using a panel of 33 antibodies and quantifying pancreatic exocrine cells, islet cells, immune cells, and stromal components, Wang et al. (2019) demonstrated a dramatic change in islet architecture, endocrine cell number, and immune cell number in pancreatic sections from type 1 diabetic patients. This study also demonstrated a molecular change indicating altered cell identity and dysregulated cellular protein expression in the histopathology of type 1 diabetes. The described ability to detect and quantify protein-level alterations in cells was reflected in a separate study of neuronal changes in postmortem samples from patients with Parkinson’s disease. Using IMC analysis with a panel of antibodies targeting subunits of all five mitochondrial oxidative phosphorylation complexes, Chen et al. (2021) found a widespread decrease in expression of all complexes in Parkinson’s neurons as compared to control cases. An IMC study of tissue samples from patients with multiple sclerosis characterized a pool of immune cells including macrophages adjacent to regions of demyelinization and multiple subsets of T and B cells, delineating the cellular makeup of the immune response during exacerbations of disease (Ramaglia et al., 2019). Identifying markers to characterize the pathogenesis of different disease entities allows hypothesis generation for further research. Additionally, IMC contributes to deciphering of so far unknown targets relevant to signaling pathways involved in disease pathogenesis.
IMC has also been used to further characterize hepatitis B virus-associated liver disease and most recently, COVID-19-associated organ manifestations including lung disease (Wang et al., 2020; Zhang et al., 2020; Melms et al., 2021; Rendeiro et al., 2021), brain injury (Schwabenland et al., 2021), and small intestinal infection (Lehmann et al., 2021). Allam et al. (2021) analyzed tonsillitis samples, while at the same time introducing a new algorithm to explore spatial relationships in diverse multiplexed tissue imaging data. In these publications, the corresponding antibody panels reflected potentially relevant signaling pathways in addition to immune cell composition and cross talk.
The ability of IMC to characterize both structural cells and trafficking immune cells has been important for its use in characterizing the tumor microenvironment and treatment effects or pharmacodynamics, respectively. IMC can provide: (i) a means to investigate the cellular heterogeneity of the tumor microenvironment and understanding of cancer progression and resistance to current therapies (Ijsselsteijn et al., 2019; Elaldi et al., 2021); (ii) a basis for supporting efficacy and target engagement validation studies in drug discovery (Bouzekri et al., 2019); (iii) discovery of new biomarkers (Martinez-Morilla et al., 2021); (iv) potential novel drug targets; and (v) improved implementation of already established therapeutics (Carvajal-Hausdorf et al., 2019; Kankeu Fonkoua et al., 2021). These analyses include relevant cell populations and interactions, surrogates of cancer cell states, and immune cell markers. IMC-based analysis of the tumor microenvironment can potentially provide prognostic information predictive of disease outcome.
Application of IMC in the Human Kidney
Currently there are three publications showing IMC analysis of human kidney tissue (Singh et al., 2019; Wang et al., 2020; Avigan et al., 2021) and one publication analyzing murine kidney tissue (Brähler et al., 2018). The first analysis of kidney tissue by IMC was published by our group and characterized the cellular composition of the human kidney, comprising tubular, stromal, glomerular, and non-resident cells such as immune cells (Singh et al., 2019). The underlying hypothesis for the project was the relevance of interaction between kidney-resident and immune cells for homeostasis and disease development. The study (Singh et al., 2019) included the description of a machine learning-based analysis pipeline termed Kidney-MAPPS (Multiplexed Antibody based Profiling with Preservation of Spatial context) for unbiased pixel classification using Ilastik (Berg et al., 2019), nuclear-based cell segmentation using CellProfiler (McQuin et al., 2018), and clustering/neighborhood analysis using HistoCAT (Schapiro et al., 2017). In this approach, four different stacks of pseudocolored tiff images generated from the IMC data are subjected to pixel classification using Ilastik in order to create probability images representing nuclei, tubular, endothelial, and interstitial/glomerular cell types. The machine learning algorithm assigns a probability for the respective cell type to each pixel by differentiating between signal and background in each data set. Analysis in CellProfiler creates the sequential cell segmentation on the probability images and generates a unified mask. Cells are identified based on the presence of a nucleus as the primary object, followed by segmentation of the specific cell type (tubular, endothelial, and interstitial) to delineate the borders of each individual cell. Finally, processing in HistoCAT overlays the unified mask on the raw data from IMC, allowing multiplexed data analysis by unbiased clustering using the PhenoGraph algorithm, a nearest-neighbor-based clustering approach. Individual cell phenotypes are assigned to each cell in an unsupervised manner based on the combinatorial expression of the canonical cell identification markers, supporting classification and quantification of each cell type. Figure 1 provides a graphic overview of the steps that are used for the Kidney-MAPPS analysis pipeline.
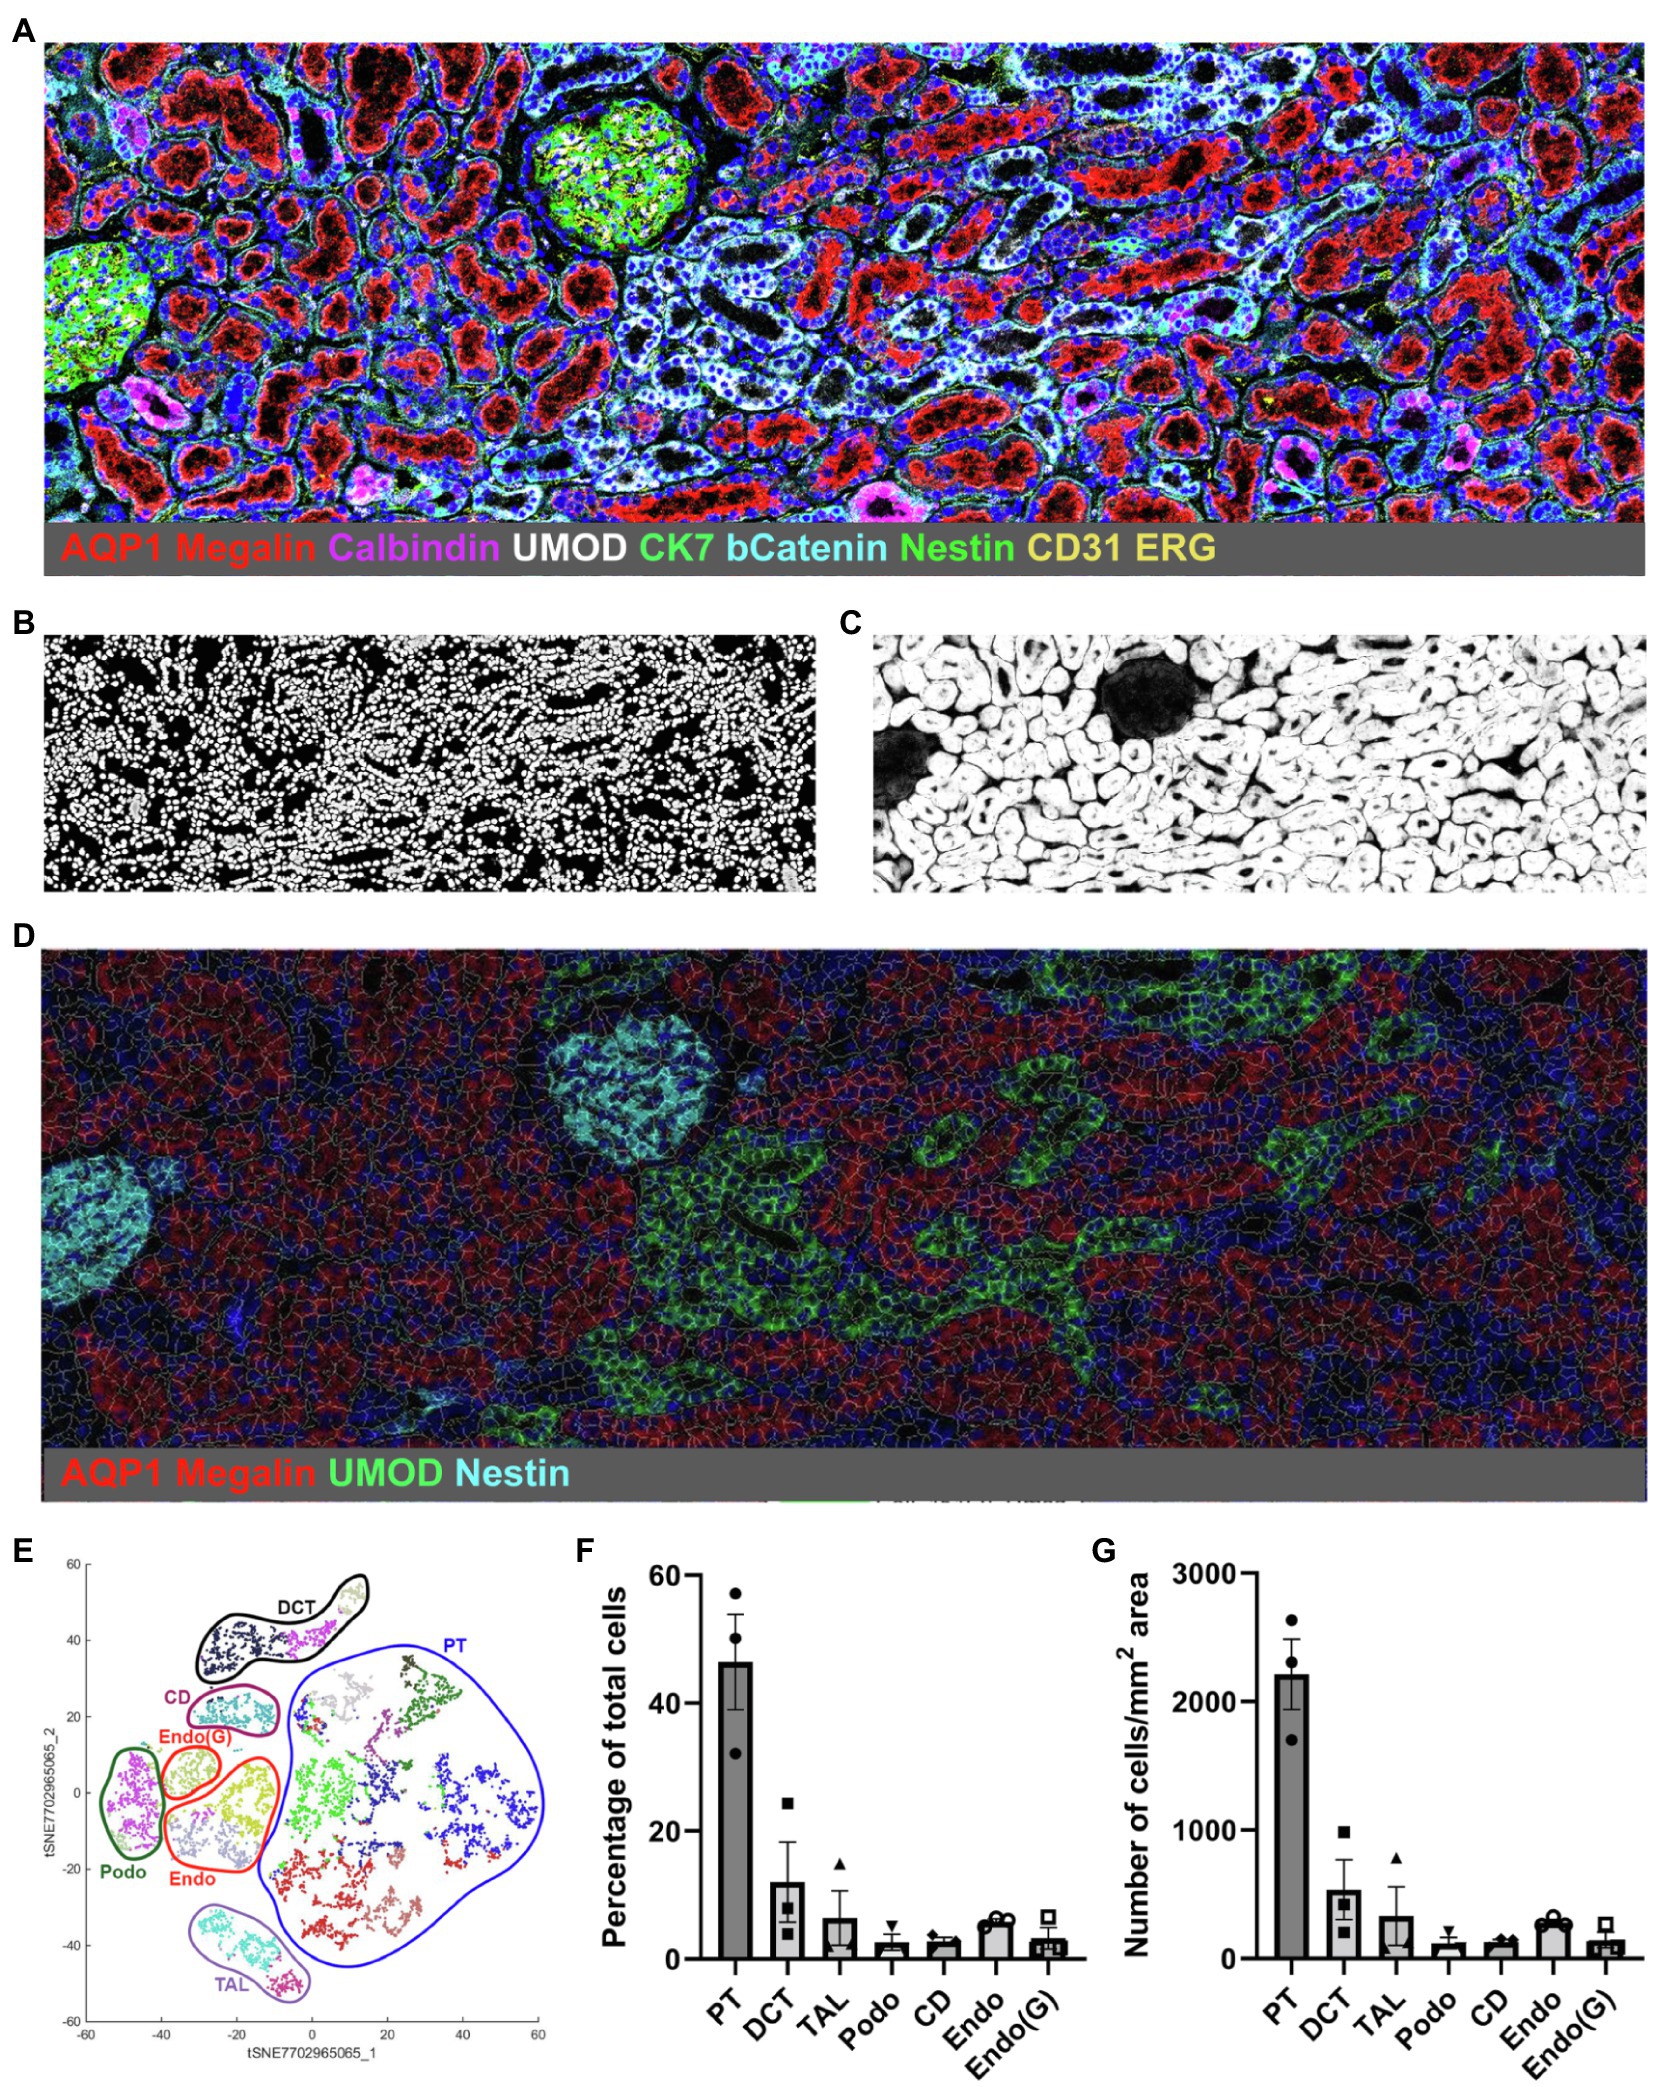
Figure 1. Representative Kidney-MAPPS analysis of healthy human kidney tissue for identification of resident cell populations. (A) Pseudocolored image of a region of interest analyzed by IMC. The depicted colors correspond to the markers listed on the image. AQP1, aquaporin-1; UMOD, uromodulin; bCatenin, β-Catenin; CK7, cytokeratin-7; and ERG, ETS-related gene. (B,C) Probability images for nuclei (B) and tubular cells (C), created using the Ilastik software. (D) Segmentation mask generated in CellProfiler overlaid on a pseudocolored image created in HistoCAT. Highlighted markers were selected in order to represent the tissue structure analogous to (A) while allowing visibility of the cell segmentation. (E) tSNE plot showing different cell types/clusters identified through PhenoGraph analysis of three representative healthy kidney samples in HistoCAT. PT, proximal tubule; DCT, distal convoluted tubule; TAL, thick ascending limb; Podo, podocytes; CD, collecting duct; Endo, endothelial cells (non-glomerular); and Endo(G), glomerular endothelial cells. (F,G) Quantification of the cell types identified in (E) as a percentage of the total number of cells (F) and the number of cells per mm2 area (G). Bars show the mean ± SD. n = 3.
IMC and the Kidney-MAPPS pipeline were successfully applied to 16 pathologist-verified, histopathologically normal FFPE human kidney samples (five from living donors, 11 from carefully selected, banked tumor-remote nephrectomy samples) to quantitatively characterize the cellular makeup of the reference human kidney (Singh et al., 2019). The antibodies that were employed by Singh et al. (2019) listed in Table 1, were first validated using a combination of literature search of single-cell expression data, in vitro cell expression, morphologic features identified by a pathologist, and cell co-localization of more than one cell-specific marker. Kidney-MAPPS was then employed to successfully generate a two-dimensional quantitative atlas of 22 distinct cell populations that were identified in the normal human kidney. In addition to well-characterized parts of the tubule, interstitium, and glomerulus, the analysis revealed several cell populations that had not yet been described. A population of megalin (low), aquaporin-1 (AQP1)+, aquaporin-2 (AQP2)−, cytokeratin-7 (CK7)+ tubular cells in the medulla were assigned to represent the thin descending limb of the loop of Henle. A cluster of megalin+, AQP1+, vimentin+ cells was suggestive of an injured, fibrotic, or regenerative cell type, while CK7+, AQP2+ cells were felt to represent principal cells. Moreover, the analysis identified cells in connecting tubular segments with morphologically larger diameter than the distal convoluted tubule (DCT) as calbindin+, CK7+, AQP2+ transition cells between the DCT and collecting duct. The Kidney-MAPPS protocol accurately identified, quantified, and localized ~92% of all cells in the human kidney, and quality control measures for validity and reproducibility of unsupervised analysis of data showed no significant differences in the manual vs. Kidney-MAPPS assigned phenotypes, out of over 10,000 cells scored (Singh et al., 2019). Further, the reproducibility analysis of Kidney-MAPPS yielded highly consistent quantitative results when adjacent sections of the same tissue were analyzed and showed no qualitative decrement in staining intensity in FFPE samples banked for >9 years. Tissue analysis on regions corresponding to the original region of interest with a new, identical antibody cocktail 4 months later also led to robust results (Singh et al., 2019).
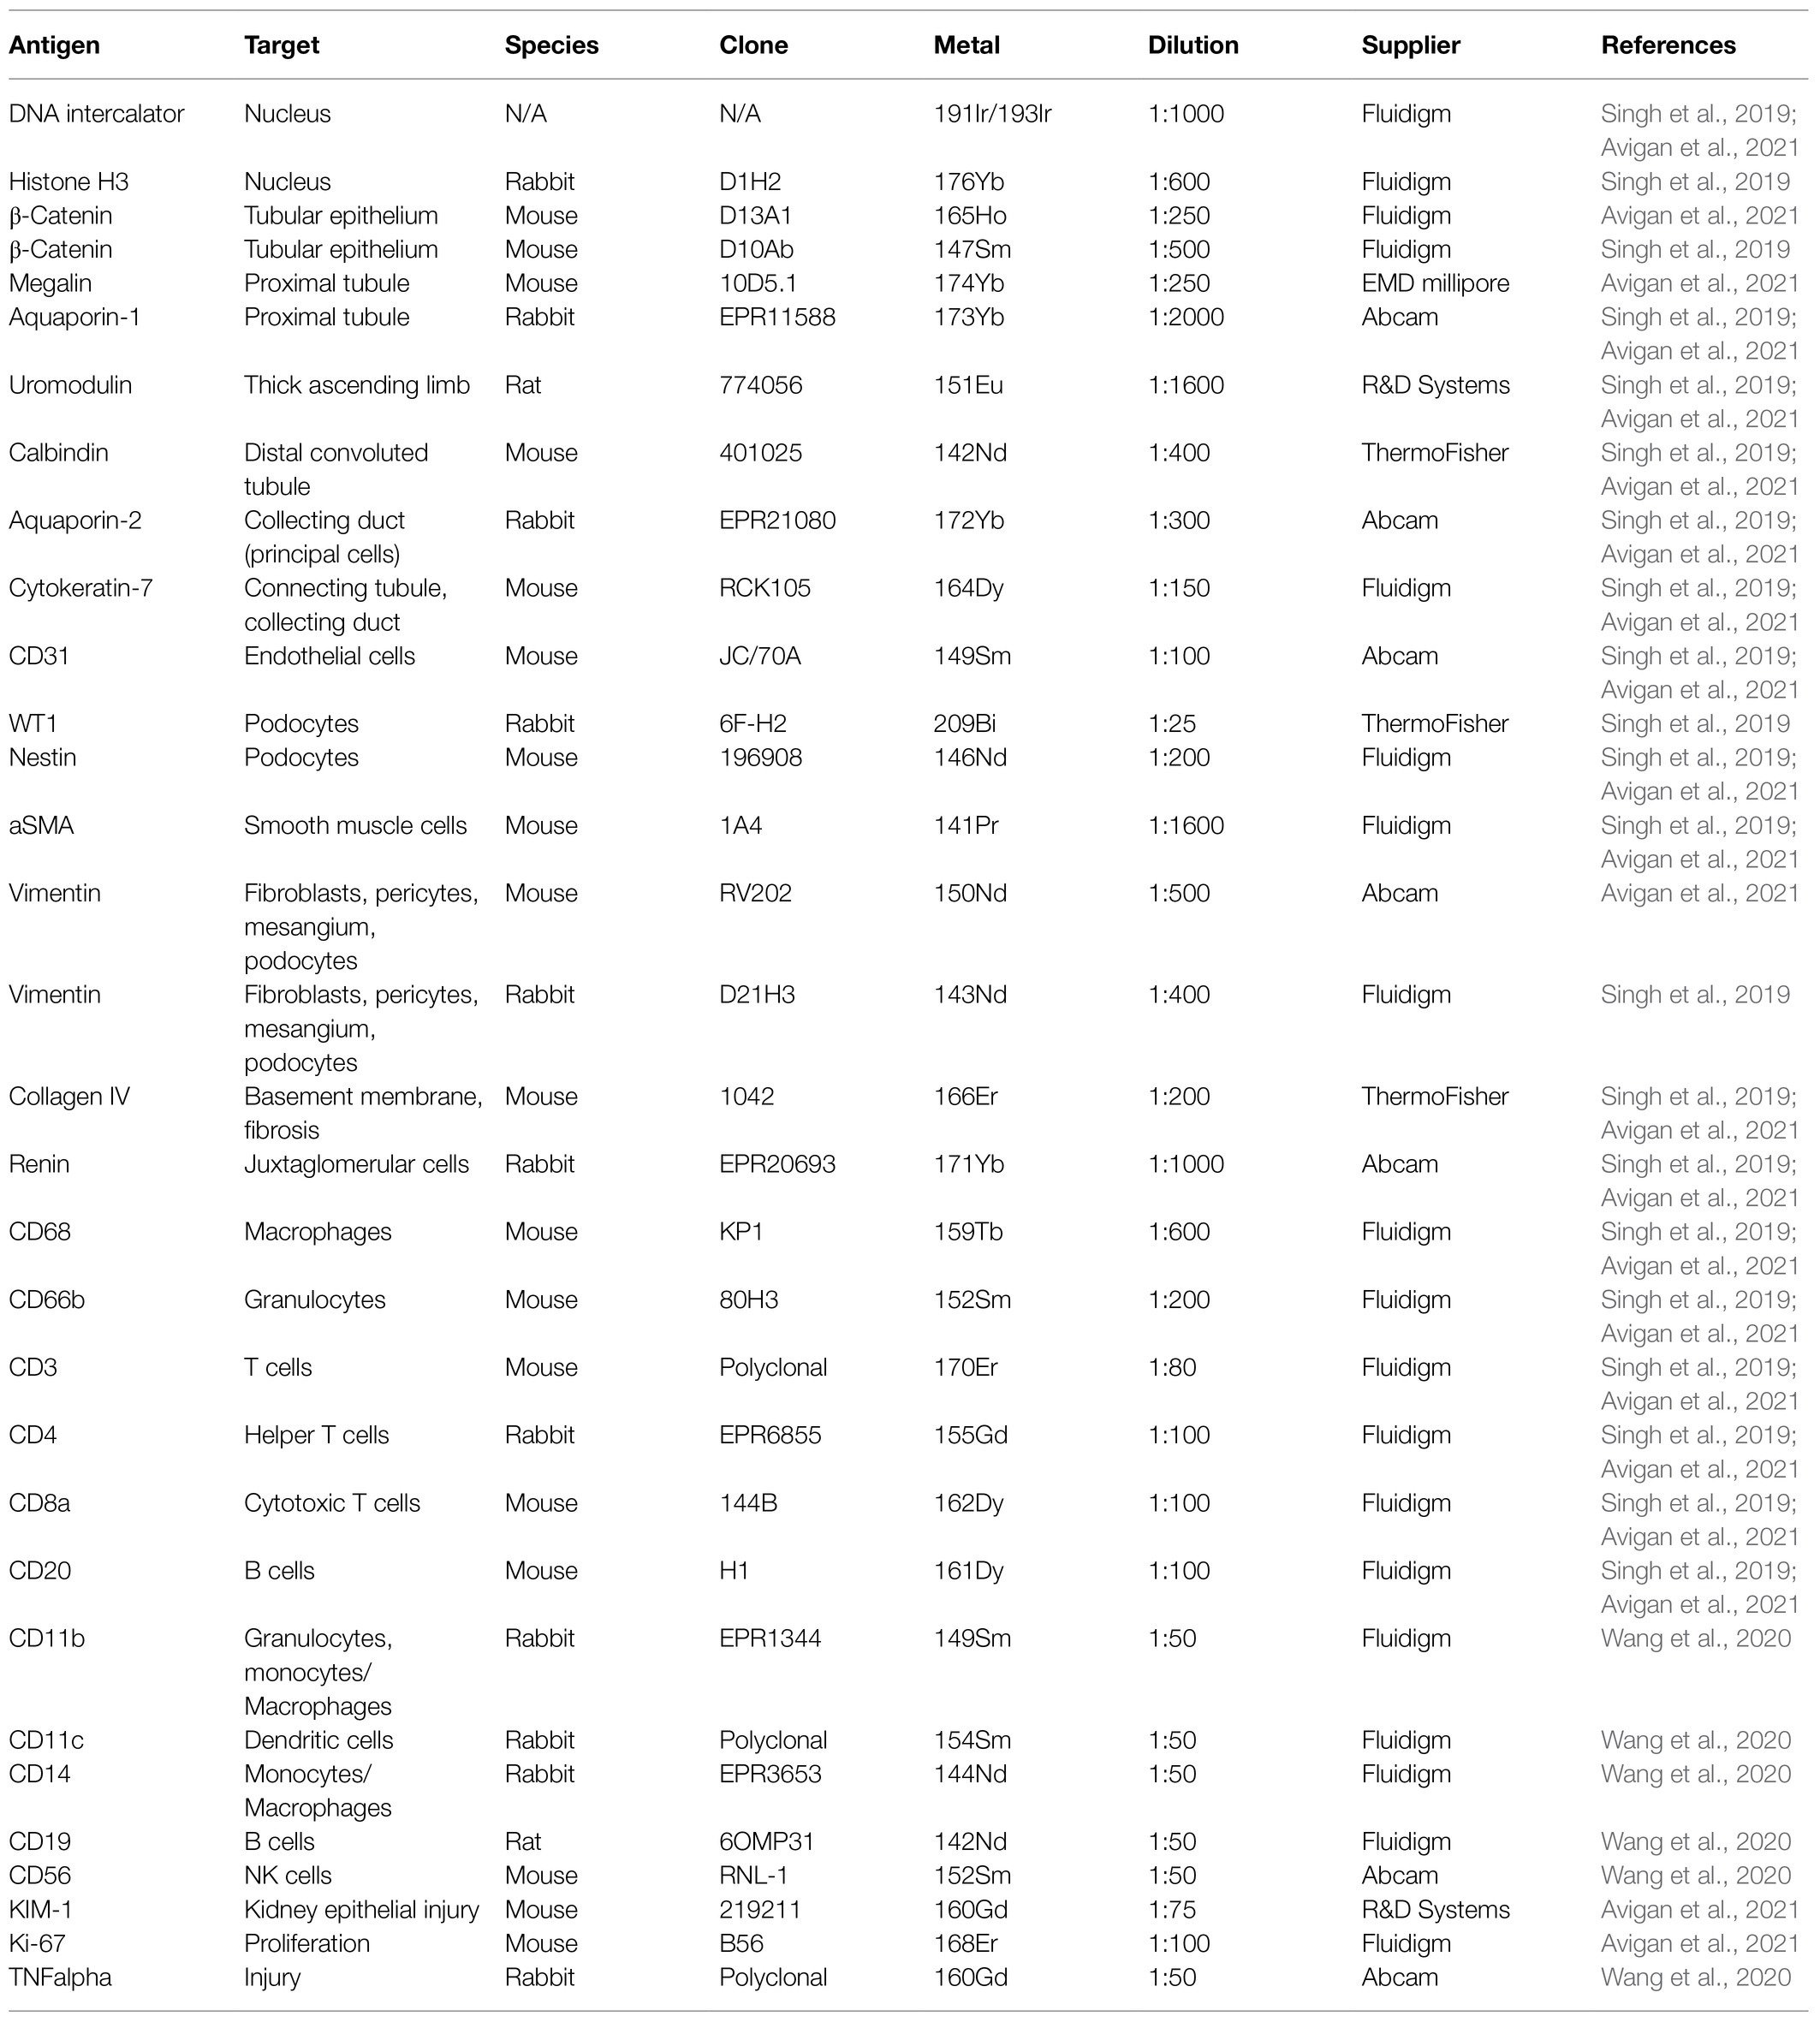
Table 1. List of antibodies used on human kidney tissue.
Our group further expanded the application of IMC and the Kidney-MAPPS analysis pipeline to analyze pre-implant kidney biopsy samples from deceased donor kidneys that were pre-identified as being at high risk for delayed graft function (DGF) following implantation as compared to living donor kidneys that were low risk for subsequent DGF (Avigan et al., 2021). The results showed that the high-risk deceased donor kidneys exhibited a highly significant reduction in tubular cells, and specifically proximal tubule cells, as compared to living donor kidneys. Of note, this decrease in tubular cell numbers did not reflect failure to successfully detect nuclei or failure to assign cell identity in the deceased donor kidney tissue, but rather a quantitative reduction of the number of tubular cells present per area analyzed. Moreover, consistent with our previous study (Singh et al., 2019), 99.5 ± 4.6% of tubular cells were correctly identified by the Kidney-MAPPS pipeline compared with manual adjudication, indicating that identification of kidney cell populations is not impaired between reference and injured tissues. Intriguingly, the study uncovered a small population of megalin(low), vimentin+ proximal tubular cells exclusively in deceased donor tissue that was surrounded by macrophage-rich infiltrates and co-expressed markers of injury and proliferation, kidney injury molecule 1 (KIM-1) and Ki67, respectively (Avigan et al., 2021). This is consistent with animal data showing that alternatively activated macrophages directly surround the proliferating proximal tubule S3 segment tubular cells during the week after kidney injury (Huen et al., 2015). Moreover, this cell population potentially plays a role in tubular repair because KIM-1 has been shown to be protective in models of ischemia reperfusion injury and renal transplantation (Lee et al., 2018; Al-Bataineh et al., 2021). These results demonstrate that IMC can provide spatially accurate data regarding biologically important cell–cell interactions.
IMC has also been applied to COVID-19 patient kidney samples in a study that analyzed immune cell infiltration and proinflammatory cytokine responses in specified organs of three COVID-19 patients. Compared to human healthy control kidneys, IMC analysis showed a higher count of CD11b+ macrophages, CD11c+ dendritic cells, and CD19+ B cells in two of the COVID-19 patient kidney samples (Wang et al., 2020). The antibodies that were used in this study are also listed in Table 1. By comparing the immune cell profiles and cytokines in the kidney to other organs, the authors suggested a tissue-specific immune response to COVID-19 that might lead to differential sensitivities of resident cell populations to the COVID-19 infection and subsequent therapies.
Discussion
IMC is a powerful platform for high-dimensional multiplexed parallel analysis of dozens of proteins localized in intact tissue, providing single-cell resolution while preserving the spatial relationship and morphological features. Its capacity to quantify >40 markers renders IMC a useful technique in the clinical setting where tissue quantities from patient biopsies can be very limited. The ability to use banked FFPE sections without signal attenuation and with the same data outcome as freshly procured tissue also helps with the pathophysiologic study of diseases for which there are few patient samples available. An additional advantage of IMC as compared to IF is that there is no endogenous autofluorescence to negatively impact the signal-to-noise ratio. In terms of sensitivity, IMC can successfully detect a lower limit of approximately 50 copies of an epitope per 1 μm2 laser pulse (Hartmann and Bendall, 2020).
Limitations include the resolution that presently is at 1 μm2, meaning that subcellular organelles such as mitochondria, endoplasmic reticulum, and vacuoles cannot be resolved and that areas of cell overlap can make pixel classification and cell segmentation less accurate. The effect this infers on marker expression must be kept in mind when assigning a certain phenotype to a cell. In addition, the acquisition of data is time-consuming, taking 2 h to ablate 1 m2 area of interest, and approximately 10% of analyzed IMC regions did not yield analyzable data in the study by Singh et al. (2019).
IMC can be easily complemented by other conventional as well as highly multiplexed technologies. For example, Catena et al. (2018) developed a method to perform H&E counterstaining on IMC samples, allowing basic structural analysis of the tissue prior to IMC interrogation. By conjugating RNAscope probes to heavy metals rather than fluorophores, IMC can be used to simultaneously detect RNA and protein expression on the same tissue sample. Using this approach, unique cell identifiers that lack appropriate antibodies can be multiplexed with protein detection in single cells in situ, allowing correlation between transcriptional signatures and spatial context (Schulz et al., 2018). This helps gather additional information, i.e., on host–pathogen interactions when a pathogen is only detectable through RNA expression. Focusing on kidney analysis, the validated antibody panel together with the analysis pipeline and quantitative data on the makeup of cells in healthy kidney by Singh et al. (2019) provides a framework and reference cohort for future studies of diseased kidneys. The discovery of new cell types using these combined approaches will help us better understand and characterize the complexity of kidney tissue.
In summary, IMC can be applied to almost any tissue as long as the antibodies employed are appropriately validated and tested, and provides a unique ability to both detect and quantify multiple target antigens on a single archived or fresh tissue sample. We have found this to be particularly useful in the human kidney, which has historically presented many challenges to researchers due to its combination of cellular and architectural complexity. The ability to combine IMC with other tissue interrogation techniques such as single-cell RNA sequencing promises to further increase our understanding of the cellular changes that underlie kidney disease states, and thus identify appropriate interventions in a patient-specific manner.
Author Contributions
VK and MW contributed equally to this work and wrote and edited the manuscript. LC oversaw and contributed to writing and editing the manuscript. All authors contributed to the article and approved the submitted version.
Funding
This study was supported by DK126815 and AG067335 awards to LC and KPMP Opportunity pool award (U2CDK114886) to VK and LC. Additional support came from the German Research Foundation to MW (WE6653/1-1).
Conflict of Interest
The authors declare that the research was conducted in the absence of any commercial or financial relationships that could be construed as a potential conflict of interest.
Publisher’s Note
All claims expressed in this article are solely those of the authors and do not necessarily represent those of their affiliated organizations, or those of the publisher, the editors and the reviewers. Any product that may be evaluated in this article, or claim that may be made by its manufacturer, is not guaranteed or endorsed by the publisher.
Acknowledgments
We thank Indiana O’Brien Center for Advanced Microscopic Analysis, Indiana Clinical and Translational Sciences Institute, Indianapolis, Indiana, for covering the costs of the publication. We thank our funding sources, including the National Institute of Diabetic and Digestive and Kidney Diseases and KPMP (to LC) and the German Research Foundation (to MW).
Abbreviations
IMC, Imaging mass cytometry; FFPE, Formalin-fixed paraffin-embedded; IF, Immunofluorescence; Kidney-MAPPS, Kidney-multiplexed antibody based profiling with preservation of spatial context; AQP1, Aquaporin-1; AQP2, Aquaporin-2; CK7, Cytokeratin-7; DCT, Distal convoluted tubule; KIM-1, Kidney injury molecule-1; DGF, Delayed graft function.
References
Al-Bataineh, M. M., Kinlough, C. L., Mi, Z., Jackson, E. K., Mutchler, S. M., Emlet, D. R., et al. (2021). KIM-1-mediated anti-inflammatory activity is preserved by MUC1 induction in the proximal tubule during ischemia-reperfusion injury. Am. J. Physiol. Ren. Physiol. 321, F135–F148. doi: 10.1152/ajprenal.00127.2021
Allam, M., Hu, T., Cai, S., Laxminarayanan, K., Hughley, R. B., and Coskun, A. F. (2021). Spatially visualized single-cell pathology of highly multiplexed protein profiles in health and disease. Commun. Biol. 4:632. doi: 10.1038/s42003-021-02166-2
Avigan, Z. M., Singh, N., Kliegel, J. A., Weiss, M., Moeckel, G. W., and Cantley, L. G. (2021). Tubular cell dropout in preimplantation deceased donor biopsies as a predictor of delayed graft function. Transplant. Direct 7:e716. doi: 10.1097/TXD.0000000000001168
Baharlou, H., Canete, N. P., Cunningham, A. L., Harman, A. N., and Patrick, E. (2019). Mass cytometry imaging for the study of human diseases-applications and data analysis strategies. Front. Immunol. 10:2657. doi: 10.3389/fimmu.2019.02657
Berg, S., Kutra, D., Kroeger, T., Straehle, C. N., Kausler, B. X., Haubold, C., et al. (2019). Ilastik: interactive machine learning for (bio)image analysis. Nat. Methods 16, 1226–1232. doi: 10.1038/s41592-019-0582-9
Bertocchi, A., Carloni, S., Ravenda, P. S., Bertalot, G., Spadoni, I., Lo Cascio, A., et al. (2021). Gut vascular barrier impairment leads to intestinal bacteria dissemination and colorectal cancer metastasis to liver. Cancer Cell 39, 708.e11–724.e11. doi: 10.1016/j.ccell.2021.03.004
Bodenmiller, B. (2016). Multiplexed epitope-based tissue imaging for discovery and healthcare applications. Cell Syst. 2, 225–238. doi: 10.1016/j.cels.2016.03.008
Bouzekri, A., Esch, A., and Ornatsky, O. (2019). Multidimensional profiling of drug-treated cells by imaging mass cytometry. FEBS Open Bio 9, 1652–1669. doi: 10.1002/2211-5463.12692
Brähler, S., Zinselmeyer, B. H., Raju, S., Nitschke, M., Suleiman, H., Saunders, B. T., et al. (2018). Opposing roles of dendritic cell subsets in experimental GN. J. Am. Soc. Nephrol. 29, 138–154. doi: 10.1681/ASN.2017030270
Carvajal-Hausdorf, D. E., Patsenker, J., Stanton, K. P., Villarroel-Espindola, F., Esch, A., Montgomery, R. R., et al. (2019). Multiplexed (18-Plex) measurement of signaling targets and cytotoxic T cells in trastuzumab-treated patients using imaging mass cytometry. Clin. Cancer Res. 25, 3054–3062. doi: 10.1158/1078-0432.CCR-18-2599
Catena, R., Montuenga, L. M., and Bodenmiller, B. (2018). Ruthenium counterstaining for imaging mass cytometry. J. Pathol. 244, 479–484. doi: 10.1002/path.5049
Catena, R., Özcan, A., Kütt, L., Plüss, A., Consortium, I., Schraml, P., et al. (2020). Highly multiplexed molecular and cellular mapping of breast cancer tissue in three dimensions using mass tomography. bioRxiv.
Chen, C., Mcdonald, D., Blain, A., Sachdeva, A., Bone, L., Smith, A. L. M., et al. (2021). Imaging mass cytometry reveals generalised deficiency in OXPHOS complexes in Parkinson's disease. NPJ Parkinsons Dis. 7:39. doi: 10.1038/s41531-021-00182-x
Cippà, P. E., Sun, B., Liu, J., Chen, L., Naesens, M., and Mcmahon, A. P. (2018). Transcriptional trajectories of human kidney injury progression. JCI Insight 3:e123151. doi: 10.1172/jci.insight.123151
Damond, N., Engler, S., Zanotelli, V. R. T., Schapiro, D., Wasserfall, C. H., Kusmartseva, I., et al. (2019). A map of human type 1 diabetes progression by imaging mass cytometry. Cell Metab. 29, 755.e5–768.e5. doi: 10.1016/j.cmet.2018.11.014
Deleersnijder, D., Callemeyn, J., Arijs, I., Naesens, M., Van Craenenbroeck, A. H., Lambrechts, D., et al. (2021). Current methodological challenges of single-cell and single-nucleus RNA-sequencing in glomerular diseases. J. Am. Soc. Nephrol. 32, 1838–1852. doi: 10.1681/ASN.2021020157
Elaldi, R., Hemon, P., Petti, L., Cosson, E., Desrues, B., Sudaka, A., et al. (2021). High dimensional imaging mass cytometry panel to visualize the tumor immune microenvironment contexture. Front. Immunol. 12:666233. doi: 10.3389/fimmu.2021.666233
Garcia-Melchor, E., Cafaro, G., Macdonald, L., Crowe, L. A. N., Sood, S., Mclean, M., et al. (2021). Novel self-amplificatory loop between T cells and tenocytes as a driver of chronicity in tendon disease. Ann. Rheum. Dis. 80, 1075–1085. doi: 10.1136/annrheumdis-2020-219335
Giesen, C., Wang, H. A., Schapiro, D., Zivanovic, N., Jacobs, A., Hattendorf, B., et al. (2014). Highly multiplexed imaging of tumor tissues with subcellular resolution by mass cytometry. Nat. Methods 11, 417–422. doi: 10.1038/nmeth.2869
Guo, N., Van Unen, V., Ijsselsteijn, M. E., Ouboter, L. F., Van Der Meulen, A. E., Chuva, D. E., et al. (2020). A 34-marker panel for imaging mass cytometric analysis of human snap-frozen tissue. Front. Immunol. 11:1466. doi: 10.3389/fimmu.2020.01466
Hartmann, F. J., and Bendall, S. C. (2020). Immune monitoring using mass cytometry and related high-dimensional imaging approaches. Nat. Rev. Rheumatol. 16, 87–99. doi: 10.1038/s41584-019-0338-z
Huen, S. C., Huynh, L., Marlier, A., Lee, Y., Moeckel, G. W., and Cantley, L. G. (2015). GM-CSF promotes macrophage alternative activation after renal ischemia/reperfusion injury. J. Am. Soc. Nephrol. 26, 1334–1345. doi: 10.1681/ASN.2014060612
Ijsselsteijn, M. E., Van Der Breggen, R., Farina Sarasqueta, A., Koning, F., and Miranda, D. E. N. (2019). A 40-marker panel for high dimensional characterization of cancer immune microenvironments by imaging mass cytometry. Front. Immunol. 10:2534. doi: 10.3389/fimmu.2019.02534
Kankeu Fonkoua, L. A., Chakrabarti, S., Sonbol, M. B., Kasi, P. M., Starr, J. S., Liu, A. J., et al. (2021). Outcomes on anti-VEGFR-2/paclitaxel treatment after progression on immune checkpoint inhibition in patients with metastatic gastroesophageal adenocarcinoma. Int. J. Cancer 149, 378–386. doi: 10.1002/ijc.33559
Kretzler, M., Cohen, C. D., Doran, P., Henger, A., Madden, S., Gröne, E. F., et al. (2002). Repuncturing the renal biopsy: strategies for molecular diagnosis in nephrology. J. Am. Soc. Nephrol. 13, 1961–1972. doi: 10.1097/01.ASN.0000020390.29418.70
Lake, B. B., Chen, S., Hoshi, M., Plongthongkum, N., Salamon, D., Knoten, A., et al. (2019). A single-nucleus RNA-sequencing pipeline to decipher the molecular anatomy and pathophysiology of human kidneys. Nat. Commun. 10:2832. doi: 10.1038/s41467-019-10861-2
Lee, J. Y., Ismail, O. Z., Zhang, X., Haig, A., Lian, D., and Gunaratnam, L. (2018). Donor kidney injury molecule-1 promotes graft recovery by regulating systemic necroinflammation. Am. J. Transplant. 18, 2021–2028. doi: 10.1111/ajt.14745
Lehmann, M., Allers, K., Heldt, C., Meinhardt, J., Schmidt, F., Rodriguez-Sillke, Y., et al. (2021). Human small intestinal infection by SARS-CoV-2 is characterized by a mucosal infiltration with activated CD8(+) T cells. Mucosal Immunol. 14, 1381–1392. doi: 10.1038/s41385-021-00437-z
Li, R., Lin, Y., Wang, Y., Wang, S., Yang, Y., Mu, X., et al. (2021). Characterization of the tumor immune microenvironment in lung squamous cell carcinoma using imaging mass cytometry. Front. Oncol. 11:620989. doi: 10.3389/fonc.2021.757135
Martinez-Morilla, S., Villarroel-Espindola, F., Wong, P. F., Toki, M. I., Aung, T. N., Pelekanou, V., et al. (2021). Biomarker discovery in patients with immunotherapy-treated melanoma with imaging mass cytometry. Clin. Cancer Res. 27, 1987–1996. doi: 10.1158/1078-0432.CCR-20-3340
McQuin, C., Goodman, A., Chernyshev, V., Kamentsky, L., Cimini, B. A., Karhohs, K. W., et al. (2018). CellProfiler 3.0: next-generation image processing for biology. PLoS Biol. 16:e2005970. doi: 10.1371/journal.pbio.2005970
Melms, J. C., Biermann, J., Huang, H., Wang, Y., Nair, A., Tagore, S., et al. (2021). A molecular single-cell lung atlas of lethal COVID-19. Nature 595, 114–119. doi: 10.1038/s41586-021-03569-1
Patel, J., Maddukuri, S., Li, Y., Bax, C., and Werth, V. P. (2021). Highly multiplexed mass cytometry identifies the immunophenotype in the skin of dermatomyositis. J. Investig. Dermatol. 141, 2151–2160. doi: 10.1016/j.jid.2021.02.748
Ramaglia, V., Sheikh-Mohamed, S., Legg, K., Park, C., Rojas, O. L., Zandee, S., et al. (2019). Multiplexed imaging of immune cells in staged multiple sclerosis lesions by mass cytometry. elife 8:e48051. doi: 10.7554/eLife.48051
Rendeiro, A. F., Ravichandran, H., Bram, Y., Chandar, V., Kim, J., Meydan, C., et al. (2021). The spatial landscape of lung pathology during COVID-19 progression. Nature 593, 564–569. doi: 10.1038/s41586-021-03475-6
Rost, S., Giltnane, J., Bordeaux, J. M., Hitzman, C., Koeppen, H., and Liu, S. D. (2017). Multiplexed ion beam imaging analysis for quantitation of protein expression in cancer tissue sections. Lab. Investig. 97, 992–1003. doi: 10.1038/labinvest.2017.50
Schapiro, D., Jackson, H. W., Raghuraman, S., Fischer, J. R., Zanotelli, V. R. T., Schulz, D., et al. (2017). histoCAT: analysis of cell phenotypes and interactions in multiplex image cytometry data. Nat. Methods 14, 873–876. doi: 10.1038/nmeth.4391
Schulz, D., Zanotelli, V. R. T., Fischer, J. R., Schapiro, D., Engler, S., Lun, X. K., et al. (2018). Simultaneous multiplexed imaging of mRNA and proteins with subcellular resolution in breast cancer tissue samples by mass cytometry. Cell Syst. 6, 25.e5–36.e5. doi: 10.1016/j.cels.2017.12.001
Schwabenland, M., Salié, H., Tanevski, J., Killmer, S., Lago, M. S., Schlaak, A. E., et al. (2021). Deep spatial profiling of human COVID-19 brains reveals neuroinflammation with distinct microanatomical microglia-T-cell interactions. Immunity 54, 1594.e11–1610.e11. doi: 10.1016/j.immuni.2021.06.002
Singh, N., Avigan, Z. M., Kliegel, J. A., Shuch, B. M., Montgomery, R. R., Moeckel, G. W., et al. (2019). Development of a 2-dimensional atlas of the human kidney with imaging mass cytometry. JCI Insight 4:e129477. doi: 10.1172/jci.insight.129477
Wang, Y. J., Traum, D., Schug, J., Gao, L., Liu, C., Atkinson, M. A., et al. (2019). Multiplexed in situ imaging mass cytometry analysis of the human endocrine pancreas and immune system in type 1 diabetes. Cell Metab. 29, 769.e4–783.e4. doi: 10.1016/j.cmet.2019.01.003
Wang, C., Xu, J., Wang, S., Pan, S., Zhang, J., Han, Y., et al. (2020). Imaging mass cytometric analysis of postmortem tissues reveals dysregulated immune cell and cytokine responses in multiple organs of COVID-19 patients. Front. Microbiol. 11:600989. doi: 10.3389/fmicb.2020.600989
Wu, H., Kirita, Y., Donnelly, E. L., and Humphreys, B. D. (2019). Advantages of single-nucleus over single-cell RNA sequencing of adult kidney: rare cell types and novel cell states revealed in fibrosis. J. Am. Soc. Nephrol. 30, 23–32. doi: 10.1681/ASN.2018090912
Wu, H., Malone, A. F., Donnelly, E. L., Kirita, Y., Uchimura, K., Ramakrishnan, S. M., et al. (2018). Single-cell transcriptomics of a human kidney allograft biopsy specimen defines a diverse inflammatory response. J. Am. Soc. Nephrol. 29, 2069–2080. doi: 10.1681/ASN.2018020125
Zhang, Y., Gao, Y., Qiao, L., Wang, W., and Chen, D. (2020). Inflammatory response cells during acute respiratory distress syndrome in patients with coronavirus disease 2019 (COVID-19). Ann. Intern. Med. 173, 402–404. doi: 10.7326/L20-0227
Zhang, W. R., and Parikh, C. R. (2019). Biomarkers of acute and chronic kidney disease. Annu. Rev. Physiol. 81, 309–333. doi: 10.1146/annurev-physiol-020518-114605
Keywords: imaging mass cytometry, kidney, highly multiplexed imaging, kidney-MAPPS, cell phenotype, in situ imaging
Citation: Kakade VR, Weiss M and Cantley LG (2021) Using Imaging Mass Cytometry to Define Cell Identities and Interactions in Human Tissues. Front. Physiol. 12:817181. doi: 10.3389/fphys.2021.817181
Edited by:
Bruce Molitoris, Indiana University, United StatesReviewed by:
Christoph Kuppe, RWTH Aachen University, GermanyCopyright © 2021 Kakade, Weiss and Cantley. This is an open-access article distributed under the terms of the Creative Commons Attribution License (CC BY). The use, distribution or reproduction in other forums is permitted, provided the original author(s) and the copyright owner(s) are credited and that the original publication in this journal is cited, in accordance with accepted academic practice. No use, distribution or reproduction is permitted which does not comply with these terms.
*Correspondence: Vijayakumar R. Kakade, dmlqYXlha3VtYXIua2FrYWRlQHlhbGUuZWR1; Lloyd G. Cantley, bGxveWQuY2FudGxleUB5YWxlLmVkdQ==
†These authors have contributed equally to this work