 Isabella Marinelli
 Patrick A. Fletcher
 Arthur S. Sherman
 Leslie S. Satin
 Richard Bertram
- 1Centre for Systems Modelling and Quantitative Biomedicine (SMQB), University of Birmingham, Birmingham, United Kingdom
- 2Laboratory of Biological Modeling, National Institutes of Health, Bethesda, MD, United States
- 3Department of Pharmacology, Brehm Center for Diabetes Research, University of Michigan Medical School, Ann Arbor, MI, United States
- 4Programs in Neuroscience and Molecular Biophysics, Department of Mathematics, Florida State University, Tallahassee, FL, United States
Insulin is secreted in a pulsatile pattern, with important physiological ramifications. In pancreatic β-cells, which are the cells that synthesize insulin, insulin exocytosis is elicited by pulses of elevated intracellular Ca2+ initiated by bursts of electrical activity. In parallel with these electrical and Ca2+ oscillations are oscillations in metabolism, and the periods of all of these oscillatory processes are similar. A key question that remains unresolved is whether the electrical oscillations are responsible for the metabolic oscillations via the effects of Ca2+, or whether the metabolic oscillations are responsible for the electrical oscillations due to the effects of ATP on ATP-sensitive ion channels? Mathematical modeling is a useful tool for addressing this and related questions as modeling can aid in the design of well-focused experiments that can test the predictions of particular models and subsequently be used to improve the models in an iterative fashion. In this article, we discuss a recent mathematical model, the Integrated Oscillator Model (IOM), that was the product of many years of development. We use the model to demonstrate that the relationship between calcium and metabolism in beta cells is symbiotic: in some contexts, the electrical oscillations drive the metabolic oscillations, while in other contexts it is the opposite. We provide new insights regarding these results and illustrate that what might at first appear to be contradictory data are actually compatible when viewed holistically with the IOM.
Introduction
Pancreatic β-cells contribute to maintaining glucose homeostasis in the body by producing and secreting insulin in a pulsatile fashion, with a period of 4–5 min (Laurenti et al., 2020, 2021; Shukla et al., 2021). Pulses of insulin are more efficient than constant secretion at lowering the level of plasma glucose by suppressing hepatic glucose production and stimulating uptake of glucose by muscle and adipose tissue (Komjati et al., 1986; Paolisso et al., 1991; Matveyenko et al., 2012), and plasma insulin oscillations are disrupted in patients with type I and II diabetes (reviewed in Satin et al., 2015). Insulin secretion is evoked by elevations in the intracellular Ca2+ concentration, so pulsatile insulin secretion is associated with oscillations in the intracellular Ca2+ concentration.
This has been studied most directly in mice, where it has been possible to measure both in vivo insulin oscillations and in vitro calcium oscillations from the same mouse and show that the frequencies are well correlated (Nunemaker et al., 2005). Although the oscillation patterns are more varied and complex in humans, slow oscillations of appropriate frequency in calcium (Martin and Soria, 1996; Bertram et al., 2018), membrane potential (Riz et al., 2014), and insulin secretion (Marchetti et al., 1994; Lin et al., 2002; Misun et al., 2020) have been observed in human islets in vitro. Thus, these oscillations all originate from bursting electrical activity. In addition, they are accompanied by oscillations in metabolism, as demonstrated by multiple observations in mouse islets of ATP concentration (Li et al., 2013; Merrins et al., 2016), NAD(P)H fluorescence (Luciani et al., 2006; Merrins et al., 2010), mitochondrial membrane potential (Krippeit-Drews et al., 2000; Merrins et al., 2016), and the glycolytic metabolite fructose-1,6-bisphosphate (FBP) (Merrins et al., 2013, 2016).
Bursting electrical activity consists of an episode of action potentials (the active phase) followed by a period of membrane repolarization (the silent phase), repeated periodically. Since the electrical impulses are produced by Ca2+ influx through voltage-dependent Ca2+ channels (Ca2+ channels), the intracellular Ca2+ concentration is higher during each burst active phase and lower during each silent phase. These periodic rises in Ca2+ evoke exocytosis of insulin-containing vesicles during each active phase (Rorsman and Ashcroft, 2018).
The mechanism responsible for bursting activity remains elusive. It has been proposed that Ca2+ oscillations are responsible for periodically switching the cell between the active and silent phases by acting on Ca2+-dependent K+ channels [K(Ca) channels], or (indirectly) on ATP-sensitive K+ channels [K(ATP) channels] (Chay and Keizer, 1983; Keizer and Smolen, 1991; Smolen and Keizer, 1992; Magnus and Keizer, 1998; Fridlyand et al., 2005; Diederichs, 2006; Cha et al., 2011). However, alongside these Ca2+ oscillations are metabolic oscillations that have a similar period. These oscillations are manifested as oscillations in the ATP/ADP ratio, which determines K(ATP) channel activity (Ashcroft et al., 1984; Cook and Hales, 1984; Henquin, 1988), thus linking oscillations in metabolism to oscillations in electrical activity and Ca2+. Whether these metabolic oscillations are intrinsic (Tornheim, 1997) or passively driven by the downstream effects of Ca2+ oscillations (Fridlyand et al., 2005; Cha et al., 2011) has been a matter of debate. One proposal is that metabolic oscillations are driven by oscillations in glycolysis (Tornheim, 1997), as has been demonstrated in extracts from skeletal muscle cytosol (Tornheim and Lowenstein, 1974). Another is that ATP/ADP varies dynamically due to the hydrolysis of ATP to power the Ca2+ pumps of the plasma and ER membranes. These pumps remove Ca2+ from the cytosol during each active phase (Detimary et al., 1998).
Although both the cytosolic Ca2+ concentration and ATP (and other metabolites) oscillate with similar periods, the question of “who is driving bursting?” has yet to be answered. Are Ca2+ oscillations driving metabolic oscillations, or vice versa? Mathematical modeling provides a valuable tool for addressing this question, as we demonstrate herein. Models can incorporate different oscillation mechanisms that yield differential predictions. One model, the Integrated Oscillator Model (IOM) (McKenna et al., 2016; Marinelli et al., 2018), incorporates both bursting mechanisms, with different parameter combinations determining which mechanism wins out. In this perspectives article, we use the IOM to demonstrate how the model has been and can be used to investigate the origin of pulsatile insulin secretion, electrical bursting oscillations, and Ca2+ and metabolic oscillations of pancreatic β-cells. We also use the IOM to demonstrate how modeling can resolve apparently contradictory data concerning the effects of Ca2+ on the polarization of the mitochondrial inner membrane.
Materials and Methods
Mathematical Model
We used the Integrated Oscillator Model (IOM) to simulate a representative β-cell in a well-coupled islet. Figure 1 shows key elements of the model. The current model is an extension of a prior IOM implementation (Marinelli et al., 2018). In particular, we added a third module to account for mitochondrial metabolism (adapted from Bertram et al., 2007a) to the previous two modules representing cellular electrical activity and glycolysis. The differential equations were integrated numerically using MATLAB (MathWorks Inc., Natick, MA); the computer code can be downloaded from https://www.math.fsu.edu/∼bertram/software/islet/.
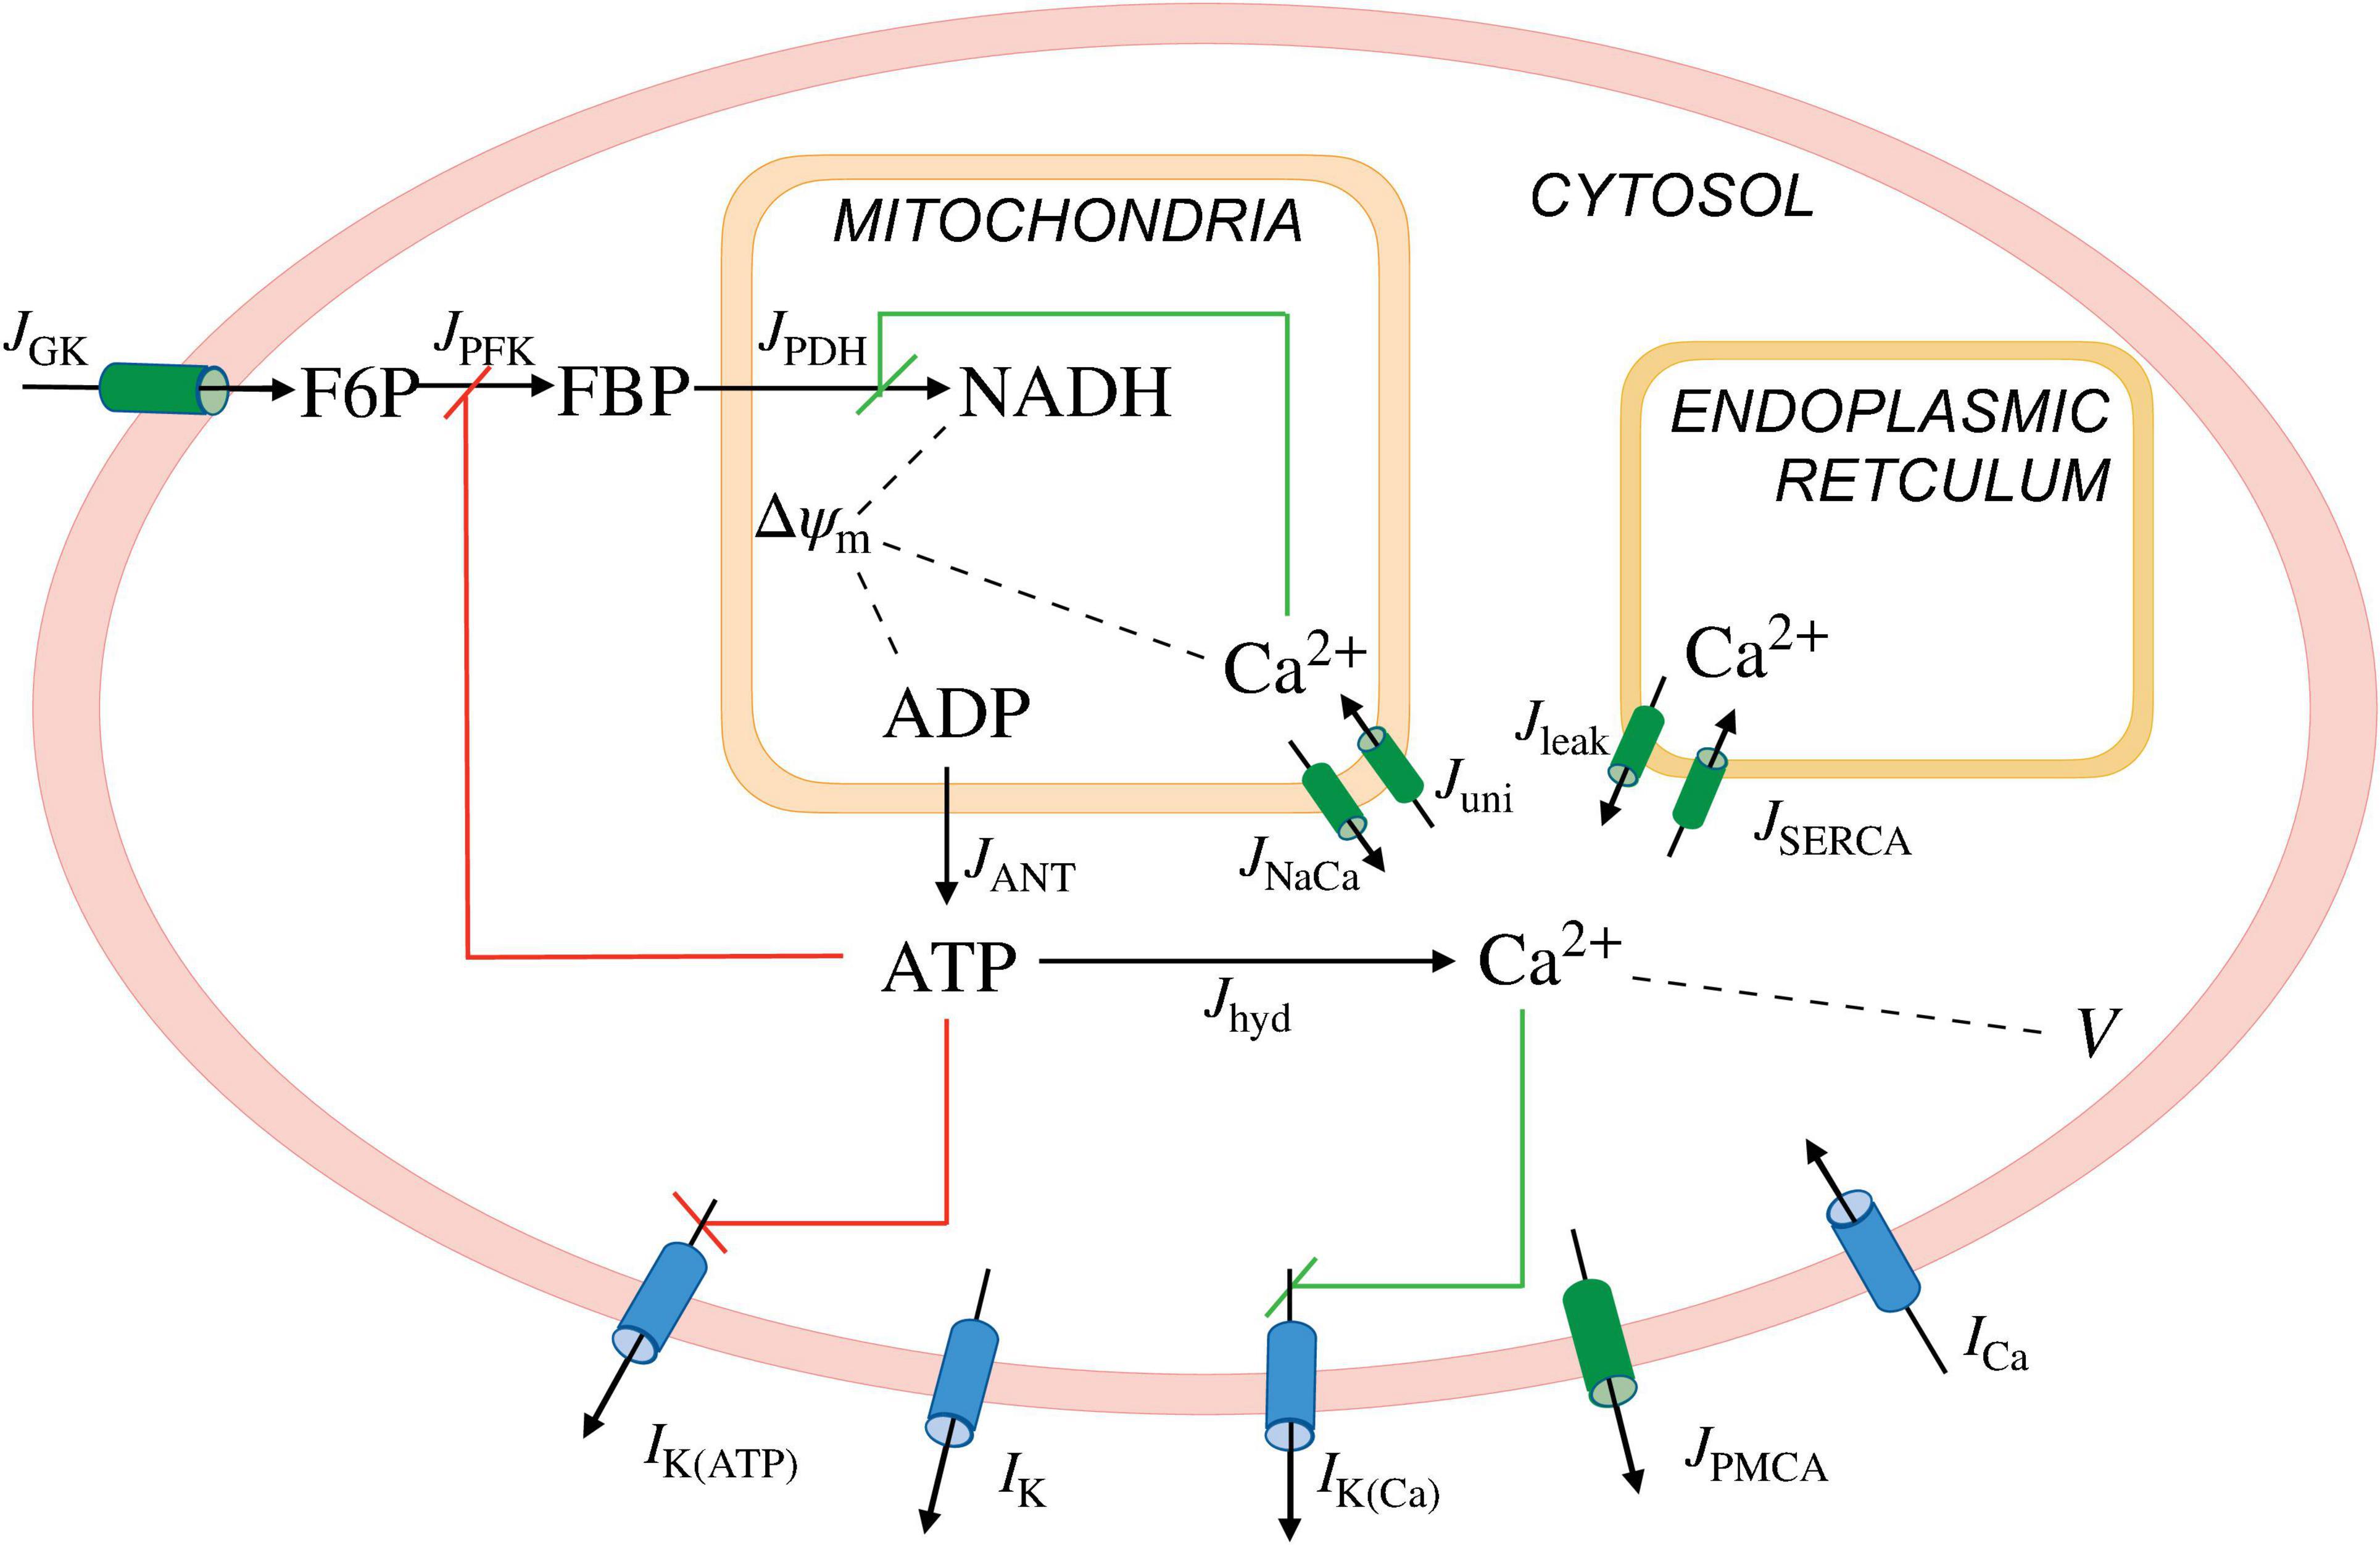
Figure 1. Illustration of the IntegratedOscillatorModel(IOM). The model consists of three modules. A first module describes the β-cell electrical activity and Ca2+ dynamics, the second describes key elements of glycolysis, and the third accounts for the mitochondrial metabolism. The second and third modules together make up the metabolic subsystem. I, ionic currents; J, fluxes; K(ATP), ATP-sensitive K+ channels; K, delayed rectifier K+ channels; K(Ca), Ca2+-activated K+ channels; PMCA, plasma membrane Ca2+ ATPase; Ca, V-dependent Ca2+ current; GK, glucokinase; PFK, phosphofructokinase; PDH, phosphate dehydrogenase; ANT, adenine nucleotide translocator; hyd, hydrolysis; NaCa, Na+-Ca2+ exchanger; uni, uniporter; leak, Ca2+ leak across the ER membrane; SERCA, sarcoplasmic endoplasmic reticulum Ca2+ pumps; V and △ψm, cellular and mitochondrial membrane potential, respectively. The red and green lines represent negative and positive feedback, respectively.
In this model, the flux through the pyruvate dehydrogenase (PDH) reaction (JPDH) is given by
where vPDH is the maximum PDH reaction rate, JGPDH is the flux through the glycerol-3-phosphate dehydrogenase (GPDH) reaction, and NADHm and NADm are dinucleotides of mitochondria. The GPDH reaction rate (JGPDH) is given by
with representing the Ca2+ concentration of the mitochondria. In the IOM, the K(ATP) current (IK(ATP)) is described by
where gK(ATP) is the maximum conductance, V is the plasma membrane potential, VK is the K+ Nernst potential, and o∞(ATP,ADP) is the fraction of activated K(ATP) channels,
Here, MgADP = 0.165 ADP, ADP3– = 0.135 ADP, and ATP4– = 0.05 ATP, while the parameters ktt, ktd and kdd represent the dissociation constants for ATP, ADP, and MgADP, respectively.
We simulated the addition of the K(ATP) channel activator diazoxide (Dz) by increasing the dissociation constants for ATP (ktt) from 1 to 2μM. The application of KCl, which induces cell depolarization, was simulated by increasing the K+ Nernst potential (VK) from –75 to −70mV.
The model used here should be thought of as simulating a representative β-cell in a well synchronized islet. There has been a great deal of interest recently in β-cell heterogeneity within the islets, which is beyond our scope, as it doesn’t generate the oscillations, though it does strongly influence the characteristics of the oscillations. The hypothesis that the mechanisms of oscillations are inherent in the β-cells rather than the network is supported by calcium imaging in isolated β-cells and in islets lacking gap junctions. Oscillations are observed but are irregular (likely due to noise) and occur out of the normal glucose range (likely due to heterogeneity) and, in islets, asynchronous (Ravier et al., 2005; Benninger et al., 2011; Dwulet et al., 2019; Scarl et al., 2019). See the following for recent work on the roles of heterogeneity (Cappon and Pedersen, 2016; Benninger and Hodson, 2018; Nasteska and Hodson, 2018; Stozer et al., 2019; Joglekar et al., 2021; Zmazek et al., 2021).
Results
Electrical, Ca2+, and Metabolic Subsystems Are Symbiotic
The transduction of glucose input to insulin output in β-cells is complex, and can be thought of in terms of feedforward and feedback pathways implemented through the metabolism of glucose (which, unlike most cells, plays a key role not only in providing energy but also in intracellular signaling), intracellular Ca2+ signaling, and membrane electrical activity. We describe these pathways in some detail below, but begin with an overview illustrated in Figure 2.
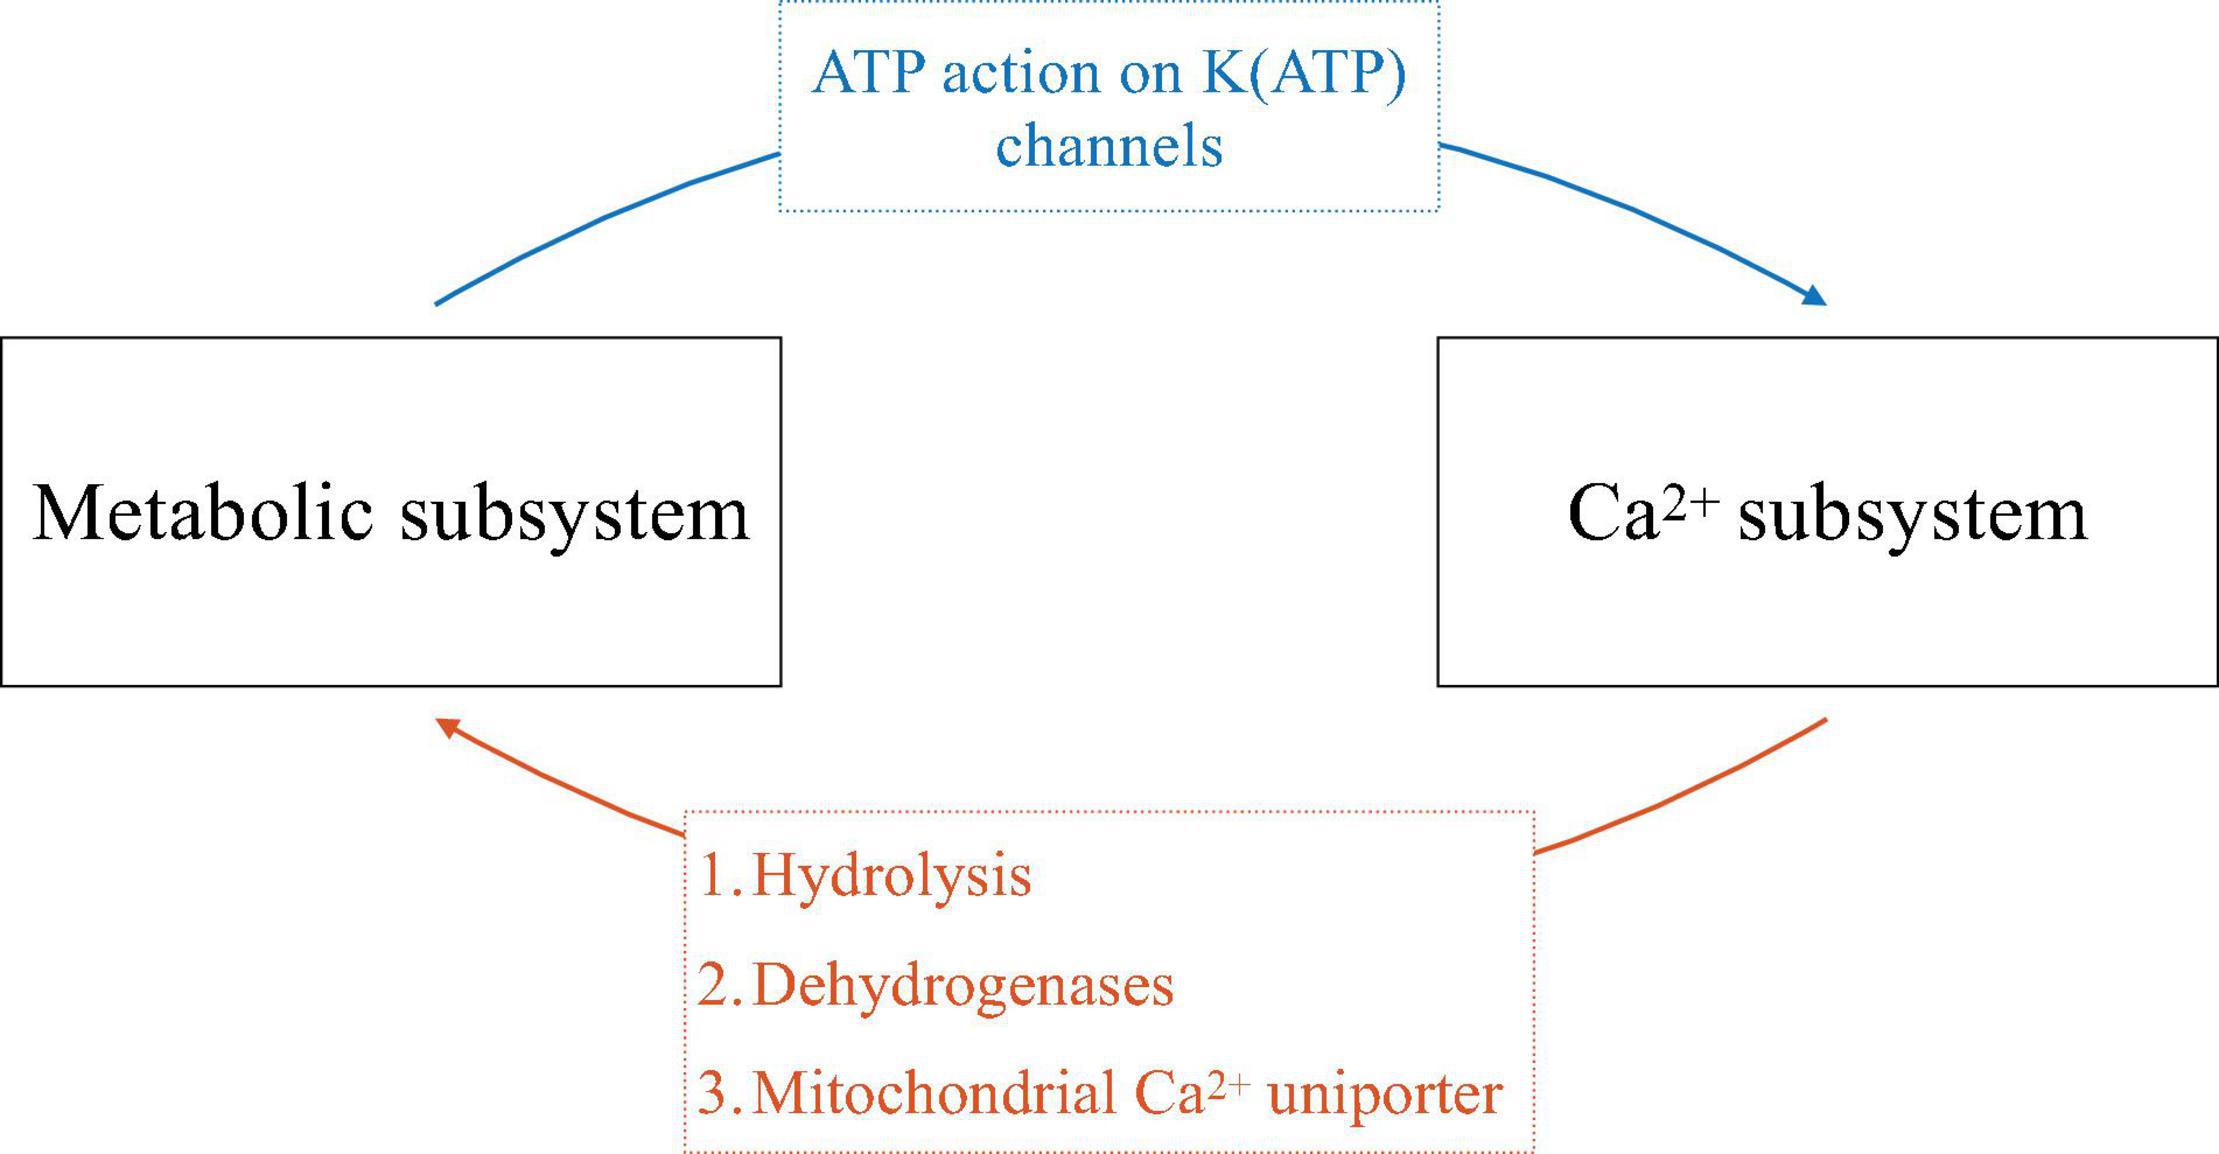
Figure 2. Schematic of the symbiosis of electrical and metabolic oscillators. The ways that one subsystem affects the other is indicated on the arrows.
Glucose triggers β-cell electrical activity through the metabolic production of ATP from ADP, resulting in an increase in cytosolic ATP/ADP. This increase inhibits K(ATP) channels and thereby reduces net outward K+ current, resulting in cell depolarization. This depolarization opens voltage-dependent Ca2+ channels and allows Ca2+ influx, producing electrical impulses and increasing the intracellular Ca2+ concentration (blue arrow, Figure 2). In this way, metabolism feeds forward onto the cell’s electrical activity and Ca2+ subsystem. If metabolism oscillates, this pathway can produce bursting electrical activity and Ca2+ oscillations.
Cytosolic Ca2+, as well as Ca2+ entering organelles such as the endoplasmic reticulum (ER) and mitochondria, in turn affects metabolism through several pathways (orange arrow, Figure 2). One is via ATP hydrolysis needed to power the Ca2+ pumps of the plasma membrane and ER membrane. These pumps, or Ca2+-ATPases, are particularly active during the active phases of bursting, when cytosolic Ca2+ is elevated. The hydrolysis of ATP that results in turn reduces cytosolic ATP/ADP. If the Ca2+ concentration oscillates, then ATP/ADP, and the levels of other metabolites, will concomitantly oscillate as ATP is hydrolyzed by Ca2+ pump activity (Detimary et al., 1998). A second way for Ca2+ to affect metabolism is by activating dehydrogenases of the glycolytic pathway and tricarboxylic acid cycle (TCA cycle), speeding up metabolism (Denton, 2009). If the Ca2+ concentration is oscillatory, then ATP production in this case will be facilitated during each active phase, leading to ATP/ADP oscillations. A third way for Ca2+ to influence metabolism is due to Ca2+ flux through the mitochondrial Ca2+ uniporter, the main path for Ca2+ transport across the mitochondrial inner membrane (De Stefani et al., 2015). This influx depolarizes the mitochondrial membrane potential, reducing ATP synthesis through oxidative phosphorylation (Magnus and Keizer, 1998). If the Ca2+ concentration oscillates, then there will be increased flux across the mitochondrial inner membrane during each active phase of the oscillation, resulting in oscillations in ATP synthesis and thus in cytosolic ATP/ADP.
Symbiosis of the Two Subsystems Provides Multiple Mechanisms for Rhythm Generation
The symbiotic relationship between the metabolic and Ca2+ subsystems described here, with mutual feedback from one subsystem to the other, provides for several potential mechanisms underlying electrical bursting and oscillations in Ca2+ and metabolism. In one mechanism, oscillations can be generated purely within the metabolic subsystem, and project out to the other subsystems (blue arrow, Figure 2). This intrinsic metabolic oscillator can be mediated by glycolysis, due to the allosteric enzyme phosphofructokinase (PFK), which is positively regulated by its product FBP. This positive autoregulation can lead to oscillations due to the negative feedback that occurs through substrate pool depletion (Smolen, 1995). Indeed, evidence for this comes from work done on skeletal muscle extracts, where the M-type (for muscle) isoform of PFK is dominant (Tornheim and Lowenstein, 1974). This isoform is also dominant in β-cells (Yaney et al., 1995), prompting the proposal that the same rhythmogenic mechanism applies (Tornheim, 1997). We refer to these intrinsic metabolic oscillations as Active Metabolic Oscillations (AMOs). [We previously referred to them as Active Glycolytic Oscillations (Bertram et al., 2018), but have generalized the nomenclature to make clear that the concept applies to oscillations of all metabolites, whether they are part of glycolysis or oxidative phosphorylation].
At the other extreme, metabolic oscillations can be generated purely due to the elevations in Ca2+ that occur during each active phase, and downstream effects resulting from that elevation (orange arrow, Figure 2), primarily due to ATP hydrolysis by the Ca2+ ATPases (Detimary et al., 1998). We refer to these Ca2+-dependent metabolic oscillations as Passive Metabolic Oscillations (PMOs), since the metabolic variables in this case are only responding to Ca2+.
In either case, the cell’s electrical activity is ultimately determined by ion channels. Several spiking patterns have been reported in the literature: fast spiking with a period of about 100 ms; fast bursting with superimposed spikes, with a period of tens of seconds (Meissner, 1976; Henquin and Meissner, 1984); and slow bursting with a period of 5 min or more (Henquin et al., 1982; Cook, 1983). Each electrical pattern is associated with a corresponding oscillation in Ca2+. For recent work on the interactions of spikes and bursts see Zmazek et al. (2021). In the case of slow bursting, the most likely channel type for turning burst active phases on and off is the K(ATP) channel (Keizer and Magnus, 1989; Detimary et al., 1998; Magnus and Keizer, 1998). If this is correct, then ATP/ADP oscillations drive bursting through the activation/deactivation of K(ATP) channels. A likely mechanism for fast bursting oscillations is cyclic activation of K(Ca) channels.
While it can be difficult to ascribe one of these mechanisms or the other to a particular pattern of bursting by period alone, this can be addressed using computer simulations with the IOM, as in Figure 3. The left panels show slow oscillations in which the metabolic oscillations are passive (PMOs), and the right panels show bursting with AMOs. These different scenarios were obtained using different values of the maximum catalytic rate for PDH, vPDH (Eq. 1). Slow oscillations exist for intermediate range of values of vPDH, as described in Bertram et al. (2018) and explored quantitatively in Marinelli et al. (2018). The Ca2+ traces (Figures 3A,B) share the same basic features (a rapid rise at the start of an active phase, a plateau throughout most of the active phase, and a sharp drop initially, followed by a slower drop during the silent phase). The ATP oscillations (Figures 3E,F) also have roughly the same shapes. The only clear difference between the two cases is the shape of the FBP time course. With PMOs it has a sawtooth pattern (Figure 3C) with peaks at the beginning of the active phase and nadirs at the end. With AMOs, FBP is pulsatile (Figure 3D), exhibiting peaks at the beginning of the active phase and then slowly decreasing to almost zero, where it remains during most of the silent phase. While a FRET sensor has been developed in our lab that reports FBP dynamics (PKAR, for Pyruvate Kinase Activity Reporter) (Merrins et al., 2013), our analysis (unpublished observations) of data from a population of islets indicates that it is difficult in practice to experimentally distinguish between the sawtooth and pulsatile FBP patterns.
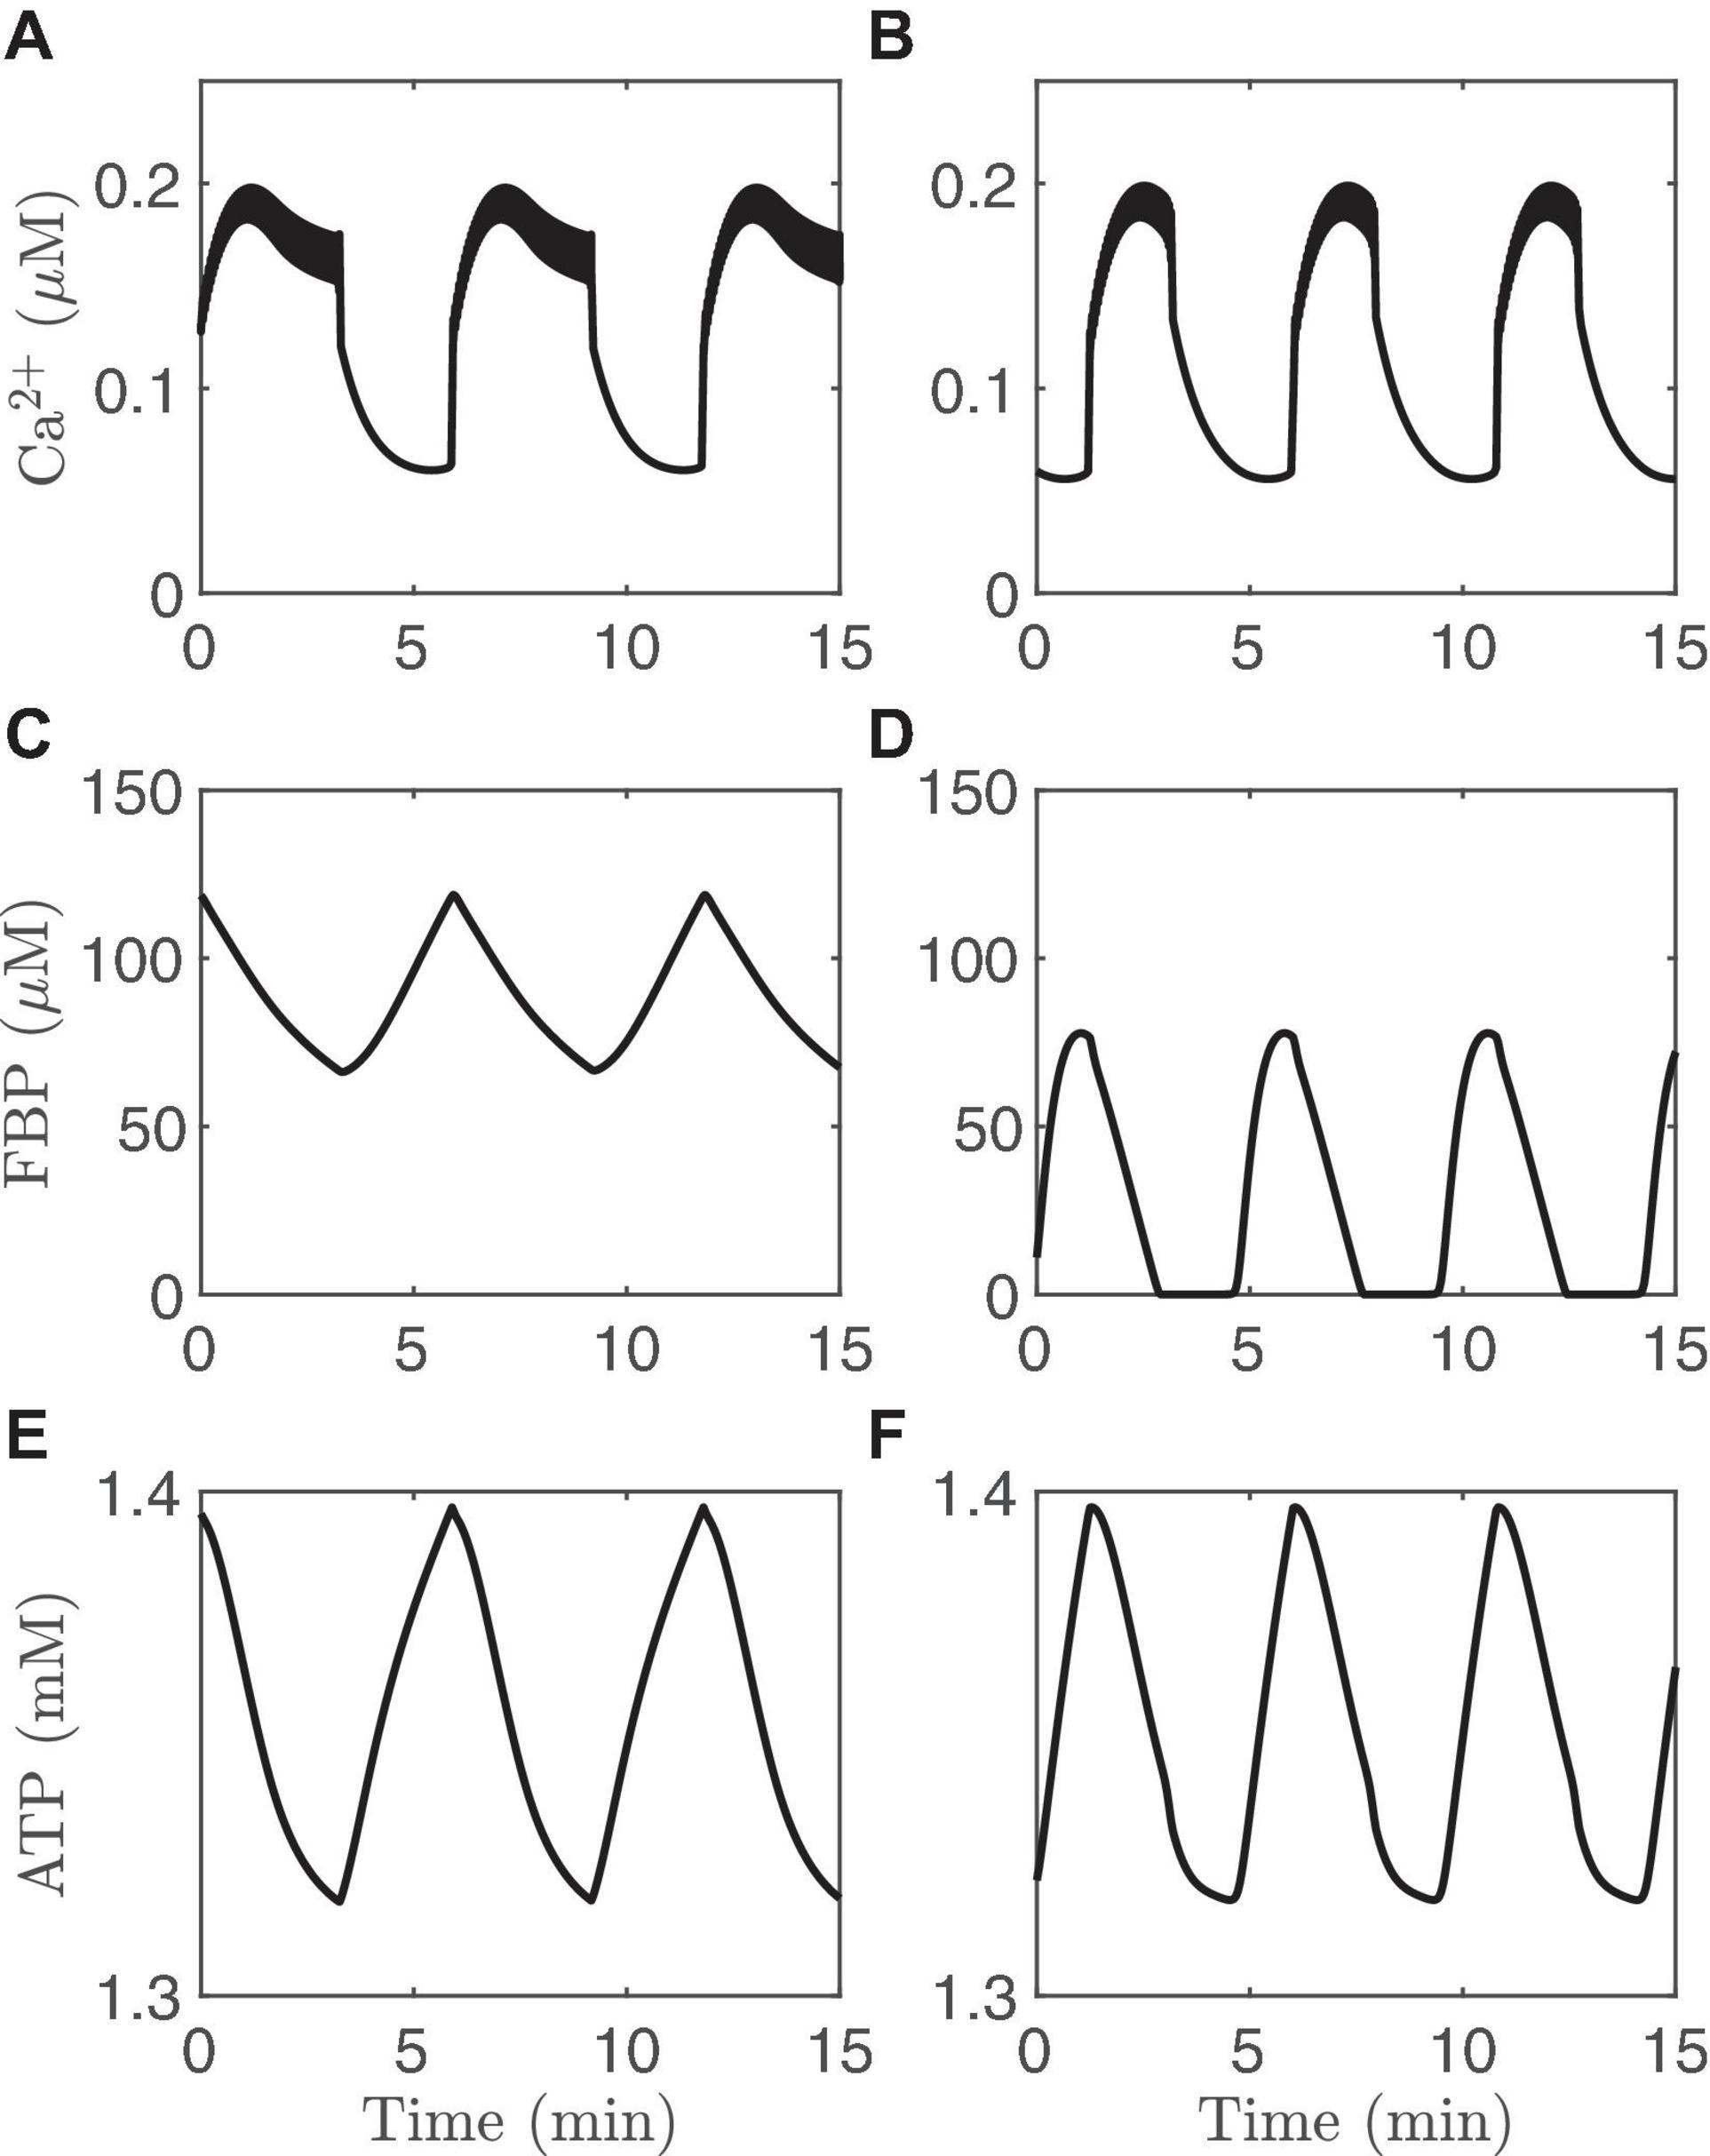
Figure 3. Time courses generated with the IOM. The columns on the left (A,C,E) show an example of PMOs, while those on the right (B,D,F) show an example of AMOs. For the left column, vPDH = 0.4 μM/ms while for the right column and vPDH = 2 μM/ms. In both cases, gK(Ca) = 150pS and the glucose concentration in 11 mM.
Clamping the Ca2+ Concentration Can Distinguish Active Metabolic Oscillations and Passive Metabolic Oscillations
Another way to distinguish AMOs and PMOs theoretically is illustrated in Figure 4. As in the previous figure, the traces on the left are from an oscillating system exhibiting PMOs, while those on the right are from a system exhibiting AMOs. At time t=15 min, the Ca2+ concentration is clamped in both cases to a fixed level. This terminates the metabolic oscillations in the case of PMOs (left), while metabolic oscillations persist in the case of AMOs (right). This is a clear qualitative difference between the two oscillation mechanisms that does not require distinguishing between small changes in the shapes of variables. It is a perfect model prediction. But can it be tested experimentally?
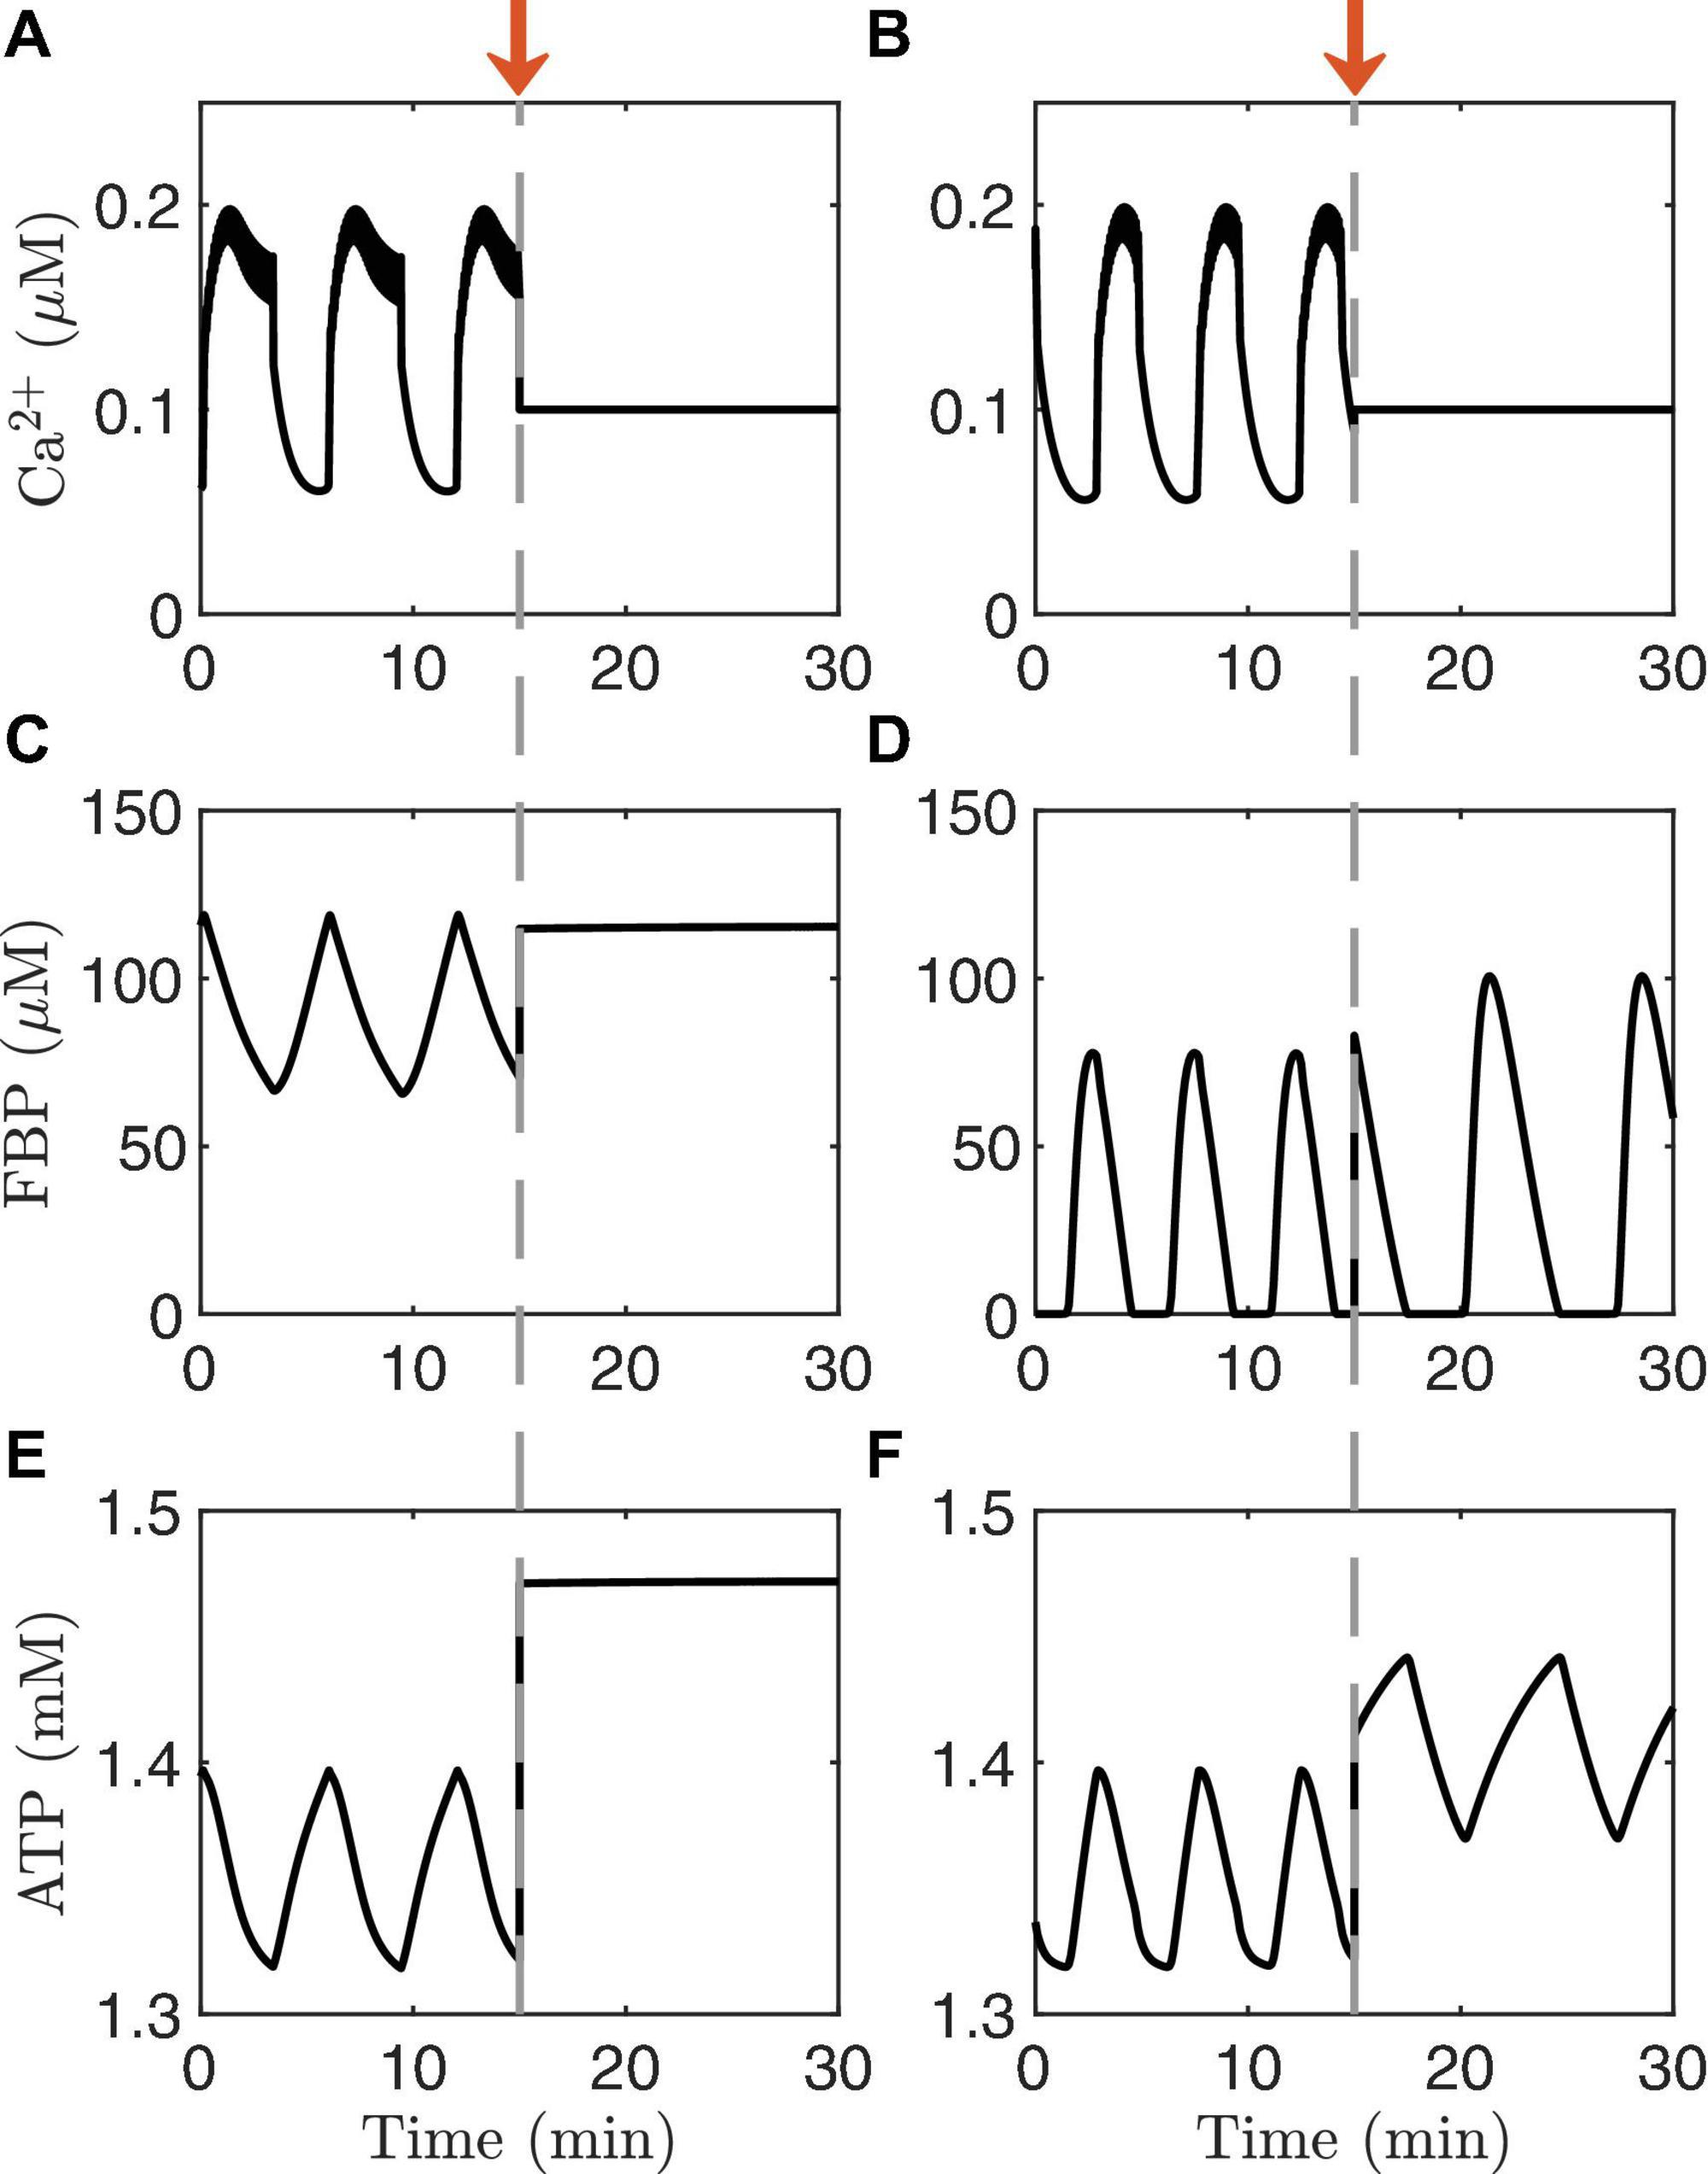
Figure 4. Time courses generated with the IOM. The columns on the left (A,C,E) show an example of PMOs, while those on the right (B,D,F) show an example of AMOs. At time t = 15 min (arrow), the Ca2+ concentration is clamped. In the model with the PMOs (left column) all oscillations stop, while in case of AMOs (right column) the metabolic oscillations persist. The values of vPDH and gK(Ca) and glucose are the same as in Figure 3.
It is possible to clamp the Ca2+ level of a single cell pharmacologically by bath applying diazoxide (Dz), an activator of K(ATP) channels. The level at which Ca2+ is clamped, moreover, can be raised by increasing the concentration of KCl in the bath solution, which depolarizes the cells and thereby opens more Ca2+ channels. This procedure for clamping islet Ca2+ has been used to better understand intracellular signaling in islet β-cells by short-circuiting the dynamics of the Ca2+ subsystem (Gembal et al., 1992; Merrins et al., 2010). Model simulations depicting this are shown in Figure 5. Each panel of the figure shows a simulation of what can happen when Ca2+ is first clamped with Dz, and then the Ca2+ level is increased by raising the KCl concentration in the continued presence of Dz. We illustrate the results in different cases, represented by different values set for the parameter vPDH. The first three panels exhibit AMOs prior to clamping, while the last exhibits PMOs.
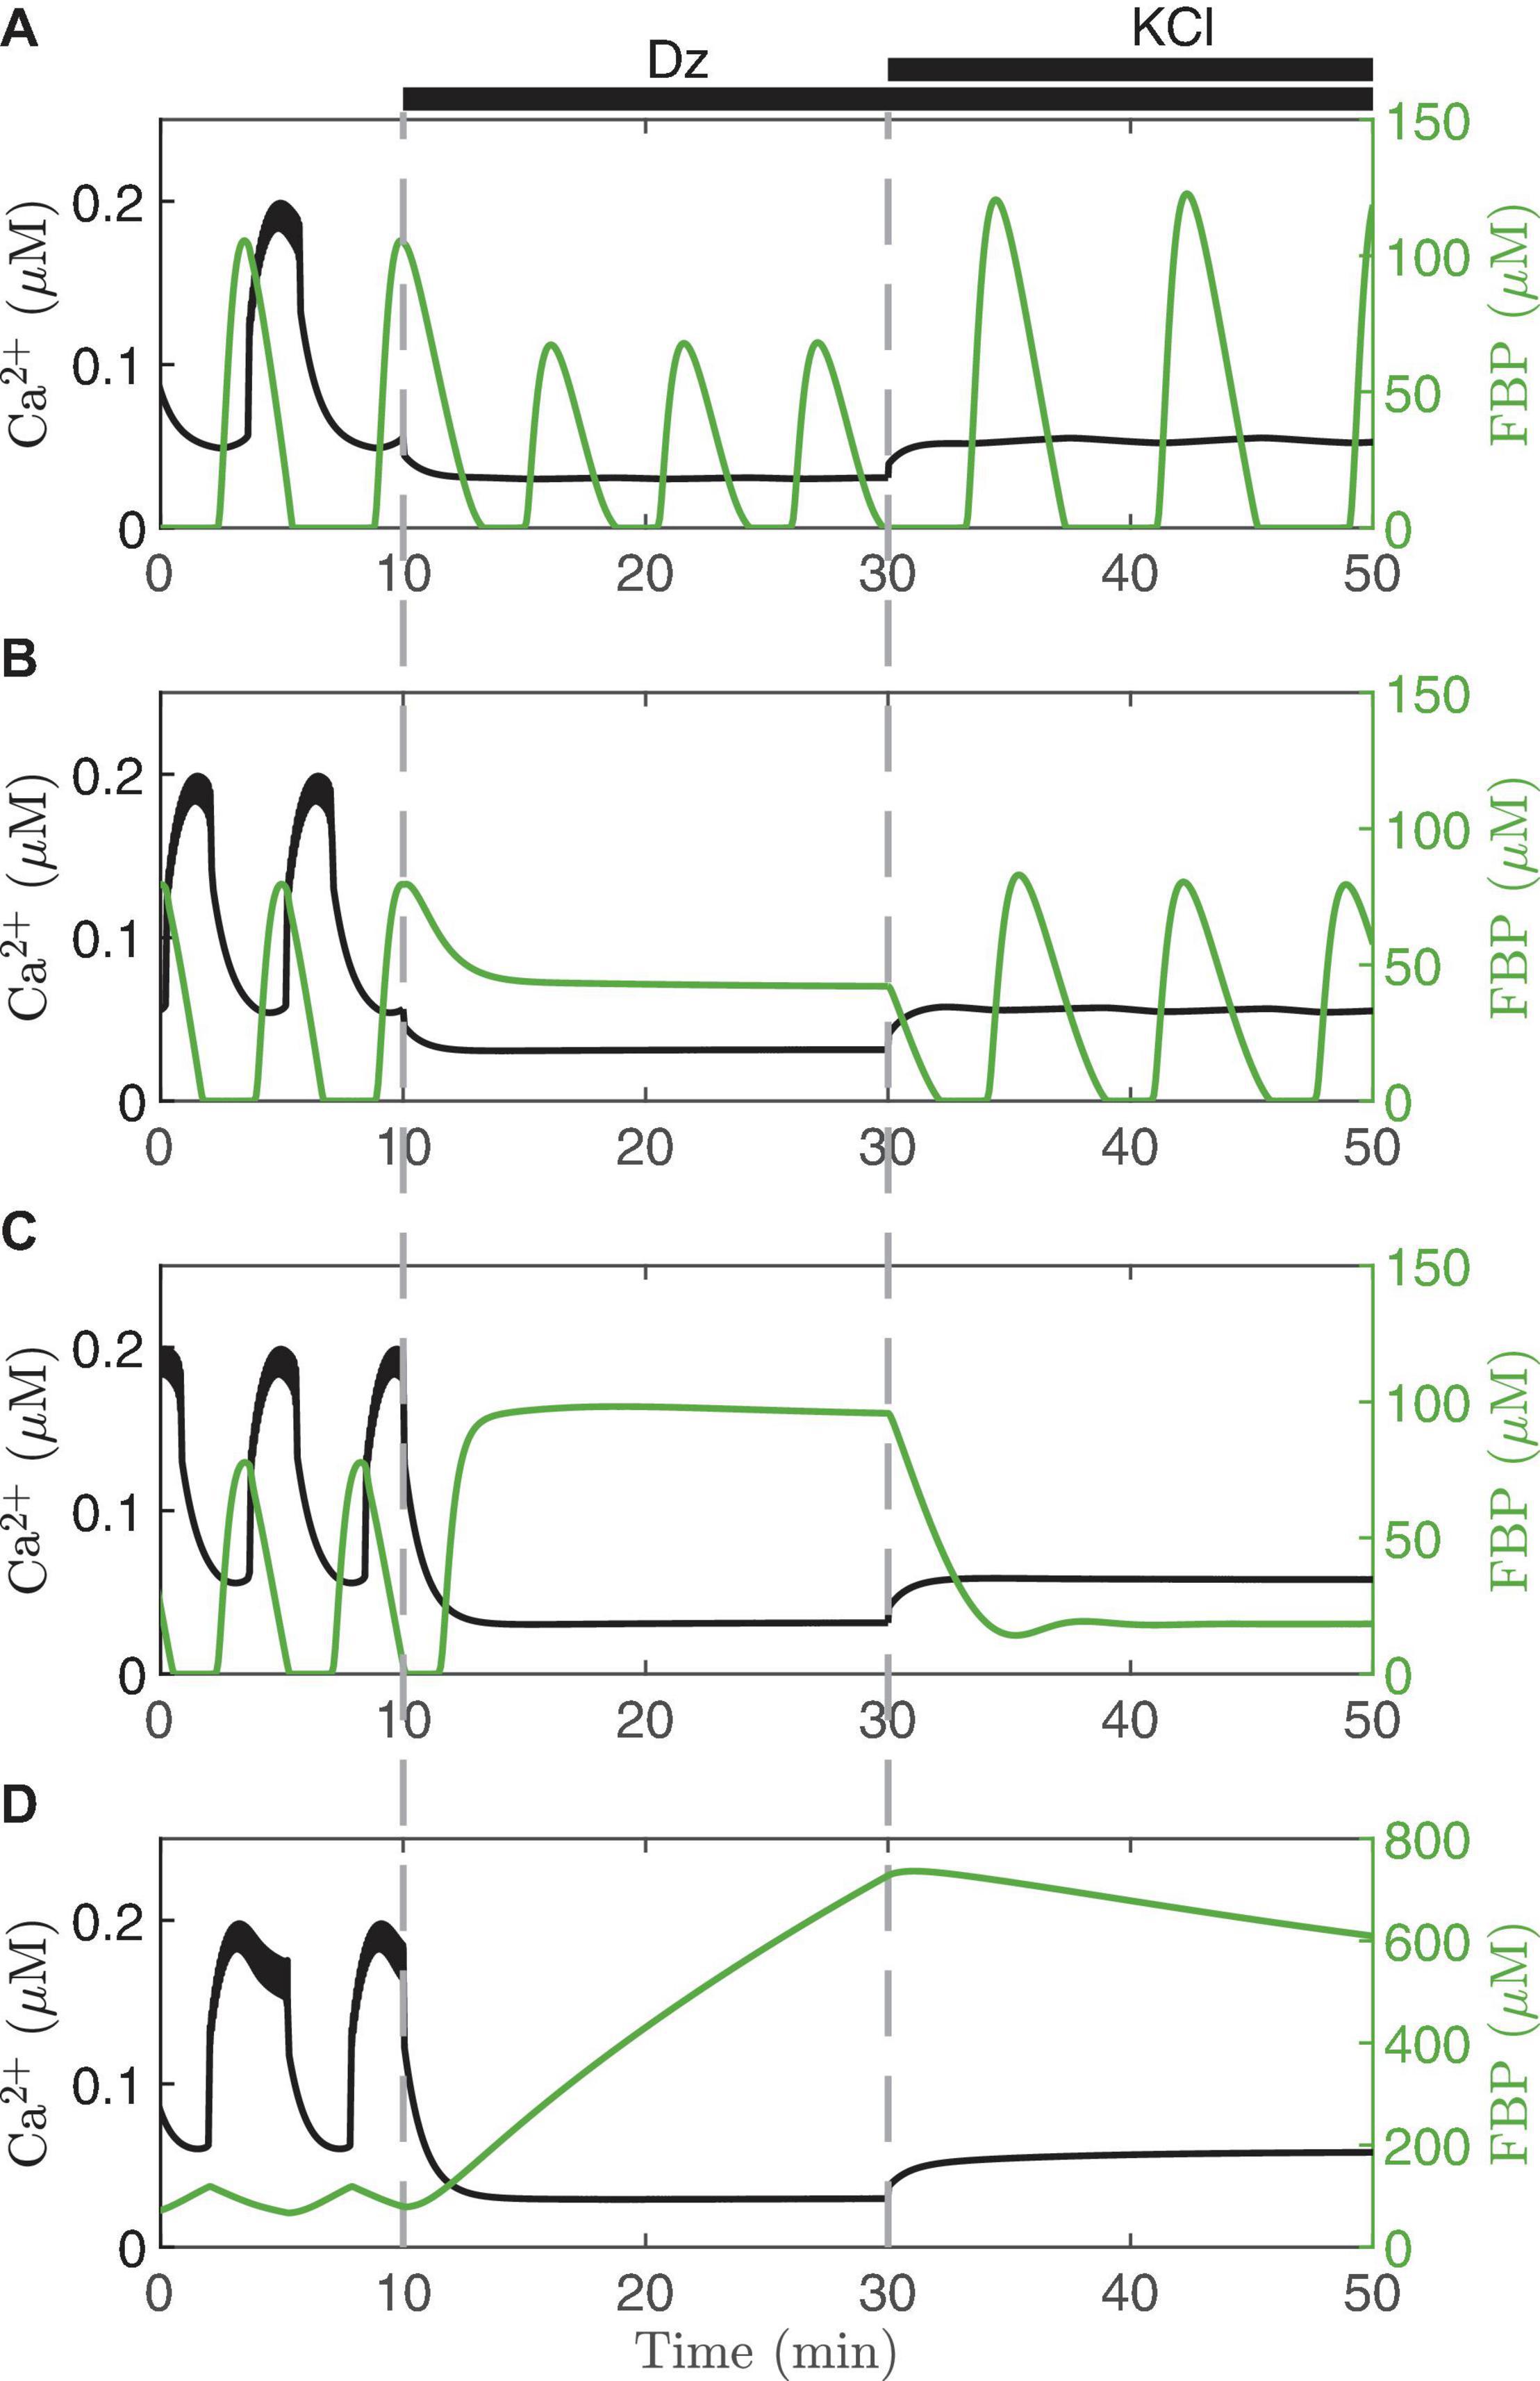
Figure 5. Model simulations in which the membrane potential is clamped with diazoxide (Dz) and elevated KCl. Each panel illustrates the model predictions for vPDH = 7 μM/ms (A), 3 μM/ms (B), 2 μM/ms (C), 0.4 μM/ms (D). In all cases, gK(Ca) = 150pS and the glucose concentration is 11 mM.
When Dz is first applied, the Ca2+ oscillations stop in all four cases (Ca2+ is clamped to a low value since the cell is hyperpolarized due to K(ATP) opening). However, in the top case (Figure 5A) the metabolic oscillations (shown here by the glycolytic metabolite FBP) persist in Dz. When KCl is applied with Dz, the Ca2+ level is increased, and at this higher Ca2+ level the metabolic oscillations become slower and larger in amplitude. This is a clear demonstration that, in this case, the metabolic oscillations are AMOs, as in the right panels of Figure 4. They thus do not require oscillatory Ca2+ for them to occur, although they do require Ca2+ to be at a sufficiently high, but not too high, level (achieved by adding KCl). We also note that the Ca2+ level in the presence of Dz does modulate AMO period and amplitude. What is perhaps more surprising is that in the middle two cases (Figures 4B,C), which both also show AMOs, clamping Ca2+ with Dz can be seen to terminate the metabolic oscillations. Indeed, a similar finding done experimentally [where NAD(P)H or oxygen consumption was measured as the metabolic variable] led to the conclusion that metabolic oscillations are not intrinsic (AMOs), but must be driven by the Ca2+ oscillations (PMOs) (Kennedy et al., 2002; Luciani et al., 2006). As our simulation in Figure 4B shows, however, when Ca2+ was subsequently elevated to a higher level, the metabolic oscillations re-emerged. Thus, in this case, metabolic oscillations clearly do not require Ca2+ oscillations, just a more elevated level of Ca2+. Measurements of NAD(P)H were made to test this prediction (Merrins et al., 2010), and it was found that while Dz often terminated the metabolic oscillations, in some of the cases the oscillations re-emerged following the addition of KCl. Thus, the experimental data showed examples that matched both panels A and B of the simulations in Figure 5. A later experimental study also found recovery of the metabolic oscillations with the application of KCl, but in this case measurements were made using PKAR (Merrins et al., 2016), a more direct readout of glycolytic oscillations.
The bottom two panels of Figure 5 show examples where the metabolic oscillations were terminated by simulated application of Dz, and did not recover even following islet depolarization by KCl. This behavior was also observed experimentally (Merrins et al., 2010, 2016). However, it is not known in this case whether the metabolic oscillations present before Ca2+ was clamped were AMOs (as in Figure 5C) or PMOs (as in Figure 5D). The latter type would be expected from Figure 4 (left column), as these passive metabolic oscillations must stop when Ca2+ does not oscillate. It is harder to understand the former case (Figure 4C) since the metabolic oscillations that existed before Ca2+ was clamped were AMOs that do not require Ca2+ oscillations. So why were the metabolic oscillations not rescued by elevating Ca2+ with KCl? Put simply, it is because the Ca2+ level induced by the KCl in this case was not sufficiently large; increasing the Ca2+ level further indeed rescues the metabolic oscillations. For more details (see Watts et al., 2014; Marinelli et al., 2018).
Islet Ca2+ can also be clamped by exposing islets to glucose concentrations below the threshold for electrical activity. This was done in Nunemaker et al. (2006) and small oscillations in the Ca2+ concentration could be detected even in the absence of electrical activity. Figure 6 illustrates the model prediction when the concentration of glucose was reduced from a stimulatory level (11 mM) to a substimulatory level near the threshold (5 mM, arrow). At 5 mM, the cell is not bursting, although small fluctuations in Ca2+ concentration occur. Where do these fluctuations come from? Examination of the superimposed FBP trace shows that even in subthreshold glucose, intrinsic metabolic oscillations are produced that act on the Ca2+ concentration by causing oscillations in ATP/ADP (blue arrow, Figure 2); these produce small voltage fluctuations that result in small Ca2+ fluctuations. Note that these subthreshold Ca2+ fluctuations are much smaller than the oscillations produced at a stimulatory glucose level, and are too small to drive any plausible Ca2+-dependent oscillation mechanism, but they are large enough to be detected experimentally, as shown in Nunemaker et al. (2006).
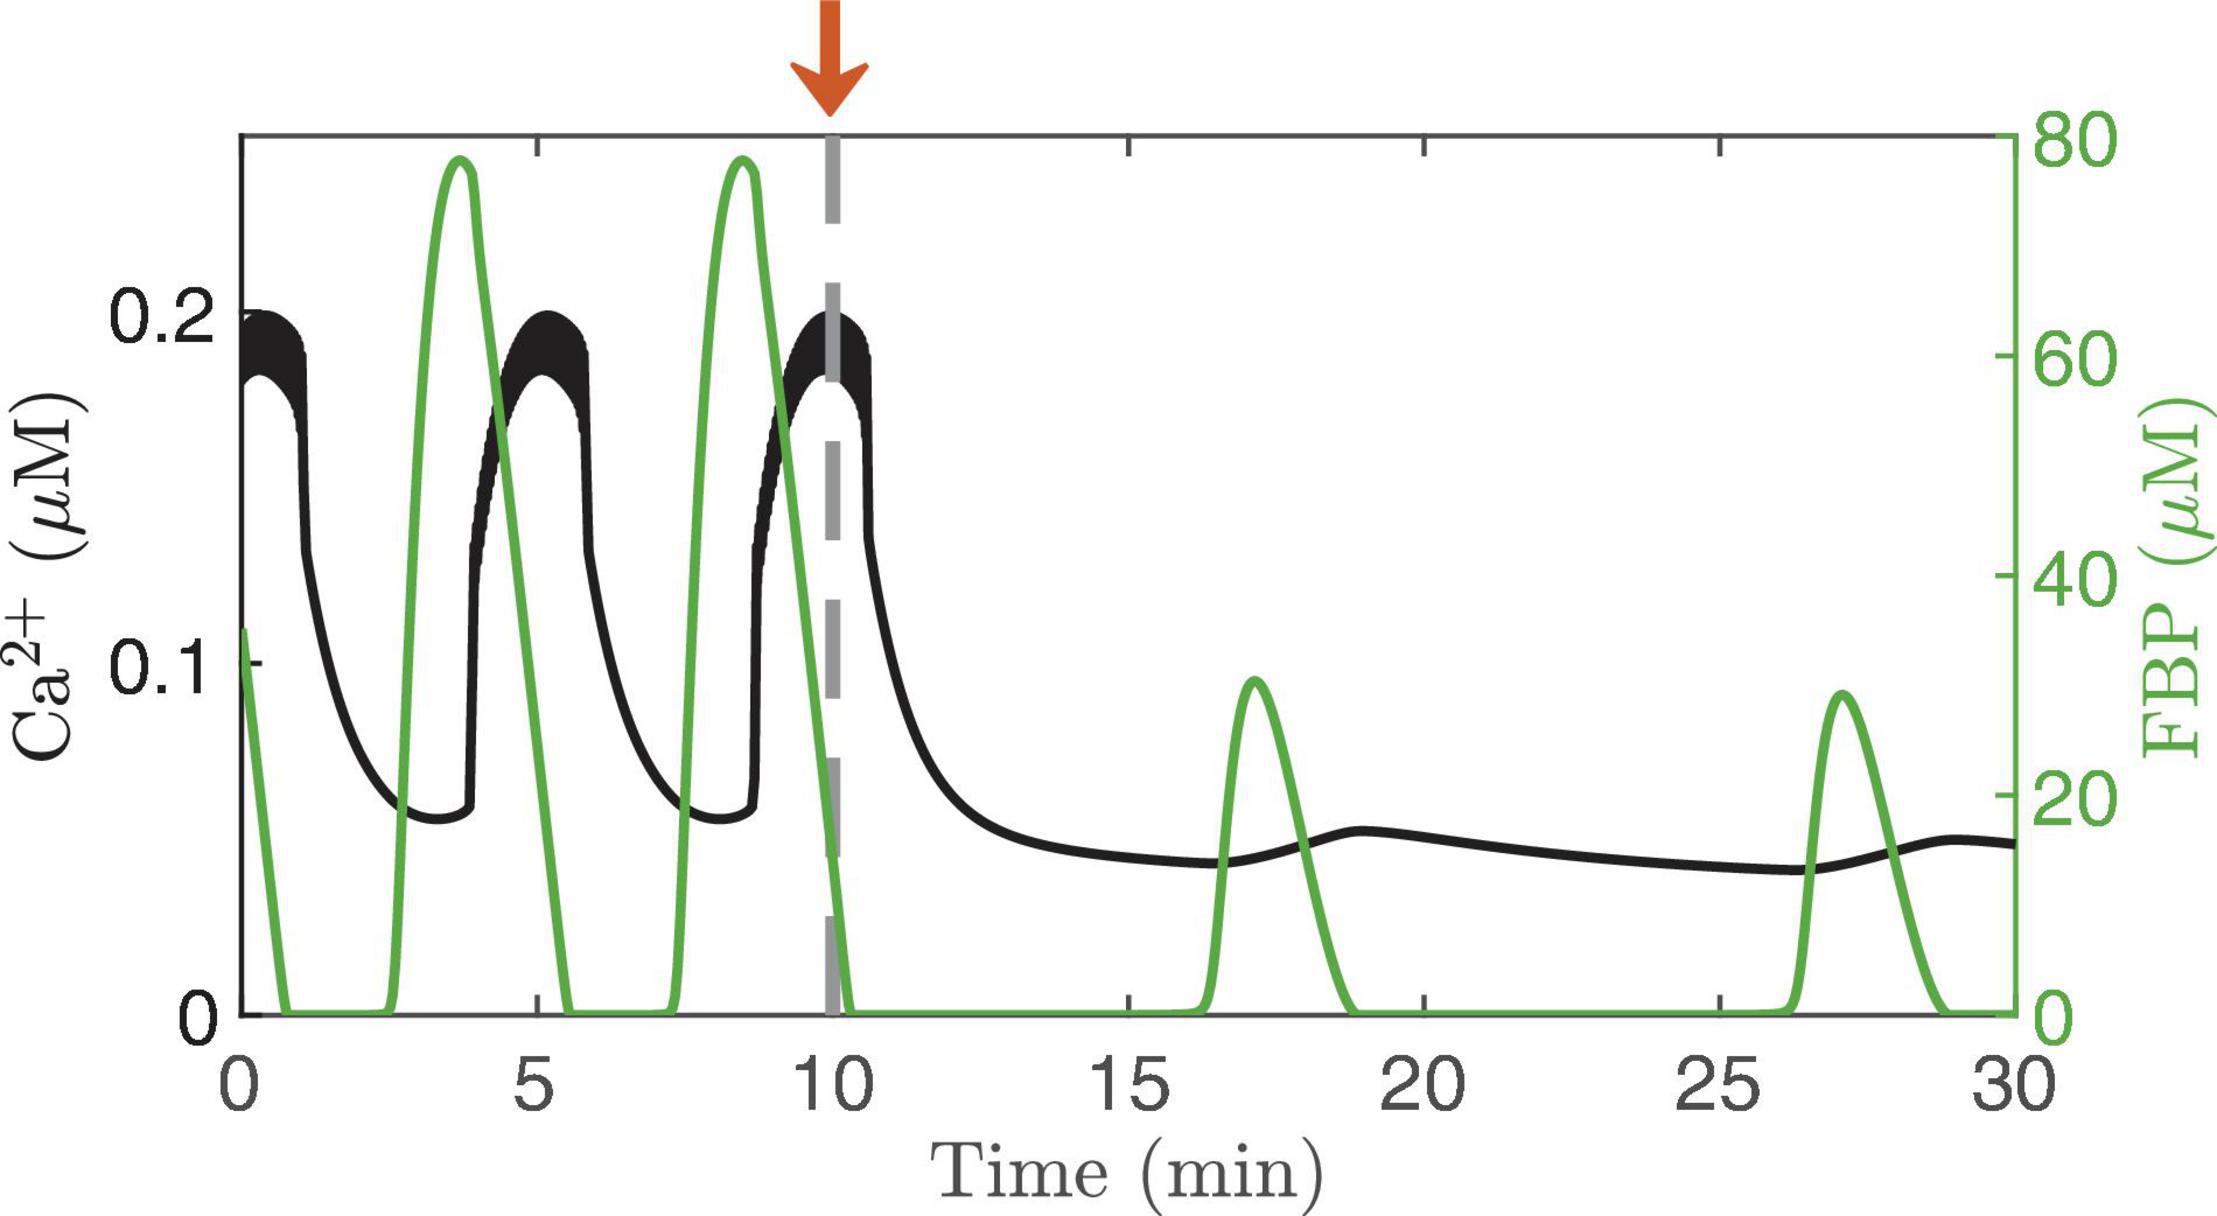
Figure 6. Ca2+ oscillations generated by the IOM, with FBP pulses superimposed. The glucose concentration is lowed from 11 to 5 mM at time t = 10 min. The electrical activity stops at the subthreshold glucose concentration, but intrinsic oscillations persist, resulting in small-amplitude Ca2+ fluctuation. For this simulation, vPDH = 2 μM/ms and gK(Ca) = 150pS.
The subthreshold Ca2+ oscillations are likely also too small to drive the oscillations that occur in basal insulin secretion (Satin et al., 2015). They are very slow, which suggests they are the product of intrinsic metabolic oscillations, and it is likely that the metabolic oscillations drive the oscillations in basal secretion. They would do this directly through increasing delivery of insulin granules to the plasma membrane and to the vicinity of the small number of Ca2+ channels that open spontaneously even when membrane potential is low. This is supported by observations in super-threshold glucose with Ca2+ clamped and glucose artificially pulsed (Ravier et al., 1999; Kjems et al., 2002). The oscillations of secretion under these conditions were only about one-tenth the size of those when Ca2+ was free to oscillate, but that would be sufficient to account for oscillations in basal secretion. When Ca2+ is free to oscillate, the metabolic oscillations synergize with Ca2+ to markedly amplify the secretory pulses, as modeled in Figure 6 of Satin et al. (2015).
Direct confirmation of metabolic oscillations in basal glucose through measurements of a metabolite such as NAD(P)H, FBP, or ATP/ADP remains to be done. This is a particularly tricky experiment since, from an analysis of the model, subthreshold AMOs do not always occur. That is, the result will likely vary from islet to islet, so that many trials might be needed to firmly establish that subthreshold AMOs occur. Indeed, this could be why subthreshold Ca2+ oscillations have so rarely been reported in the islet literature. Regardless, subthreshold glucose is an excellent condition in which to bypass the cell’s electrical activity and isolate oscillations in the metabolic subsystem.
Compound Oscillations Demonstrate the Coexistence of Intrinsic Metabolic Oscillations and Ca2+-Driven Oscillations
The observation that islets exhibit compound electrical or Ca2+ oscillations is the strongest evidence to date that β-cells have intrinsic metabolic oscillations. Compound oscillations consist of fast V bursts (or Ca2+ oscillations) that are grouped into slower episodes. This type of oscillatory pattern has been observed since the earliest reports of islet electrical activity (Henquin et al., 1982; Cook, 1983), and has been confirmed using Ca2+ imaging (Valdeolmillos et al., 1989; Bertram et al., 2004) or using simultaneous recordings of islet membrane potential and Ca2+ (Beauvois et al., 2006). The period of the burst episodes is about 5 min, corresponding closely to the period of insulin pulsatility. We have hypothesized that the fast oscillations within compound oscillations reflect the feedback of intracellular Ca2+ onto K(Ca) channels, while intrinsic slow metabolic oscillations group the fast oscillations into slower episodes (Bertram et al., 2004, 2007b). The mechanism of compound oscillations can be thought of as a combination of the first mathematical model of bursting in β-cells (Chay and Keizer, 1983) [for the fast bursts, and based on K(Ca)] with the first model in which bursting (for the slow burst episodes) relied upon intrinsic metabolic oscillations (Tornheim, 1997). Since both mechanisms are incorporated into the IOM, this model can produce compound oscillations, as shown in Figure 7. Here it can be seen that pulses of FBP (Figure 7D) lead to rises in ATP (Figure 7C) that are responsible for packaging bursts (Figure 7A) and fast Ca2+ oscillations (Figure 7B) into episodes via the activation and deactivation of K(ATP) channels. The FBP pulses in this simulation result from AMOs, and the effect of Ca2+ on the AMOs is seen only as the “teeth” in the ATP profile. The elevated Ca2+ concentration that accompanies each fast burst leads to increased ATP hydrolysis by Ca2+ ATPases (orange arrow in Figure 2), resulting in a downward deflection in the ATP trace shown. Such “teeth” have been observed for other metabolic variables and for glucose consumption during compound bursting (Jung et al., 1999; Dahlgren et al., 2005).
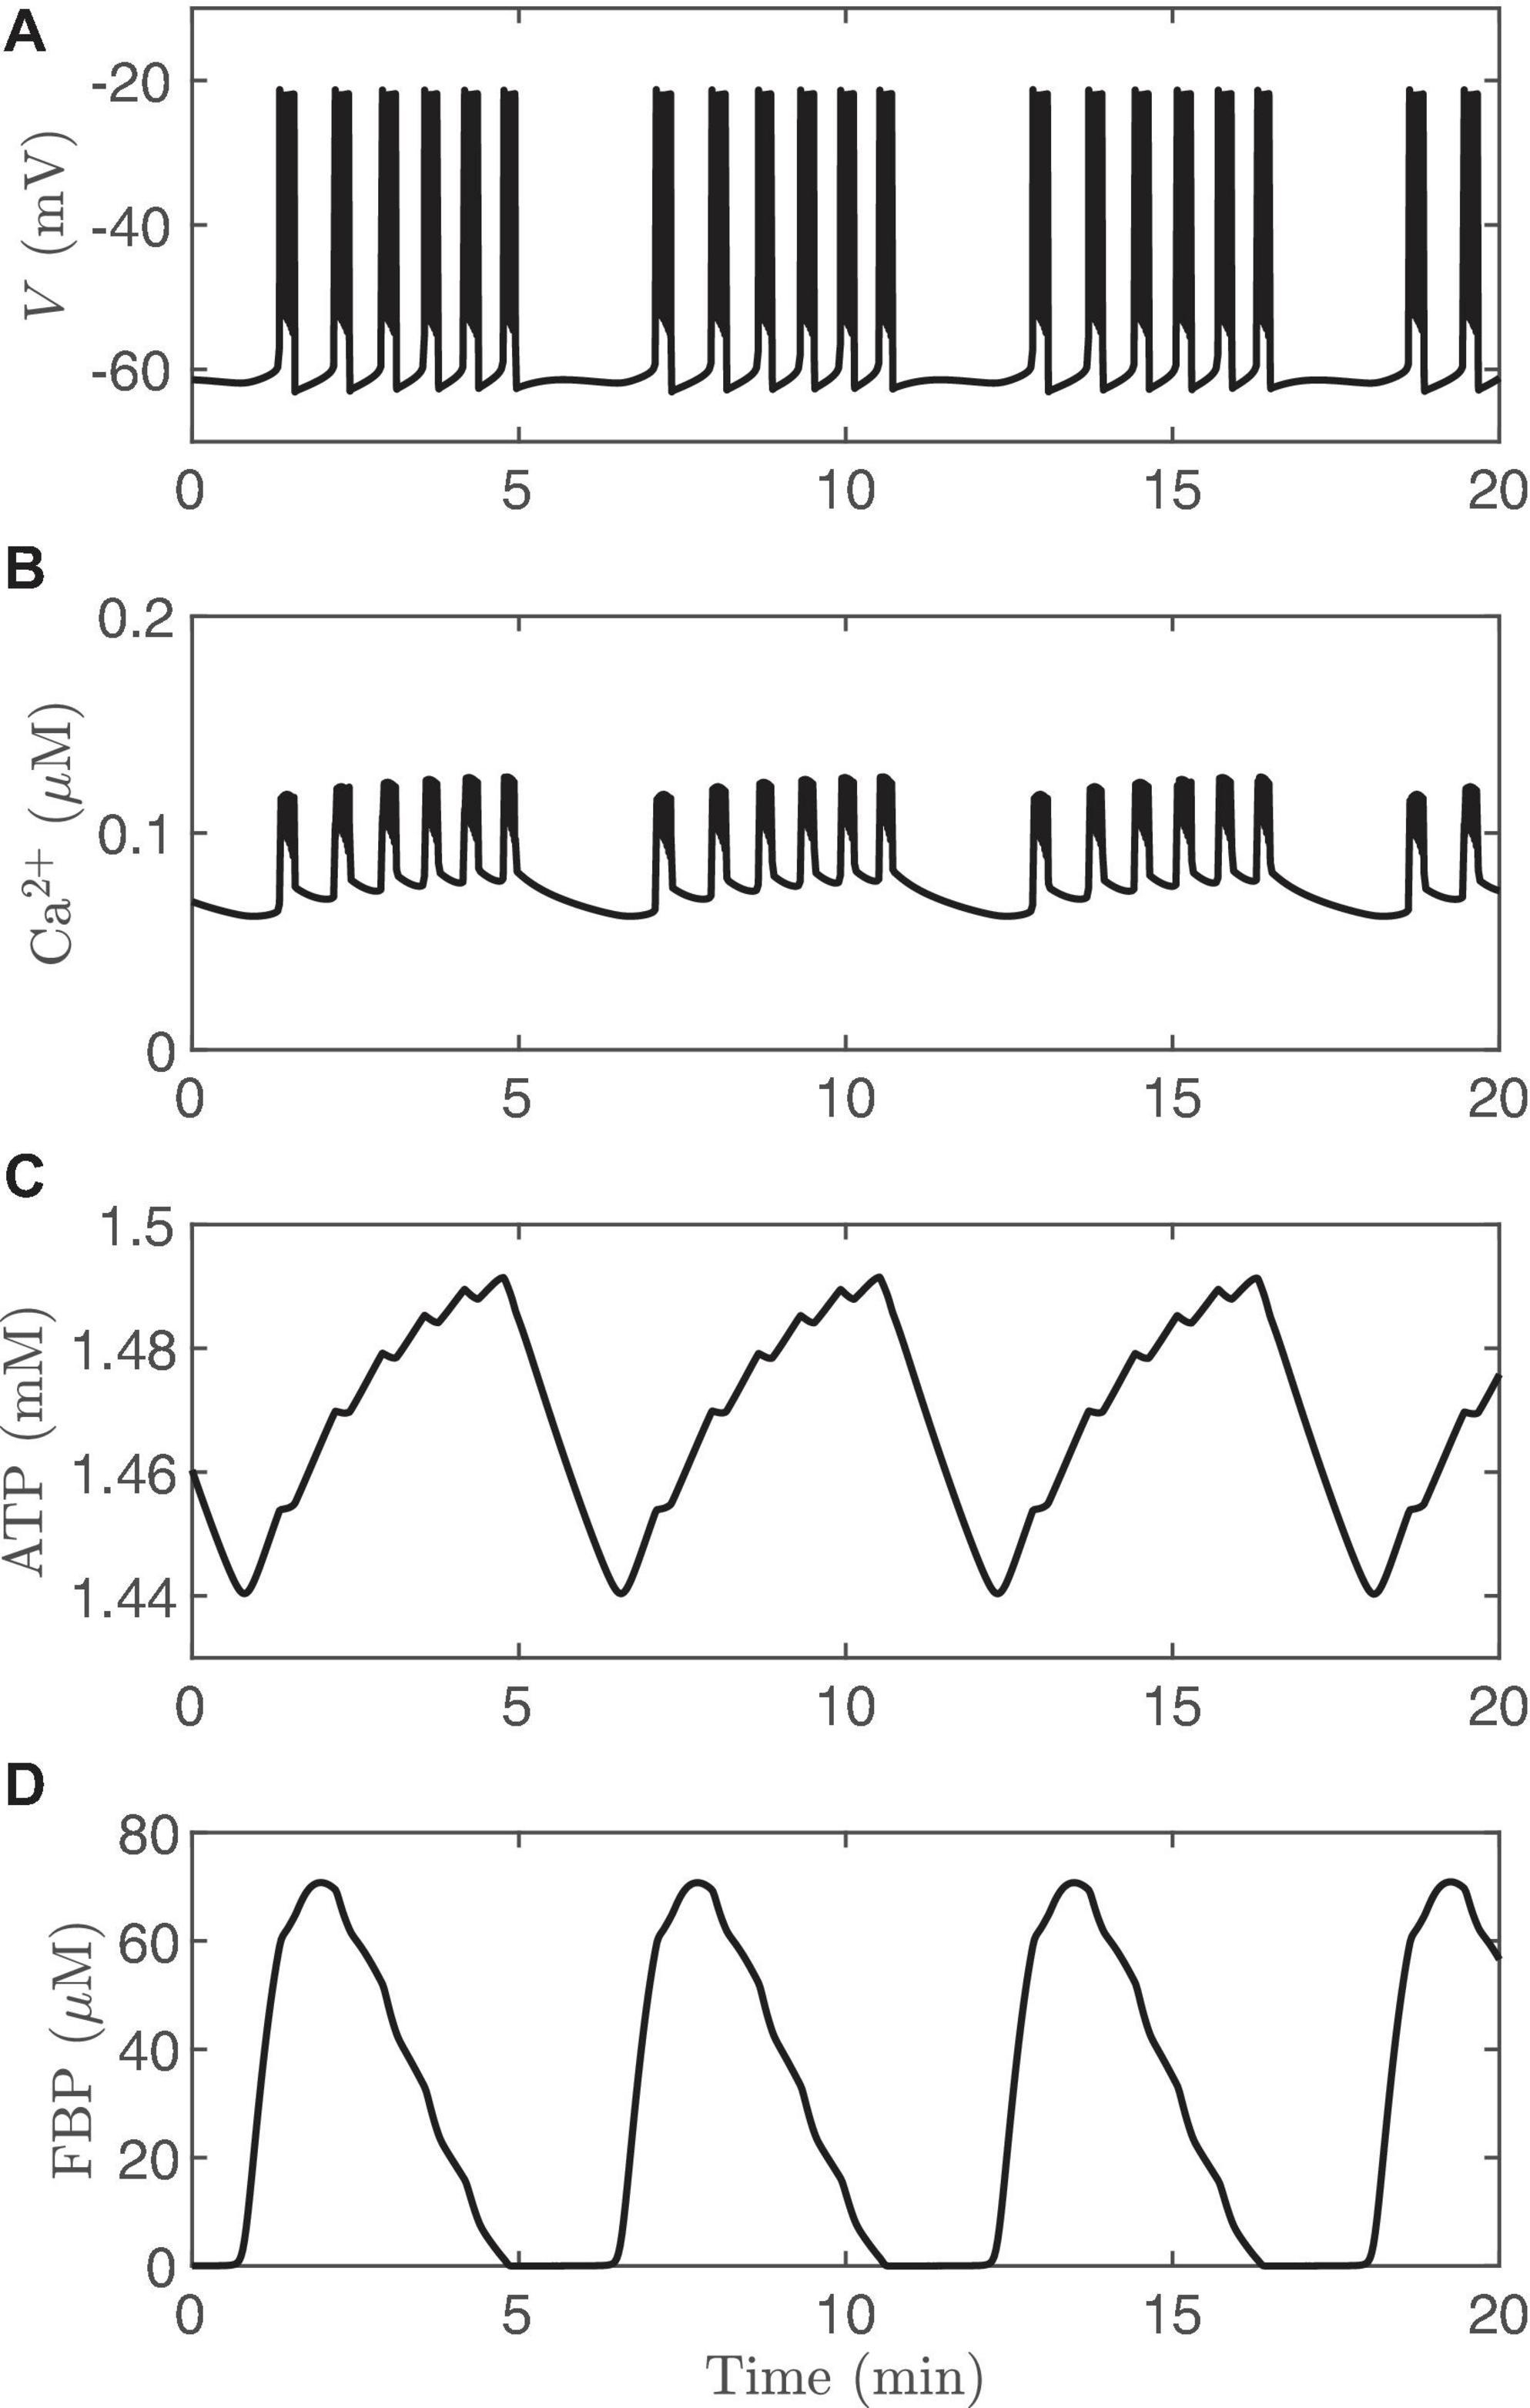
Figure 7. Compound bursting generated by the IOM, and the calcium time courses are similar (Figures 9A,B). (A) Membrane potential. (B) Cytosolic calcium. (C) ATP. (D) FBP. For this simulation, vPDH = 2 μM/ms, gK(Ca) = 600pS, and the glucose concentration in 11 mM.
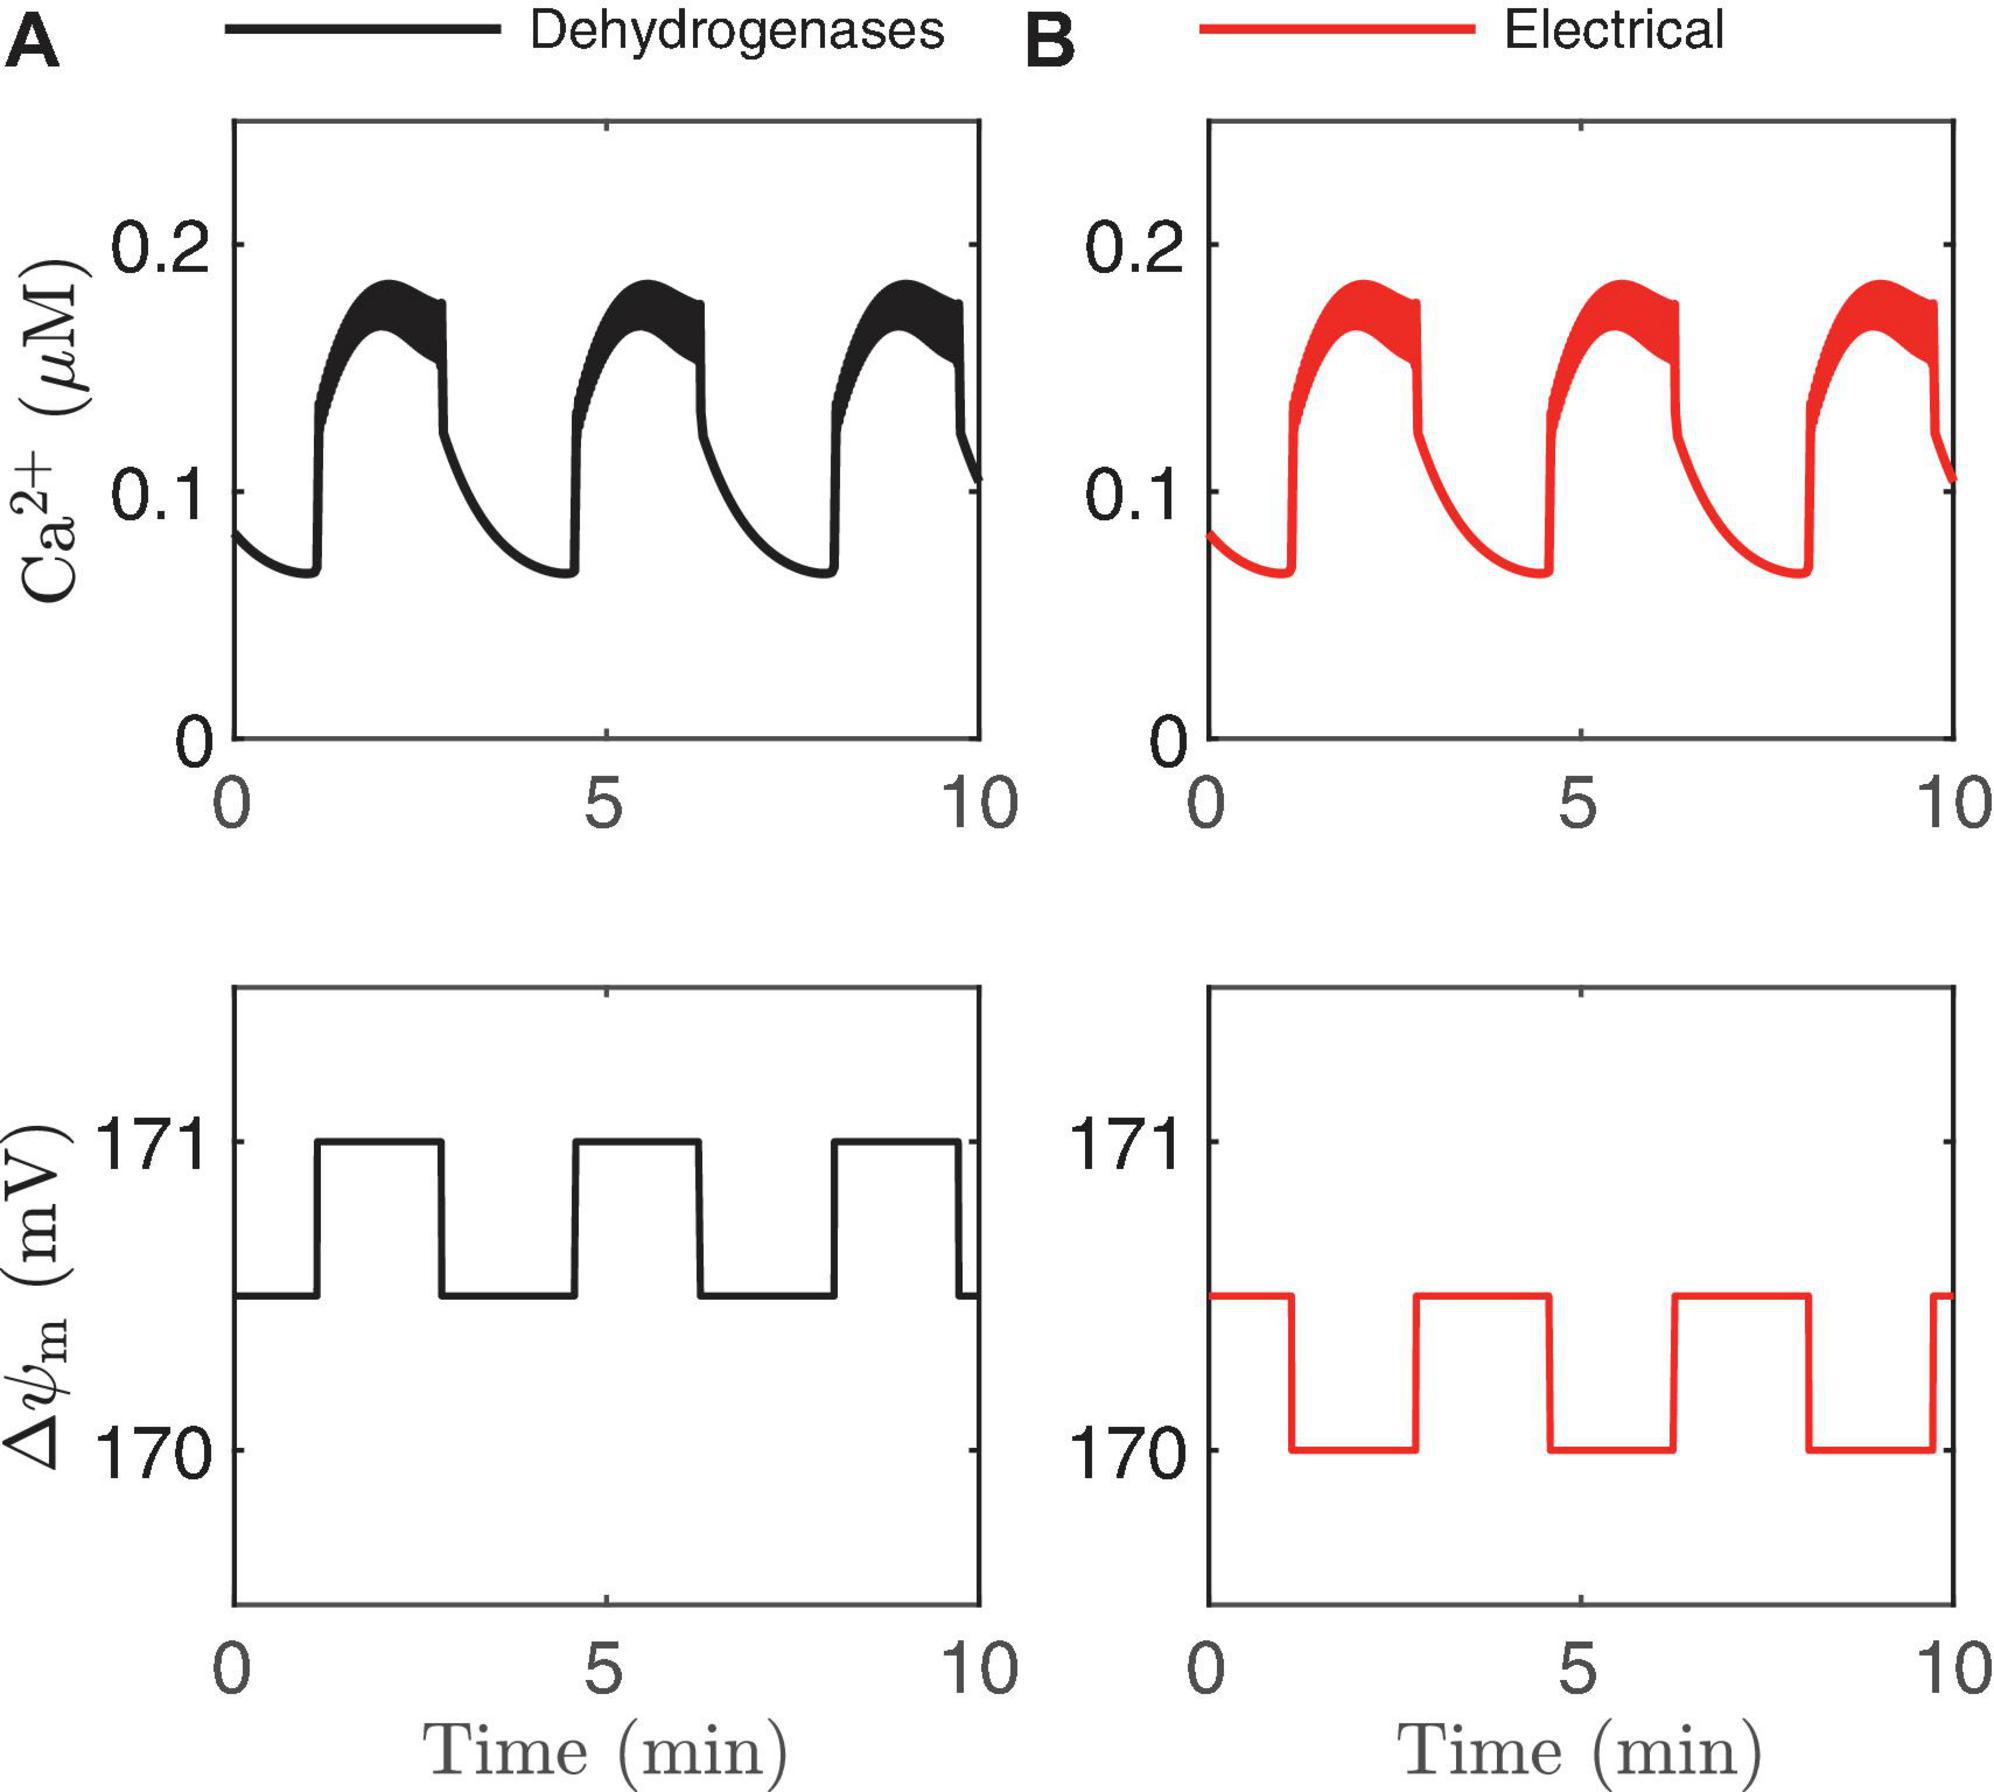
Figure 8. Schematic of experimental findings on the mitochondrial membrane potential △ψm If the dehydrogenase effects prevail, △ψm hyperpolarizes during the active phase (A), while △ψm depolarizes during the active phase if the electrical effect dominates (B).
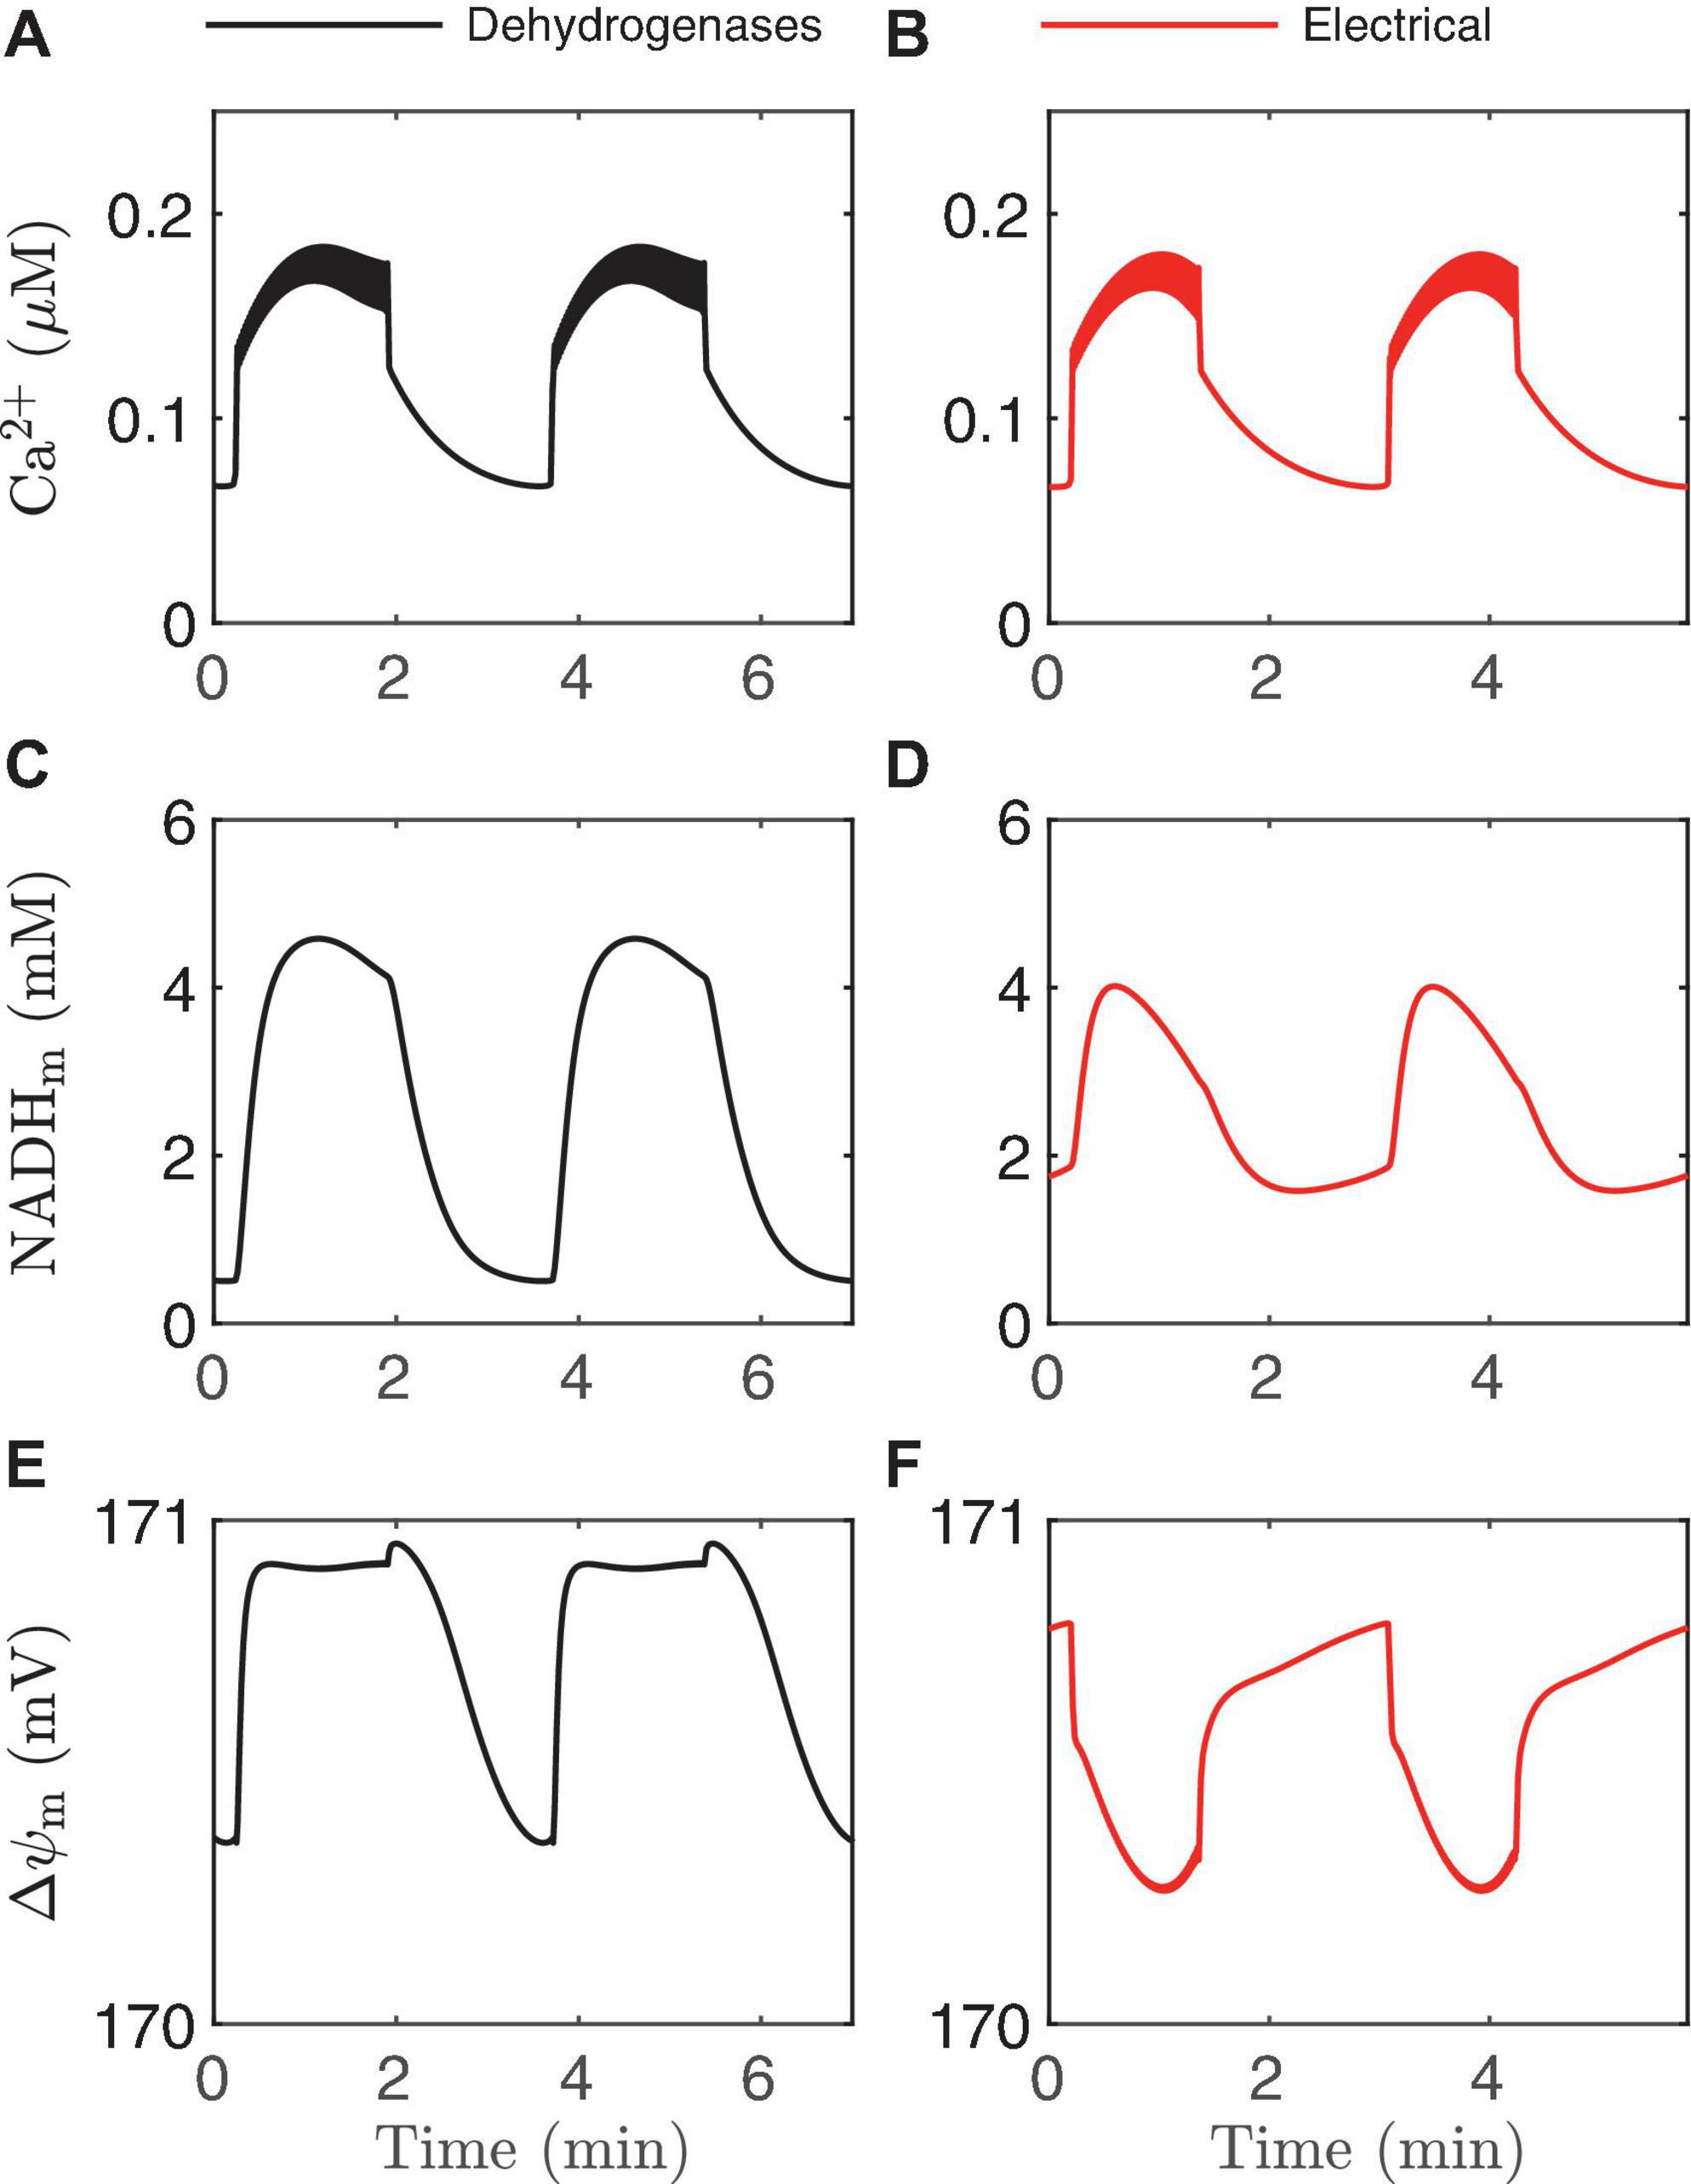
Figure 9. Time courses generated by the IOM with p21 = 0.013μM/ms (A,C,E) and 0.03μM/ms (B,D,F). In both cases, vPDH = 0.4 μM/ms, gK(Ca) = 150pS, and the glucose concentration in 11 mM. In the left panel, the effect of Ca2+ on dehydrogenases dominates, while on the right the electrical effect of Ca2+ current across the inner membrane dominates.
Although we know of no other reasonable explanation for compound bursting, we cannot rule out other possibilities. Thus, although the existence of compound oscillations is suggestive of AMOs, as both metabolism and Ca2+ are oscillating during compound bursting, disentangling the effects of one on the other experimentally is difficult. This highlights why clamping Ca2+, either pharmacologically or by using subthreshold glucose remains the best approach for unequivocally distinguishing between AMOs from PMOs experimentally.
The Model Can Be Used to Resolve Contradictory Behaviors
Models can also be useful for interpreting data from experiments post hoc. This is particularly important when the data defy straightforward explanations, or when data from different labs appear to be contradictory. As an example of this, we consider the measurements that have been made of mitochondrial inner membrane potential (△ψm) during bursting. The inner membrane potential is very important as it provides the electrochemical driving force needed for mitochondrial ATP synthesis. In one study, the measurement of △ψm using the fluorescent dye rhodamine-1,2,3 showed that △ψm depolarized during each burst active phase (Krippeit-Drews et al., 2000), decreasing mitochondrial electrochemical driving force. In a later study, measurements made using the same technique found that △ψm hyperpolarized during each active phase, increasing the electrochemical driving force (Merrins et al., 2016). How can one interpret these apparently contradictory findings? How can they both be right?
In Figure 2 we illustrated two ways that Ca2+ can influence ATP production: through the activation of Ca2+-dependent dehydrogenases which hyperpolarize △ψm, and via the direct depolarization of △ψm by the Ca2+ current flowing across the mitochondrial inner membrane through the Ca2+ uniporter. During a burst active phase, cytosolic Ca2+ concentration is elevated, and when some of this Ca2+ enters the mitochondria it will thus likely have both hyperpolarizing and depolarizing effects on △ψm. Which effect dominates will determine the direction of △ψm during each burst active phase, as illustrated in Figure 8. If the activation of dehydrogenases by Ca2+ dominates, then △ψm will hyperpolarize during the active phase (left panels, increases in △ψm indicate hyperpolarization), while if the electrical effect of the Ca2+ flux dominates, then △ψm will depolarize during the active phase (right panels).
This result is intuitive, and modeling is not needed to make the point. What is not clear, however, is what system parameter controls this competition? A key parameter that can change the effect of mitochondrial Ca2+ influx during the active phase from △ψmhyperpolarization to depolarization (Bertram et al., 2006) is p21, which appears in the term for Ca2+ uniporter flux,
where Ca2+ is the cytosolic Ca2+ concentration. In the uniporter flux function the term in parentheses is the effect of △ψm on Ca2+ influx across the mitochondrial inner membrane. The relationship is approximately linear in the relevant range of △ψm, with slope p21 and intercept p22 (Bertram et al., 2007a). For small values of p21, the electrical effect produced is small and the dehydrogenase effect will therefore dominate so that the inner membrane hyperpolarizes during the burst active phase (Figure 9E). Increasing p21increases the electrical effect, to the point where it will dominate the dehydrogenase effect. As a result, the inner membrane potential now depolarizes during each burst active phase (Figure 9F). In both cases, NADHm peaks near the beginning of the active phases (Figures 9C,D), as shown experimentally in Merrins et al. (2016). Thus, measurements of NAD(P)H fluorescence alone cannot predict the effects of Ca2+ on △ψm. In summary, islet-to-islet variation in this single parameter, p21, can account for the different findings that have been reported concerning the relationship between burst active phase and △ψm (Krippeit-Drews et al., 2000; Merrins et al., 2016). Again, this reinforces the utility of modeling in understanding and interpreting published data in the literature.
Discussion
In this perspectives article, we illustrated that there is a symbiotic relationship between the metabolic and electrical/calcium subsystems of pancreatic β-cells. What couples these systems together in a way that is different from most other cells are the K(ATP) channels, which are found in cardiac myocytes (Noma, 1983), smooth muscle cells (Hibino et al., 2010), a small population of glucose-sensing neurons in the hypothalamus (Burdakov et al., 2005), glucagon-like-peptide-1-secreting L-cells of the small intestine (Reimann and Gribble, 2002), in addition to β-cells (Ashcroft and Rorsman, 2013). While it is widely appreciated that K(ATP) channels are a key player in the transduction of blood glucose level to insulin secretion by β-cells (Ashcroft and Rorsman, 2013), their role in the generation of insulin pulsatility remains a matter of debate. Our goal in this perspectives article was to illustrate the several interacting signaling pathways that exist in β-cells and their influence on electrical bursting oscillations, oscillations in cytosolic Ca2+ concentration, and metabolism, the sum of which produces pulsatile insulin secretion.
Figure 10 summarizes these feedback loops and their contributions to slow, fast, and compound bursting oscillations. The first of these loops (loop I) describes the action of Ca2+ on ATP production and consumption through hydrolysis, dehydrogenases, and the mitochondrial Ca2+ uniporter. Oscillations in the Ca2+ concentration produce oscillations in ATP that are carried forward to the K(ATP) conductance, which in turn, influences the cell membrane potential. The loop is closed by the influence of the membrane potential on voltage-dependent Ca2+ channels, which determine the cytosolic Ca2+ concentration through Ca2+ influx. This feedback loop is responsible for slow bursting oscillations associated with PMOs in the IOM, and is represented as a large loop for the slow oscillations. While the loop is still active during fast and compound oscillations and slow oscillations with AMOs, we propose that it plays a lesser role in either, so we depict it as being small in the diagram.
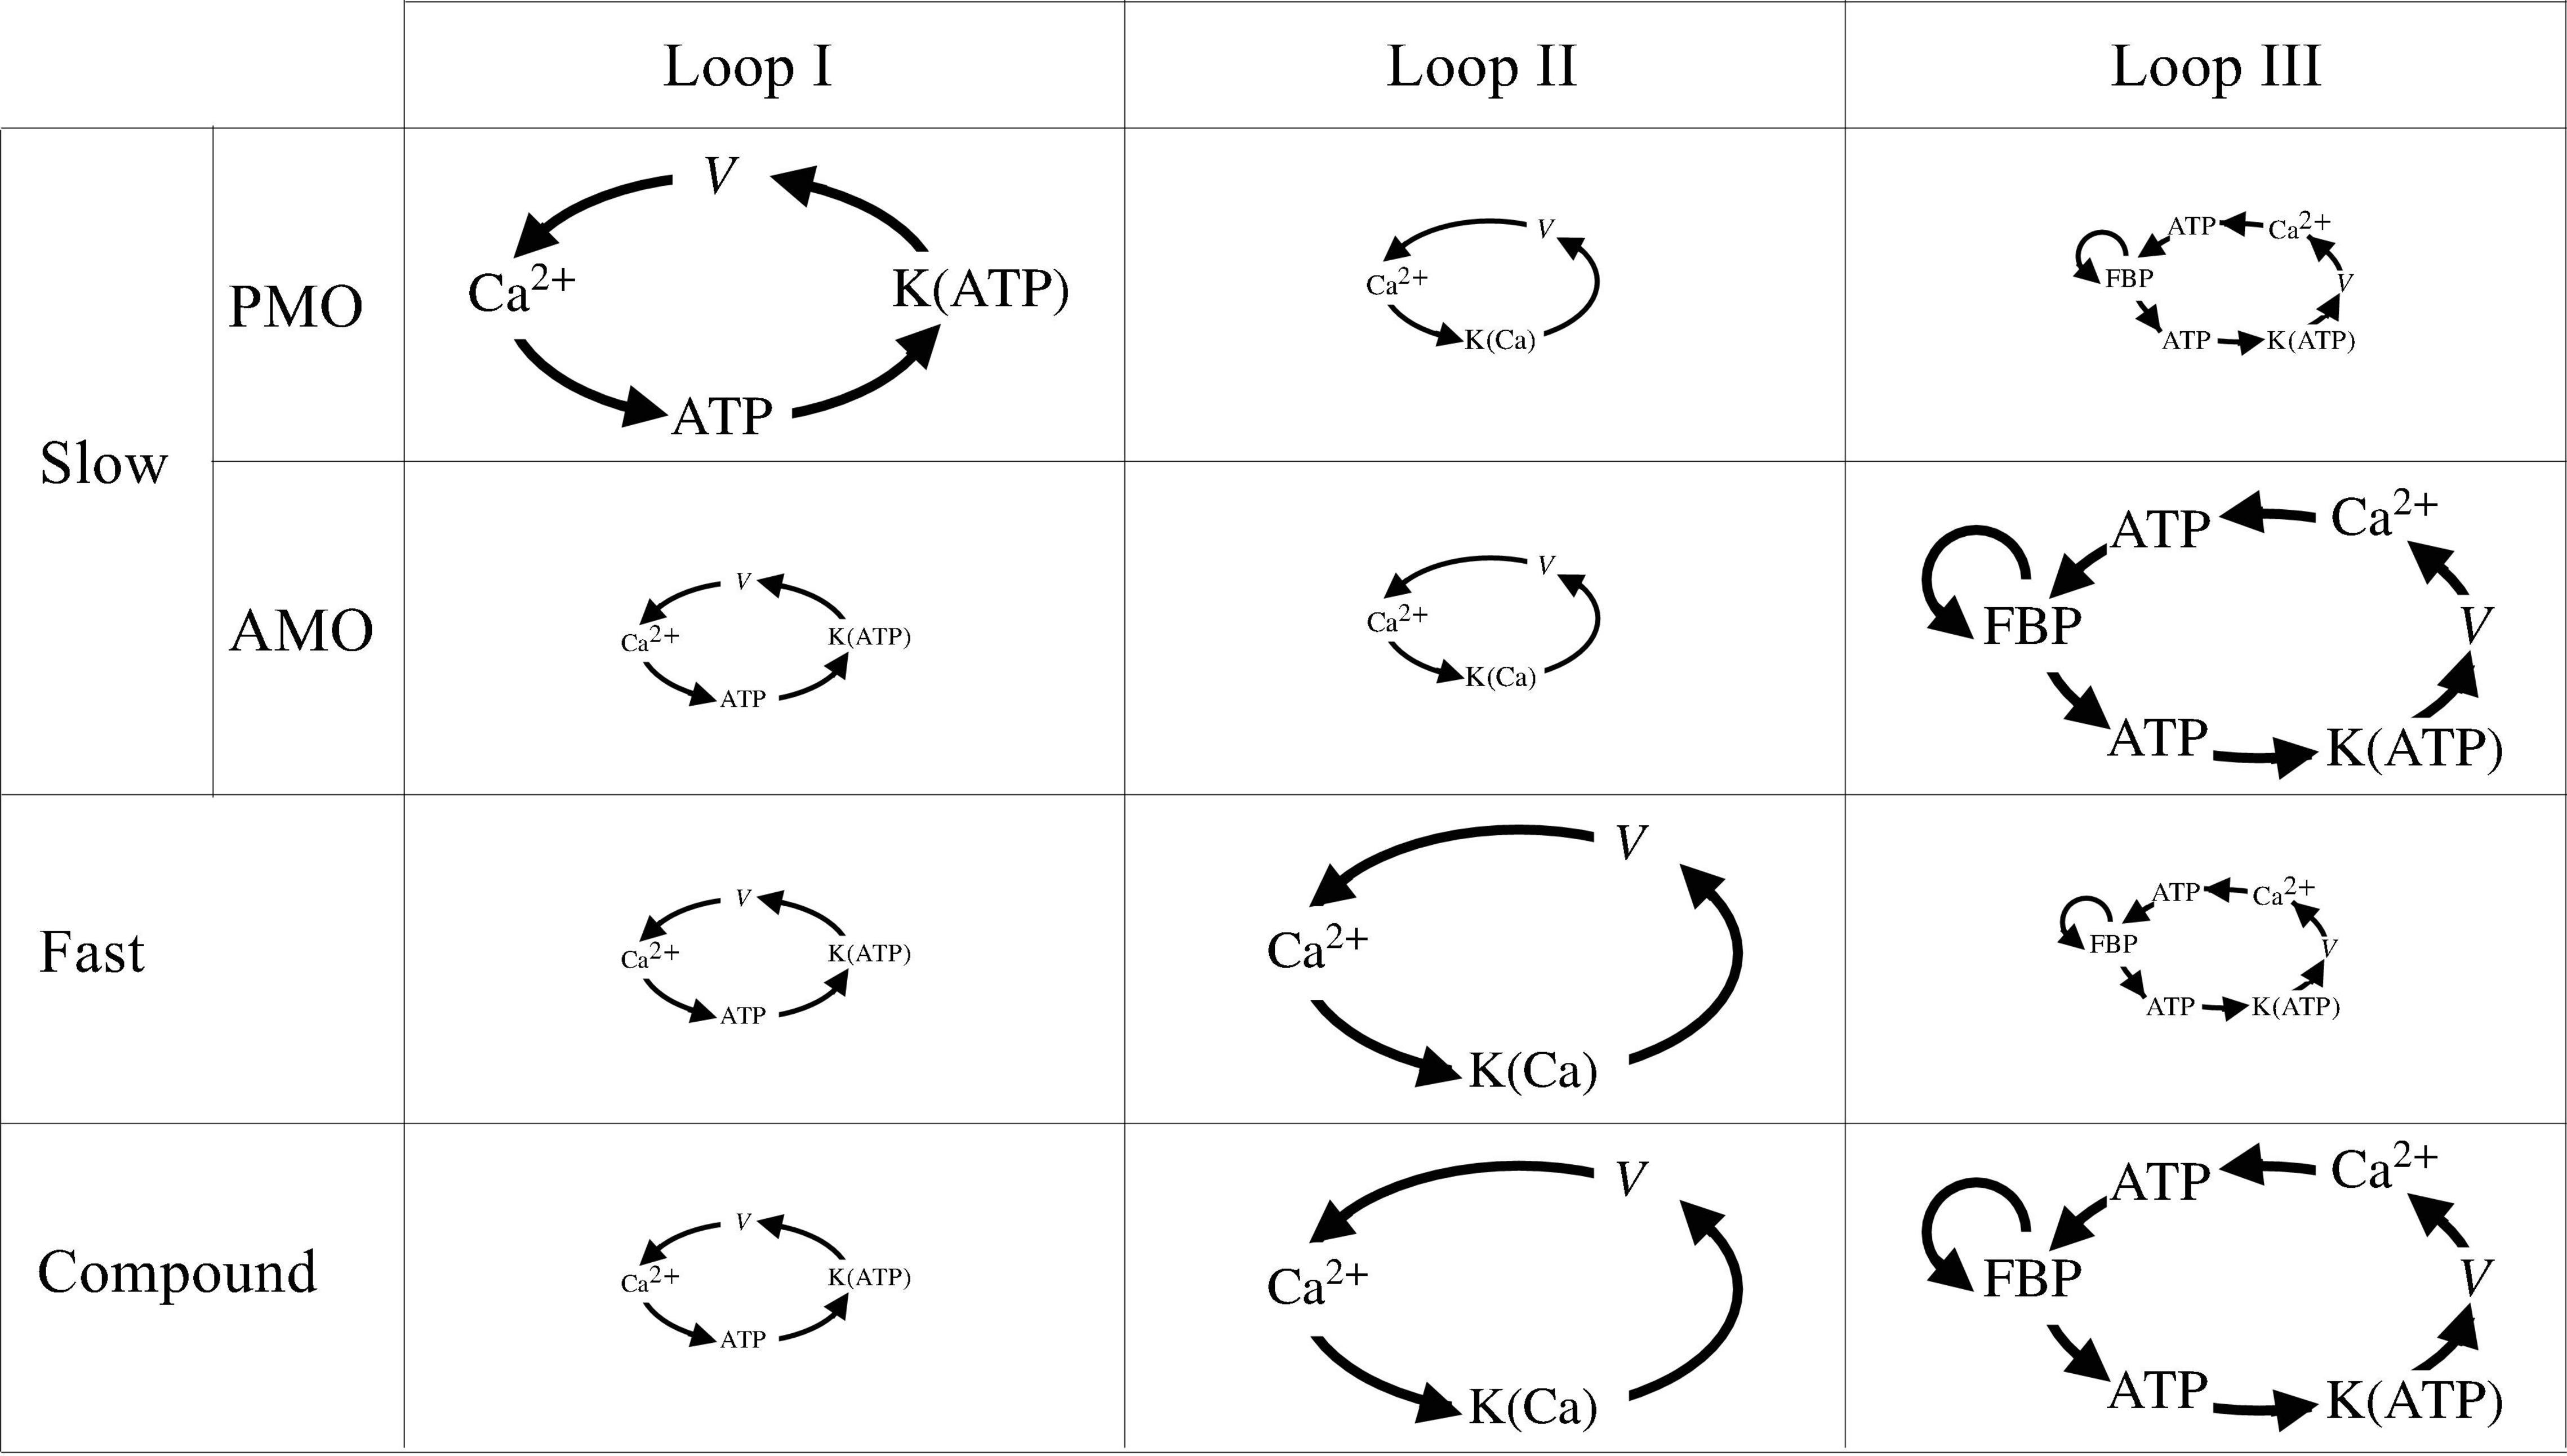
Figure 10. Schematic of the three main loops encapsulating the symbiosis between metabolism and Ca2+ activity. The size of each loop is proportional to the importance of its role played in slow, fast, and compound bursting. Note that slow bursting can be driven by two different mechanisms, loop I for PMOs or loop III for AMOs.
The second loop (loop II) describes the action of cytosolic Ca2+ on K(Ca) ion channels. Activation of these channels has a hyperpolarizing effect on the cell’s membrane potential, which in turn closes V-dependent Ca2+ channels, reducing the cytosolic Ca2+ concentration. We propose that while this loop has only a minor role to play in slow bursting, it is the main driver of fast bursting, including fast bursting that occurs during each episode of compound bursting.
The third feedback loop (loop III) describes the positive feedback effect of FBP on PFK, which produces intrinsic glycolytic oscillations (AMOs). These glycolytic oscillations result in oscillations in ATP, which affect the membrane potential again through K(ATP) channels. The electrical bursting results in Ca2+ oscillations, which affect the cell’s ATP level, which in turn affects PFK since ATP is an allosteric inhibitor of PFK (Passonneau and Lowry, 1962). Loop III has the potential to produce slow bursting with AMOs in our model, and we believe it is responsible for the slow wave underlying compound bursting as well as slow sub-threshold Ca2+ oscillations. It is unlikely to be active during fast bursting and slow bursting with PMOs, however.
It is our belief that the vast majority of observed phenomena regarding oscillations in β-cell activity in mouse islets, where most of the research on islet oscillations has been performed, can be understood from the standpoint of these three canonical feedback loops. Because all three are incorporated into the IOM, the model is a useful tool for determining the conditions that must hold to explain various phenomena. This article focused on a few specific behaviors that can be interpreted with the use of the model; some others have been the focus of prior reports (see Bertram et al., 2018 for a recent review). The success of the IOM stems from the fact that it incorporates feedback pathways that can account for the symbiotic relationships observed among the metabolic, electrical, and Ca2+ subsystems of β-cells.
Author Contributions
IM performed mathematical simulations and analysis. PF provided conceptual advice on the model. AS, LS, and RB provided resources and supervision. All authors contributed to writing the manuscript.
Funding
RB was partially supported by the NSF grant no. DMS 1853342. LS was partially supported by NIH grant no. RO1 DK46409. PF and AS were supported by the Intramural Research Program of the National Institutes of Health (NIDDK). Part of this research was performed when IM was with BCAM, the Basque Center for Applied Mathematics, Bilbao, Spain. IM acknowledges the support of the Basque Government through the BERC 2018–2021 program, and of the Spanish State Research Agency through the BCAM Severo Ochoa excellence accreditation SEV-2017-0718, and grant RTI2018-093416-B-I00 MULTIQUANT. IM acknowledges financial support from the University of Birmingham Dynamic Investment Fund.
Conflict of Interest
The authors declare that the research was conducted in the absence of any commercial or financial relationships that could be construed as a potential conflict of interest.
Publisher’s Note
All claims expressed in this article are solely those of the authors and do not necessarily represent those of their affiliated organizations, or those of the publisher, the editors and the reviewers. Any product that may be evaluated in this article, or claim that may be made by its manufacturer, is not guaranteed or endorsed by the publisher.
References
Ashcroft, F. M., Harrison, D. E., and Ashcroft, S. J. H. (1984). Glucose induces closure of single potassium channels in isolated rat pancreatic β-cells. Nature 312, 446–448. doi: 10.1038/312446a0
Ashcroft, F. M., and Rorsman, P. (2013). KATP channels and islet hormone secretion: new insights and controversies. Nat. Rev. Endocrinol. 9, 660–669. doi: 10.1038/nrendo.2013.166
Beauvois, M. C., Merezak, C., Jonas, J.-C., Ravier, M. A., Henquin, J.-C., and Gilon, P. (2006). Glucose-induced mixed [Ca2 + ]c oscillations in mouse β-cells are controlled by the membrane potential and the SERCA3 Ca2 + -ATPase of the endoplasmic reticulum. Am. J. Physiol. 290, C1503–C1511. doi: 10.1152/ajpcell.00400.2005
Benninger, R. K., Head, W. S., Zhang, M., Satin, L. S., and Piston, D. W. (2011). Gap junctions and other mechanisms of cell-cell communication regulate basal insulin secretion in the pancreatic islet. J. Physiol. 589, 5453–5466. doi: 10.1113/jphysiol.2011.218909
Benninger, R. K. P., and Hodson, D. J. (2018). New understanding of β-cell heterogeneity and in situ islet function. Diabetes 67, 537–547. doi: 10.2337/dbi17-0040
Bertram, R., Pedersen, M. G., Luciani, D. S., and Sherman, A. (2006). A simplified model for mitochondrial ATP production. J. Theor. Biol. 243, 575–586. doi: 10.1016/j.jtbi.2006.07.019
Bertram, R., Satin, L. S., Pedersen, M. G., Luciani, D. S., and Sherman, A. (2007a). Interaction of glycolysis and mitochondrial respiration in metabolic oscillations of pancreatic islets. Biophys. J. 92, 1544–1555. doi: 10.1529/biophysj.106.097154
Bertram, R., Sherman, A., and Satin, L. S. (2007b). Metabolic and electrical oscillations: partners in controlling pulsatile insulin secretion. Am. J. Physiol. 293, E890–E900. doi: 10.1152/ajpendo.00359.2007
Bertram, R., Satin, L. S., and Sherman, A. S. (2018). Closing in on the mechanisms of pulsatile insulin secretion. Diabetes 67, 351–359. doi: 10.2337/dbi17-0004
Bertram, R., Satin, L. S., Zhang, M., Smolen, P., and Sherman, A. (2004). Calcium and glycolysis mediate multiple bursting modes in pancreatic islets. Biophys. J. 87, 3074–3087. doi: 10.1529/biophysj.104.049262
Burdakov, D., Luckman, S. M., and Verkhratsky, A. (2005). Glucose-sensing neurons of the hypothalamus. Philos. Trans. R. Soc. Lond. B Biol. Sci. 360, 2227–2235. doi: 10.1098/rstb.2005.1763
Cappon, G., and Pedersen, M. G. (2016). Heterogeneity and nearest-neighbor coupling can explain small-worldness and wave properties in pancreatic islets. Chaos 26:053103. doi: 10.1063/1.4949020
Cha, C. Y., Nakamura, Y., Himeno, Y., Wang, J. W., Fujimoto, S., Inagaki, N., et al. (2011). Ionic mechanisms and Ca2 + dynamics underlying the glucose response of pancreatic β cells: a simulation study. J. Gen. Physiol. 138, 21–37. doi: 10.1085/jgp.201110611
Chay, T. R., and Keizer, J. (1983). Minimal model for membrane oscillations in the pancreatic β-cell. Biophys. J. 42, 181–190.
Cook, D. L. (1983). Isolated islets of Langerhans have slow oscillations of electrical-activity. Metab. Clin. Exp. 32, 681–685. doi: 10.1016/0026-0495(83)90124-5
Cook, D. L., and Hales, N. (1984). Intracellular ATP directly blocks K+ channels in pancreatic B-cells. Nature 311, 271–273. doi: 10.1038/311271a0
Dahlgren, G., Kauri, L., and Kennedy, R. T. (2005). Substrate effects on oscillations in metabolism, calcium and secretion in single mouse islets of Langerhans. Biochim. Biophys. Acta 1724, 23–36. doi: 10.1016/j.bbagen.2005.04.007
De Stefani, D., Patron, M., and Rizzuto, R. (2015). Structure and function of the mitochondrial calcium uniporter complex. Biochim. Biophys. Acta 1853, 2006–2011. doi: 10.1016/j.bbamcr.2015.04.008
Denton, R. M. (2009). Regulation of mitochondrial dehydrogenases by calcium ions. Biochim. Biophys. Acta 1787, 1309–1316. doi: 10.1016/j.bbabio.2009.01.005
Detimary, P., Gilon, P., and Henquin, J. C. (1998). Interplay between cytoplasmic Ca2 + and the ATP/ADP ratio: a feedback control mechanism in mouse pancreatic islets. Biochem. J. 333, 269–274. doi: 10.1042/bj3330269
Diederichs, F. (2006). Mathematical simulation of membrane processes and metabolic fluxes of the pancreatic β-cell. Bull. Math. Biol. 68, 1779–1818. doi: 10.1007/s11538-005-9053-9
Dwulet, J. M., Ludin, N. W. F., Piscopio, R. A., Schleicher, W. E., Moua, O., Westacott, M. J., et al. (2019). How heterogeneity in glucokinase and gap-junction coupling determines the islet [Ca2 + ] response. Biophys. J. 117, 2188–2203. doi: 10.1016/j.bpj.2019.10.037
Fridlyand, L. E., Ma, L., and Philipson, L. H. (2005). Adenine nucleotide regulation in pancreatic β-cells: modeling of ATP/ADP-Ca2 + interactions. Am. J. Physiol. Endocrinol. Metab. 289, E839–E848. doi: 10.1152/ajpendo.00595.2004
Gembal, M., Gilon, P., and Henquin, J. C. (1992). Evidence that glucose can control insulin release independently from its action on ATP-sensitive K+ channels in mouse b cells. J. Clin. Invest. 89, 1288–1295. doi: 10.1172/JCI115714
Henquin, J. C. (1988). ATP-sensitive K+ channels may control glucose-induced electrical activity in pancreatic B-cells. Biochem. Biophys. Res. Commun. 156, 769–775. doi: 10.1016/s0006-291x(88)80910-0
Henquin, J. C., and Meissner, H. P. (1984). Significance of ionic fluxes and changes in membrane potential for stimulus-secretion coupling in pancreatic B-cells. Experientia 40, 1043–1052. doi: 10.1007/BF01971450
Henquin, J. C., Meissner, H. P., and Schmeer, W. (1982). Cyclic variations of glucose-induced electrical-activity in pancreatic B-cells. Pflugers Arch. 393, 322–327.
Hibino, H., Inanobe, A., Furutani, K., Murakami, S., Findlay, I., and Kurachi, Y. (2010). Inwardly rectifying potassium channels: their structure, function, and physiological roles. Physiol. Rev. 90, 291–366. doi: 10.1152/physrev.00021.2009
Joglekar, M. V., Dong, C. X., Wong, W. K. M., Dalgaard, L. T., and Hardikar, A. A. (2021). A bird’s eye view of the dynamics of pancreatic β-cell heterogeneity. Acta Physiol. (Oxf) 233, e13664. doi: 10.1111/apha.13664
Jung, S. K., Aspinwall, C. A., and Kennedy, R. T. (1999). Detection of multiple patterns of oscillatory oxygen consumption in single mouse islets of Langerhans. Biochem. Biophys. Res. Commun. 259, 331–335. doi: 10.1006/bbrc.1999.0784
Keizer, J., and Magnus, G. (1989). ATP-sensitive potassium channel and bursting in the pancreatic beta cell. A theoretical study. Biophys. J. 56, 229–242.
Keizer, J., and Smolen, P. (1991). Bursting electrical-activity in pancreatic β-cells caused by Ca2 + -inactivated and voltage-inactivated Ca2 + channels. Proc. Natl. Acad. Sci. U. S. A. 88, 3897–3901. doi: 10.1073/pnas.88.9.3897
Kennedy, R. T., Kauri, L. M., Dahlgren, G. M., and Jung, S. K. (2002). Metabolic oscillations in β-cells. Diabetes 51, S152–S161.
Kjems, L. L., Ravier, M. A., Jonas, J. C., and Henquin, J. C. (2002). Do oscillations of insulin secretion occur in the absence of cytoplasmic Ca2 + oscillations in β-cells? Diabetes 51, S177–S182. doi: 10.2337/diabetes.51.2007.s177
Komjati, M., Bratusch-Marrain, P., and Waldhausl, W. (1986). Superior efficacy of pulsatile versus continuous hormone exposure on hepatic glucose production in vitro. Endocrinology 118, 312–319. doi: 10.1210/endo-118-1-312
Krippeit-Drews, P., Dufer, M., and Drews, G. (2000). Parallel oscillations of intracellular calcium activity and mitochondrial membrane potential in mouse pancreatic B-cells. Biochem. Biophys. Res. Commun. 267, 179–183. doi: 10.1006/bbrc.1999.1921
Laurenti, M. C., Dalla Man, C., Varghese, R. T., Andrews, J. C., Rizza, R. A., Matveyenko, A., et al. (2020). Diabetes-associated genetic variation in TCF7L2 alters pulsatile insulin secretion in humans. JCI Insight 5:e136136. doi: 10.1172/jci.insight.136136
Laurenti, M. C., Matveyenko, A., and Vella, A. (2021). Measurement of pulsatile insulin secretion: rationale and methodology. Metabolites 11:409. doi: 10.3390/metabo11070409
Li, J., Shuai, H. Y., Gylfe, E., and Tengholm, A. (2013). Oscillations of sub-membrane ATP in glucose-stimulated β cells depend on negative feedback from Ca2 +. Diabetologia 56, 1577–1586. doi: 10.1007/s00125-013-2894-0
Lin, J. M., Fabregat, M. E., Gomis, R., and Bergsten, P. (2002). Pulsatile insulin release from islets isolated from three subjects with type 2 diabetes. Diabetes 51, 988–993. doi: 10.2337/diabetes.51.4.988
Luciani, D. S., Misler, S., and Polonsky, K. S. (2006). Ca2 + controls slow NAD(P)H oscillations in glucose-stimulated mouse pancreatic islets. J. Physiol. 572, 379–392. doi: 10.1113/jphysiol.2005.101766
Magnus, G., and Keizer, J. (1998). Model of β-cell mitochondrial calcium handling and electrical activity. II. Mitochondrial variables. Am. J. Physiol. 274, C1174–C1184. doi: 10.1152/ajpcell.1998.274.4.C1174
Marchetti, P., Scharp, D. W., McLear, M., Gingerich, R., Finke, E., Olack, B., et al. (1994). Pulsatile insulin secretion from isolated human pancreatic islets. Diabetes 43, 827–830.
Marinelli, I., Vo, T., Gerardo-Giorda, L., and Bertram, R. (2018). Transitions between bursting modes in the integrated oscillator model for pancreatic β-cells. J. Theor. Biol. 454, 310–319. doi: 10.1016/j.jtbi.2018.06.017
Martin, F., and Soria, B. (1996). Glucose-induced [Ca2 + ]i oscillations in single human pancreatic islets. Cell Calcium 20, 409–414. doi: 10.1016/s0143-4160(96)90003-2
Matveyenko, A. V., Liuwantara, D., Gurlo, T., Kirakossian, D., Dalla Man, C., Cobelli, C., et al. (2012). Pulsatile portal vein insulin delivery enhances hepatic insulin action and signaling. Diabetes 61, 2269–2279. doi: 10.2337/db11-1462
McKenna, J. P., Ha, J., Merrins, M. J., Satin, L. S., Sherman, A., and Bertram, R. (2016). Ca2 + effects on ATP production and consumption have regulatory roles on oscillatory islet activity. Biophys. J. 110, 733–742. doi: 10.1016/j.bpj.2015.11.3526
Meissner, H. P. (1976). Electrophysiological evidence for coupling between β cells of pancreatic islets. Nature 262, 502–504. doi: 10.1038/262502a0
Merrins, M. J., Fendler, B., Zhang, M., Sherman, A., Bertram, R., and Satin, L. S. (2010). Metabolic oscillations in pancreatic islets depend on the intracellular Ca2 + level but not Ca2 + oscillations. Biophys. J. 99, 76–84. doi: 10.1016/j.bpj.2010.04.012
Merrins, M. J., Poudel, C., McKenna, J. P., Ha, J., Sherman, A., Bertram, R., et al. (2016). Phase analysis of metabolic oscillations and membrane potential in pancreatic islet β cells. Biophys. J. 110, 691–699. doi: 10.1016/j.bbrc.2013.03.084
Merrins, M. J., Van Dyke, A. R., Mapp, A. K., Rizzo, M. A., and Satin, L. S. (2013). Direct measurements of oscillatory glycolysis in pancreatic islet β-cells using novel FRET biosensors for pyruvate kinase M2 activity. J. Biol. Chem. 288, 33312–33322. doi: 10.1074/jbc.M113.508127
Misun, P. M., Yesildag, B., Forschler, F., Neelakandhan, A., Rousset, N., Biernath, A., et al. (2020). In vitro platform for studying human insulin release dynamics of single pancreatic islet microtissues at high resolution. Adv. Biosyst. 4:e1900291. doi: 10.1002/adbi.201900291
Nasteska, D., and Hodson, D. J. (2018). The role of β cell heterogeneity in islet function and insulin release. J. Mol. Endocrinol. 61, R43–R60.
Nunemaker, C. S., Bertram, R., Sherman, A., Tsaneva-Atanasova, K., Daniel, C. R., and Satin, L. S. (2006). Glucose modulates [Ca2 + ]i oscillations in pancreatic islets via ionic and glycolytic mechanisms. Biophys. J. 91, 2082–2096. doi: 10.1529/biophysj.106.087296
Nunemaker, C. S., Zhang, M., Wasserman, D. H., McGuinness, O. P., Powers, A. C., Bertram, R., et al. (2005). Individual mice can be distinguished by the period of their islet calcium oscillations: is there an intrinsic islet period that is imprinted in vivo? Diabetes 54, 3517–3522. doi: 10.2337/diabetes.54.12.3517
Paolisso, G., Scheen, A. J., Giugliano, D., Sgambato, S., Albert, A., Varricchio, M., et al. (1991). Pulsatile insulin delivery has greater metabolic effects than continuous hormone administration in man: importance of pulse frequency. J. Clin. Endocrinol. Metab. 72, 607–615. doi: 10.1210/jcem-72-3-607
Passonneau, J. V., and Lowry, O. H. (1962). Phosphofructokinase and the Pasteur effect. Biochem. Biophys. Res. Commun. 7, 10–15.
Ravier, M. A., Gilon, P., and Henquin, J. C. (1999). Oscillations of insulin secretion can be triggered by imposed oscillations of cytoplasmic Ca2+ or metabolism in normal mouse islets. Diabetes 48, 2374–2382. doi: 10.2337/diabetes.48.12.2374
Ravier, M. A., Guldenagel, M., Charollais, A., Gjinovci, A., Caille, D., Sohl, G., et al. (2005). Loss of connexin36 channels alters β-cell coupling, islet synchronization of glucose-induced Ca2 + and insulin oscillations, and basal insulin release. Diabetes 54, 1798–1807. doi: 10.2337/diabetes.54.6.1798
Reimann, F., and Gribble, F. M. (2002). Glucose-sensing in glucagon-like-peptide-1-secreting cells. Diabetes 51, 2757–2763. doi: 10.2337/diabetes.51.9.2757
Riz, M., Braun, M., and Pedersen, M. G. (2014). Mathematical modeling of heterogeneous electrophysiological responses in human β-cells. PLoS Comput. Biol. 10:e1003389. doi: 10.1371/journal.pcbi.1003389
Rorsman, P., and Ashcroft, F. M. (2018). Pancreatic β-cell electrical activity and insulin secretion: of mice and men. Physiol. Rev. 98, 117–214. doi: 10.1152/physrev.00008.2017
Satin, L. S., Butler, P. C., Ha, J., and Sherman, A. S. (2015). Pulsatile insulin secretion, impaired glucose tolerance and type 2 diabetes. Mol. Aspects Med. 42, 61–77. doi: 10.1016/j.mam.2015.01.003
Scarl, R. T., Corbin, K. L., Vann, N. W., Smith, H. M., Satin, L. S., Sherman, A., et al. (2019). Intact pancreatic islets and dispersed beta-cells both generate intracellular calcium oscillations but differ in their responsiveness to glucose. Cell Calcium 83:102081. doi: 10.1016/j.ceca.2019.102081
Shukla, N., Kadam, S., Padinhateeri, R., and Kolthur-Seetharam, U. (2021). Continuous variable responses and signal gating form kinetic bases for pulsatile insulin signaling and emergence of resistance. Proc. Natl. Acad. Sci. U. S. A. 118:e2102560118. doi: 10.1073/pnas.2102560118
Smolen, P. (1995). A model for glycolytic oscillations based on skeletal muscle phosphofructokinase kinetics. J. Theor. Biol. 174, 137–148. doi: 10.1006/jtbi.1995.0087
Smolen, P., and Keizer, J. (1992). Slow voltage inactivation of Ca2 + currents and bursting mechanisms for the mouse pancreatic beta-cell. J. Membrane Biol. 127, 9–19. doi: 10.1007/BF00232754
Stozer, A., Markovic, R., Dolensek, J., Perc, M., Marhl, M., Slak Rupnik, M., et al. (2019). Heterogeneity and delayed activation as hallmarks of self-organization and criticality in excitable tissue. Front. Physiol. 10:869. doi: 10.3389/fphys.2019.00869
Tornheim, K. (1997). Are metabolic oscillations responsible for normal oscillatory secretion? Diabetes 46, 1375–1380.
Tornheim, K., and Lowenstein, J. M. (1974). The purine nucleotide cycle. IV. Interactions with oscillations of the glycolytic pathway in muscle extracts. J. Biol. Chem. 249, 3241–3247.
Valdeolmillos, M., Santos, R. M., Contreras, D., Soria, B., and Rosario, L. M. (1989). Glucose-induced oscillations of intracellular Ca2 + concentration resembling bursting electrical activity in single mouse islets of Langerhans. FEBS Lett. 259, 19–23. doi: 10.1016/0014-5793(89)81484-x
Watts, M., Fendler, B., Merrins, M. J., Satin, L. S., Bertram, R., and Sherman, A. (2014). Calcium and metabolic oscillations in pancreatic islets: who’s driving the bus? SIAM J. App. Dyn. Syst. 13, 683–703. doi: 10.1137/130920198
Yaney, G. C., Schultz, V., Cunningham, B. A., Dunaway, G. A., Corkey, B. E., and Tornheim, K. (1995). Phosphofructokinase isozymes in pancreatic islets and clonal β-cells (INS-1). Diabetes 44, 1285–1289. doi: 10.2337/diab.44.11.1285
Keywords: metabolism, oscillations, calcium, bursting, insulin
Citation: Marinelli I, Fletcher PA, Sherman AS, Satin LS and Bertram R (2021) Symbiosis of Electrical and Metabolic Oscillations in Pancreatic β-Cells. Front. Physiol. 12:781581. doi: 10.3389/fphys.2021.781581
Received: 22 September 2021; Accepted: 08 November 2021;
Published: 03 December 2021.
Edited by:
Alfonso Bueno-Orovio, University of Oxford, United KingdomReviewed by:
Jurij Dolensek, University of Maribor, SloveniaLinford Briant, University of Oxford, United Kingdom
Morten Gram Pedersen, University of Padua, Italy
Copyright © 2021 Marinelli, Fletcher, Sherman, Satin and Bertram. This is an open-access article distributed under the terms of the Creative Commons Attribution License (CC BY). The use, distribution or reproduction in other forums is permitted, provided the original author(s) and the copyright owner(s) are credited and that the original publication in this journal is cited, in accordance with accepted academic practice. No use, distribution or reproduction is permitted which does not comply with these terms.
*Correspondence: Arthur S. Sherman, YXJ0aHVyc0BuaWRkay5uaWguZ292