 Yanina Zócalo
 Daniel Bia
- Departamento de Fisiología, Facultad de Medicina, Centro Universitario de Investigación, Innovación y Diagnóstico Arterial (CUiiDARTE), Universidad de la República, Montevideo, Uruguay
Aortic blood pressure (aoBP) waveform-derived indexes could provide valuable (prognostic) information over and above cardiovascular risk factors (CRFs). To obtain aoBP waveform-characteristics, several (i) techniques, (ii) recording sites, (iii) pressure-only waveform analysis mathematical approaches [e.g., pulse wave analysis (PWA), wave separation analysis (WSA)], and (iv) indexes [augmentation pressure and index (AP and AIx), forward (Pf) and backward (Pb) components of aoBP, reflection magnitude (RM), and reflection index (Rix)], were proposed. An accurate clinical use of these indexes requires knowing their physiological age-related profiles and the expected values for a specific subject. There are no works that have characterized waveform-derived indexes profiles in large populations considering: (i) as a continuous, data from different age stages (childhood, adolescence, and adulthood), (ii) complementary indexes, (iii) data obtained from different techniques and approaches, and (iv) analyzing potential sex- and body height (BH)-related differences. In addition, (v) there is a lack of normative data (reference intervals, RIs) for waveform-derived indexes.
Aims: (1) to evaluate the association and agreement between PWA- and/or WSA-derived indexes obtained with different techniques and approaches; (2) to determine the need for sex-, BH-, and/or age-specific RIs; (3) to define RIs for PWA- and WSA-derived indexes in a large cohort of healthy children, adolescents, and adults.
Methods: 3619 subjects (3–90 y) were included; 1688 healthy (2–84 y). AP, AIx, AIx@75, Pf, Pb, RM, and RIx were obtained (carotid and radial tonometry, brachial oscillometry/plethysmography). The association and agreement between indexes were analyzed (Concordance correlation coefficients, Bland–Altman analysis). Mean and SD equations and sex-specific BH- and age-related profiles were obtained (regression methods; fractional polynomials).
Results: Waveform-derived indexes were not equivalent; for a specific index, there were systematic and proportional differences associated with the recording site (e.g., carotid vs. radial) and technique (e.g., tonometry vs. oscillometry). The need for sex-, BH-, or age-specific RIs was dependent on the index and/or age considered. RIs were defined for each index considering differences between recording sites and techniques. Equations for waveform-derived indexes age-related profiles were included, enabling to determine for a specific subject, the expected values and potential data deviations.
Introduction
Central aortic blood pressure (aoBP) waveform contains valuable (e.g., prognostic) information beyond and in addition to the obtained from its corresponding systolic, diastolic, and pulse pressure levels (aoSBP, aoDBP, aoPP) (Mynard et al., 2020). Several techniques (e.g., applanation tonometry, oscillometry/plethysmography) and mathematical methods (e.g., direct carotid or distal-arteries recordings associated to a general transfer function) have been proposed to perform waveform analyses (Hametner and Wassertheurer, 2017). In addition, different pressure-only approaches for waveform analysis [e.g., pulse wave analysis (PWA), wave separation analysis (WSA)] are available (Westerhof et al., 2006; Wang et al., 2010; Chirinos et al., 2012; Weber et al., 2012; Zamani et al., 2014; Hametner et al., 2015; Sluyter et al., 2017; Mynard et al., 2020). Augmentation pressure (AP), augmentation index (AIx), and AIx corrected for heart rate (AIx@75) are the PWA-derived indexes most commonly used. The concept or basic idea underlying PWA is that forward waves traveling from the ventricle toward the periphery are distally reflected. Reflected waves augment (central) pressure. AP represents the augmentation level (a positive AP indicates “additional” pressure arising from reflections) (Baksi et al., 2009; Sugawara et al., 2010). It is calculated from the inflection point in the pressure waveform (systolic phase) that “signalizes or identifies” the reflected component’s arrival to the aortic root (Kelly et al., 1989). AIx, calculated as AP/aoPP, is considered as a surrogate index of wave reflection (although it is known that it also depends on factors like heart rate or ventricle function) (Hametner and Wassertheurer, 2017). In WSA, the aoBP waveform is decomposed into single forward (Pf) and backward (Pb) components, which actually integrate different forward and backward propagating waves. Furthermore, it is to note that the Pf represents the integration of forward wave arising from the ventricle and re-reflections of backward propagating waves at the ventricular-aorta interface. From Pf and Pb, the reflection magnitude (RM; RM = Pb/Pf) and index {RIx; RIx = [Pb/(Pf + Pb)]} were determined. However, taking into account the above stated (and despite the names), they cannot be considered as simple measures or indicators of the reflections (Westerhof and Westerhof, 2013; Zamani et al., 2014).
In the last decade, several clinical studies have shown that waveform analysis could provide valuable information (even exceeding the information obtained from the analysis of the exposure to cardiovascular risk factors [CRFs]) (Zamani et al., 2014; Hametner and Wassertheurer, 2017; Mynard et al., 2020). However, to optimize their value and to ensure a proper use of waveform-derived indexes, some issues should be assessed and clarified. First, it is unknown whether the different techniques and methods used to quantify waveform-derived indexes provide equivalent information that would allow the use of similar normative data (reference intervals, [RIs]) regardless of the approach considered. Second, there is limited information concerning age and/or sex-related RIs for PWA- and WSA-derived indexes obtained at the same time in large healthy populations (including children, adolescents, and adults). This is true, even more so if data from South American populations are considered. In this regard, it is to note that ethnicity may be an independent determinant of wave reflections (both in adults and children) (Chirinos et al., 2011; Heffernan et al., 2020). In addition, an accurate use of waveform-derived indexes requires knowing the expected physiological age-related profiles and the predicted value for a specific subject. However, in our knowledge, there are no works assessing waveform-derived indexes’ variations (as a continuous) considering data from different age-stages and their transitions (childhood-adolescence-adulthood). It is to note that studies that aimed at analyzing age-related differences do not allow for their adequate and comprehensive characterization, as they (i) considered small numbers of subjects [e.g., n = 65 (Hughes et al., 2013), n = 267 (Yu et al., 2020)], (ii) did not exclude subjects with cardiovascular disease or exposed to CRFs [e.g., cardiology outpatients (Namasivayam et al., 2016), unhealthy or diseased subjects (Torjesen et al., 2014; Hodson et al., 2016; Li et al., 2019), and subjects with CRFs (Mitchell et al., 2004; Hughes et al., 2013; Hickson et al., 2016; Wilenius et al., 2016; Gómez-Sánchez et al., 2020; Yu et al., 2020)]; (iii) compared “mean values” of groups comprising subjects of wide age ranges (e.g., 5–7 years (y) (Segers et al., 2007; Janner et al., 2010; Hodson et al., 2016) or 10 y (Kelly et al., 1989; Mitchell et al., 2004; McEniery et al., 2005; Torjesen et al., 2014; Hickson et al., 2016; Namasivayam et al., 2016; Solanki et al., 2018; Li et al., 2019; Yu et al., 2020) of difference in the age of subjects belonging to the same group); (iv) considered only adults within a limited age range (e.g., 40–70 y, grouped by decades) (Li et al., 2019), and (v) in general, did not consider subjects under 18–20 years of age. In this context, it should be noted that the need for RIs for vascular parameters in children and adolescents is now well-recognized and is considered necessary to extend their use in clinical practice (Climie et al., 2021).
In this context, this work’s aims were: (1) to evaluate the association and/or agreement between PWA- and/or WSA-derived indexes obtained with different techniques and approaches, (2) to determine the need for sex-, body height (BH)-, and/or age-specific RIs, (3) to define RIs for PWA- and WSA-derived indexes in a large cohort of healthy children, adolescents, and adults from South America. As a secondary aim, non-linear equations for sex-, BH-, and/or age-specific percentiles were determined and included (text and spreadsheet formats); the information given enables to determine the expected value for a particular subject (and to assess any possible deviation from the anticipated).
Materials and Methods
Study Population and Clinical and Anthropometric Evaluation
The study was carried out in the context of the CUiiDARTE project (Bia et al., 2011; Santana et al., 2012a,b; Zócalo et al., 2020; Bia and Zócalo, 2021), a population-based study developed in Uruguay. In this work, we considered data from 3619 subjects included in CUiiDARTE database. This contains data on demographic and anthropometric variables, exposure to CRFs, personal and family history of cardiovascular disease and data on hemodynamic, and on structural and functional vascular parameters (Bia et al., 2011; Santana et al., 2012a,b; Zócalo et al., 2020; Bia and Zócalo, 2021; Zócalo and Bia, 2021a,b). In this work, the analysis was focused on PWA- and WSA-derived indexes.
All procedures agree with the Declaration of Helsinki (1975 and reviewed in 1983). The study protocol was reviewed and approved by the Ethics Committee of Centro Hospitalario Pereira Rossell, Universidad de la República. Prior to the evaluation, the participants provided their written informed consent to participate in the study. In subjects under 18 y, parents’ written consent and children’s assent were obtained before the evaluations. Subjects or parents (in case of subjects aged < 18 y) provided informed written consent to have data from their medical records used in research.
Before cardiovascular evaluation, a brief clinical interview together with the anthropometric and blood test results evaluation enabled to assess exposure to CRFs. Body weight and BH were measured with the participant wearing light clothing and no shoes. Standing BH was measured using a portable stadiometer and recorded to the nearest 0.1 cm. Body weight was measured with an electronic scale (841/843, Seca Inc., Hamburg, Germany; model HBF-514C, Omron Inc., Chicago, IL, United States) and recorded to the nearest 0.1 kg. Body mass index (BMI) was calculated as body weight-to-squared BH ratio. In children and adolescents, z-scores for BMI were calculated using the WHO software (Anthro-v.3.2.2; Anthro-Plus-v.1.0.4) (Castro et al., 2019).
Obesity was defined as z-score for BMI ≥ 2.0 (for subjects < 18 y) or BMI > 30 Kg/m2 (for subjects ≥ 18 y). Arterial hypertension was considered to be present, if it had been previously diagnosed in agreement with reference guidelines and/or use of blood pressure-lowering drugs was reported. Cut-off values were: brachial systolic blood pressure (baSBP) ≥ 140 mmHg and/or diastolic blood pressure (baDBP) ≥ 90 mmHg (for subjects ≥ 18 y) and baSBP and baDBP > 95th percentile for sex, age, and BH (for subjects < 18 y). Personal and family histories of cardiovascular disease (i.e., presence of cerebral, coronary, aortic, or peripheral arterial disease) were assessed. A family history of cardiovascular disease was defined by the presence of first-degree (for all the subjects) and/or second-degree (for subjects ≤ 18 y) relatives with early (< 55 y in males, < 65 y in females) cardiovascular disease. History of dyslipidemia and diabetes were considered to be present if they had been previously diagnosed in agreement with reference guidelines and/or the use of lipid- or glucose-lowering drugs (respectively) was reported. Dyslipidemia was defined as total cholesterol > 240 mg/dL or high-density lipoprotein cholesterol for men < 40 mg/dL and for women < 46 mg/dL. In turn, diabetes diagnosis was based on plasma glucose levels (fasting plasma glucose ≥ 126 mg/dl). Regular (current) smokers, defined as usually smoking at least one cigarette/week, were identified.
Cardiovascular Evaluation
The participants were asked to avoid exercise, tobacco, alcohol, caffeine, and food-intake 4 h before the evaluation. All hemodynamic measurements were performed in a temperature-controlled environment (21–23°C), with the subject in supine position and after resting for at least 10–15 min, which enabled reaching steady hemodynamic conditions. Using a validated oscillometric device (HEM-433INT; Omron Healthcare Inc., IL, United States), heart rate, baSBP, and baDBP were recorded in supine position simultaneously and/or immediately before or after each non-invasive arterial recording. Then, brachial artery pulse pressure (baPP; baPP = baSBP-baDBP) and mean BP (baMBP, baMBP = baDBP + baPP/3) were calculated.
Structural and Functional Markers of Subclinical Atherosclerosis
Left and right common, internal, and external carotid arteries, vertebral artery, common femoral artery, and left brachial artery were examined (B-Mode and Doppler ultrasound, 7–13 MHz, linear transducer, M-Turbo, SonoSite Inc., Bothell, WA, United States). Transverse and longitudinal arterial views were obtained to assess the presence of atherosclerotic plaques (defined as focal wall thickening at least 50% greater than the adjacent segment, focal thickening protruding ≥0.5 mm into the lumen, or an intima-media thickness ≥1.5 mm) (Zócalo and Bia, 2016; Marin et al., 2020).
Left and right brachial and tibial systolic and diastolic blood pressure levels were obtained (no fixed order) at 5 min intervals (Hem-4030, Omron Inc., IL, United States). At least five measurements were obtained from each recording site. The Ankle Brachial Index, an index of arterial permeability and central-peripheral blood pressure amplification, was calculated as tibial systolic blood pressure/baSBP (Zócalo and Bia, 2016). Right and left Ankle-Brachial Index values < 0.9 were used to define and rule out stenosis of at least 50% distal to common femoral artery (Zócalo and Bia, 2016). After applying the exclusion criteria related to exposure to CRFs, there were no subjects with Ankle-Brachial Index < 0.9 in the group of RIs.
Central Blood Pressure Levels and Waveform Analysis-Derived Indexes
Central aoBP levels and waveforms were obtained (random order) using commercially available devices: SphygmoCor-CvMS ([SCOR]; v.9, AtCor-Medical, Sydney, NSW, Australia) and Mobil-O-Graph PWA-monitor system ([MOG]; I.E.M.-GmbH, Stolberg, Germany).
Using SCOR, aoBP waveforms were derived from, (i) radial artery (applying a general transfer function) and (ii) carotid artery (directly) manual tonometric recordings (Figure 1). Carotid pulse waveforms were assumed to be identical to the aortic ones (due to the proximity of the arterial sites) (Karamanoglu and Feneley, 1996). Thus, a transfer function was not applied to obtain central waveforms from carotid recordings. Only accurate waveforms on visual inspection and high-quality recordings (in-device quality control (operator) index > 75%) were considered. The operator index is an indicator of recorded signals’ overall reproducibility. It is calculated by assesing weighted quality control parameters and adding them to give a number as a percentage. Quality index assessment includes: (i) average height of individual records above 100 units, (ii) pulse height variation (accepted values: <5%), (iii) diastolic variation (indicates constancy of the basal level of the wave, accepted value: <5%), (iv) shape variation (difference in the shape of the recorded waves, accepted values <5%), and (v) maximum dP/dt (maximum value of the first derivative or maximal rate of wave rise). Based on the described variables, the operator index (recordings quality/reproducibility) was automatically assessed by the recording device. Brachial artery blood pressure levels and waveforms were automatically obtained using the MOG system (brachial cuff-based oscillometric device) (Zinoveev et al., 2019). The device determined aoBP levels and waveforms from peripheral recordings using a validated general transfer function. Only high-quality records (index equal to 1 or 2) and satisfactory waveforms (visual inspection) were considered.
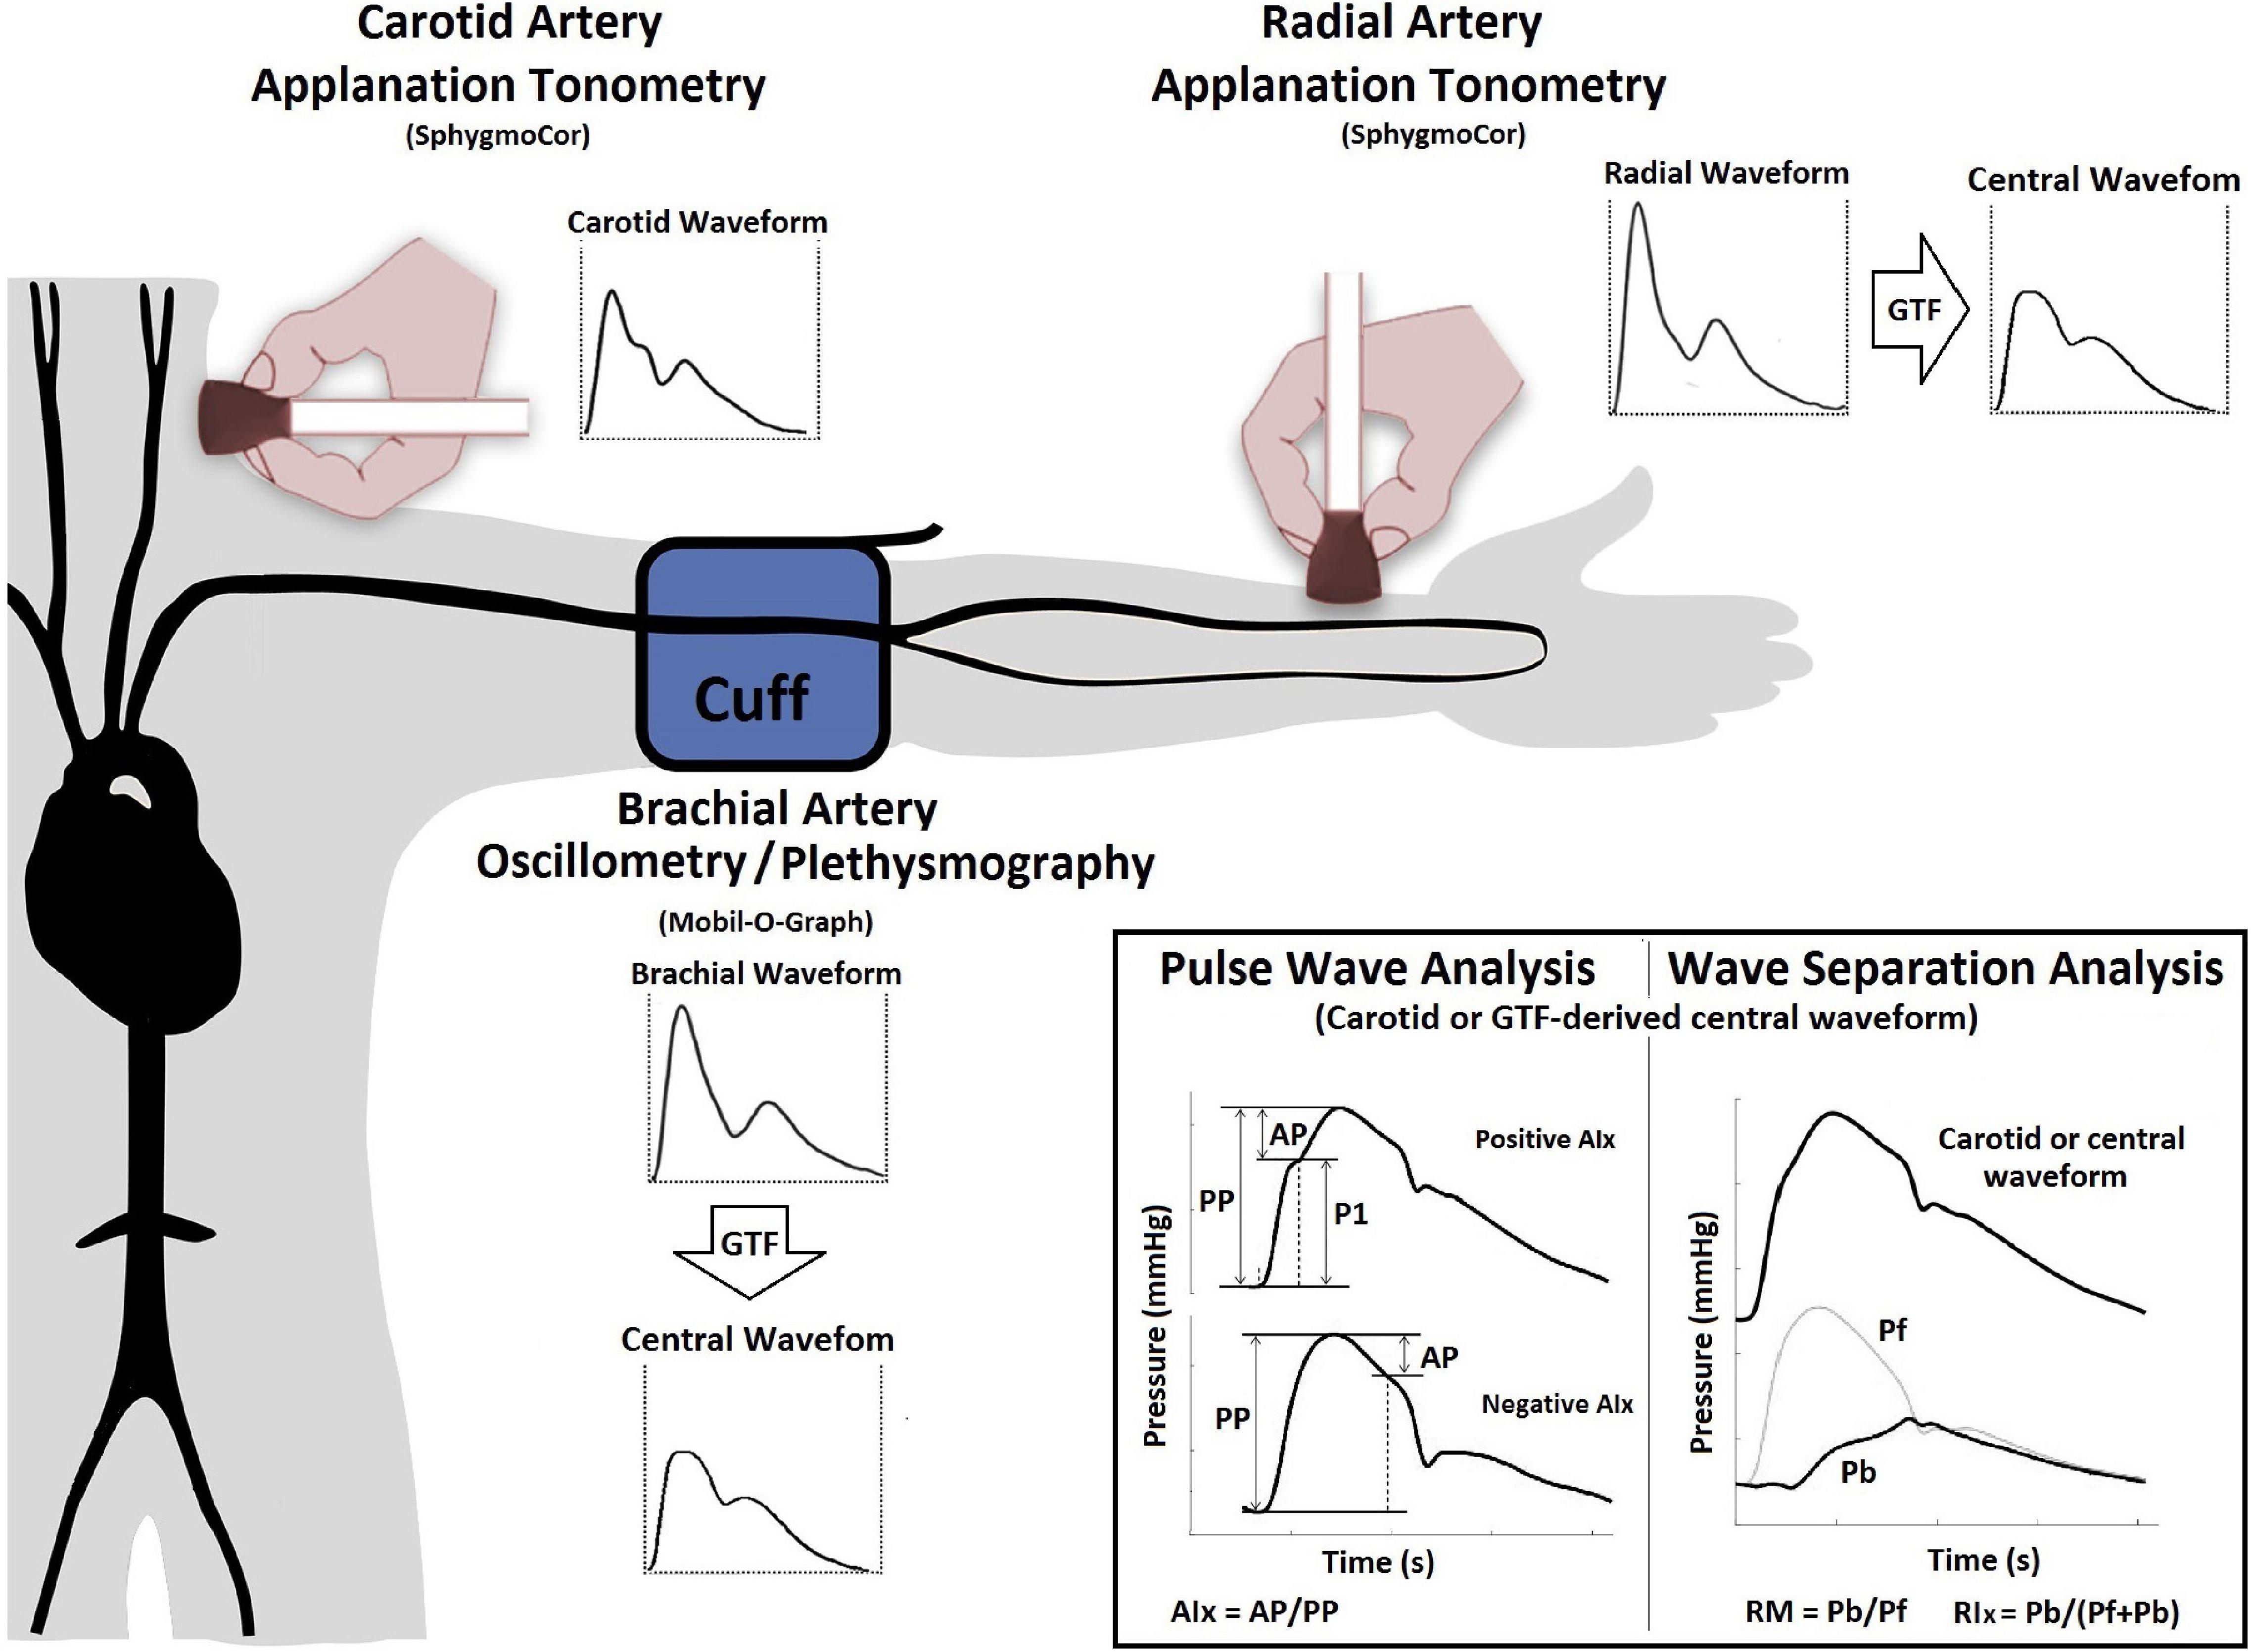
Figure 1. Instrumental approach employed to obtain central blood pressure waves and waveform-derived indexes. Examples of positive and negative AIx. Aix, Augmentation index; AP, augmentation pressure; GTF, general transfer function; Pf and Pb, forward and backward central blood pressure components; PP, pulse pressure; SphygmoCor, SphygmoCor device; v.9, AtCor-Medical, Sydney, NSW, Australia. Mobil-O-Graph, Mobil-O-Graph PWA-monitor system, I.E.M.-GmbH, Stolberg, Germany.
Both devices (SCOR and MOG) enable PWA and WSA. A detailed (step-by-step) explanation of the method used for WSA based on recorded (carotid waveforms, SCOR) and mathematically derived aortic waveforms (SCOR and MOG) was included as Supplementary Material in a previous work (Zinoveev et al., 2019). As was previously published, absolute and relative intra- (repeatability) and interobserver (reproducibility) variability of aoBP levels and waveform-derived indices were analyzed (considering different methodological approaches: radial tonometry, carotid tonometry, and brachial oscillometric records) (Zinoveev et al., 2019). No significant differences were observed in aoSBP, aoPP, and waveform derived-indexes levels either within each visit, between two records [obtained by a single investigator (Y.Z.)], or between records obtained by two investigators (Y.Z., D.B.); indicating adequate repeatability, as well as reproducibility. In all cases, relative inter- and intraobserver variability was <6%.
Using both devices (SCOR and MOG) and the three recording sites (carotid and radial with SCOR and brachial with MOG), we quantified: (i) AP, AIx, AIx@75 and (ii) Pf, Pb, RM, and RIx (Figure 1). Recorded waveforms were calibrated using baDBP and baMBP (Zinoveev et al., 2019). AIx, AIx@75, RM, and RIx are “attractive” biomarkers because they are dimensionless and, therefore, do not depend on waveform calibration.
The variables were named based on the (i) waveform-derived index, (ii) recording site, and (iii) device (e.g., Pf_Radial_SCOR vs. Pf_Carotid_SCOR vs. Pf_Brachial_MOG).
Data Analysis
A step-wise analysis was performed. First, after descriptive statistics were computed and checked (Tables 1, 2 and Supplementary Tables 1, 2), it was analyzed whether the studied variables showed the expected trend in terms of age-related variations. Figure 2 exemplifies the results obtained for AIx@75_SCOR_Radial.
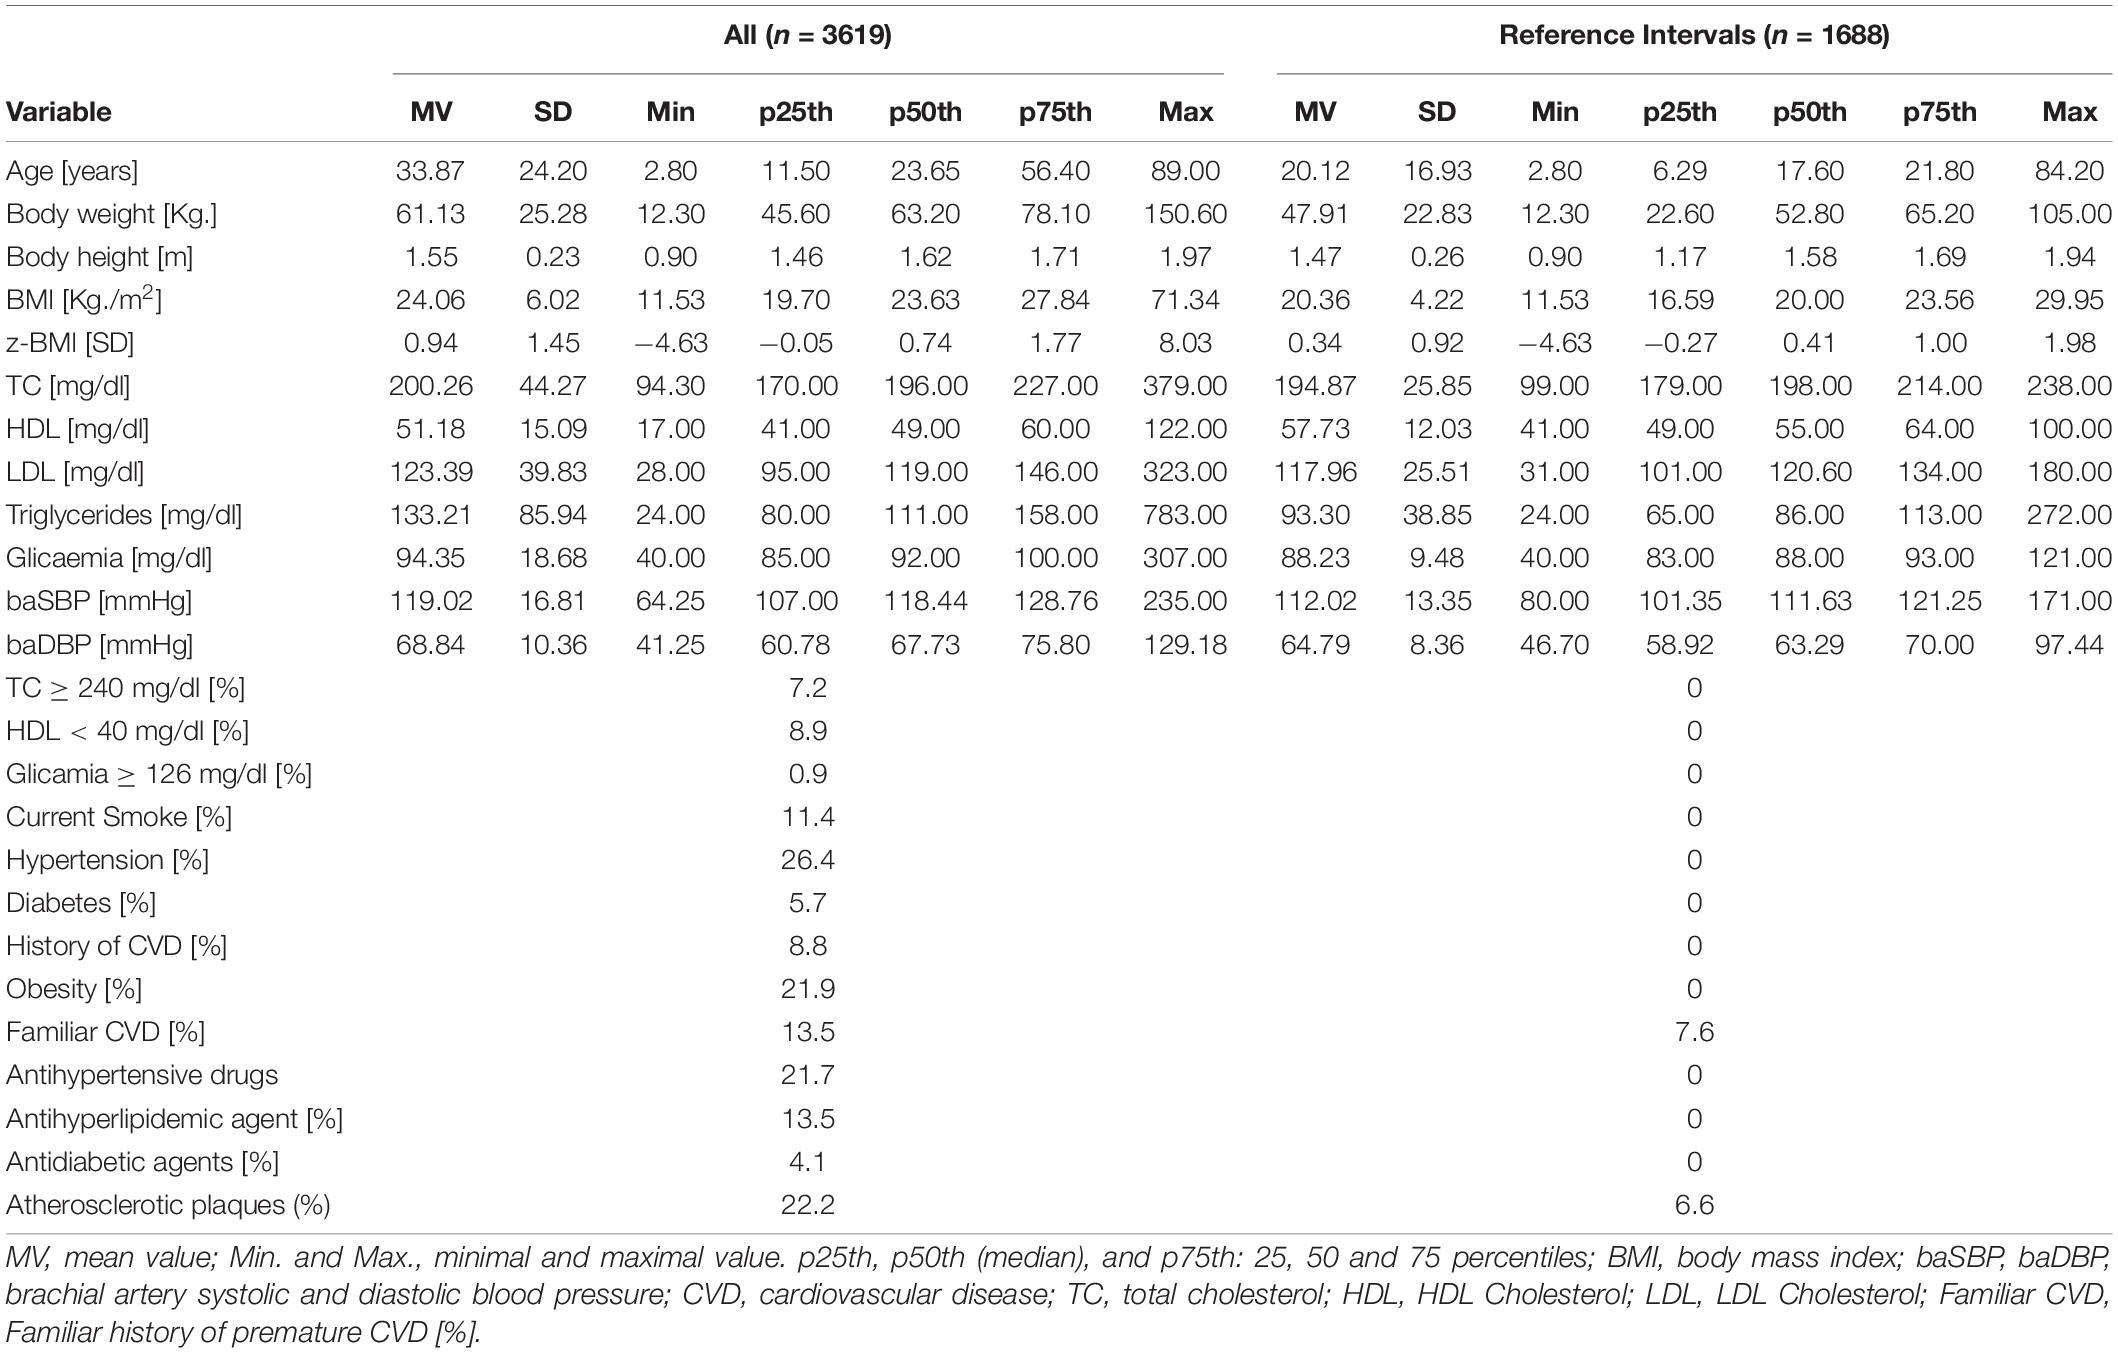
Table 1. Subjects demographic, anthropometric, and clinical characteristics.
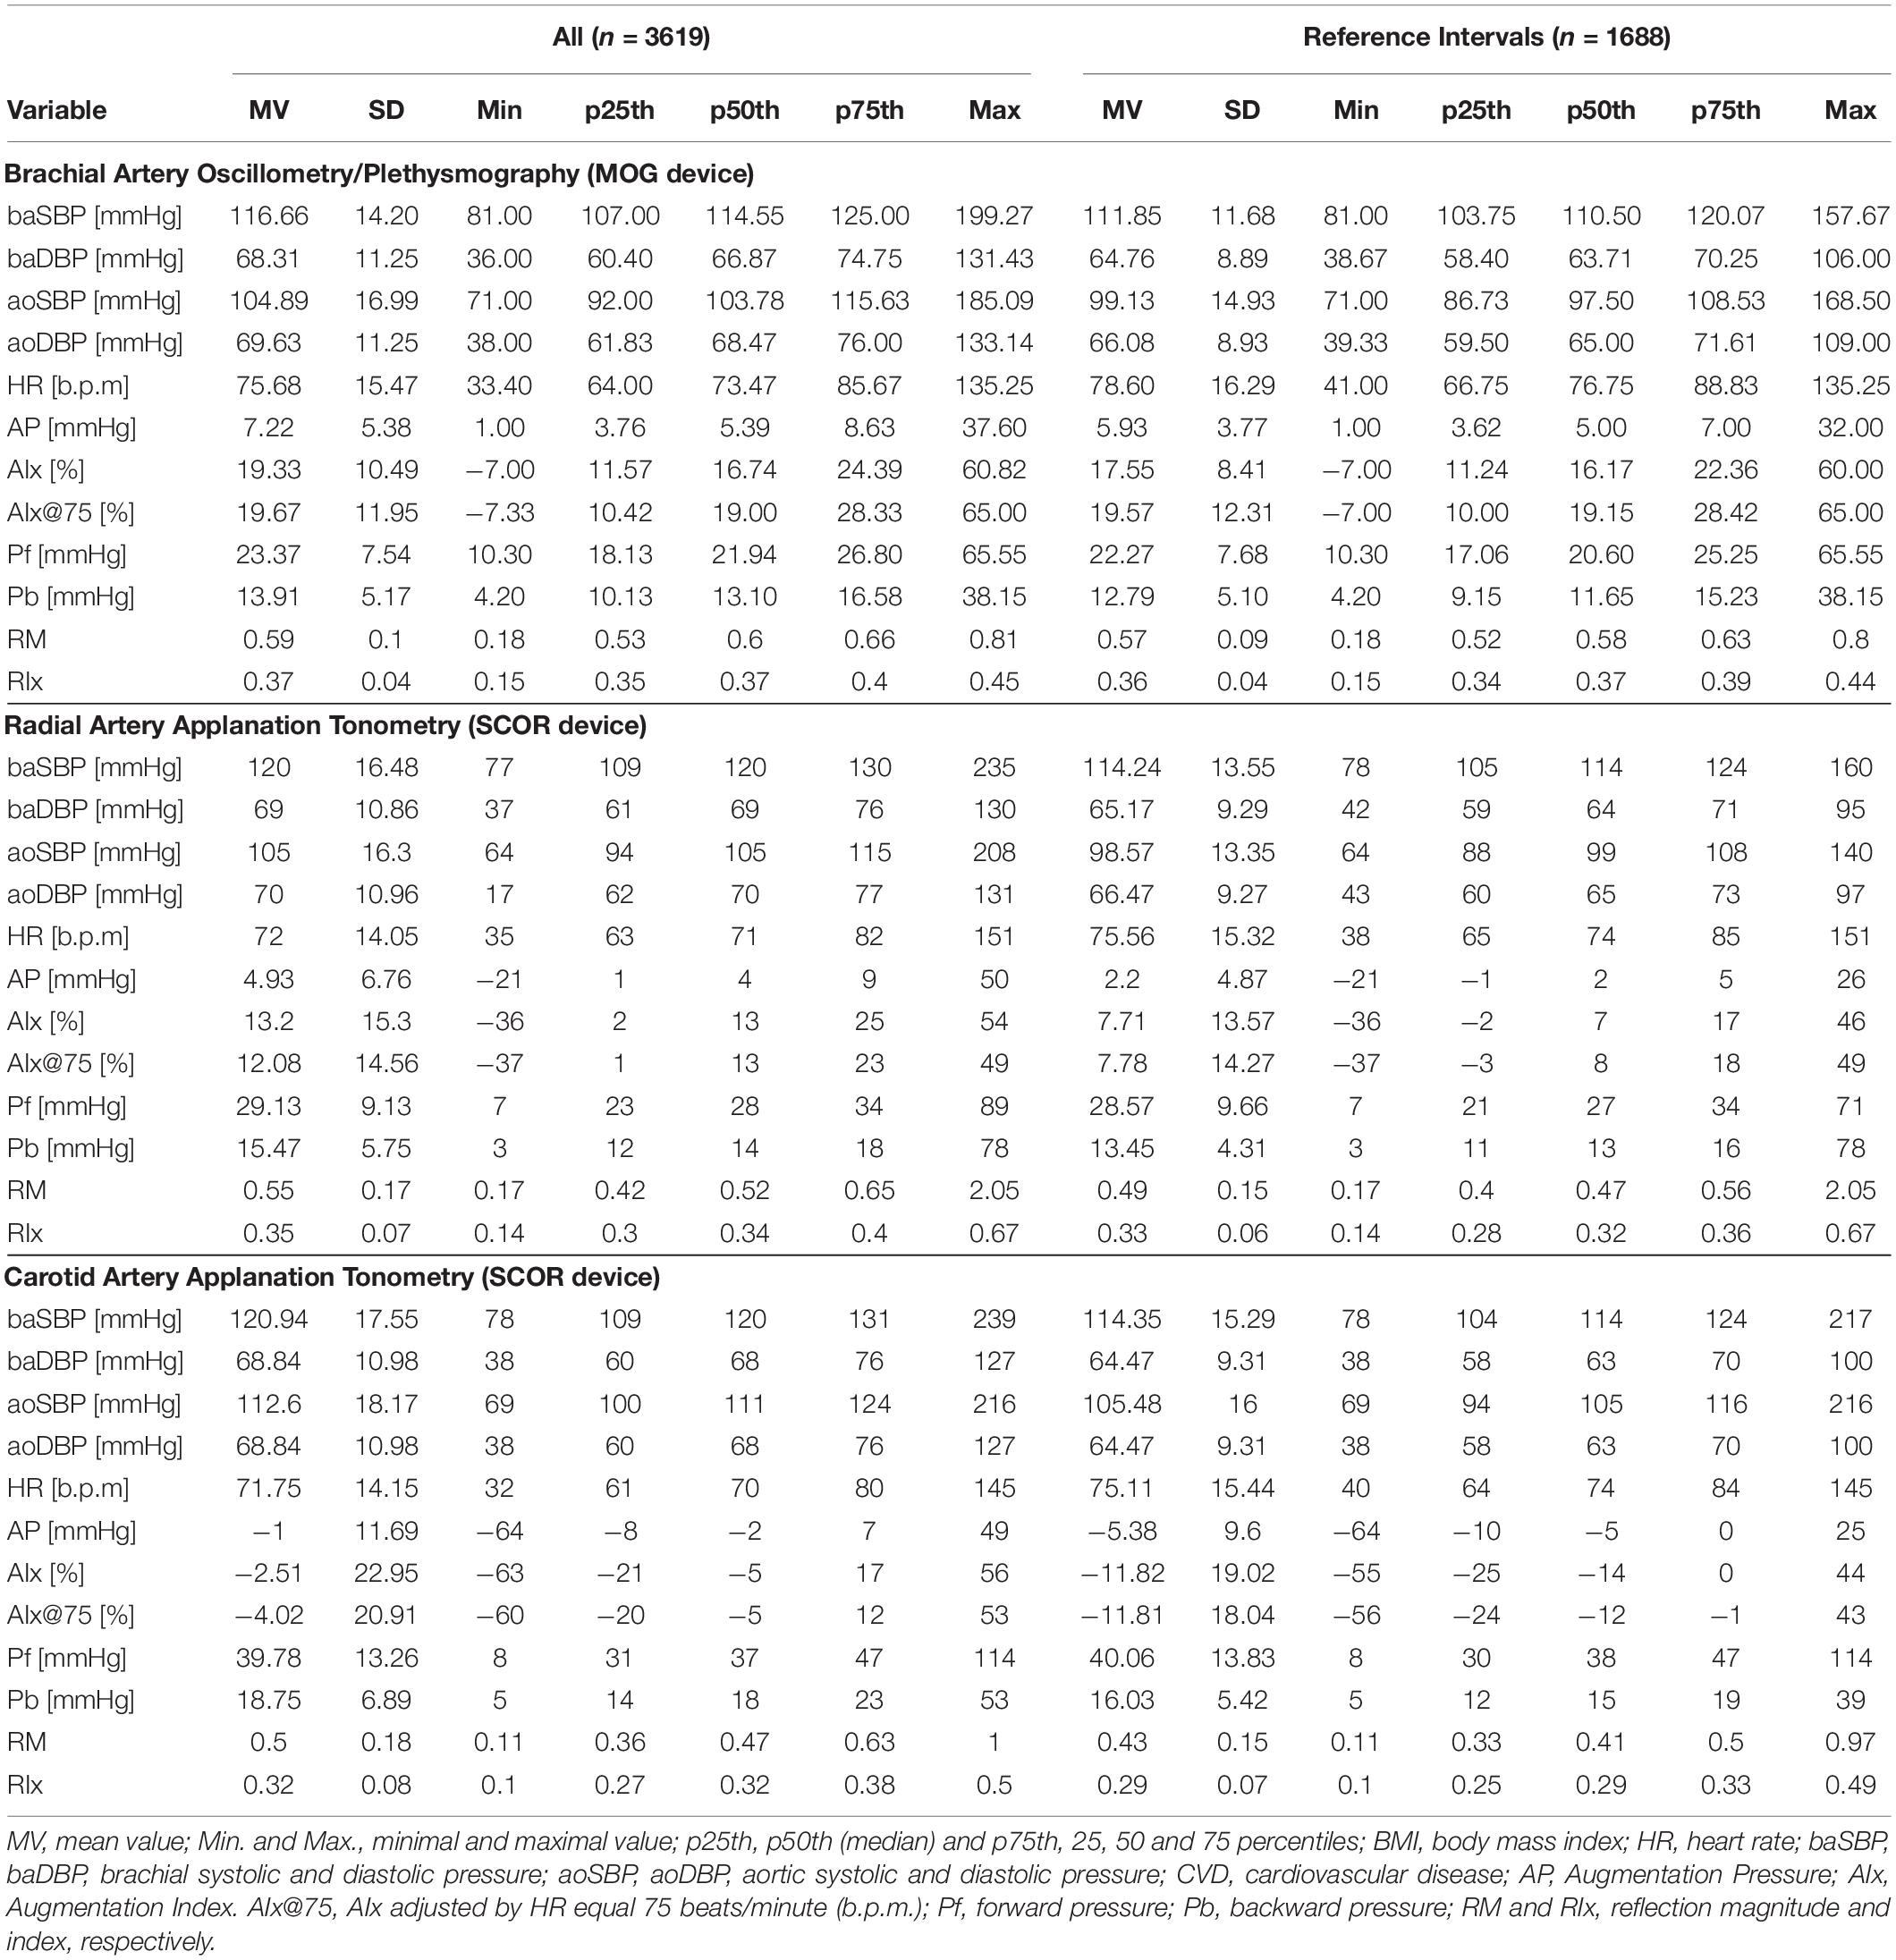
Table 2. Central and peripheral blood pressure and central waveform-derived indexes.
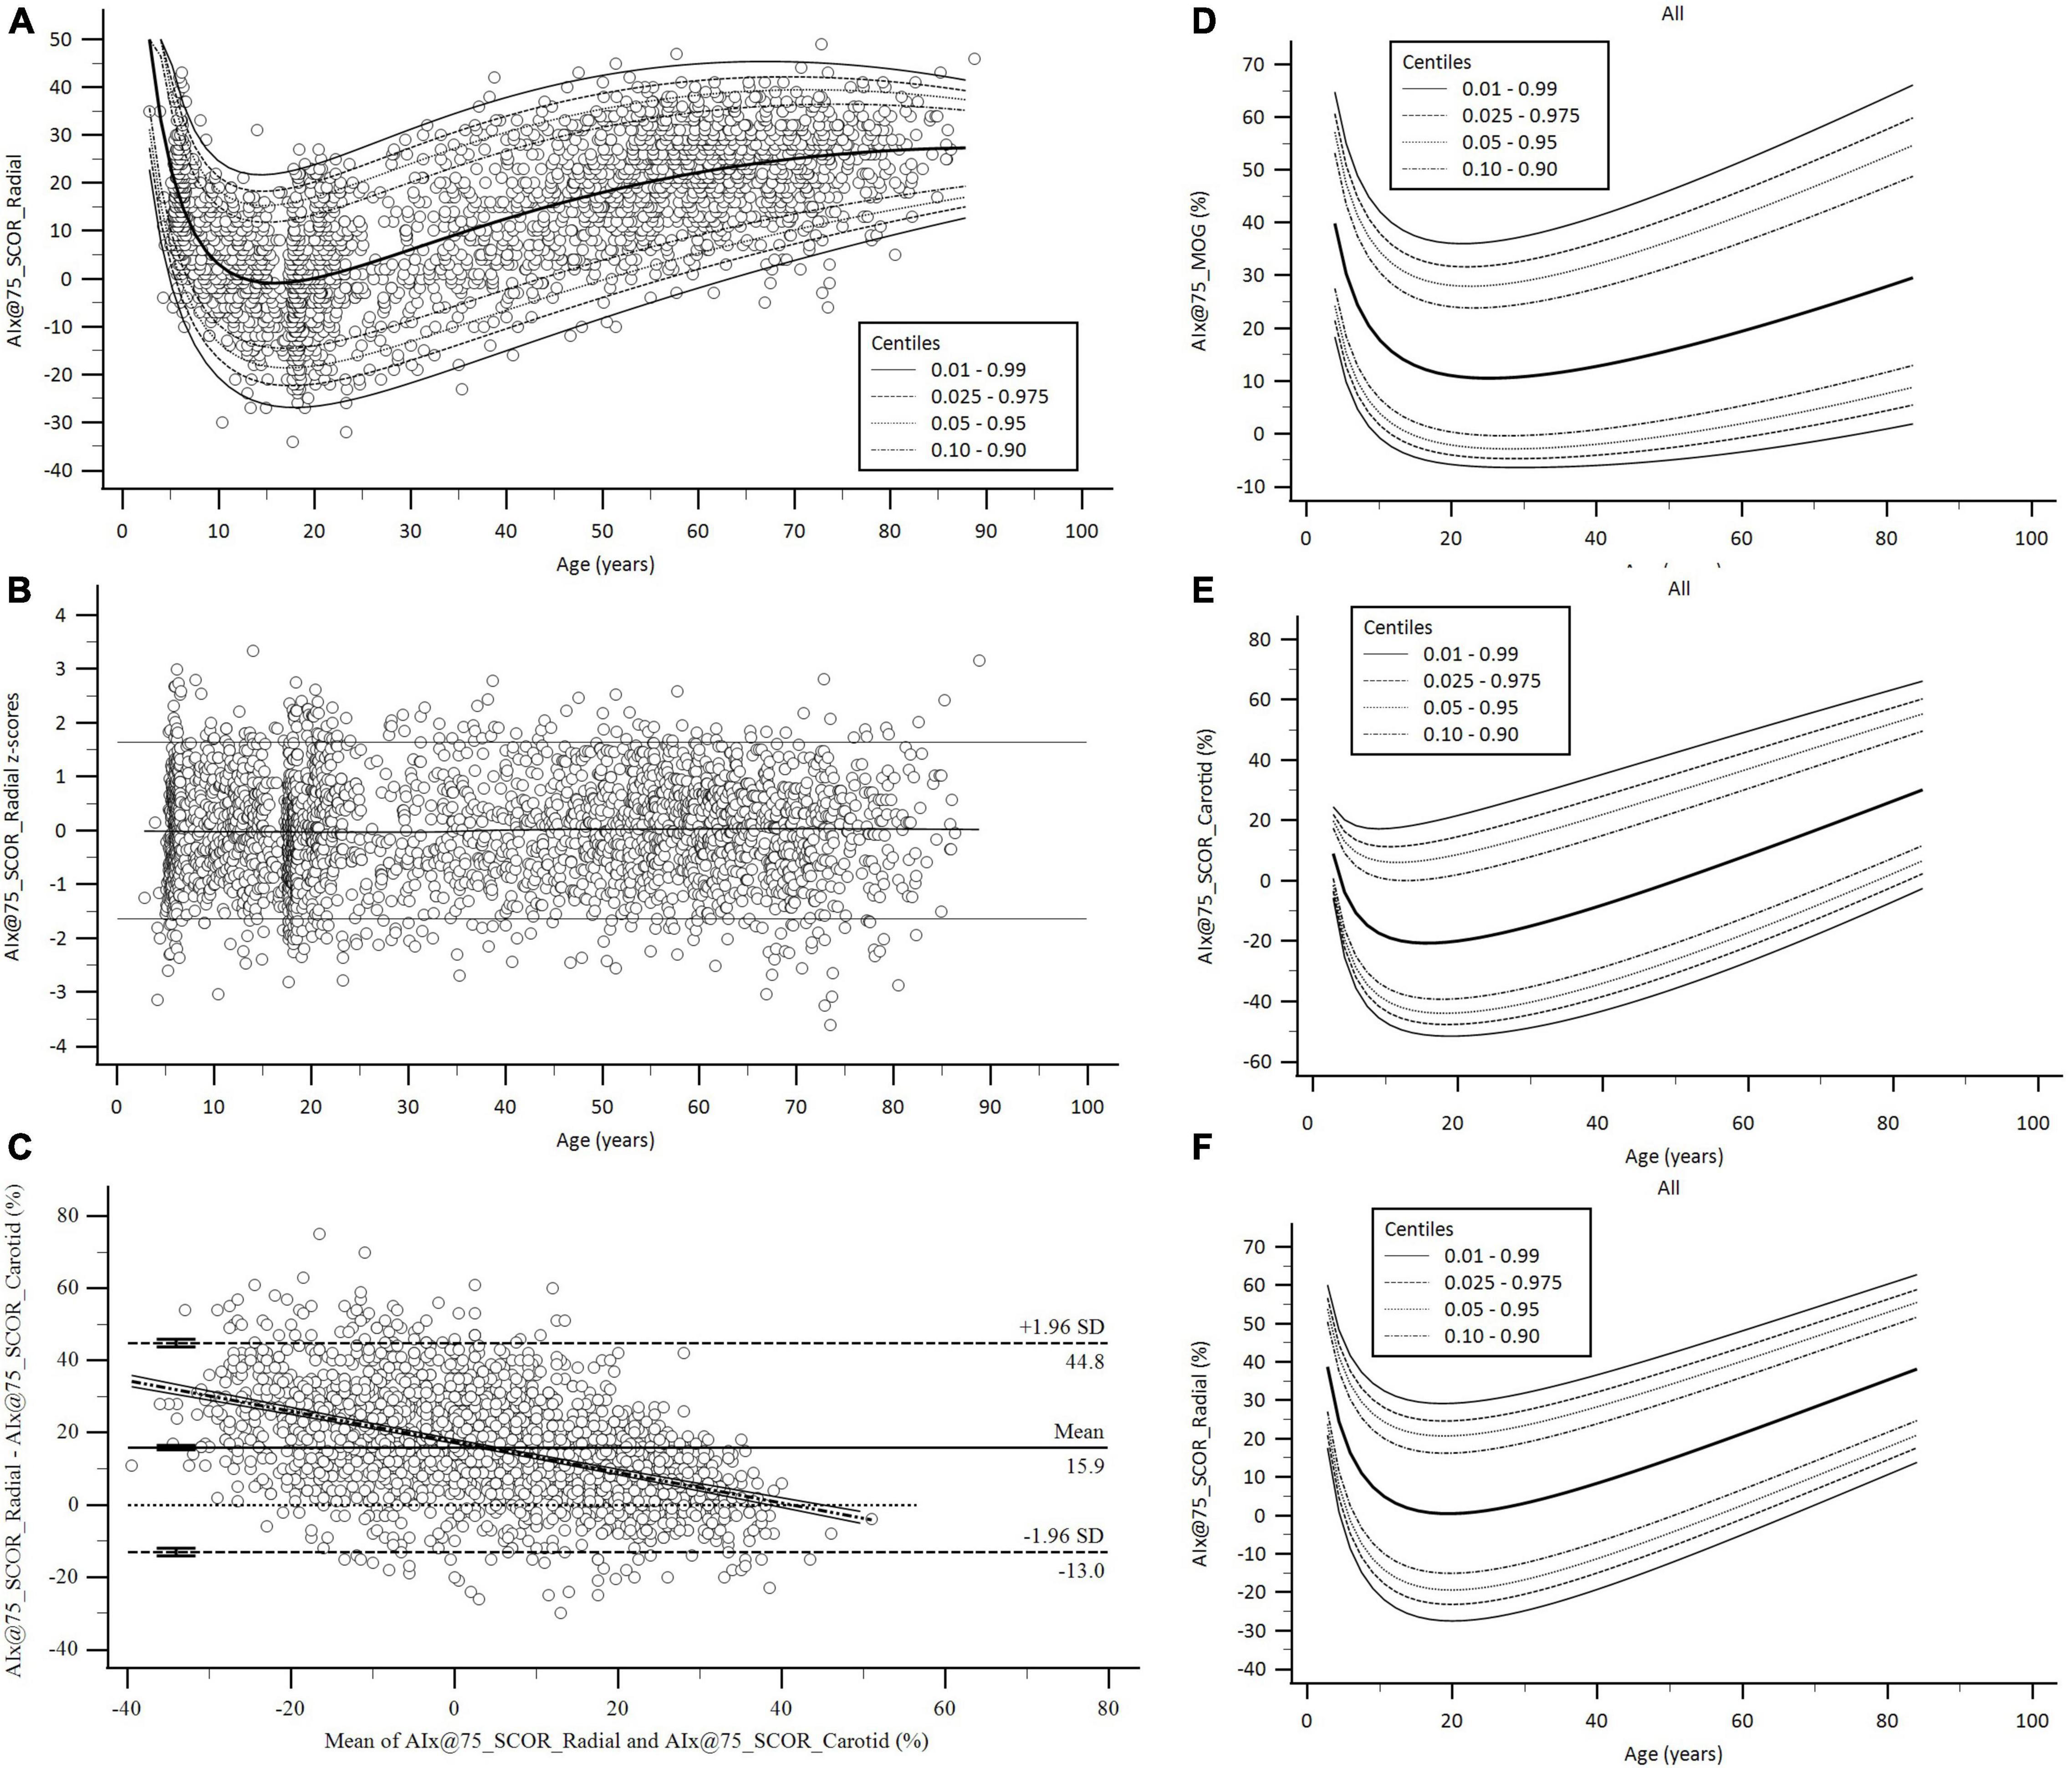
Figure 2. Age-related profiles and Bland–Altman analysis for AIx@75. (A,B) Age-related profiles (1th, 2.5th, 5th, 10th, 50th, 90th, 95th, 97.5th, and 99th percentiles) for AIx@75_SCOR_Radial and z-score diagram used to verify model fit. (C) Bland–Altman diagram for AIx@75_SCOR_Radial and AIx@75_SCOR_Carotid comparison. There were significant mean (15.9, 95% CI.; 15.28 to 16.53%, p < 0.001) and proportional errors (slope coefficient: –0.4234, 95% CI.: –0.4571 to –0.3897, p < 0.001). (D–F) Age-related percentile curves for AIx@75 obtained with three different methods. Age-related percentile curves (1th, 2.5th, 5th, 10th, 50th, 90th, 95th, 97.5th, and 99th percentiles) for AIx@75_MOG, AIx@75_SCOR_Radial, and AIx@75_SCOR_Carotid.
Second, it was defined as a reference subgroup to determine RIs. This subgroup included subjects (n = 1688, 864 females) without any of the following (Engelen et al., 2013, 2015; Bossuyt et al., 2015): (i) cardiovascular disease; (ii) use of blood pressure-, lipid-, and/or glucose-lowering drugs; (iii) arterial hypertension; (iv) tobacco use; (v) diabetes; (vi) dyslipidemia; and (vii) obesity. In this subgroup, the atherosclerotic plaques presence was not associated with the waveform-derived indexes. Then, the subjects with plaques were not excluded from the RIs subgroup (Supplementary Table 3).
Third, in order to determine whether specific RIs were necessary for the same waveform-derived parameter obtained with different approaches (e.g., Pf_Radial_SCOR vs. Pf_Carotid_SCOR vs. Pf_Brachial_MOG), we analyzed the degree of association and agreement between data by assessing: (i) concordance correlation coefficients and (ii) mean and proportional differences (Bland–Altman analysis) (Table 3 and Supplementary Table 4). Figure 2 exemplifies the results obtained when comparing AIx@75_SCOR_Radial and AIx@75_SCOR_Carotid. Specific RIs for all waveform-derived indexes obtained with the different approaches were defined as necessary.
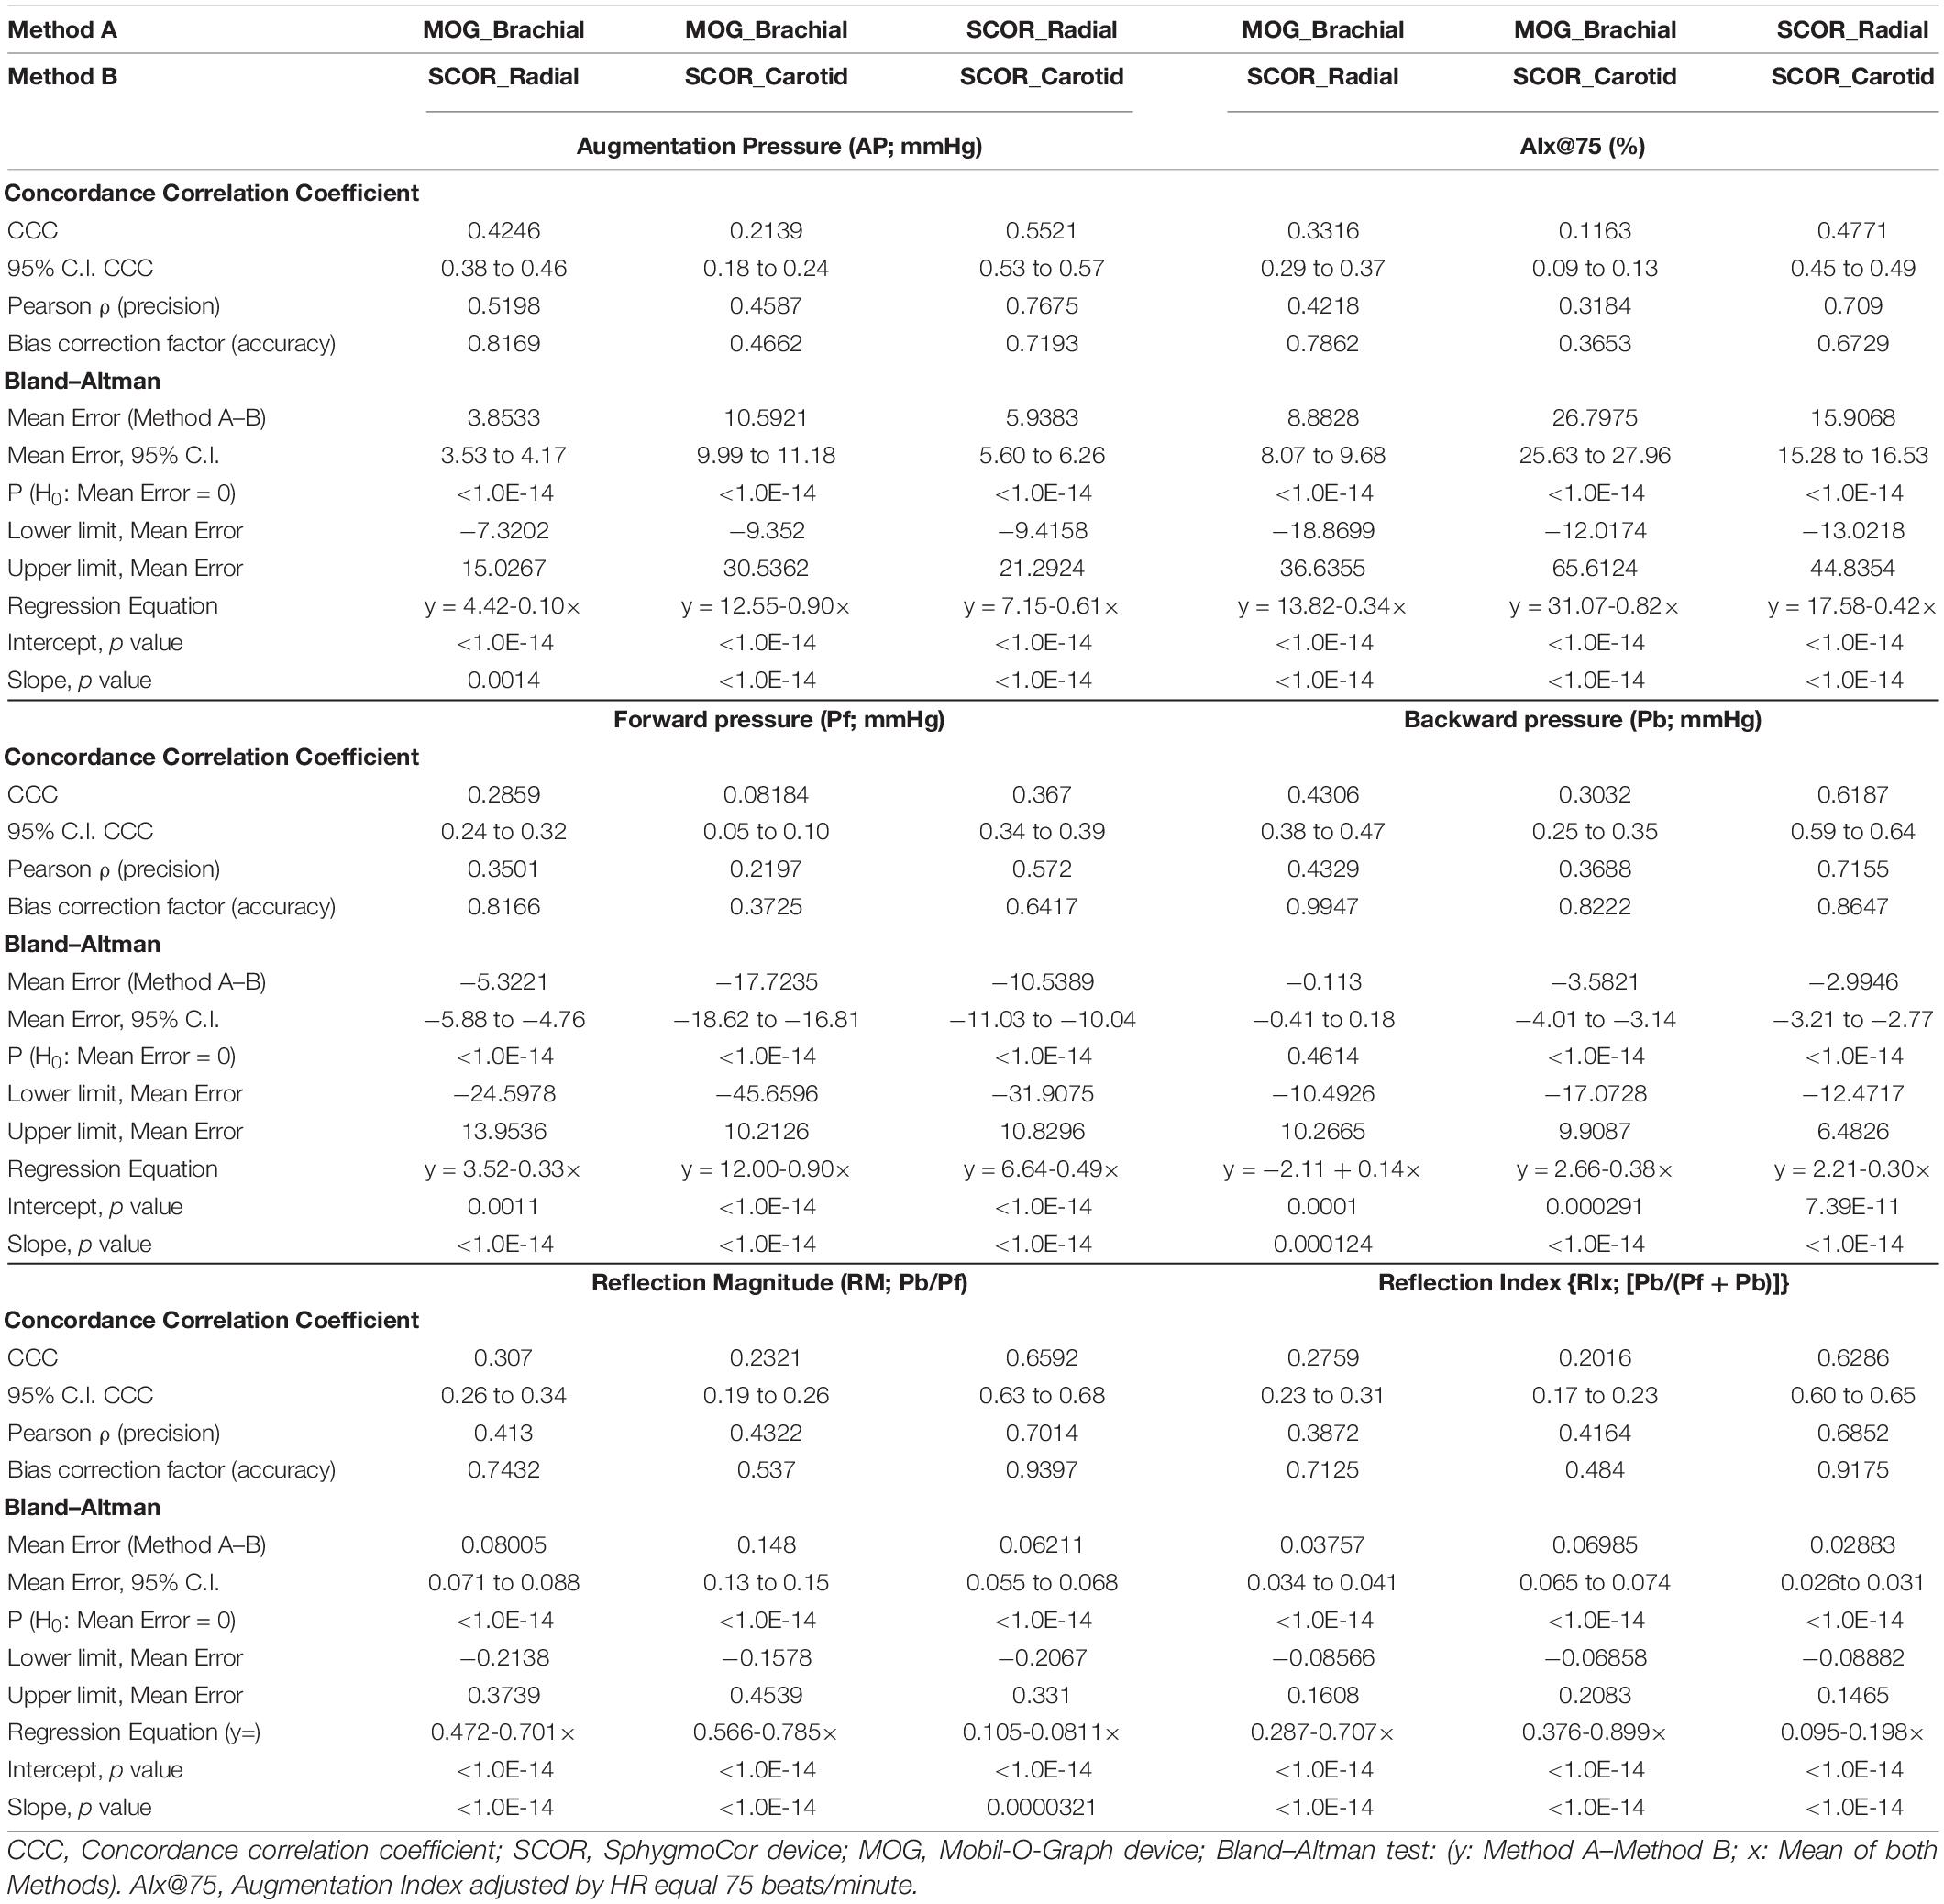
Table 3. Agreement between central waveform-derived indexes obtained with carotid and radial applanation tonometry and brachial oscillometry: Concordance Correlation and Bland–Altman analysis.
Fourth, we evaluated whether age-, BH-, and/or sex-specific RIs were necessary using multiple linear regression models that included interaction analysis (Sex*Age; Sex*BH) with Johnson-Neyman significance regions definition (Supplementary Tables 5–10). Variables “y,” “x,” and “w” (moderating variable) were assigned to the waveform-derived indexes (y), sex (x), and age or BH (w). We identified indexes that: (i) required sex-specific RIs only from a certain age or BH, (ii) required sex-specific RIs regardless of age or BH, (iii) did not require sex-specific RIs, (iv) did not require age-, BH-, and/or sex-specific RIs (Supplementary Table 11). To enable comparisons with other authors and, at the same time, to minimize type 1 error associated with the development of several multiple regression models (n = 42), even in the case that sex-variable was significant, we defined RIs for the whole group (males and females).
Fifth, age- and BH-related percentile curves and RIs were obtained. To obtain age- and BH-related equations for mean values and SD, we used parametric regression methods based on fractional polynomials (Royston and Wright, 1998; Díaz et al., 2018; Zócalo et al., 2020; Bia and Zócalo, 2021; Zócalo and Bia, 2021a,b). Briefly, fitting fractional polynomials, age-specific (and BH-specific) mean value and SD regression curves were defined for the different variables (e.g., AIx@75_SCOR_Radial) using an iterative procedure (generalized least squares). Then, age-specific (and BH-specific) equations were obtained for the different indexes. For instance, AIx@75_SCOR_Radial equation would be: “AIx@75_SCOR_Radial mean value = a + b*Agep + c*Ageq + .,” where a, b, c, are the coefficients, and p and q are the powers, with numbers selected from the set [−2, −1, −0.5, 0, 0.5, 1, 2, 3] estimated from the regression for mean AIx@75_SCOR_Radial curve, and likewise from the regression for SD curve. Fractional polynomials with powers [1,2], that is, with p = 1 and q = 2, illustrate an equation with the form a + b*Age + c*Age2 (Royston and Wright, 1998). Residuals were used to assess the model fit, which was deemed appropriate if the scores were normally distributed, with a mean of 0 and a SD of 1, randomly scattered above and below 0 when plotted against age (or BH). Best-fit curves, according to visual and mathematical criteria (Kurtosis and Skewness coefficients), were selected. From the equations obtained, age- and BH-specific percentiles were defined using the standard normal distribution (Z) (Supplementary Tables 12, 13).
Detailed age- and BH-related RIs and percentile curves data can be found in Supplementary Tables 14–76 (for age) and 77–139 (for BH) and in Supplementary Material 2 (Supplementary Figures 1–21; for age) and 3 (Supplementary Figures 22–42; for BH). Figure 2 exemplifies age-related percentile curves for AIx@75_MOG, AIx@75_SCOR_Radial and AIx@75_SCOR_Carotid. Table 4 shows a summary (5 y intervals) of the age-related RIs (p50th, p75th, p90th, p95th, p97.5th, p99th) for each waveform-derived index. Table 5 shows a summary (10 cm intervals) of BH-related RIs (p50th, p75th, p90th, p95th, p97.5th, p99th) for each waveform-derived index.
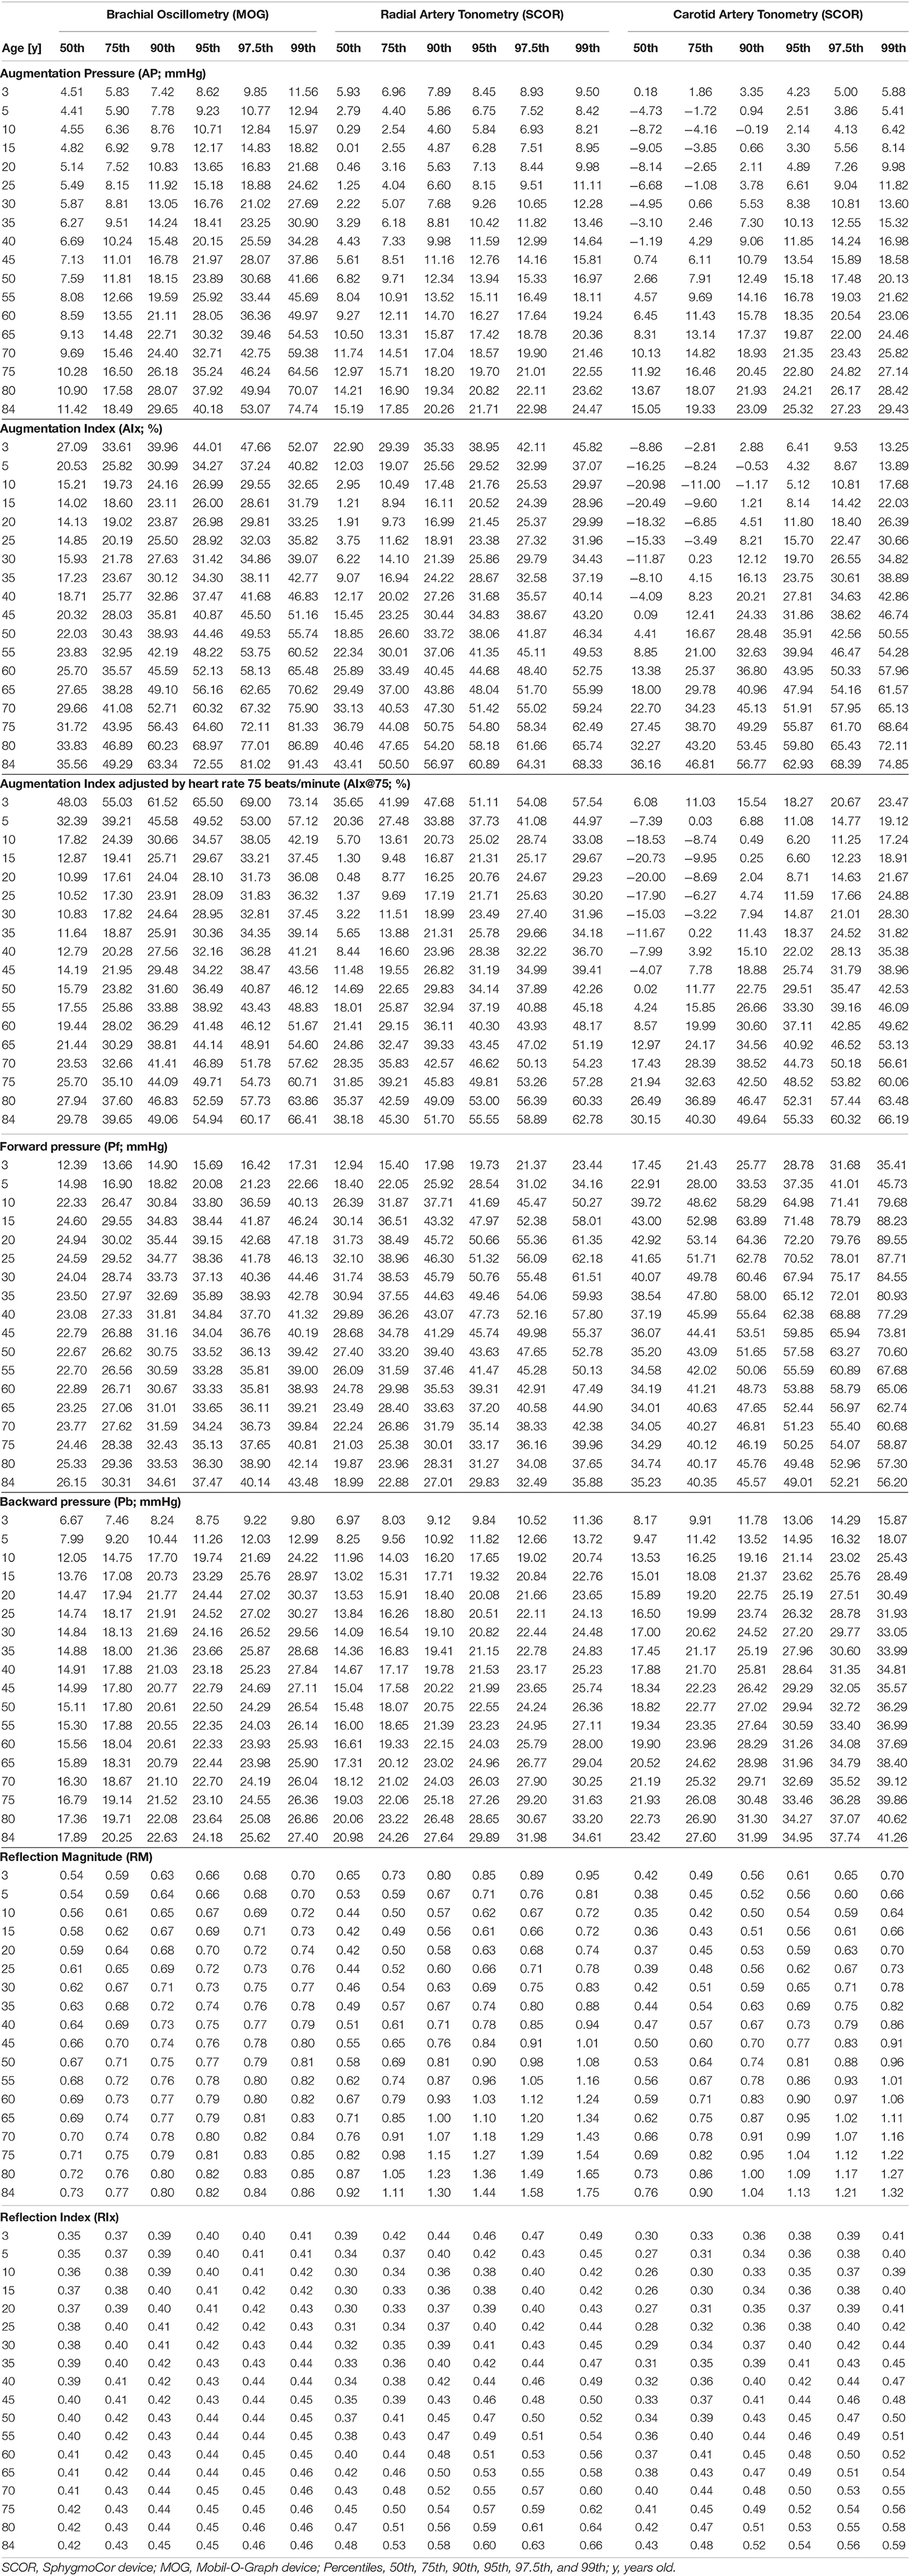
Table 4. Age-related reference intervals for central waveform-derived indexes (All: Females and Males).

Table 5. Body height-related reference intervals for central waveform-derived indexes (All: Females and Males).
The minimum sample size required was 377 (Bellera and Hanley, 2007). Like in previous works and according to the central limit theorem, normal distribution was considered (considering Kurtosis and Skewness coefficients distribution and sample size >30) (Lumley et al., 2002). Data analysis was done using MedCalc-Statistical software (v.18.5, MedCalc Inc., Ostend, Belgium) and IBM-statistical package for the social sciences (SPSS) software (v.26, SPSS Inc., IL, United States). PROCESS v.3.5 (SPSS extension) was used for moderation (interaction) analysis (Hayes, 2020). A p < 0.05 was considered statistically significant.
Results
Agreement of Waveform-Derived Indices Obtained From Carotid, Radial, and Brachial Recordings
Table 3 (Supplementary Table 4) shows correlation coefficients and Bland–Altman analyses carried out to determine the agreement between data of a “similar waveform-derived index” obtained with different devices and/or approaches. Although the associations between indexes (e.g., Pb obtained with different approaches) were significant (95% CI did not cross zero), they were “weak” or “moderate.” Then, regardless of whether AP, AIx@75, Pf, Pb, RM, or RIx were considered: (i) the levels of association were always statistically significant and (ii) in all cases, concordance correlation coefficients showed low agreement between data (values were always <0.66). For instance, concordance correlation coefficients [95% CI] were 0.43 [0.38–0.47], 0.30 [0.25–0.35], and 0.62 [0.59–0.64] for the association between (i) Pb_MOG and Pb_SCOR_Radial, (ii) Pb_MOG and Pb_SCOR_Carotid and (iii) Pb_SCOR_Radial and Pb_SCOR_Carotid, respectively. It is to note that the highest levels of association were obtained when analyzing carotid and radial tonometry data (SCOR_Radial and SCOR_Carotid), whereas data from brachial oscillometry (MOG) and carotid tonometry (SCOR_Carotid) showed the lowest levels of association (Table 3 and Supplementary Table 4).
Bland–Altman tests showed not only significant systematic, but also proportional differences (errors). Then the differences varied in magnitude depending on the index values (Table 3 and Supplementary Table 4). The highest systematic (mean) errors were obtained when analyzing agreement between MOG and carotid tonometry (SCOR_Carotid). As a result, specific RIs for all the waveform-derived indexes obtained were defined as necessary.
Age-, Sex-, and/or Body Height-Related Differences
Age, BH, and/or sex-specific RIs for a given waveform-derived index (e.g., AIx@75) may (or may not) be required, depending on the approach used for its measurement (MOG vs. SCOR_Carotid vs. SCOR_Radial). For instance, Pb_MOG was independently associated with sex and BH, but not with age. In turn, Pb_Radial_SCOR and Pb_Carotid_SCOR showed independent associations with age and BH (but not with sex). AIx@75_MOG was independently associated with sex and age (and BH), without age-dependent changes in the association with sex (non-significant Johnson-Neyman regions).
On the other hand, AIx@75_SCOR_Radial and AIx@75_SCOR_Carotid were associated with age, but not with sex, but in subjects aged 7–8 y and older, sex moderated the “AIx@75-age” association. Regardless of the method (MOG or SCOR) considered, RM and RIx were not independently associated with sex. However, for SCOR_Radial and SCOR_Carotid records, in subjects aged 17 years and older, sex moderated the relationship with age.
Regardless of the measurement method, almost all waveform-derived indexes showed an independent association with age and BH (and/or an association through their interaction with sex). Consequently, both age- and BH-related RIs were necessary. In contrast, we identified waveform-derived indexes that: (i) required sex-specific RIs only from a certain age (e.g., AP_SCOR_Radial) or BH (e.g., Pf_SCOR_Radial), (ii) required sex-specific RIs regardless of age or BH (e.g., Pf_MOG, Pb_MOG), (iii) did not require sex-specific RIs (e.g., Pb_SCOR_Radial), or (iv) did not require sex-specific and/or BH-related RIs (e.g., RI_MOG) (Supplementary Tables 5–11).
Age-, Sex-, and/or Body Height-Related Reference Intervals
Year-by-year (for age) and decimeter-by-decimeter (for BH) RIs data can be found in Supplementary Tables 14–139. Supplementary Materials 2 and 3 show age-related (Supplementary Figures 1–21) and BH-related (Supplementary Figures 22–42) percentile curves for waveform-derived indexes. Tables 4, 5 show a summary (5 y and 1 decimeter intervals) of age- and BH-related RIs data for each waveform-derived index.
Comparisons of data from this study (p50th for all subjects), with data obtained by other authors (p50th or mean value), are shown in Figures 3–6.
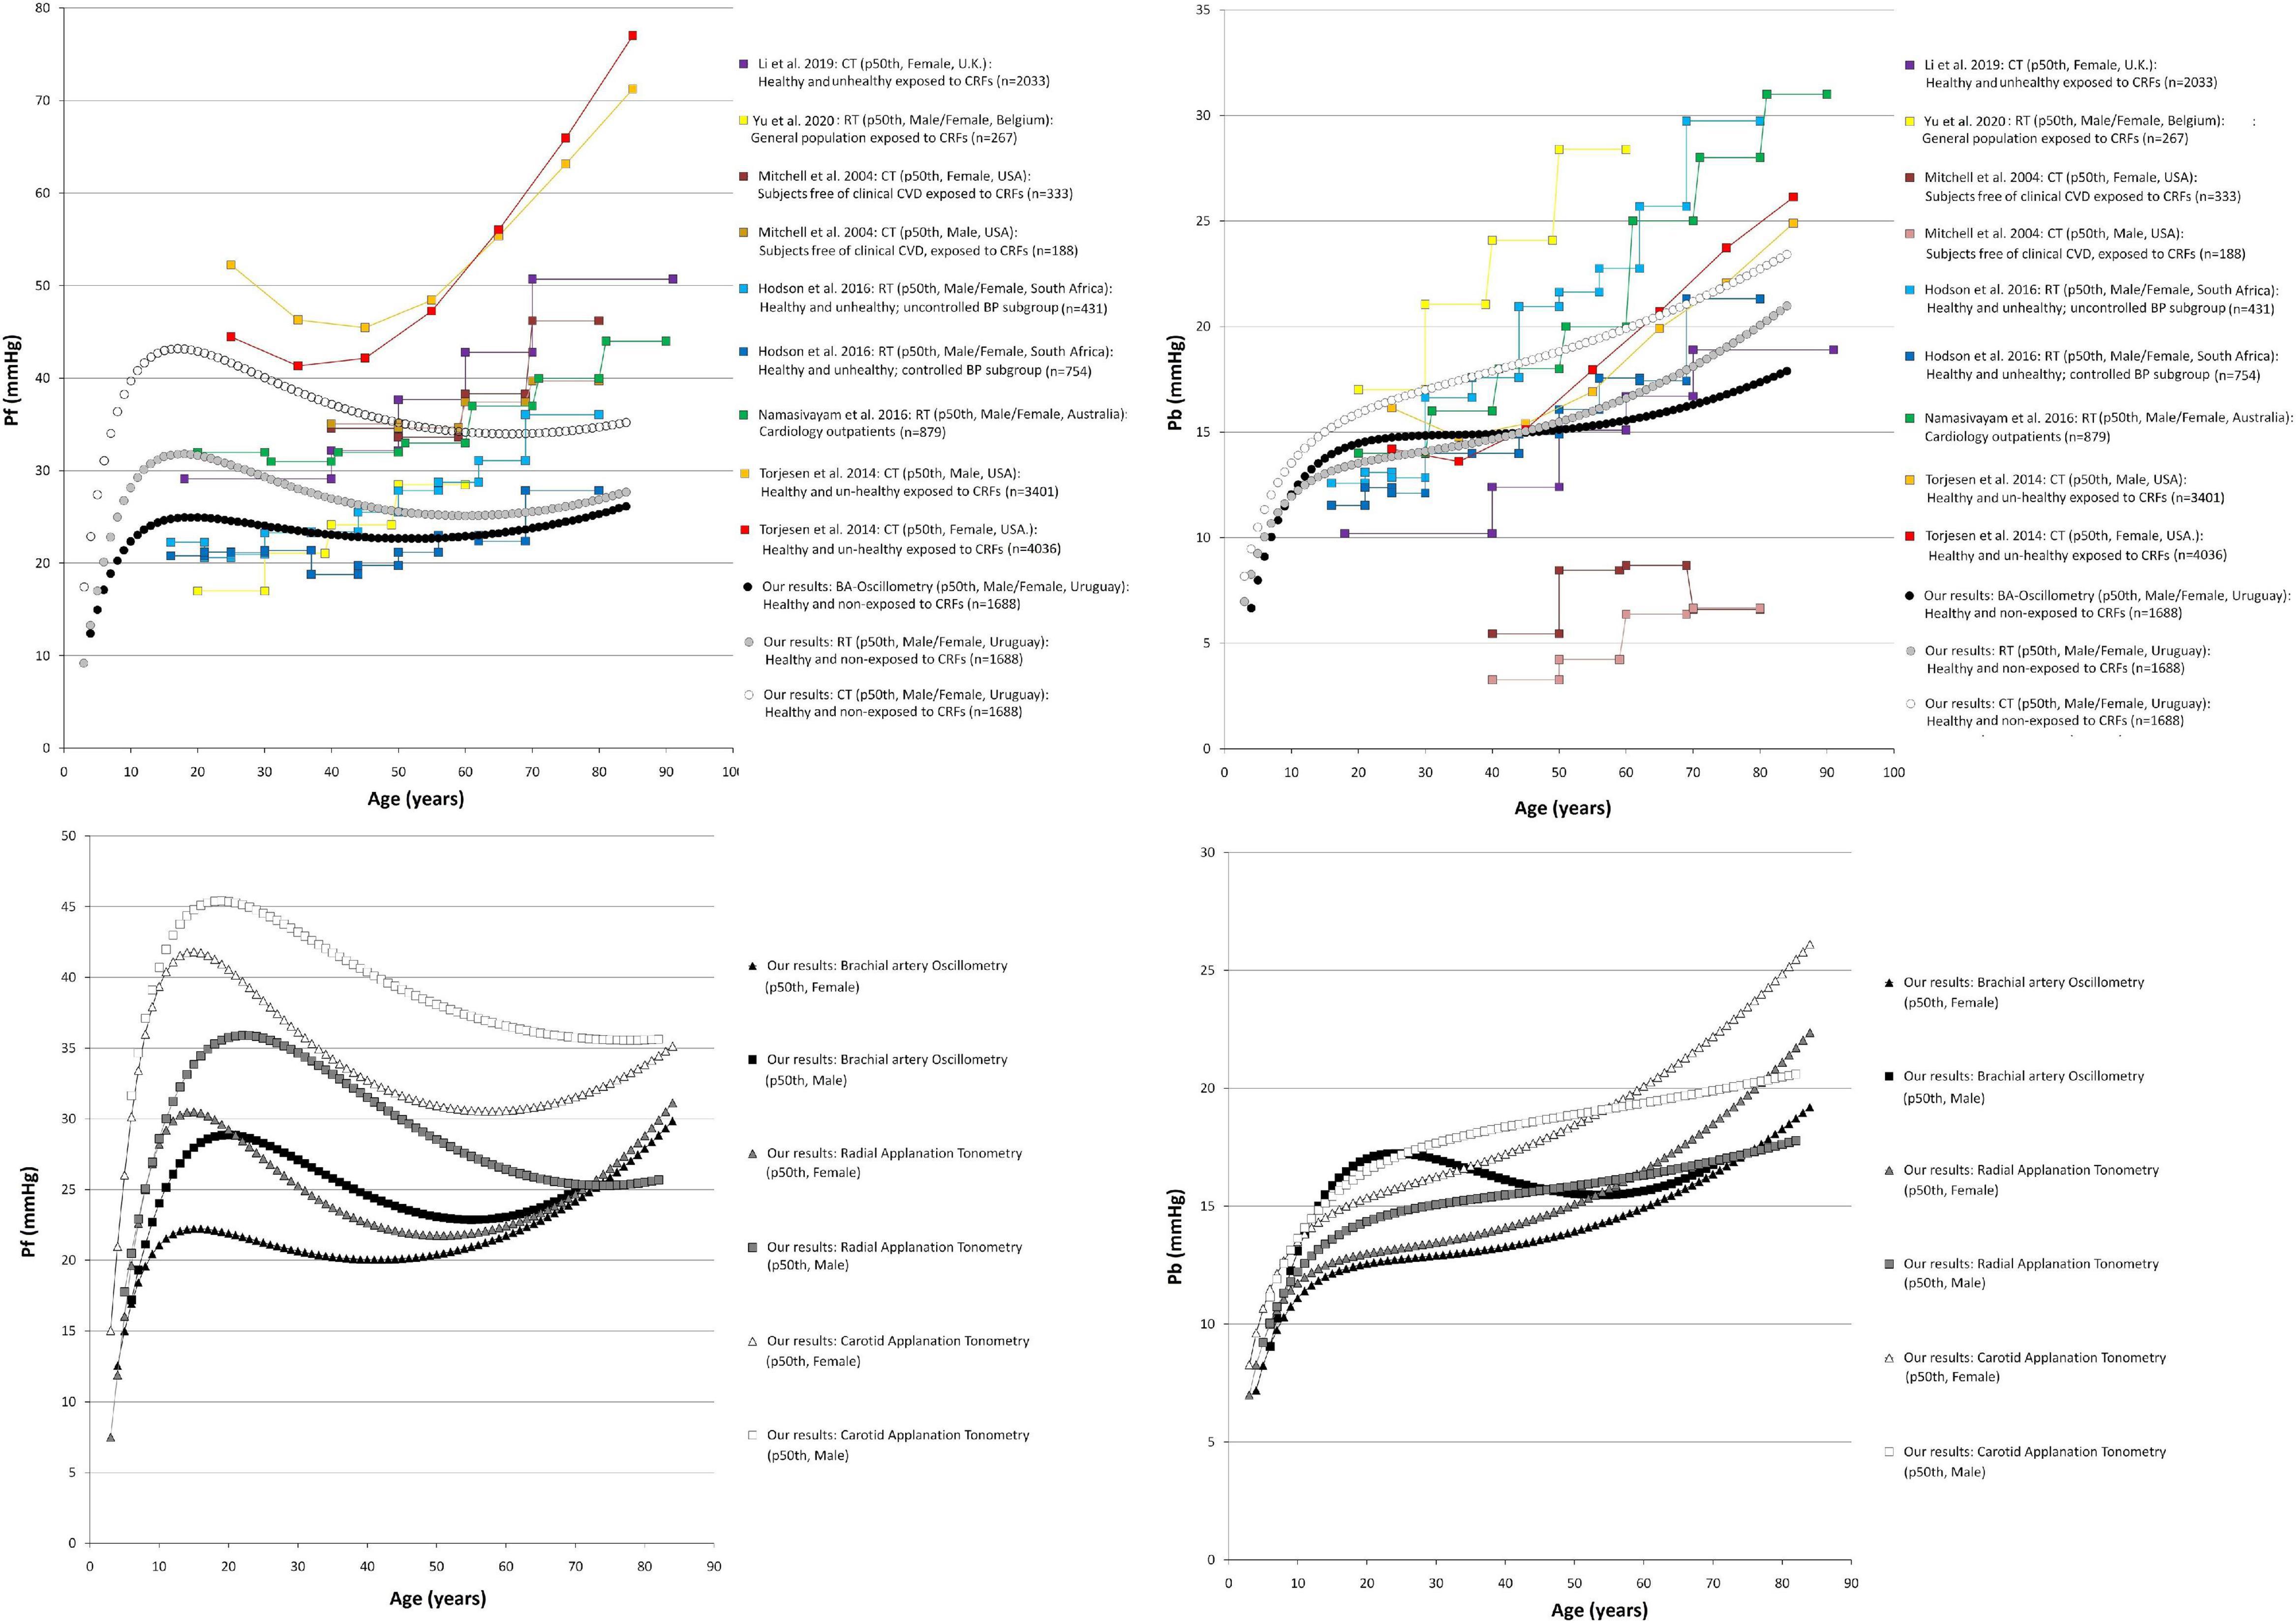
Figure 3. Forward pressure (Pf) and backward pressure (Pb) age-related profiles. Top: Comparison between curves obtained in our study (p50th) and mean values or p50th obtained by other authors. CT, carotid applanation tonometry; CRFs, cardiovascular risk factors; RT, radial applanation tonometry; U.K., United Kingdom; United States, United States of America; BP, blood pressure; BA, brachial artery; Bottom: Age-related profiles (p50th) for males and females.
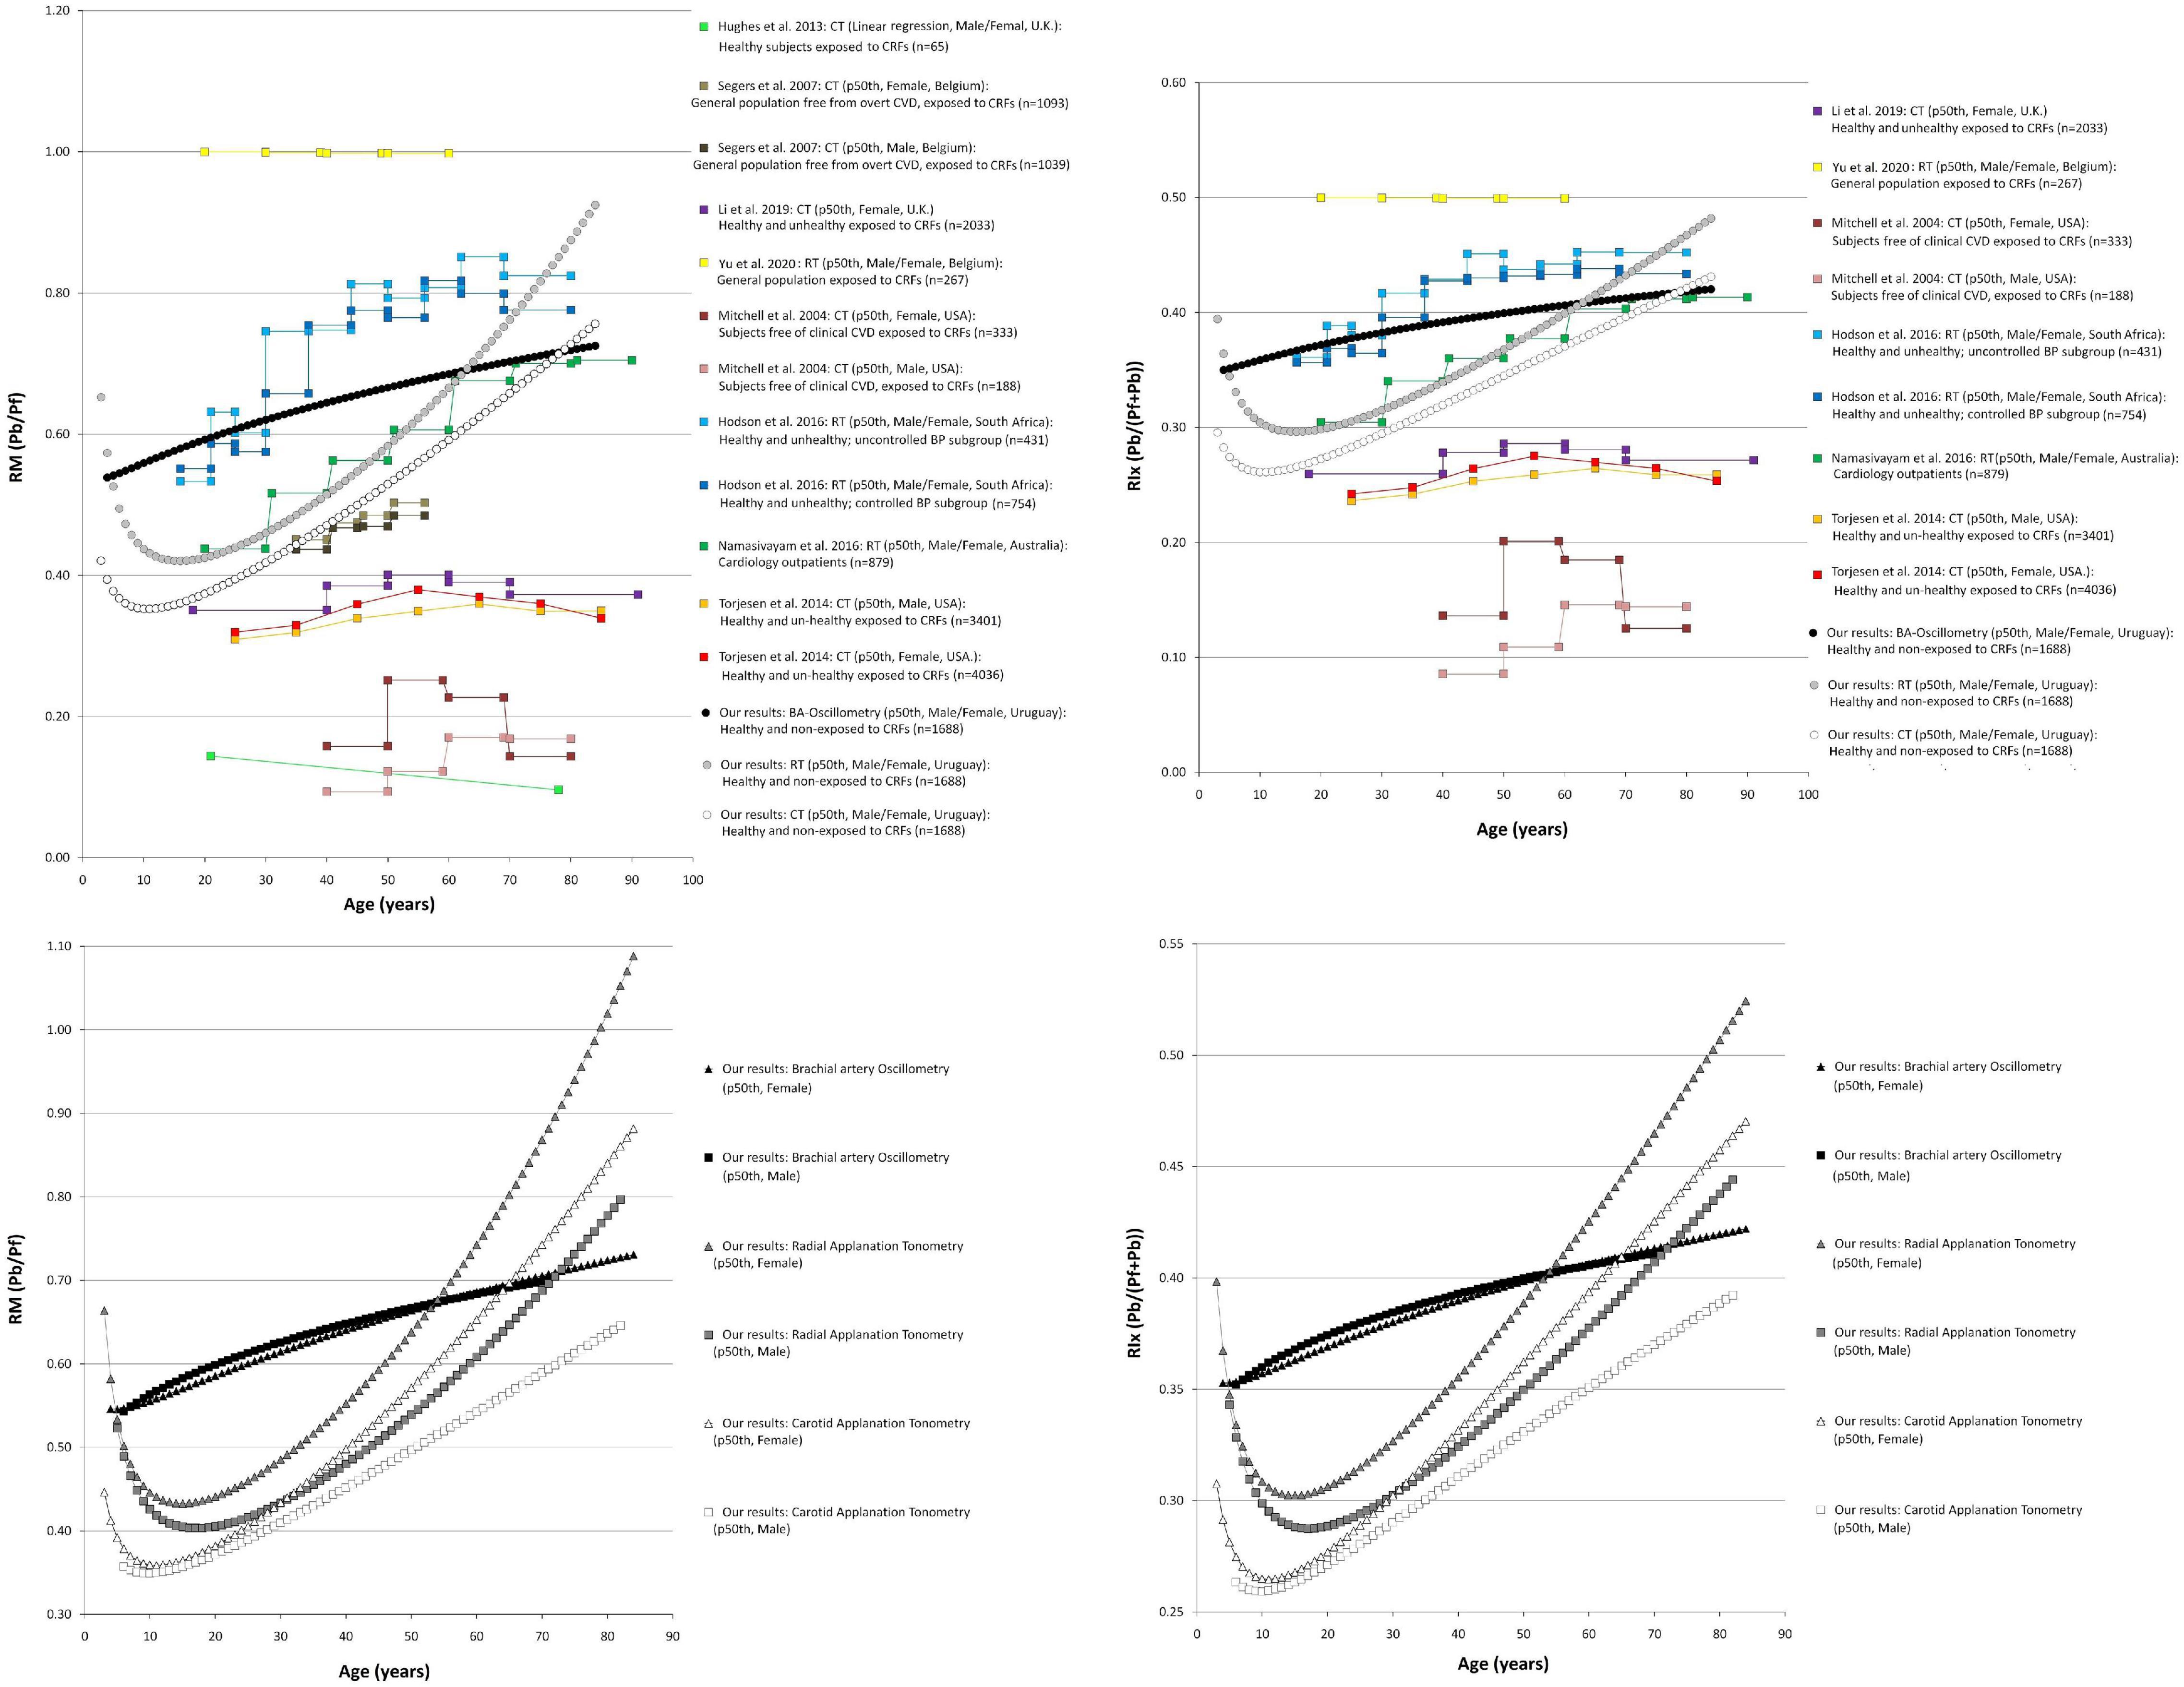
Figure 4. Reflection magnitude (RM) and Reflection index (RIx) age-related profiles. Top: Comparison between curves obtained in our study (p50th) and mean values or p50th obtained by other authors. Pb and Pf, backward and forward pressure; CT, carotid applanation tonometry; CVD, cardiovascular disease; CRFs, cardiovascular risk factors; RT, radial applanation tonometry; U.K., United Kingdom; United States, United States of America; BP, blood pressure; BA, brachial artery. Bottom: Age-related profiles (p50th) for males and females.
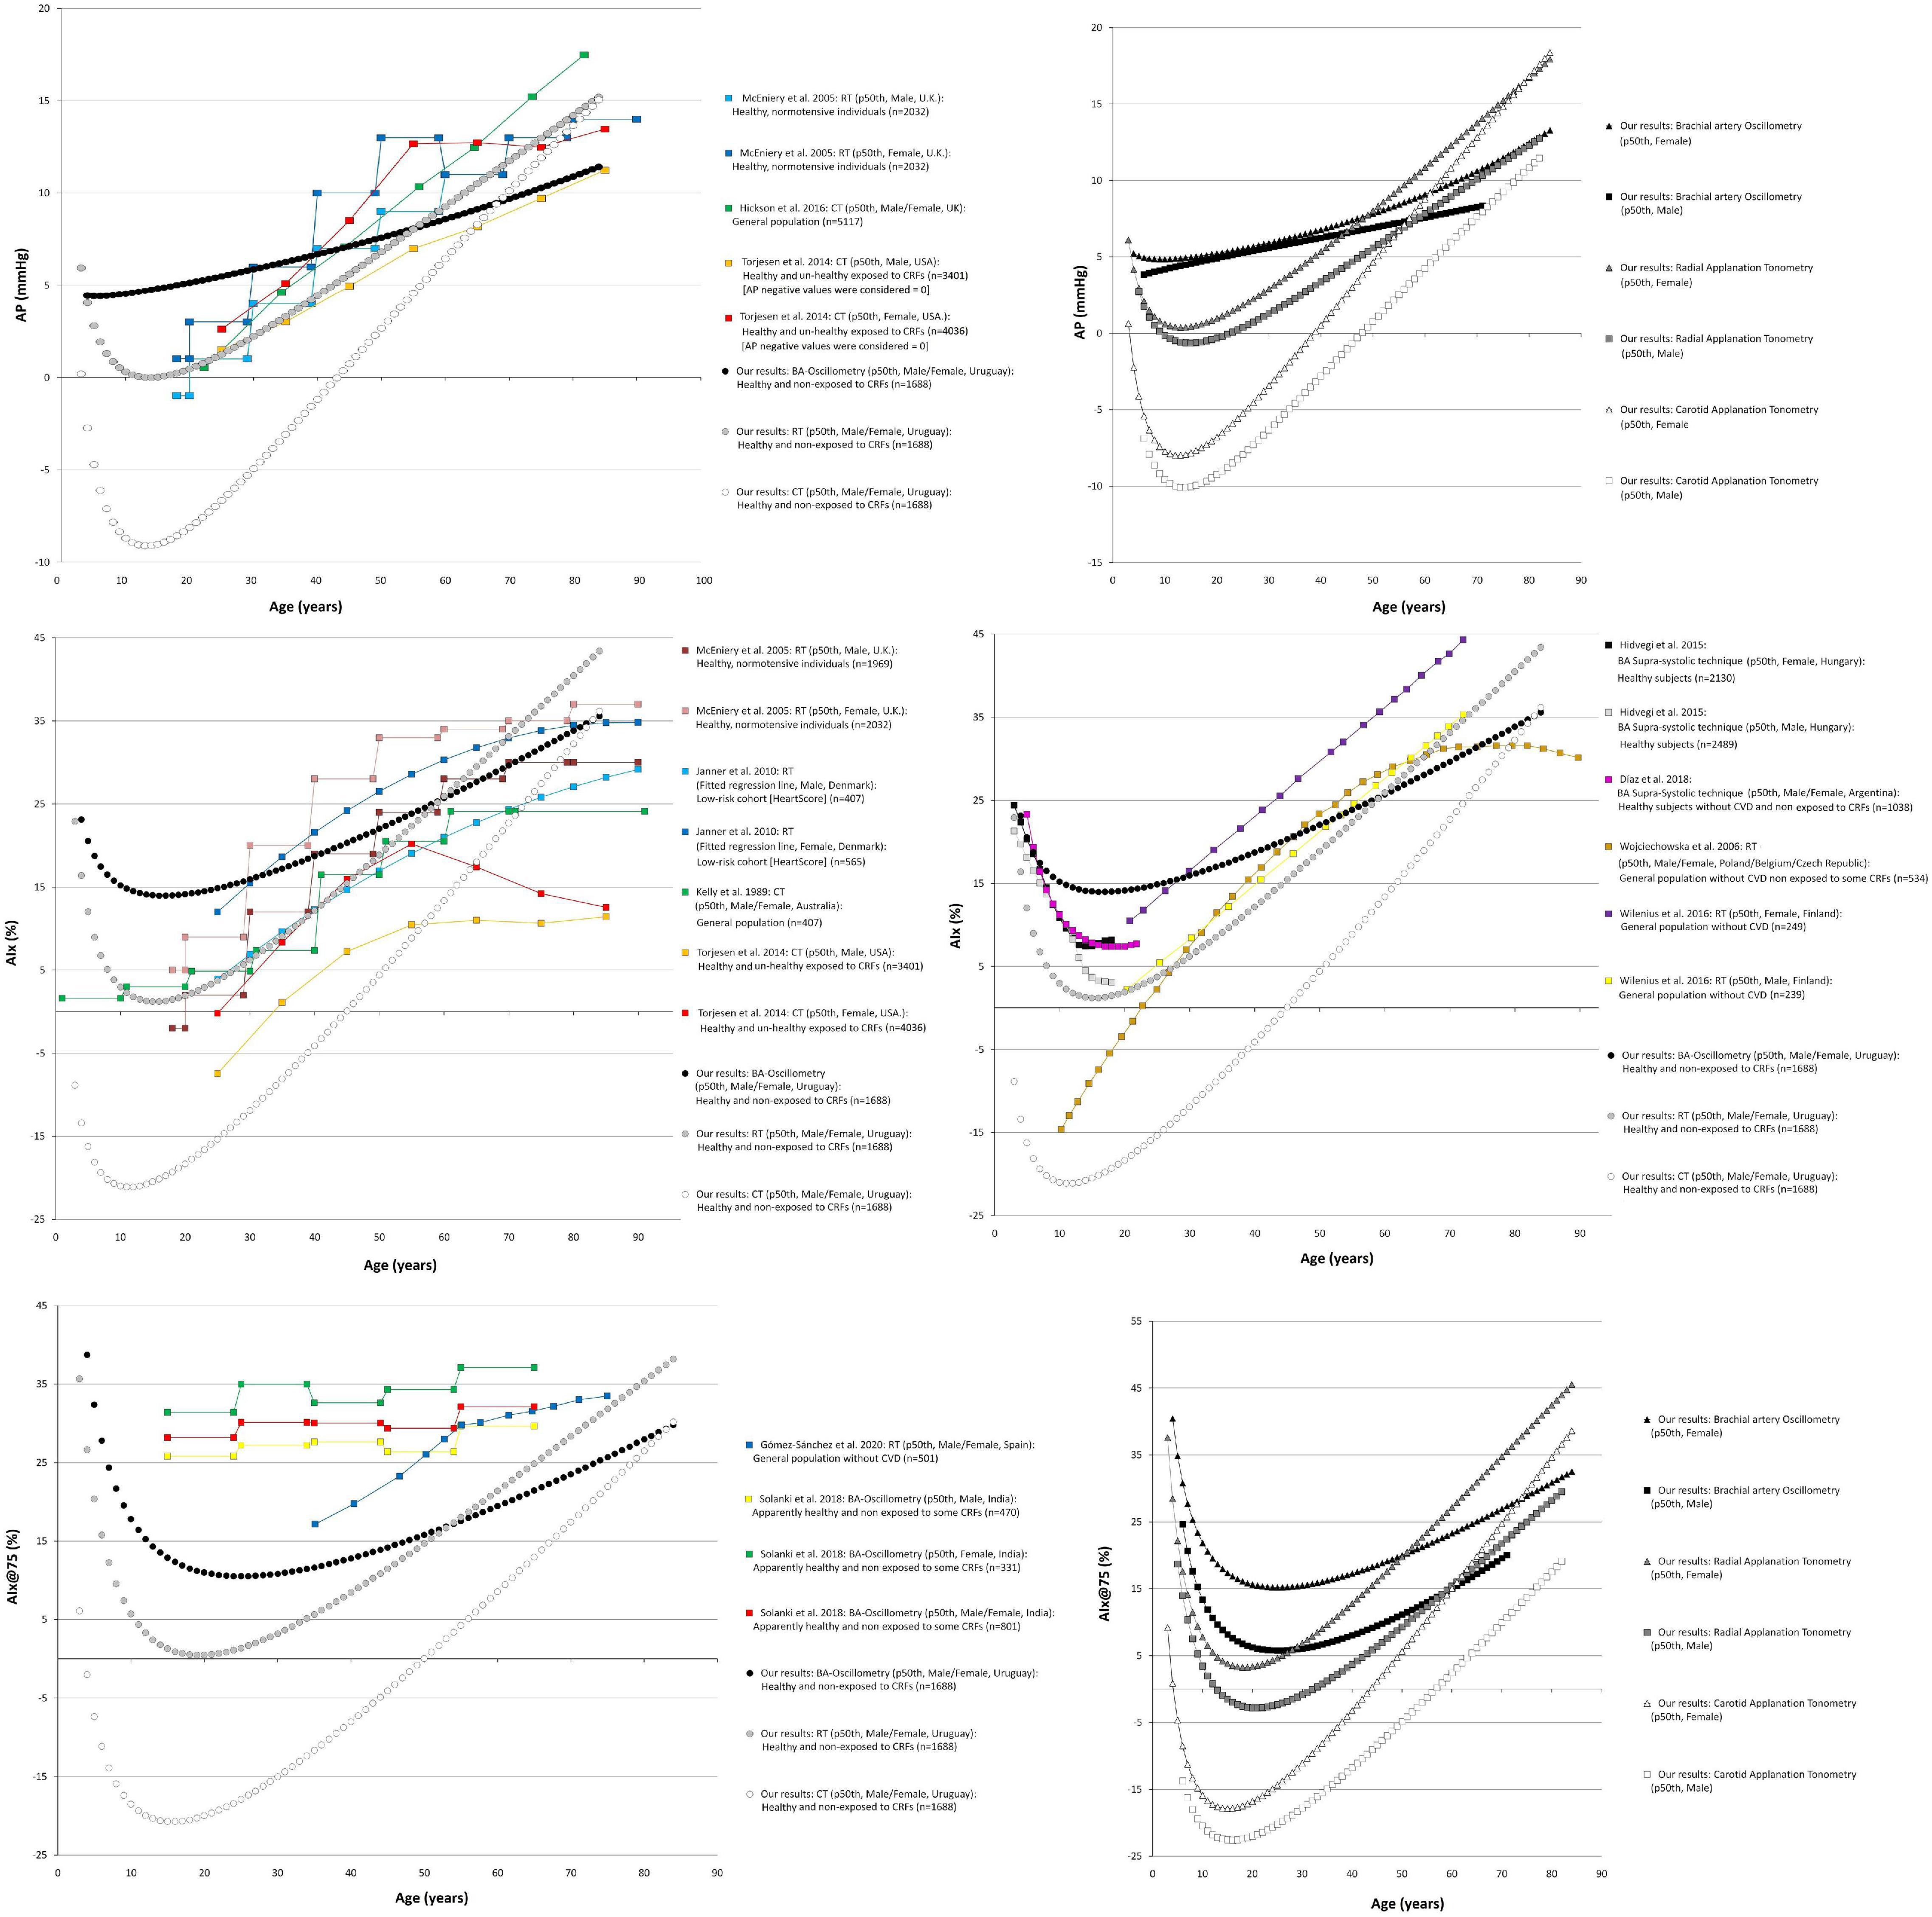
Figure 5. Augmentation pressure (AP), Augmentation Index (AIx), and heart rate-corrected AIx (AIx@75) age-related profiles. Left and right middle panel: Comparison between curves obtained in our study (p50th) and mean values or p50th obtained by other authors. CT, carotid applanation tonometry; CVD, cardiovascular disease; CRFs, cardiovascular risk factors; RT, radial applanation tonometry; U.K., United Kingdom; United States, United States of America; BP, blood pressure; BA, brachial artery. Right top and bottom panel: Age-related profiles (p50th) for males and females.
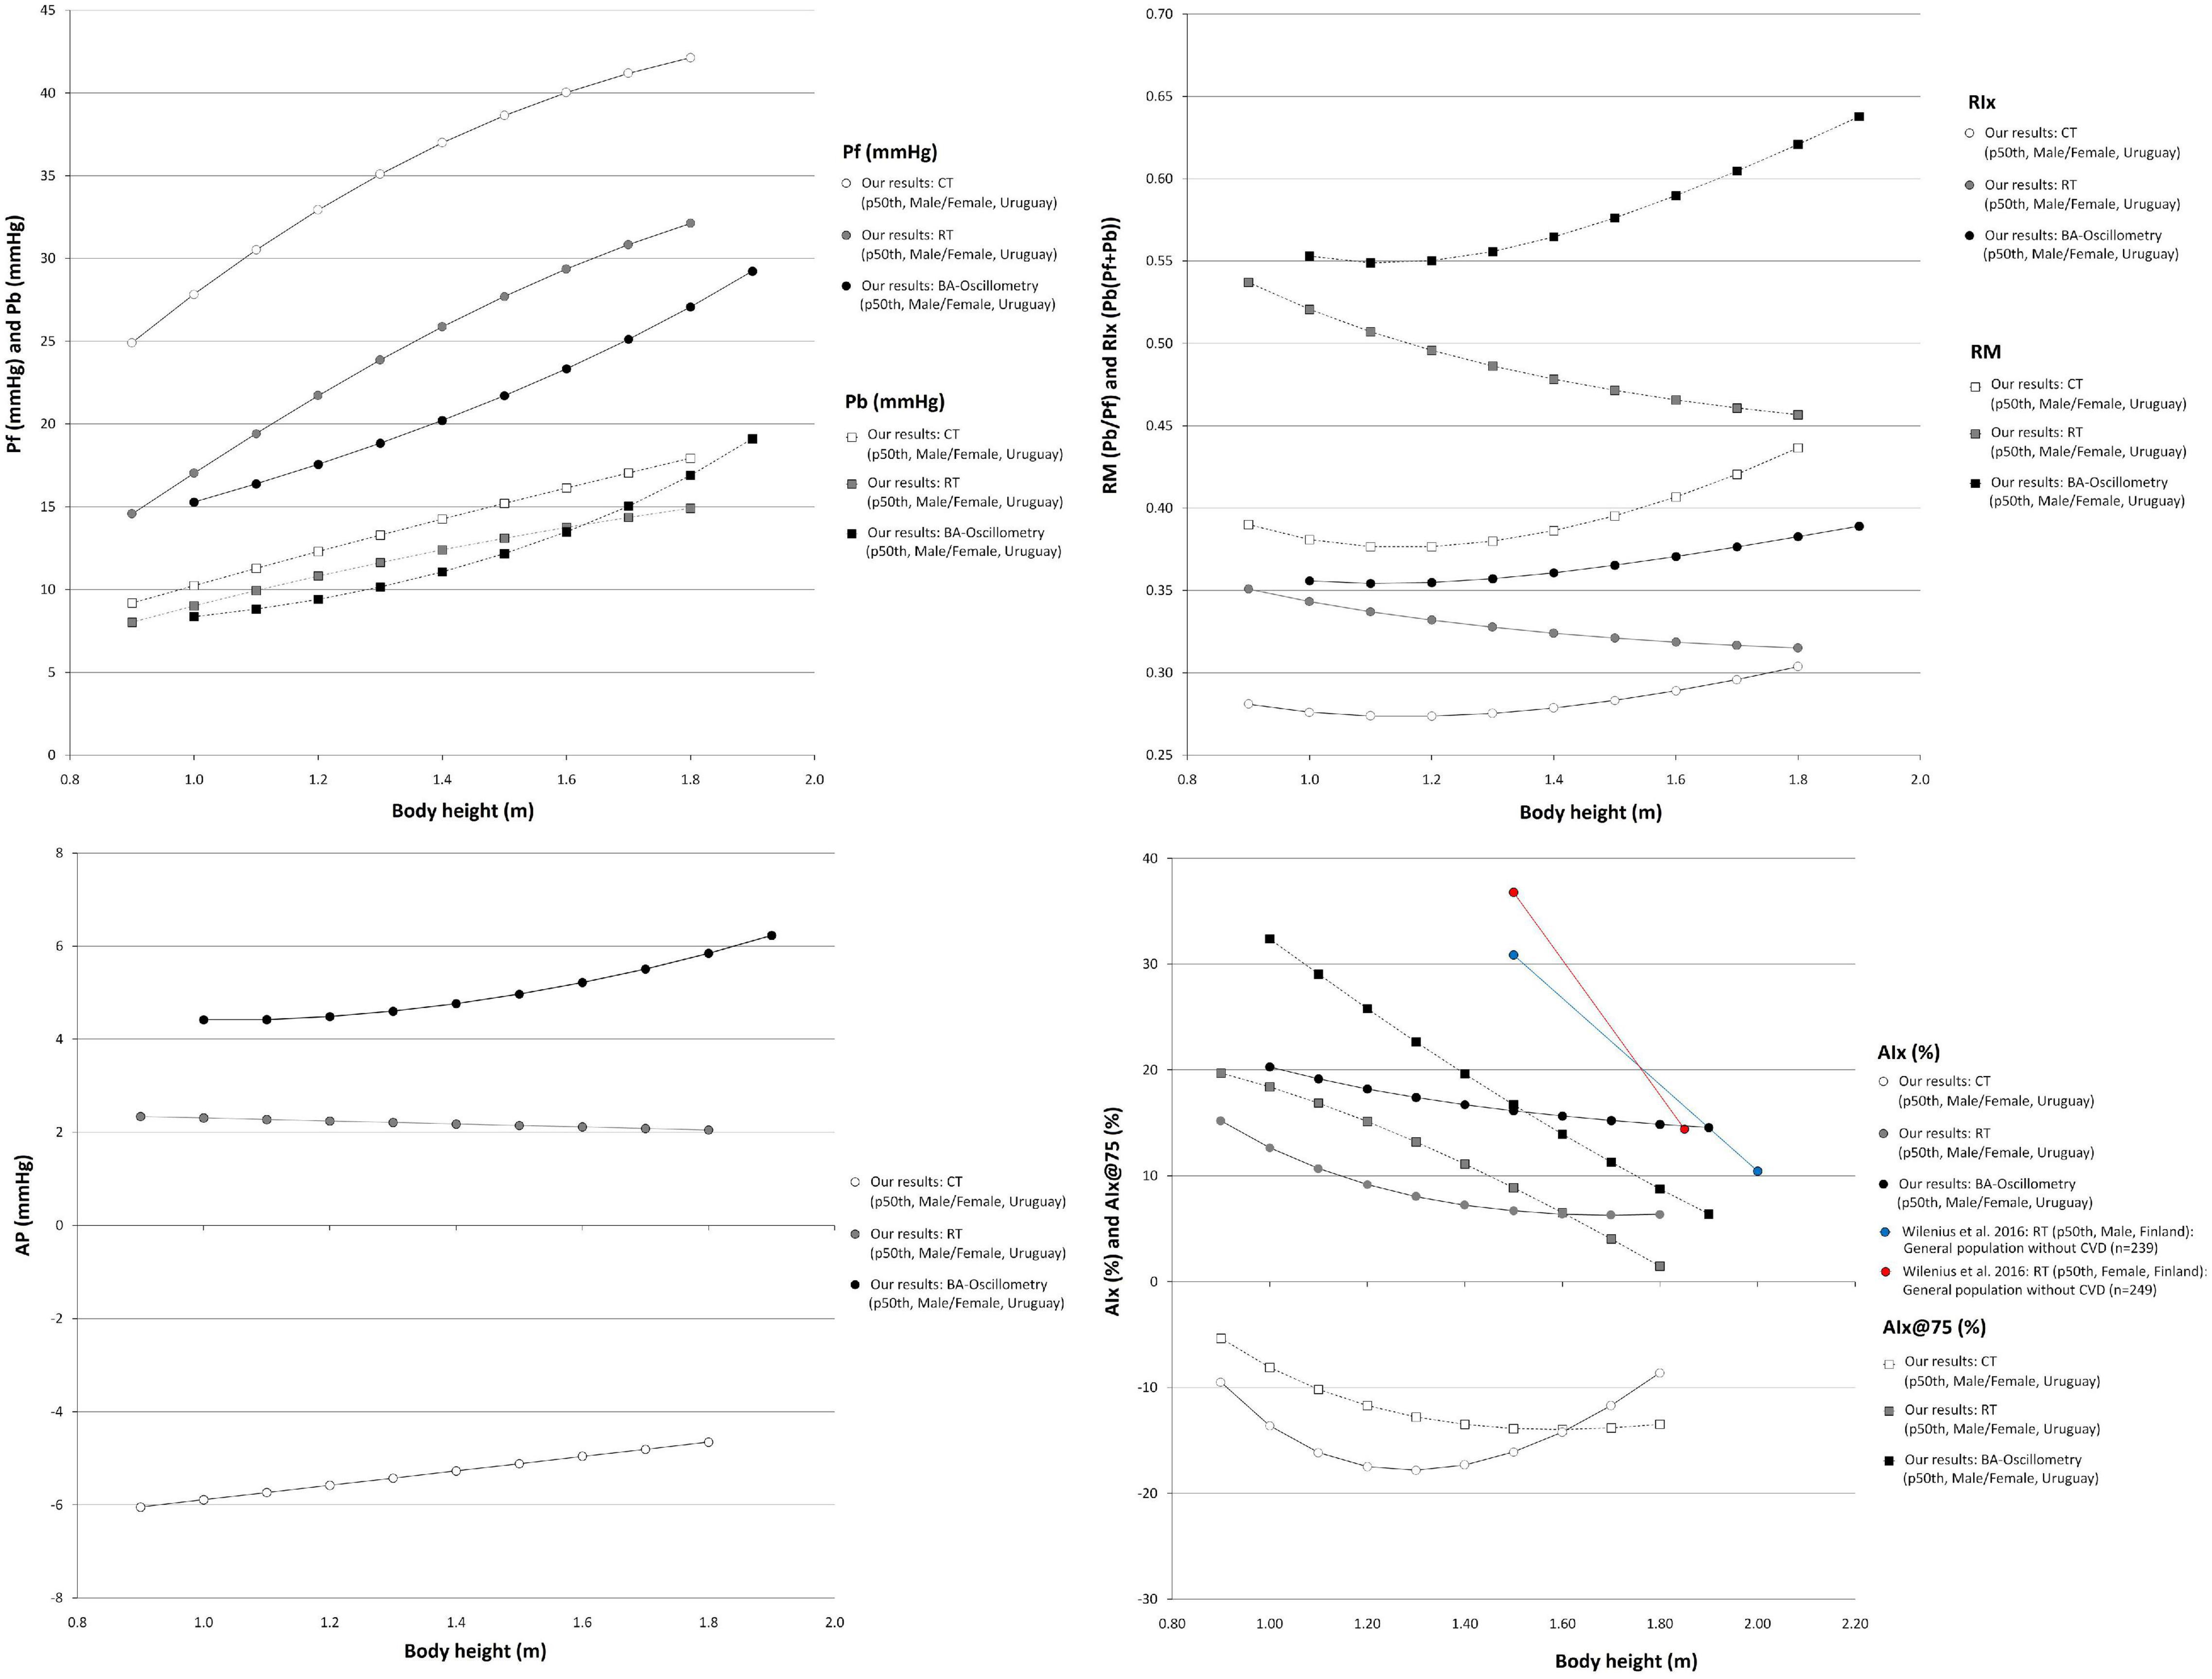
Figure 6. Waveform-derived indexes body height-related profiles. Comparison between curves for waveform derived indexes obtained in our study (p50th) using three different approaches. Pf, Forward pressure; Pb, Backward pressure; RM, Reflection magnitude; RIx, Reflection index; AP, Augmentation pressure; AIx and AIx@75, Augmentation index and heart rate-corrected AIx; CT, carotid applanation tonometry; CVD, cardiovascular disease; RT, radial applanation tonometry; BA, brachial artery.
Discussion
Main Findings
Considering their demonstrated value (e.g., as prognostic tool), there is growing interest in assessing central BP waveform-derived indexes in clinical practice. Their accurate clinical use requires knowing their physiological age-related profiles and the expected values for a specific subject. To our knowledge, this is the first time RIs for different waveform-derived indexes (obtained from different widely used measurement approaches) were defined (at the same time) in large population of healthy children, adolescents, and adults (2–84 y). The main findings can be summarized as follows:
First, methods used to quantify aoBP waveform-derived indexes (brachial oscillometry; carotid and radial tonometry) showed mostly little (statistically significant) association with each other. Furthermore, in no case, the association was very strong (r ≥ 0.80) (Table 3). Methodological approaches used to quantify similar waveform-derived indexes (e.g., Pb) were not equivalent, but showed systematic and proportional errors (Table 3).
Second, the need for sex-specific RIs relied on both physiological (e.g., age and/or waveform-derived index) and non-physiological factors (e.g., methodological approach used) (Supplementary Table 11). Then, the associations of a given arterial propagate property (e.g., reflection coefficient) with subjects’ characteristics (e.g., sex, age) could vary depending on the approach used in the evaluation.
Third, the population-based RIs for waveform-derived indexes were defined from data obtained in the same group of healthy children, adolescents, and adults (Tables 4, 5 and Supplementary Tables 14–139). Defining RIs is an important step when considering the use of waveform-derived indexes in laboratory and clinical practice, for example, as a tool to identify conditions associated with data deviation from anticipated values in physiological settings and/or to detect subclinical target organ (vascular) damage.
Fourth, aiming at contributing with other groups and/or researchers, sex-specific BH- and age-related equations for mean value, SD, and percentile values were included in text and spreadsheet formats (Supplementary Material 1). Thus, the expected values for a given subject could be calculated.
Wave Separation Analysis-Derived Indexes: Forward Pressure, Backward Pressure, Reflection Magnitude, and Reflection Index
Age-Related Profiles
The age-related profiles obtained for WSA-derived indexes showed similarities and differences with data reported by other authors (Figures 3, 4). However, it is to note that although some articles showed age-related changes in waveform-derived indexes, data from large populations of healthy subjects, with minimized exposure to traditional CRFs, are scarce, limiting the possibility of comparing our findings with those of other authors. Moreover, we found no work including children, adolescents, and adults.
Regardless of the methodological approach considered, the Pf increased in childhood and adolescence, reaching a maximum at ∼20 y. Thereafter, it remained stable and finally showed a tendency to increase after 60–70 y (Figure 3). At least in theory, the significant increase in Pf during childhood and adolescence could be related to (explained by) changes in stroke volume. In this regard, it was previously described that early in life, there is a rapid increase in stroke volume, reaching a peak at ∼20 y, followed by a slow decline from the beginning of the third decade of life (Cattermole et al., 2017; Zócalo et al., 2020). The (relative) Pf stability observed within the range of 30 and 60 y of age is in agreement with previous findings in subjects with controlled and uncontrolled blood pressure (Hodson et al., 2016), in healthy and unhealthy subjects (Li et al., 2019) and in subjects with cardiovascular disease (Namasivayam et al., 2016). On the other hand, whereas in this work, the increase in Pf after 70 y of age was discrete, works that included subjects with cardiovascular disease and/or exposed to CRFs described a greater (steeper) increase (Figure 3). At least in theory, the dissimilar findings could be explained by a cumulative effect of cardiovascular disease and/or CRFs on Pf determinants (e.g., aortic root impedance). In this regard, in Hodson et al. work, it was observed that compared with subjects with controlled blood pressure, those with uncontrolled pressure showed almost identical Pf (and Pb) levels at early ages (e.g., <21, 21–25, and 30–37 y). Subsequently, the Pf levels were gradually higher in subjects with uncontrolled blood pressure (with the differences being statistically significant from ∼45 y) (Figure 3; Hodson et al., 2016). In addition, since the Pf component actually integrates forward wave and re-reflections of backward waves at the ventricular-aorta interface, the increase in Pf could also be explained by increased reflections (and the subsequent increase in re-reflections). In this regard, it should be noted that aging has been associated with arterial stiffening and increased wave reflections. Finally, it is worth noting that despite of the differences in Pf values, the different methodological approaches considered enabled to obtain similar age-related profiles.
Taking into account the above mentioned, the differences in Pf values among studies could be explained (at least partially) by differences in the calibration methods, methodological approaches, and/or subjects considered.
Similarly, Pb showed a significant rate of increase in the first decade of life, and then it continued to increase steadily throughout life. The age-related profiles obtained for adults are in agreement with data from other works. However, the age-related increase in Pb observed in this work was (apparently) smaller compared with data from other works. Furthermore, for young subjects (e.g., 20–30 y), data from this and other works overlapped, but the maximum values reported by other authors for old subjects (e.g., 80–90 y) were almost always higher than the observed in this work (Figure 3). The differences could be ascribed to differences in the populations studied (Figure 3). In this regard, it is to note that this work was carried out in healthy subjects with minimized exposure to risk factors.
Jointly considering the above factors, it could be said that more flattened curves would be expected for both Pf and Pb in adults without cardiovascular disease and minimally exposed to traditional CRFs. Finally, the differences in the rate of Pf and Pb change observed in adults in this work are consistent with data from other studies (Cecelja et al., 2009; Namasivayam et al., 2009, 2016).
The age-related changes in RM (Pb/Pf) and RIx [Pb/(Pf + Pb)] showed great heterogeneity (Figure 4). Both RM and RIx tend to increase in adult life, but the rate of increase differed depending on the methodological approach considered (MOG or SCOR). In addition, while RM and RIx obtained with tonometry (SCOR) showed a reduction in the first years of life and started to increase after the age of 10 y, the data obtained from MOG increased through all the age-range considered (Figure 4). The finding of an age-related increase in RM and RIx is in agreement with other authors (Segers et al., 2007; Hodson et al., 2016; Namasivayam et al., 2016). On the other hand, Torjesen et al. (2014) and Li et al. (2019) reported a slight increase in RM and RIx until ∼60 y, followed by a subsequent reduction. In turn, Hughes et al. (2013) (in a small sample of subjects exposed to CRFs) found an age-associated decrease in RM. Finally, there were differences in RM and RIx data among works, even at ages in which neither the cardiovascular disease presence nor the exposure to CRFs could contribute to explain them (e.g., RM values equal to ∼1.0 [Yu et al., 2020], 0.55 [Hodson et al., 2016], 0.45 [Namasivayam et al., 2016], 0.35 [Li et al., 2019], and 0.15 [Hughes et al., 2013] were observed in subjects aged ∼20 y) (Figure 4).
Sex-Related Differences
Data from multiple linear regression models (Supplementary Table 11) and age-related profiles (Figures 3–5) showed that the association between waveform-derived indexes (Pf, Pb, RM, and RIx) and sex differed depending on the approach considered.
Figure 3 shows that after approximately 10–15 y, the p50th for Pf and Pb was higher in males than in females, but Pf values tend to be similar at ages over 70 y. In turn, for subjects over 50–60 y, the Pb values were higher in females than in males (Figure 3). In regression analysis, adjusted by BH, the Pf and Pb remained associated with sex only when considering data from MOG. This is in agreement with other authors (Lieber et al., 2010; Liao et al., 2011; Hughes et al., 2013).
The above data should be carefully analyzed. Whereas we (and other authors) analyzed Pf and Pb and absolute values, and other authors analyzed waveform components in terms relative to aoPP. In subjects younger than 60 y of age, Namasivayam et al. found that both incident and reflected waves showed a greater contribution to the age-related increase in aortic pressure in females than in males (Namasivayam et al., 2009; Torjesen et al., 2014; Hodson et al., 2017). Our curves for RM and RIx (indexes that allow relativizing Pb amplitude) tended to be higher in females from ∼20 y; except for MOG-derived data (Figure 4). Opposite to the described levels for Pf and Pb, RM and RIx levels obtained with SCOR showed sex-related differences (higher values in females), from 13.5 to 12.6 y for SCOR_Radial and from 17.1 to 17.2 y for SCOR_Carotid. Our findings add to those reported by Namasivayam et al. (2009). These authors found that the higher relative contribution of Pb in females would be observed from ∼12 to ∼17 y for radial and carotid recordings, respectively. Additionally, the authors described that the sex-related differences remained thorough adult life.
The similarity observed in girls and boys agrees with previous works that reported no sex-related differences in structural and functional arterial parameters at prepubertal ages (4–8 y), but showed sex-related differences in adolescents (∼15 y) (Curcio et al., 2016).
Body Height-Related Profiles
Regardless of the methodological approach considered, and with independence of sex and age, Pf and Pb were positively associated with BH (Figure 6 and Supplementary Table 11). In turn, RM and RIx data obtained with MOG did not show an independent association with BH, whereas SCOR-derived RM and RIx data were independently associated with BH (higher BH, lower RM and RIx) (Supplementary Tables 9, 10). The negative association of BH with RM and RIx could be explained (at least partially) by the well-known inverse relationship between the magnitude of reflections measured at the central aorta and the distance between the site of wave generation (heart) and reflection (which move away as BH increases).
Our findings could be considered opposite to that reported by Hughes et al. (2013) who did not find association between RM and BH in healthy normotensive subjects (n = 65; 21–78 y; 43 male) evaluated with carotid tonometry. However, the results were alike when considering the association of BH with RM and RIx data obtained with SCOR_Carotid without adjusting for cofactors (Figure 6; note the flattened profiles).
Pulse Wave Analysis-Derived Indexes: Augmentation Pressure, Augmentation Index, and Augmentation Index Corrected for Heart Rate 75 Beats/Minute
Age-Related Profiles
Like in previous works, the AP showed an age-related increase in adults (Figure 5). When considering SCOR data, it was observed as a decrease in AP during childhood and adolescence and an increase from the age of ∼15 onward. The AP levels obtained with MOG showed an increase from childhood onward. Additionally, there were differences in the AP levels obtained with the different methodological approaches (Figure 5).
Regardless of the methodological approach considered, the AIx and AIx@75 showed a reduction in childhood and adolescence, but they increased from ∼10–15 y onward (Figure 5). This is in agreement with previous findings in children and adolescents (Hidvégi et al., 2015; Díaz et al., 2018), and in adults (McEniery et al., 2005). We found a linear relationship with age that did not become non-linear in subjects aged 70 y and older as was described by other authors (McEniery et al., 2005). The dissimilar findings could be explained by differences in studied subjects’ characteristics (e.g., we evaluated healthy subjects minimally exposed to traditional CRFs, whereas other authors included subjects with extensive exposure to CRFs) and/or by demographics differences between the populations considered. About this, Janner et al. (2010) found that the association between AIx and age became progressively less linear (above 60–70 y) when considering subjects with increased cardiovascular risk (associated with exposure to CRFs). Other hypotheses have been proposed to explain the findings. Namasivayam et al. suggested that the ratio of two linear relationships, such as AP vs. age and aoPP vs. age, resulted in a curvilinear trend (AIx vs. age). This mathematical phenomenon could contribute to the “flattening” of age-AIx curve (described by other authors) (Hickson et al., 2016).
Finally, it is to note that only few authors reported reference data or age-related profiles for AIx@75. The available works described an age-related increase, but whereas Gómez-Sánchez et al. showed a significant constant increase in AIx@75 with aging (like in this work), and Solanki et al. found a slight age-related increase (Figure 5; Solanki et al., 2018; Gómez-Sánchez et al., 2020).
Sex-Related Differences
The augmentation pressure levels tended to be higher in females than in males (Figure 5), but the differences were statistically significant only in case of SCOR_Radial data from subjects aged > 12.9 y (Supplementary Table 11). This is in agreement with data from other authors (adult subjects) (Mitchell et al., 2004; McEniery et al., 2005; Segers et al., 2007; Torjesen et al., 2014).
Regardless of BH, compared to males, females showed higher AIx and AIx@75 (Figure 5): (i) for all ages when considering MOG records, (ii) from 9.5 and 7.8 y when considering SCOR_Radial records, and (iii) from 2.8 and 7.0 y when considering SCOR_Carotid records (Supplementary Table 11). The finding of higher AIx and AIx@75 in females than in males is in agreement with data from previous works (Mitchell et al., 2004; McEniery et al., 2005; Wojciechowska et al., 2006; Segers et al., 2007; Janner et al., 2010; Hughes et al., 2013; Torjesen et al., 2014; Wilenius et al., 2016; Solanki et al., 2018).
Body Height-Related Profiles
When analyzing the (simple) association between AP and BH data, no clear trend was observed (Figure 6). However, in multivariate analysis, it was observed a negative association between BH and AP. The association was independent of age and sex in case of SCOR and of age for MOG records (Supplementary Tables 8–11). In turn, the AIx and AIx@75 showed a negative association with BH, regardless of sex and age (Supplementary Tables 8–11). This is in agreement with Wilenius et al. (2016).
Strengths and Limitations
Our results should be analyzed in the context of the work’s strengths and limitations. First, since this is a cross-sectional study, it provides no data on longitudinal age-related variations in waveform-derived indexes. Although useful for quantifying RIs, our data do not allow to determine with certainty the true impact of aging on arterial system properties (Campos-Arias et al., 2021). Second, the outcome data were not considered. Thus, cutoff points (e.g., p90th, p95th) could not be selected based on the association with increased cardiovascular risk, but on data distribution in the RIs group. Whether or not the RIs values should be used as cutoff values for central hemodynamic alterations diagnose and/or treatment is not known. Third, in this work, the concept of “waveform-derived index” was mainly presented as “static or unchanged,” rather than the composite of (i) “fixed or stable” (e.g., age-dependent arterial pulse propagation and reflection capabilities) and (ii) “variable or adjustable” (e.g., vascular smooth muscle capability to temporally adjust arterial pulse propagation or reflection properties) (Bia et al., 2003, 2008). Fourth, the RIs subgroup consisted of people whose CRFs levels did not exceed accepted thresholds for abnormality (e.g., hypertensive subjects were excluded). Given that the prevalence of many CRFs increases with age (e.g., arterial hypertension), by definition (older), “superhealthy” individuals would have had a greater possibility of being included in the RIs group. Consequently, at least for adults, this work’s data probably describe an “optimal,” rather than a “typical” aging trajectory.
Fifth, as a strength, in this study, waveform-derived indexes were obtained in a large population sample (of children, adolescents, and adults) that included subjects within a wide age-range (almost the whole range of life expectancy), as a continuum. This would contribute to understand the arterial pulse propagations and their impact on waveform-derived indexes throughout life, providing important information for clinical diagnosis and cardiovascular research. To our knowledge, this is the first study of its sort in South Americans. Sixth, despite we previously demonstrated that aoBP and some waveform-derived indexes could vary depending on the calibration schema considered (Zinoveev et al., 2019), in this work, we opted for the schema most used in the literature (use of baDBP and baMBP). In this regard, it is to note that whereas some indexes do not depend on the calibration schema (e.g., AIx), others are highly dependent on the methodological approach used (e.g., Pf and Pb). Hence, data should be analyzed/used being aware of this. Seventh, it is to note that an accurate optimal analysis of wave reflections would require pressure and flow measurement, rather than BP waveform recording and analysis alone. However, the simultaneous measurement of pressure and flow might not always be feasible. On the other hand, the different approaches used to quantify waveform-reflection indexes may differ in the obtained data (e.g., differences in the algorithms used to analyze the waveform and to identify the “inflection point” may yield different indexes values). In this context, we opted for working with widely used devices and algorithms of analysis (SphygmoCor and Mobil-O-Graph). Finally, it should be noted that while in this work we focused on the most frequently used waveform-derived indexes, we recognize (i) the existence of other indexes and (ii) the limitations of the quantified indexes. For instance, the AIx reflects both cardiac and vascular properties. Hence, it has limitations as a measure of wave reflection (Hughes et al., 2013; Heusinkveld et al., 2019).
Conclusion
This study adds to the knowledge of the physiological variations in waveform-derived indexes and arterial pulse propagative properties that would be expected during growth and aging, analyzing at the same time (and comparatively) the behavior of different indexes, obtained with three different approaches. Our data showed that the methods used to quantify aoBP waveform-derived indexes (brachial oscillometry, carotid, and radial tonometry) showed little association with each other. Waveform-derived data from different approaches were not equivalent, but showed systematic and proportional errors. These results evidenced that the non-invasive methodological approach used is an important determinant of the results (e.g., RIs levels). Our study strongly emphasizes the need for consensus on non-invasive assessment of waveform-derived indexes.
There were not uniform behaviors that standardize the need for sex-related RIs (normative data), but the need for sex-specific waveform-derived indexes RIs relied on the index and/or age considered. Population-based RIs for waveform-derived indexes were defined from data obtained in the same group of healthy children, adolescents, and adults. Aiming at contributing with other groups and/or researchers, sex-specific BH- and age-related equations for mean value, SD, and percentiles values were included in text and spreadsheet formats. Thus, the expected values for a given subject could be calculated for clinical and/or research purposes.
Data Availability Statement
The original contributions presented in the study are included in the article/Supplementary Material, further inquiries can be directed to the corresponding author/s.
Ethics Statement
The studies involving human participants were reviewed and approved by Comité de Ética de Investigación, Centro Hospitalario Pereira Rossell, ASSE, Universidad de la República. Written informed consent to participate in this study was provided by the participants’ legal guardian/next of kin.
Author Contributions
YZ and DB contributed to conception and design of the study, performed the cardiovascular recordings, constructed and organized the database, performed the statistical analysis, wrote the first draft and final version of the manuscript, contributed to manuscript revision, read, and approved the submitted version. Both authors contributed to the article and approved the submitted version.
Funding
This research was funded by Agencia Nacional de Investigación e Innovación (ANII), grant number PRSCT–008–020; and extra budgetary funds provided by DB and YZ and CUiiDARTE Center.
Conflict of Interest
The authors declare that the research was conducted in the absence of any commercial or financial relationships that could be construed as a potential conflict of interest.
Publisher’s Note
All claims expressed in this article are solely those of the authors and do not necessarily represent those of their affiliated organizations, or those of the publisher, the editors and the reviewers. Any product that may be evaluated in this article, or claim that may be made by its manufacturer, is not guaranteed or endorsed by the publisher.
Acknowledgments
We thank the children, adolescents and adults, and their families for their participation in the study. To colleagues who integrated the CUiiDARTE Project in different stages, as part of their final degree, master and/or doctoral projects.
Supplementary Material
The Supplementary Material for this article can be found online at: https://www.frontiersin.org/articles/10.3389/fphys.2021.774390/full#supplementary-material
Abbreviations
AIx, augmentation index; AIx@75, augmentation index corrected for heart rate 75 beats/minute; aoBP, central aortic blood pressure; aoDBP, central aortic diastolic blood pressure; aoPP, central aortic pulse pressure; aoSBP, central aortic systolic blood pressure; AP, augmentation pressure; baDBP, brachial artery diastolic blood pressure; baMBP, brachial artery mean blood pressure; baPP, brachial artery pulse pressure; baSBP, brachial artery systolic blood pressure; BH, body height; BMI, body mass index; BP, blood pressure; CRFs, cardiovascular risk factors; MOG, Mobil-O-Graph PWA-monitor system; Pb, backward (reflected) component of pressure waveform; Pf, forward (incident) component of pressure waveform; PWA, pulse wave analysis; RIs, reference intervals; RIx, reflection index; RM, reflection magnitude; SCOR, SphygmoCor-CvMS system; WSA, wave separation analysis; y, years.
References
Baksi, A. J., Treibel, T. A., Davies, J. E., Hadjiloizou, N., Foale, R. A., Parker, K. H., et al. (2009). A meta-analysis of the mechanism of blood pressure change with aging. J. Am. Coll. Cardiol. 54, 2087–2092. doi: 10.1016/j.jacc.2009.06.049
Bellera, C. A., and Hanley, J. A. (2007). A method is presented to plan the required sample size when estimating regression-based reference limits. J. Clin. Epidemiol. 60, 610–615. doi: 10.1016/j.jclinepi.2006.09.004
Bia, D., and Zócalo, Y. (2021). Physiological age- and sex-related profiles for local (aortic) and regional (carotid-femoral, carotid-radial) pulse wave velocity and center-to-periphery stiffness gradient, with and without blood pressure adjustments: reference intervals and agreement between methods in healthy subjects (3-84 years). J. Cardiovasc. Dev. Dis. 8:3. doi: 10.3390/jcdd8010003
Bia, D., Armentano, R. L., Grignola, J. C., Craiem, D., Zócalo, Y. A., Ginés, F. F., et al. (2003). The vascular smooth muscle of great arteries: local control site of arterial buffering function? Rev. Esp. Cardiol. 56, 1202–1209. doi: 10.1016/s0300-8932(03)77039-0
Bia, D., Zócalo, Y., Armentano, R., Camus, J., De Forteza, E., and Cabrera-Fischer, E. (2008). Increased reversal and oscillatory shear stress cause smooth muscle contraction-dependent changes in sheep aortic dynamics: role in aortic balloon pump circulatory support. Acta Physiol. (Oxf.) 192, 487–503. doi: 10.1111/j.1748-1716.2007.01765.x
Bia, D., Zócalo, Y., Farro, I., Torrado, J., Farro, F., Florio, L., et al. (2011). Integrated evaluation of age-related changes in structural and functional vascular parameters used to assess arterial aging, subclinical atherosclerosis, and cardiovascular risk in Uruguayan adults: CUiiDARTE Project. Int. J. Hypertens. 2011:587303. doi: 10.4061/2011/587303
Bossuyt, J., Engelen, L., Ferreira, I., Stehouwer, C. D., Boutouyrie, P., Laurent, S., et al. (2015). Reference values for arterial measurements collaboration. Reference values for local arterial stiffness. Part B: femoral artery. J. Hypertens. 33, 1997–2009. doi: 10.1097/HJH.0000000000000655
Campos-Arias, D., De Buyzere, M. L., Chirinos, J. A., Rietzschel, E. R., and Segers, P. (2021). Longitudinal changes of input impedance, pulse wave velocity, and wave reflection in a middle-aged population: the Asklepios study. Hypertension 77, 1154–1165. doi: 10.1161/HYPERTENSIONAHA.120.16149
Castro, J. M., García-Espinosa, V., Zinoveev, A., Marin, M., Severi, C., Chiesa, P., et al. (2019). Arterial structural and functional characteristics at end of early childhood and beginning of adulthood: impact of body size gain during early, intermediate, late and global growth. J. Cardiovasc. Dev. Dis. 6:33. doi: 10.3390/jcdd6030033
Cattermole, G. N., Leung, P. Y., Ho, G. Y., Lau, P. W., Chan, C. P., Chan, S. S., et al. (2017). The normal ranges of cardiovascular parameters measured using the ultrasonic cardiac output monitor. Physiol. Rep. 5:e13195. doi: 10.14814/phy2.13195
Cecelja, M., Jiang, B., McNeill, K., Kato, B., Ritter, J., Spector, T., et al. (2009). Increased wave reflection rather than central arterial stiffness is the main determinant of raised pulse pressure in women and relates to mismatch in arterial dimensions: a twin study. J. Am. Coll. Cardiol. 54, 695–703. doi: 10.1016/j.jacc.2009.04.068
Chirinos, J. A., Kips, J. G., Jacobs, D. R. Jr., Brumback, L., Duprez, D. A., Kronmal, R., et al. (2012). Arterial wave reflections and incident cardiovascular events and heart failure: MESA (Multiethnic Study of Atherosclerosis). J. Am. Coll. Cardiol. 60, 2170–2177. doi: 10.1016/j.jacc.2012.07.054
Chirinos, J. A., Kips, J. G., Roman, M. J., Medina-Lezama, J., Li, Y., Woodiwiss, A. J., et al. (2011). Ethnic differences in arterial wave reflections and normative equations for augmentation index. Hypertension 57, 1108–1116. doi: 10.1161/HYPERTENSIONAHA.110.166348
Climie, R. E., Park, C., Avolio, A., Mynard, J. P., Kruger, R., and Bruno, R. M. (2021). Vascular ageing in youth: a call to action. Heart Lung Circ. 30, 1613–1626. doi: 10.1016/j.hlc.2021.06.516
Curcio, S., García-Espinosa, V., Arana, M., Farro, I., Chiesa, P., Giachetto, G., et al. (2016). Growing-Related changes in arterial properties of healthy children, adolescents, and young adults nonexposed to cardiovascular risk factors: analysis of gender-related differences. Int. J. Hypertens. 2016:4982676. doi: 10.1155/2016/4982676
Díaz, A., Zócalo, Y., Bia, D., and Cabrera Fischer, E. (2018). Reference intervals of central aortic blood pressure and augmentation index assessed with an oscillometric device in healthy children, adolescents, and young adults from Argentina. Int. J. Hypertens. 2018:1469651. doi: 10.1155/2018/1469651
Engelen, L., Bossuyt, J., Ferreira, I., van Bortel, L. M., Reesink, K. D., Segers, P., et al. (2015). Reference values for arterial measurements collaboration. Reference values for local arterial stiffness. Part A: carotid artery. J. Hypertens. 33, 1981–1996. doi: 10.1097/HJH.0000000000000654
Engelen, L., Ferreira, I., Stehouwer, C. D., Boutouyrie, P., and Laurent, S. (2013). Reference Values for Arterial Measurements Collaboration. Reference intervals for common carotid intima-media thickness measured with echotracking: relation with risk factors. Eur. Heart J. 34, 2368–2380. doi: 10.1093/eurheartj/ehs380
Gómez-Sánchez, M., Patino-Alonso, M. C., Gómez-Sánchez, L., Recio-Rodríguez, J. I., Rodríguez-Sánchez, E., Maderuelo-Fernández, J. A., et al. (2020). Reference values of arterial stiffness parameters and their association with cardiovascular risk factors in the Spanish population. The EVA Study. Rev. Esp. Cardiol. (Engl. Ed.) 73, 43–52. doi: 10.1016/j.rec.2019.04.016
Hametner, B., and Wassertheurer, S. (2017). Pulse waveform analysis: is it ready for prime time? Curr. Hypertens. Rep. 19:73. doi: 10.1007/s11906-017-0769-3
Hametner, B., Parragh, S., Mayer, C., Weber, T., Van Bortel, L., De Buyzere, M., et al. (2015). Assessment of model based (input) impedance, pulse wave velocity, and wave reflection in the Asklepios cohort. PLoS One 10:e0141656. doi: 10.1371/journal.pone.0141656
Hayes, A. F. (2020). Introduction to Mediation, Moderation, and Conditional Process Analysis, 2nd Edn. Available online at: http://www.guilford.com/p/hayes3 (accessed November 13, 2020).
Heffernan, K. S., Lefferts, W. K., Atallah-Yunes, N. H., Glasgow, A. C., and Gump, B. B. (2020). Racial differences in left ventricular mass and wave reflection intensity in children. Front. Pediatr. 8:132. doi: 10.3389/fped.2020.00132
Heusinkveld, M. H. G., Delhaas, T., Lumens, J., Huberts, W., Spronck, B., Hughes, A. D., et al. (2019). Augmentation index is not a proxy for wave reflection magnitude: mechanistic analysis using a computational model. J. Appl. Physiol. (1985) 127, 491–500. doi: 10.1152/japplphysiol.00769.2018
Hickson, S. S., Nichols, W. W., Yasmin, McDonnell, B. J., Cockcroft, J. R., Wilkinson, I. B., et al. (2016). Influence of the central-to-peripheral arterial stiffness gradient on the timing and amplitude of wave reflections. Hypertens. Res. 39, 723–729. doi: 10.1038/hr.2016.64
Hidvégi, E. V., Illyés, M., Molnár, F. T., and Cziráki, A. (2015). Influence of body height on aortic systolic pressure augmentation and wave reflection in childhood. J. Hum. Hypertens. 29, 495–501. doi: 10.1038/jhh.2014.118
Hodson, B., Norton, G. R., Ballim, I., Sareli, P., and Woodiwiss, A. J. (2017). Contribution of backward and forward wave pressures to age-related increases in aortic pressure in a community sample not receiving antihypertensive therapy. J. Am. Soc. Hypertens. 11, 616–626.e2. doi: 10.1016/j.jash.2017.08.003
Hodson, B., Norton, G. R., Booysen, H. L., Sibiya, M. J., Raymond, A., Maseko, M. J., et al. (2016). Brachial pressure control fails to account for most distending pressure-independent, age-related aortic hemodynamic changes in adults. Am. J. Hypertens. 29, 605–613. doi: 10.1093/ajh/hpv140
Hughes, A. D., Park, C., Davies, J., Francis, D., McG Thom, S. A., Mayet, J., et al. (2013). Limitations of augmentation index in the assessment of wave reflection in normotensive healthy individuals. PLoS One 8:e59371. doi: 10.1371/journal.pone.0059371
Janner, J. H., Godtfredsen, N. S., Ladelund, S., Vestbo, J., and Prescott, E. (2010). Aortic augmentation index: reference values in a large unselected population by means of the SphygmoCor device. Am. J. Hypertens. 23, 180–185. doi: 10.1038/ajh.2009.234
Karamanoglu, M., and Feneley, M. P. (1996). Derivation of the ascending aortic-carotid pressure transfer function with an arterial model. Am. J. Physiol. 271(6 Pt. 2), H2399–H2404. doi: 10.1152/ajpheart.1996.271.6.H2399
Kelly, R., Hayward, C., Avolio, A., and O’Rourke, M. (1989). Noninvasive determination of age-related changes in the human arterial pulse. Circulation 80, 1652–1659. doi: 10.1161/01.cir.80.6.1652
Li, Y., Jiang, B., Keehn, L., Gu, H., Boguslavskyi, A., Cecelja, M., et al. (2019). Hemodynamic mechanism of the age-related increase in pulse pressure in women. Hypertension 73, 1018–1024. doi: 10.1161/HYPERTENSIONAHA.118.12402
Liao, C. F., Cheng, H. M., Sung, S. H., Yu, W. C., and Chen, C. H. (2011). Determinants of pressure wave reflection: characterization by the transit time-independent reflected wave amplitude. J. Hum. Hypertens. 25, 665–671. doi: 10.1038/jhh.2010.106
Lieber, A., Millasseau, S., Bourhis, L., Blacher, J., Protogerou, A., Levy, B. I., et al. (2010). Aortic wave reflection in women and men. Am. J. Physiol. Heart Circ. Physiol. 299, H236–H242. doi: 10.1152/ajpheart.00985.2009
Lumley, T., Diehr, P., Emerson, S., and Chen, L. (2002). The importance of the normality assumption in large public health data sets. Annu. Rev. Public Health 23, 151–169. doi: 10.1146/annurev.publhealth.23.100901.140546
Marin, M., Bia, D., and Zócalo, Y. (2020). Carotid and femoral atherosclerotic plaques in asymptomatic and non-treated subjects: cardiovascular risk factors, 10-years risk scores, and lipid ratios’ capability to detect plaque presence, burden, fibro-lipid composition and geometry. J. Cardiovasc. Dev. Dis. 7:11. doi: 10.3390/jcdd7010011
McEniery, C. M., Yasmin, Hall, I. R., Qasem, A., Wilkinson, I. B., Cockcroft, J. R., et al. (2005). Normal vascular aging: differential effects on wave reflection and aortic pulse wave velocity: the Anglo-Cardiff Collaborative Trial (ACCT). J. Am. Coll. Cardiol. 46, 1753–1760. doi: 10.1016/j.jacc.2005.07.037
Mitchell, G. F., Parise, H., Benjamin, E. J., Larson, M. G., Keyes, M. J., Vita, J. A., et al. (2004). Changes in arterial stiffness and wave reflection with advancing age in healthy men and women: the Framingham Heart Study. Hypertension 43, 1239–1245. doi: 10.1161/01.HYP.0000128420.01881.aa
Mynard, J. P., Kondiboyina, A., Kowalski, R., Cheung, M., and Smolich, J. J. (2020). Measurement, analysis and interpretation of pressure/flow waves in blood vessels. Front. Physiol. 11:1085. doi: 10.3389/fphys.2020.01085
Namasivayam, M., Adji, A., and O’Rourke, M. F. (2016). Evaluating the hemodynamic basis of age-related central blood pressure change using aortic flow triangulation. Am. J. Hypertens. 29, 178–184. doi: 10.1093/ajh/hpv080
Namasivayam, M., McDonnell, B. J., McEniery, C. M., and O’Rourke, M. F., and Anglo-Cardiff Collaborative Trial Study Investigators (2009). Does wave reflection dominate age-related change in aortic blood pressure across the human life span? Hypertension 53, 979–985. doi: 10.1161/HYPERTENSIONAHA.108.125179
Royston, P., and Wright, E. (1998). A method for estimating age-specific reference intervals (‘normal ranges’) based on fractional polynomials and exponential transformation. J. R. Stat. Soc. Ser. A Stat. Soc. 161, 79–101.
Santana, D. B., Zócalo, Y. A., and Armentano, R. L. (2012a). Integrated e-Health approach based on vascular ultrasound and pulse wave analysis for asymptomatic atherosclerosis detection and cardiovascular risk stratification in the community. IEEE Trans. Inf. Technol. Biomed. 16, 287–294. doi: 10.1109/TITB.2011.2169977
Santana, D. B., Zócalo, Y. A., Ventura, I. F., Arrosa, J. F., Florio, L., Lluberas, R., et al. (2012b). Health informatics design for assisted diagnosis of subclinical atherosclerosis, structural, and functional arterial age calculus and patient-specific cardiovascular risk evaluation. IEEE Trans. Inf. Technol. Biomed. 16, 943–951. doi: 10.1109/TITB.2012.2190990
Segers, P., Rietzschel, E. R., De Buyzere, M. L., Vermeersch, S. J., De Bacquer, D., Van Bortel, L. M., et al. (2007). Noninvasive (input) impedance, pulse wave velocity, and wave reflection in healthy middle-aged men and women. Hypertension 49, 1248–1255. doi: 10.1161/HYPERTENSIONAHA.106.085480
Sluyter, J. D., Camargo, C. A. Jr., Stewart, A. W., Waayer, D., Lawes, C. M. M., Toop, L., et al. (2017). Effect of monthly, high-dose, long-term vitamin d supplementation on central blood pressure parameters: a randomized controlled trial substudy. J. Am. Heart Assoc. 6:e006802. doi: 10.1161/JAHA.117.006802
Solanki, J. D., Mehta, H. B., and Shah, C. J. (2018). Aortic pulse wave velocity and augmentation index@75 measured by oscillometric pulse wave analysis in Gujarati nonhypertensives. Vasc. Invest. Ther. 1, 50–55.
Sugawara, J., Hayashi, K., and Tanaka, H. (2010). Distal shift of arterial pressure wave reflection sites with aging. Hypertension 56, 920–925. doi: 10.1161/HYPERTENSIONAHA.110.160549
Torjesen, A. A., Wang, N., Larson, M. G., Hamburg, N. M., Vita, J. A., Levy, D., et al. (2014). Forward and backward wave morphology and central pressure augmentation in men and women in the Framingham Heart Study. Hypertension 64, 259–265. doi: 10.1161/HYPERTENSIONAHA.114.03371
Wang, K. L., Cheng, H. M., Sung, S. H., Chuang, S. Y., Li, C. H., Spurgeon, H. A., et al. (2010). Wave reflection and arterial stiffness in the prediction of 15-year all-cause and cardiovascular mortalities: a community-based study. Hypertension 55, 799–805. doi: 10.1161/HYPERTENSIONAHA.109.139964
Weber, T., Wassertheurer, S., Rammer, M., Haiden, A., Hametner, B., and Eber, B. (2012). Wave reflections, assessed with a novel method for pulse wave separation, are associated with end-organ damage and clinical outcomes / novelty and significance. Hypertension 60, 534–541. doi: 10.1161/HYPERTENSIONAHA.112.194571
Westerhof, B. E., Guelen, I., Westerhof, N., Karemaker, J. M., and Avolio, A. (2006). Quantification of wave reflection in the human aorta from pressure alone: a proof of principle. Hypertension 48, 595–601. doi: 10.1161/01.HYP.0000238330.08894.17
Westerhof, N., and Westerhof, B. E. (2013). A review of methods to determine the functional arterial parameters stiffness and resistance. J. Hypertens. 31, 1769–1775. doi: 10.1097/HJH.0b013e3283633589
Wilenius, M., Tikkakoski, A. J., Tahvanainen, A. M., Haring, A., Koskela, J., Huhtala, H., et al. (2016). Central wave reflection is associated with peripheral arterial resistance in addition to arterial stiffness in subjects without antihypertensive medication. BMC Cardiovasc. Disord. 16:131. doi: 10.1186/s12872-016-0303-6
Wojciechowska, W., Staessen, J. A., Nawrot, T., Cwynar, M., Seidlerová, J., Stolarz, K., et al. (2006). Reference values in white Europeans for the arterial pulse wave recorded by means of the SphygmoCor device. Hypertens. Res. 29, 475–483. doi: 10.1291/hypres.29.475
Yu, C. G., Wei, F. F., Zhang, Z. Y., Thijs, L., Yang, W. Y., Mujaj, B., et al. (2020). Central hemodynamics in relation to low-level environmental lead exposure. Blood Press. 29, 157–167. doi: 10.1080/08037051.2019.1658518
Zamani, P., Jacobs, D. R. Jr., Segers, P., Duprez, D. A., Brumback, L., Kronmal, R. A., et al. (2014). Reflection magnitude as a predictor of mortality: the Multi-Ethnic Study of Atherosclerosis. Hypertension 64, 958–964. doi: 10.1161/HYPERTENSIONAHA.114.03855
Zinoveev, A., Castro, J. M., García-Espinosa, V., Marin, M., Chiesa, P., Bia, D., et al. (2019). Aortic pressure and forward and backward wave components in children, adolescents and young-adults: agreement between brachial oscillometry, radial and carotid tonometry data and analysis of factors associated with their differences. PLoS One 14:e0226709. doi: 10.1371/journal.pone.0226709
Zócalo, Y., and Bia, D. (2016). Ultrasonografía carotídea para detección de placas de ateroma y medición del espesor íntima-media; índice tobillo-brazo: evaluación no invasiva en la práctica clínica: importancia clínica y análisis de las bases metodológicas para su evaluación. Rev. Urug. Cardiol. 31, 47–60. doi: 10.3989/mc.1960.v10.i099.1916
Zócalo, Y., and Bia, D. (2021a). Age- and sex-related profiles for macro, macro/micro and microvascular reactivity indexes: association between indexes and normative data from 2609 healthy subjects (3-85 years). PLoS One 16:e0254869. doi: 10.1371/journal.pone.0254869
Zócalo, Y., and Bia, D. (2021b). Sex-and age-related physiological profiles for brachial, vertebral, carotid and femoral arteries blood flow velocity parameters during growth and aging (4-76 y): comparison with clinical cut-off levels. Front. Physiol. 12:729309. doi: 10.3389/fphys.2021.729309
Zócalo, Y., García-Espinosa, V., Castro, J. M., Zinoveev, A., Marin, M., Chiesa, P., et al. (2020). Stroke volume and cardiac output non-invasive monitoring based on brachial oscillometry-derived pulse contour analysis: explanatory variables and reference intervals throughout life (3–88 years). Cardiol. J. 28, 864–878. doi: 10.5603/CJ.a2020.0031
Keywords: adolescents, adults, applanation tonometry, children, oscillometry, pulse wave analysis, wave separation analysis, normative data
Citation: Zócalo Y and Bia D (2022) Central Pressure Waveform-Derived Indexes Obtained From Carotid and Radial Tonometry and Brachial Oscillometry in Healthy Subjects (2–84 Y): Age-, Height-, and Sex-Related Profiles and Analysis of Indexes Agreement. Front. Physiol. 12:774390. doi: 10.3389/fphys.2021.774390
Received: 11 September 2021; Accepted: 22 December 2021;
Published: 20 January 2022.
Edited by:
Andrea Guala, Vall d’Hebron Research Institute (VHIR), SpainReviewed by:
Alun Hughes, University College London, United KingdomChloe May Park, University College London, United Kingdom
Copyright © 2022 Zócalo and Bia. This is an open-access article distributed under the terms of the Creative Commons Attribution License (CC BY). The use, distribution or reproduction in other forums is permitted, provided the original author(s) and the copyright owner(s) are credited and that the original publication in this journal is cited, in accordance with accepted academic practice. No use, distribution or reproduction is permitted which does not comply with these terms.
*Correspondence: Yanina Zócalo, yana@fmed.edu.uy; yaninazocalo@gmail.com