 G. Kim Prisk
 John B. West
- Department of Medicine, University of California, San Diego, La Jolla, CA, United States
The efficiency of pulmonary gas exchange has long been assessed using the alveolar-arterial difference in PO2, the A-aDO2, a construct developed by Richard Riley ~70years ago. However, this measurement is invasive (requiring an arterial blood sample), time consuming, expensive, uncomfortable for the patients, and as such not ideal for serial measurements. Recent advances in the technology now provide for portable and rapidly responding measurement of the PO2 and PCO2 in expired gas, which combined with the well-established measurement of arterial oxygen saturation via pulse oximetry (SpO2) make practical a non-invasive surrogate measurement of the A-aDO2, the oxygen deficit. The oxygen deficit is the difference between the end-tidal PO2 and the calculated arterial PO2 derived from the SpO2 and taking into account the PCO2, also measured from end-tidal gas. The oxygen deficit shares the underlying basis of the measurement of gas exchange efficiency that the A-aDO2 uses, and thus the two measurements are well-correlated (r2~0.72). Studies have shown that the new approach is sensitive and can detect the age-related decline in gas exchange efficiency associated with healthy aging. In patients with lung disease the oxygen deficit is greatly elevated compared to normal subjects. The portable and non-invasive nature of the approach suggests potential uses in first responders, in military applications, and in underserved areas. Further, the completely non-invasive and rapid nature of the measurement makes it ideally suited to serial measurements of acutely ill patients including those with COVID-19, allowing patients to be closely monitored if required.
Introduction
For the lung to exchange gas (O2 from the inspired air into the blood, and CO2 from the blood to the expired gas), alveolar gas and pulmonary capillary blood must be brought into close apposition across the thin alveolar-capillary membrane. Any degree of spatial mismatch between ventilation and perfusion [ventilation-perfusion (VA/Q) inequality] will lower the efficiency of the exchange of any gas, resulting in a difference between the partial pressure of a gas in the arterial blood leaving the lung, and gas in the exhaled breath (Rahn and Fenn, 1955; West, 1969).
For O2 and CO2, the dissociation curves that describe the content of the gas in blood as a function of partial pressure, are markedly different. The sigmoidal shaped O2 dissociation curve rapidly flattens at higher values of PO2. Thus, the presence of any regions of the lung with a low VA/Q ratio will result in the addition of poorly oxygenated blood to the arterial circulation, but a compensatory increase in overall ventilation (from chemoreceptive responses) cannot add more oxygen to blood exiting regions of high VA/Q. In contrast, the quasi-linear CO2 dissociation curve means that low and high VA/Q regions can compensate for each other. Thus, it is common to see patients with pulmonary disease with arterial hypoxemia, while having a normal arterial PCO2 (West and Luks, 2016).
A small increase in VA/Q inequality occurs with healthy aging (Cardus et al., 1997), and increased VA/Q inequality is a hallmark of virtually all pulmonary diseases (Hopkins and Wagner, 2017). Therefore, the measurement of the alveolar-arterial PO2 difference (A-aDO2) has long been a mainstay in assessing the disruption to pulmonary gas exchange caused by disease (Filley et al., 1954).
Historical Context Of Measuring the Alveolar-Arterial Difference in Po2
While conceptually simple, measuring the A-aDO2 is technically challenging. Richard Riley first showed that the PO2 in arterial blood could be measured by equilibrating a small bubble of air with the blood and measuring the PO2 in the gas (Riley et al., 1957). However, at the time, the technical difficulties of reliably sampling alveolar gas were overwhelming. To bypass this problem, Riley developed the construct of the “ideal alveolar PO2.” This was the alveolar PO2 in the lung that would have been present if there was no ventilation-perfusion inequality, the PCO2 in the alveolar gas was the same as that in arterial blood, and the respiratory exchange ratio was the same as that in the actual lung.
The ideal alveolar PO2 can be obtained from an arterial blood sample using the alveolar gas equation (Rahn and Fenn, 1955):
The Alternative Approach of the Oxygen Deficit
Compact, rapidly responding gas analysis devices are now readily available, allowing direct measurement of expired PO2 and PCO2. The Riley construct utilizes the ideal alveolar PO2 to obviate the need to make a “technically difficult” measurement to calculate the A-aDO2. The oxygen deficit (OD) comes from a direct measurement of expired gas partial pressures and uses a non-invasive means to determine what would otherwise be an invasive measurement, the arterial PO2.
The approach is to continuously measure expired O2 and CO2 while the patient breathes quietly on a mouthpiece while wearing a noseclip. The final concentrations measured just before the abrupt transition to inspired gas are taken as the end-tidal values of PO2 and PCO2. An example of the expired gas record is shown in Figure 1. The end-tidal values for partial pressure are a good reflection of the values within the alveolus (discussed in detail in reference West et al., 2020) and are highly reproducible. Previous work has shown that the breath-to-breath within-subject standard deviation of normal subjects breathing air is ~1.4mmHg for PO2 and ~0.7mmHg for PCO2 (West et al., 2020), with somewhat lower numbers when breathing a hypoxic gas. A trend plot of the last 30 values of these (covering 1–2min) provides a direct indication of whether the patient is in steady-state, an important consideration since highly variable breathing would result in considerable variation in end-tidal partial pressures for both O2 and CO2.
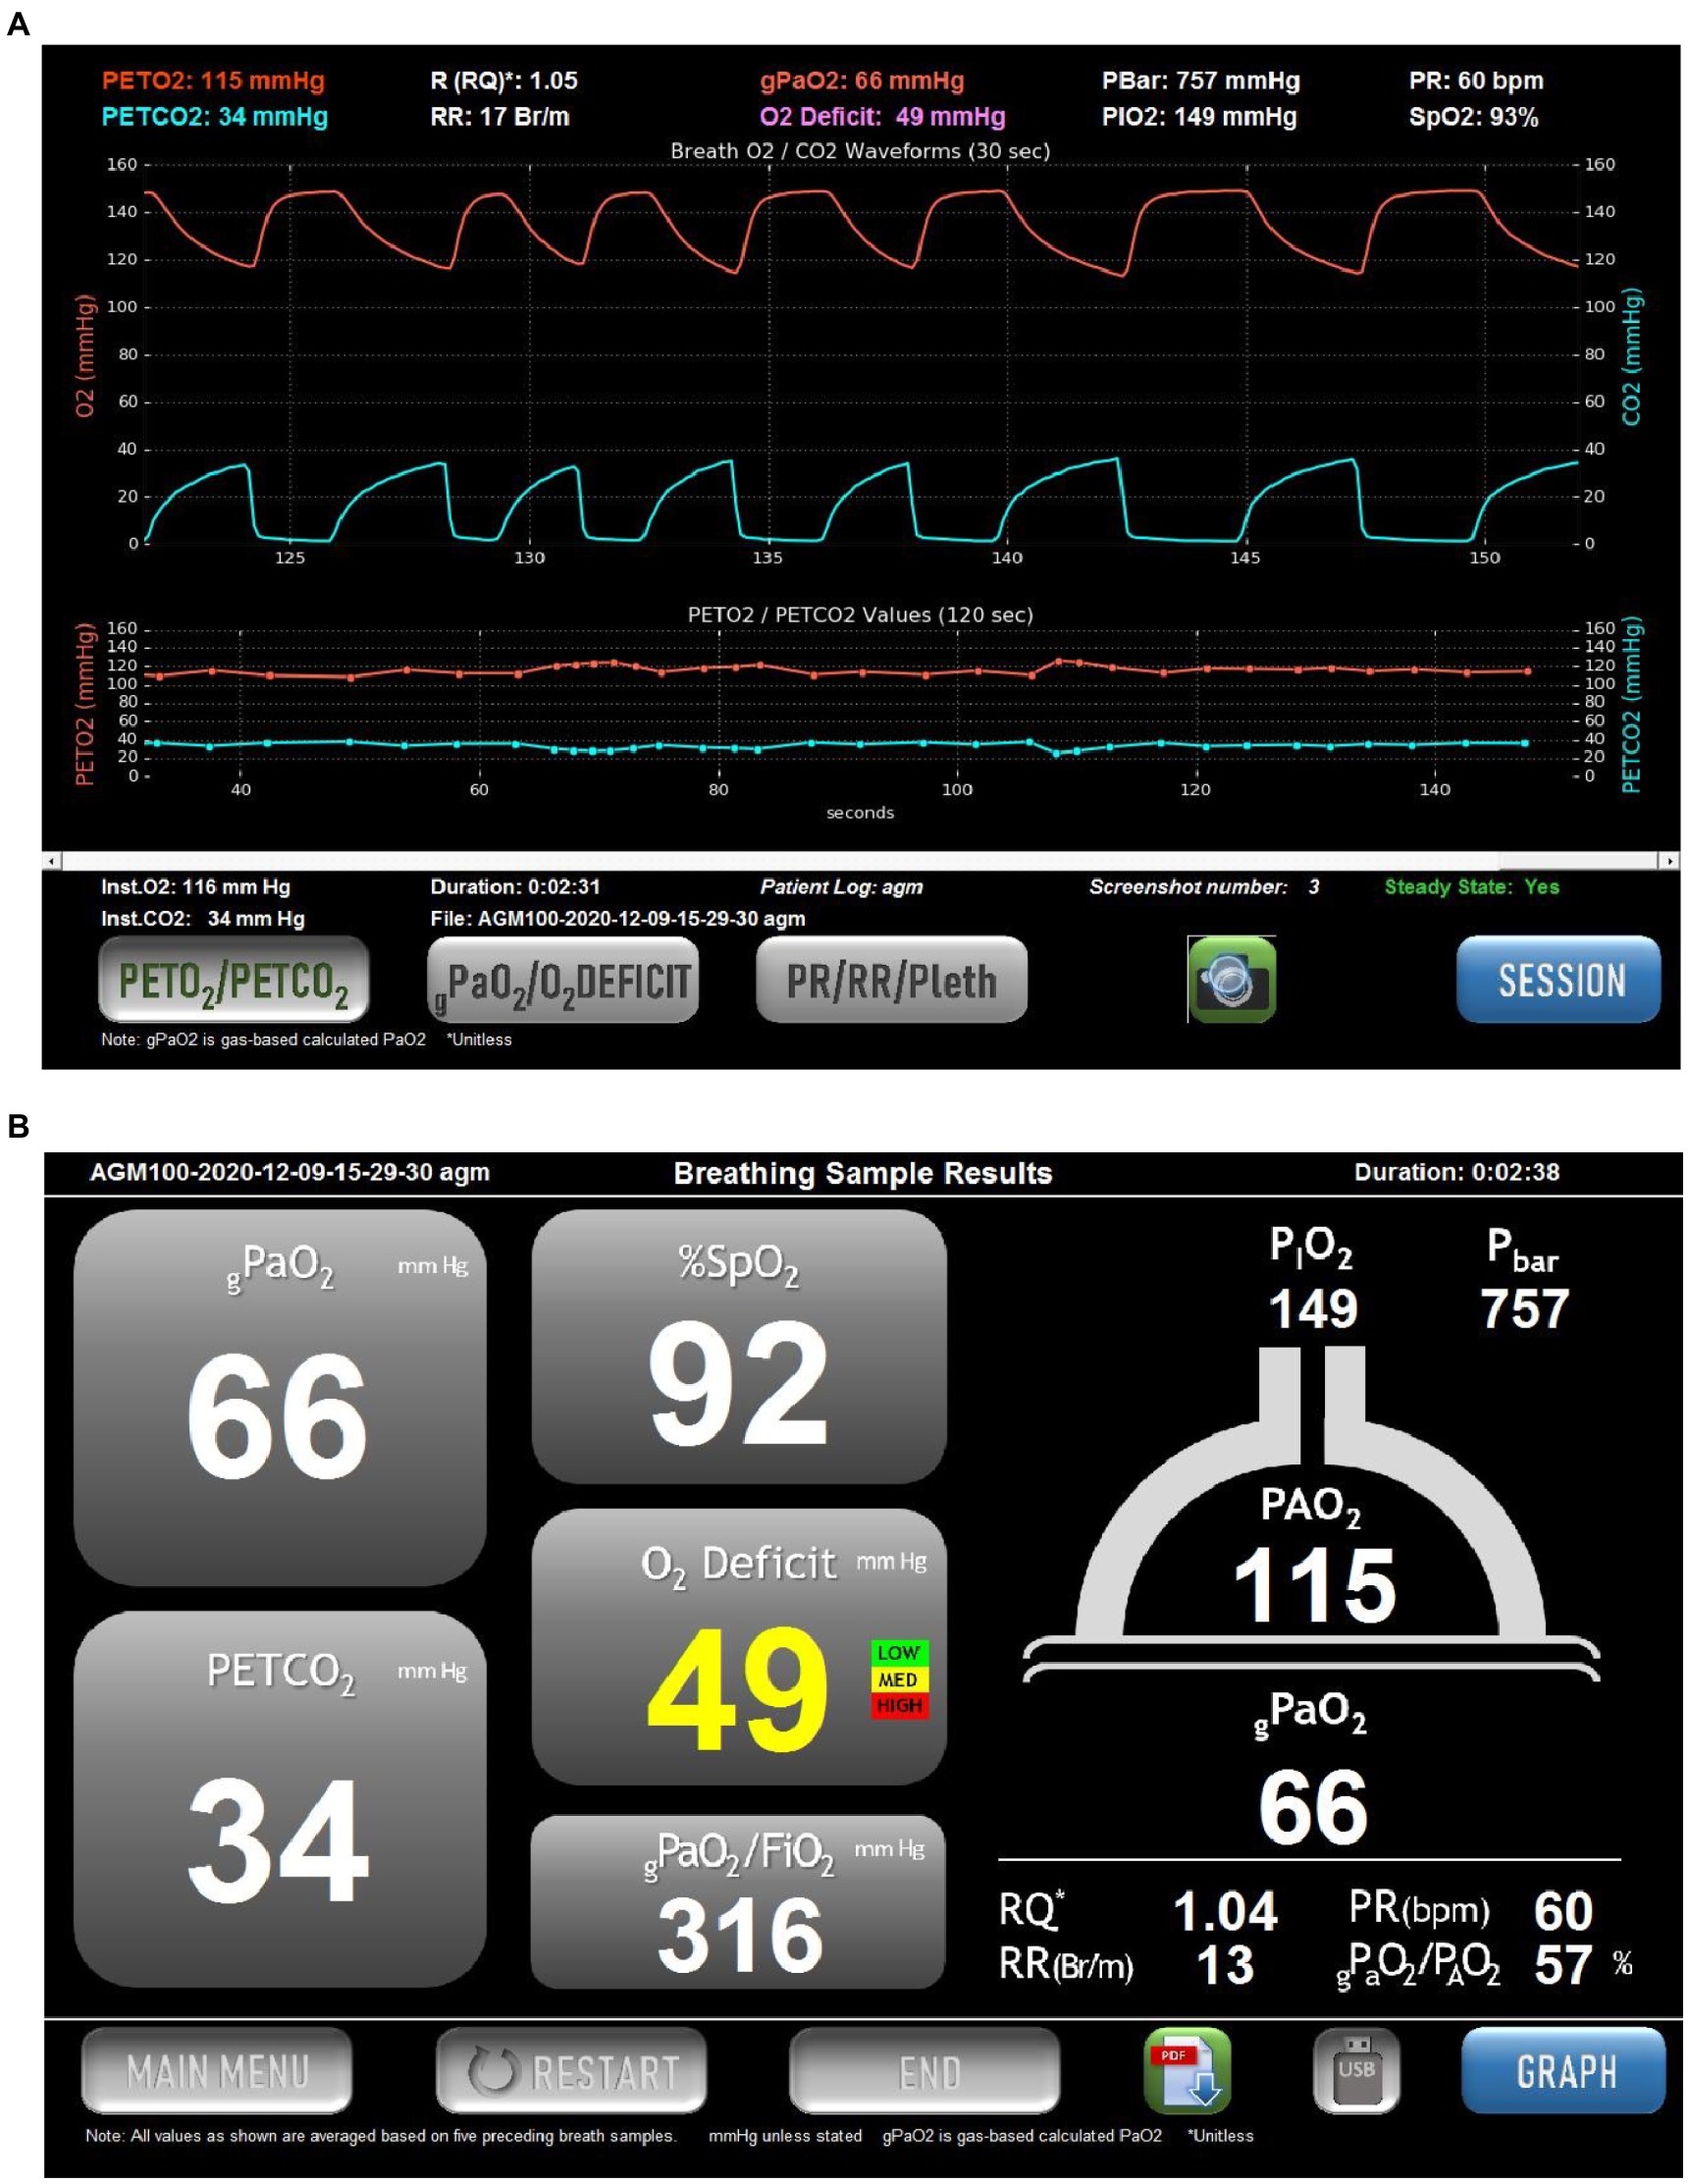
Figure 1. Example of the screens displayed in the commercial version of the Alveolar Gas Meter (AGM100TM, MediPines Corp, Costa Mesa, CA). Data are taken from a spontaneously breathing patient suffering from COVID-19. (A) Continuous records of PO2 (red) and PCO2 (blue) over a 30-s period of quiet breathing (upper traces). Note that in this patient there is a steep alveolar plateau for O2 and CO2, indicative of marked heterogeneity in the lung. Below these are plots of end-tidal PO2 (red) and PCO2 (blue) over the preceding 150s. The lower traces allow an assessment of whether the patient is in a steady state. This is also indicated by the Steady State indicator in the lower right of the screen. At the top of the screen are numerical values for the end-tidal partial presses of O2 and CO2, the respiratory quotient (RQ), respiratory rate (RR), barometric pressure (PBar), inspired PO2 (PIO2), pulse rate (PR) and arterial oxygen saturation via pulse oximetry (SpO2). In the center at the top is the calculated arterial PO2 (termed gPaO2, red text), and the O2 Deficit (the difference between end-tidal PO2 and calculated arterial PO2). (B) A screen summarizing the data from (A) without the graphical displays. The cartoon of the lung on the right shows the measured end-tidal PO2 (115mmHg in this example), and the calculated arterial PO2 (gPaO2, 66mmHg in this example), which together result in the oxygen deficit in traffic-light color-coded text (49mmHg in this example). The operator may toggle between this screen and that in (A) as desired.
Having directly measured the alveolar partial pressure for O2 (and CO2), the A-aDO2 could be measured directly by taking an arterial blood sample to measure arterial PO2. However, to make the process both rapid and non-invasive, arterial PO2 is estimated from the arterial oxygen saturation (SaO2) as measured by pulse oximetry (SpO2) as determined simultaneously using a fingertip pulse oximeter. This is then used to determine the corresponding arterial PO2 from the Hill equation:
The term n (commonly referred to as the “Hill-n”) is that required to match the sigmoidal shape of the O2-Hb dissociation curve, and a value of 2.7 is commonly used (Severinghaus, 2002; Prisk and West, 2019). While a Hill-n of 2.7 provides an excellent fit to the experimentally determined values of saturation and PO2 over the entire range of saturation (Severinghaus, 1966; Prisk and West, 2019), in practice, only blood oxygen saturations in the range of 75–100% are likely to be encountered in patients. Over this limited range, an improved fit to the experimental data is achieved with a Hill-n=2.88 (Liu et al., 2020).
The P50 of blood is normally ~27mmHg, however this varies with alterations in PCO2, body temperature, base excess, and levels of 2,3-diphosphoglycerate (2,3-dpg; West and Luks, 2016). Because the end-tidal gas partial pressure reflects the alveolar PCO2, the leftward or rightward shift of the O2-Hb dissociation curve from a PCO2 different to the normal value of 40mmHg (the Bohr effect) can be accounted for. Using the Kelman routines (Kelman, 1966, 1968) an empiric relationship for P50 assuming otherwise normal conditions for temperature, base excess and 2,3-dpg is determined (Prisk and West, 2019). This is used to correct for changes in alveolar PCO2, assuming this is equal to arterial PCO2, an equivalence that has been long established (Comroe and Dripps, 1944). Alterations in base excess, 2,3-dpg, or body temperature are not accounted for, because a blood sample is not obtained.
The difference between the calculated arterial PO2 and the measured end-tidal (alveolar) PO2 is termed the OD. This can be thought of as a surrogate measurement of the A-aDO2. In the latter case the arterial value is measured, and the alveolar value estimated as described by Riley (above), while in the case of the OD, the alveolar value is measured, and the arterial value estimated. This should not be confused with the “oxygen deficit” that provides a measure of the anaerobic contribution during exercise (Krogh and Lindhard, 1920; Medbo et al., 1988).
Limitations of the Measurement of the Oxygen Deficit
In the normal lung there is variation in the regional alveolar PO2, and this is often exaggerated in lung disease. The expired gas is a mixture of gas from all regions of the lung, just as the arterial blood is a mixture of blood from all regions of the lung. Further as gas exchange continues throughout expiration, PO2 continues to fall. However, provided the end-tidal values are measured at functional residual capacity (FRC), the naturally occurring volume for end expiration at rest, the effect of ongoing gas exchange is minimal. Thus, the end tidal PO2 is a direct and useful measurement of the alveolar PO2 (West et al., 2020).
The obvious challenge of determining the OD is the estimation of the arterial PO2 from the SpO2 given the shape of the O2-Hb dissociation curve which is very flat at higher values of PO2. At high values, even small errors in SpO2 translate into large differences in the calculated PaO2. However, this problem becomes smaller at lower values of SpO2 as the O2-Hb dissociation curve becomes steeper. A study addressing the likely errors in calculated PaO2 showed that for SpO2 values of 94% and below, the error in the calculated PaO2 was less than 5mmHg (Prisk and West, 2019). Above a SpO2 of 94% the calculation of PaO2 was, as expected, unreliable. However, if SpO2 is greater than 94% while breathing air at sea level, then no major gas exchange impairment exists, and so there is no need to measure OD.
Because the approach considers the alveolar PCO2 as well as the PO2, the left or right shift in the O2-Hb dissociation curve from changes in alveolar PCO2 (the Bohr effect) can be directly accounted for. This effect is the principal cause of shifts in the O2-Hb dissociation curve, and so the ability to correct for this is critical. Failure to do so would result in errors in the OD of >5mmHg for SpO2 values of 94% (see figure 4 of Prisk and West, 2019 for details). Shifts in the O2-Hb dissociation curve from other causes (base excess, temperature, 2–3 dpg) are not taken into account with the non-invasive approach. These however, are much smaller, and produce only minor errors in the calculated OD (Prisk and West, 2019). A Monte Carlo simulation of the typical simultaneously present errors in the measurements of SpO2 and alveolar PCO2 showed that the calculated OD had a slight negative bias (<5mmHg) and typical variability of ~5mmHg at an SpO2 of 94%, with both of these values decreasing as SpO2 fell, showing the viability of the approach (Prisk and West, 2019).
Oxygen Deficit in Normal Subjects
Initial studies in normal subjects were performed with the subjects breathing a hypoxic gas mixture (FIO2=0.125) to ensure that the SpO2 fell into the range in which OD could be reliably measured (SpO2<95%). A study of 20 young subjects (19–31years) and 11 older subjects (47–88years) showed a very small OD in the young cohort (~2mmHg), which was increased in the older (~8mmHg; West et al., 2018b). The increase in OD with increasing age is consistent with the well-known increase in the A-aDO2 with healthy aging (Raine and Bishop, 1963).
A more extensive subsequent study explored the effects of varying the inspired oxygen between the previously used hypoxic gas (FIO2=0.125) up to and including breathing air (FIO2 values of 0.15, 0.175, and 0.21; Liu et al., 2020). This study again showed a higher OD in the older cohort compared to the young, with the difference persisting at all values of inspired oxygen, including air. Importantly, there was no statistical difference in the measured values of OD between and FIO2 of 0.125 and 0.175, although OD rose in both cohorts when the subjects were breathing air. The result is consistent with an expected reduction in the A-aDO2 as inspired PO2 is lowered due to minimization of the effect of VA/Q inequality as the saturation falls and gas exchange occurs on the steeper and more linear portion of the O2-Hb dissociation curve. The intra-subject variability in the measured OD was large at high values of SpO2, and fell rapidly as SpO2 was reduced below 94%, consistent with the simulation studies performed (Prisk and West, 2019). The study showed that the OD was sensitive to the mild gas exchange impairment associated with healthy aging, even while breathing air, but that individual errors at high values of SpO2 meant that the measurement was not likely to be useful in individual subjects at SpO2 values above 94%.
A recent study has also demonstrated the validity of the non-invasive approach to measure a gas exchange deficit. A direct comparison between OD and arterial blood gas (ABG) was performed in 25 normal subjects during hypoxic exercise, showing a correlation between OD and A-aDO2 with an r2=0.71, and with a small bias between the two, with OD being on average 5.2±5.0mmHg higher than A-aDO2 (Howe et al., 2020). The non-invasive nature of the measurement serves to enable measurements in conditions in where it would be challenging to perform ABGs, and in particular, serial ABGs. Recent examples are measurements performed in trained breath-hold divers before and after dives at an open-water dive site (Patrician et al., 2021a,b). The studies showed a substantial but transient decrement in gas exchange efficiency as measured by increased OD, in some cases to nearly 70mmHg. This was likely due to the development of pulmonary edema from the hydrostatically induced lung compression (lung-squeeze).
Oxygen Deficit in Patients with Lung Disease
A small initial study in a cohort of ambulant patients from a general pulmonary outpatient clinic with a variety of pulmonary diseases showed that the OD was greatly elevated in this group compared to normal, with an average OD of ~49mmHg (West et al., 2018a). When the OD was directly compared to the A-aDO2 measured by the collection of an ABG in 23 patients with an SpO2 of 95% or less, there was a high correlation (r2=0.72; West et al., 2018c). There were similar strength correlations between the calculated PaO2 and that measured from the ABG, and between end-tidal PCO2 and that from the ABG. The calculated PaO2 was on average ~4mmHg higher than that measured from the ABG. This study showed that the non-invasive approach provided a convenient, low cost, and accurate alternative to the use of an ABG to measure the magnitude of the gas exchange disruption in patients with pulmonary disease.
A recent case report highlighted the use of the non-invasive approach in determining the underlying cause of a gas exchange defects in a patient in whom ABGs could not readily be obtained (Amaza et al., 2021). This report served to highlight the potential of the non-invasive approach, and further showed that the approach was useful as a teaching tool.
In the context of the ongoing SARS-CoV-2 pandemic, a small preliminary study investigated the usefulness of the non-invasive approach to measuring the impairment of pulmonary gas exchange in patients with suspected COVID-19 considered to be at risk of deterioration before obvious respiratory failure had ensued (McGuire et al., 2021). Patients were either breathing air, or on supplemental low-dose oxygen, which was temporarily discontinued for ~10min before measurements were taken. Of 13 patients studied, five were discharged home and the other eight were admitted based on physician decision using standard procedures. The OD was significantly greater in the patients who were admitted than in those who were discharged (OD 55±20 vs. 32±14 respectively, p=0.041), suggesting that the measurement was a potentially useful means of assessing severity. Similarly, the oxygen deficit was significantly higher in the patients requiring supplemental O2 than in those who did not (65±9 vs. 30±1 respectively, p<0.001) again suggesting that the non-invasive measurement of gas exchange impairment provided useful clinical insight in a rapid non-invasive manner.
Discussion
The studies performed to date show that a non-invasive approach can be used to quantitatively assess the gas exchange deficit in patients with pulmonary disease. The approach taken is in many respects comparable to the traditional measurement of the A-aDO2 first developed by Riley, and there is considerable physiological overlap in the measurements. This is shown in Figure 2 which shows the classic O2-CO2 diagram and highlights the aspects of the VA/Q inequality that the two methods encompass.
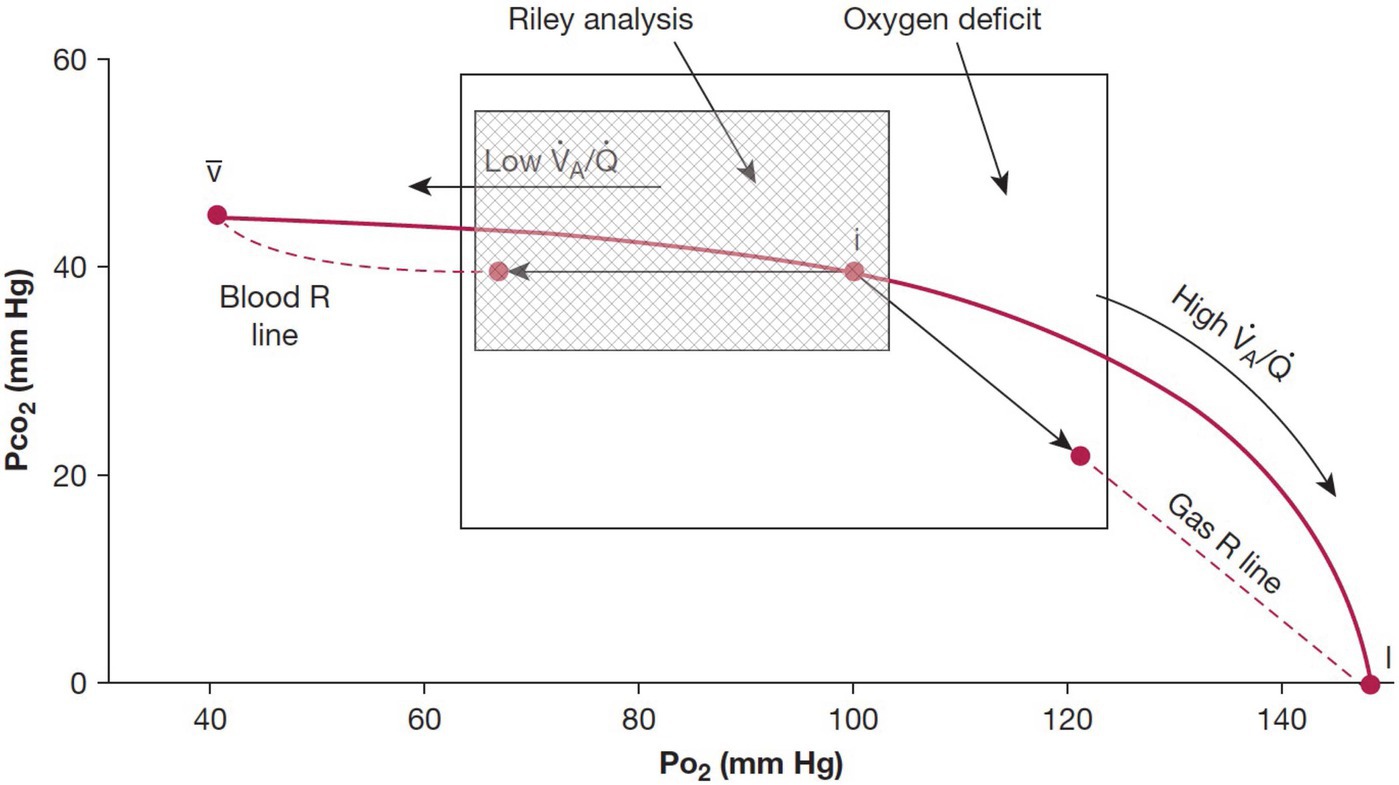
Figure 2. Classic O2-CO2 diagram with the ventilation-perfusion line joining the points for mixed venous blood and inspired gas. The traditional Riley analysis is based on the composition of arterial blood and ideal alveolar gas, and it is strongly biased by lung units with low ventilation-perfusion ratios that lie to the left of the ideal point (hatched area). By contrast, the new test also includes contributions from lung units with high ventilation-perfusion ratios that are located to the right of the ideal point. Modified from West et al. (2018a).
The traditional method of Riley focuses on the consequences of the presence of regions of low VA/Q that serve to add end-capillary blood with a low PO2 to the arterial blood (so-called venous admixture), the result being arterial hypoxemia and an increased A-aDO2. The measurement of oxygen deficit encompasses the effects of low VA/Q and high VA/Q, although the effect of high VA/Q regions on arterial PO2 is small because of the shape of the O2-Hb dissociation curve. The large overlap in the areas of influence of the two methods (Figure 2) means that the two measurements would be expected to be highly correlated, albeit not the same, and this was demonstrated with a strong correlation between measures of A-aDO2 and OD (West et al., 2018c; Howe et al., 2020).
It is reasonable to question what additional information is gained by measuring the OD as opposed to simply measuring SpO2. While both VA/Q mismatch and shunt will serve to decrease arterial PO2 (and thus SpO2) and increase OD, so too will hypoventilation. Because the alveolar PCO2 is also measured, hypoventilation can readily be detected which may provide an important clinical distinction of the cause of hypoxemia in some patients. Further, the OD takes into account the effect of changes in PCO2 on the O2-Hb dissociation curve. Thus, the oxygen deficit directly addresses the efficiency of gas exchange, in the same way that the A-aDO2 does.
The important clinical measurement of the A-aDO2 has been performed using an invasive approach for ~70years. However, its use has become less common in recent years, likely due to the cost, time required for the measurement, and the uncomfortable and invasive nature of the procedure. In contrast, the OD is a rapid, non-invasive measurement that can be readily performed on patients ranging from ambulatory to those on mechanical ventilation. The measurement takes only a few minutes, requiring only that the patient breathe quietly on a mouthpiece while wearing a noseclip for ~2min, while wearing a fingertip pulse oximeter. The equipment is portable, making it suitable for use not only in the hospital, but in the field, and in underserved areas.
Author Contributions
GP wrote, edited, and approved the article. JW edited and approved the article. All authors contributed to the article and approved the submitted version.
Funding
Support for some was provided by MediPines Corporation which provided AGM100TM units for use in some of the studies referenced. Support was provided by MediPines Corporation to cover publication costs.
Conflict of Interest
The University of California, San Diego, has exclusively licensed technology to MediPines Corporation, Orange County, CA, to develop a device (the AGM100TM) used in some studies referenced in this work. JW declares a financial interest with MediPines Corporation.
The remaining author declares that the research was conducted in the absence of any commercial or financial relationships that could be construed as a potential conflict of interest.
Publisher’s Note
All claims expressed in this article are solely those of the authors and do not necessarily represent those of their affiliated organizations, or those of the publisher, the editors and the reviewers. Any product that may be evaluated in this article, or claim that may be made by its manufacturer, is not guaranteed or endorsed by the publisher.
References
Amaza, I., Kalra, H., Eberlein, M., Jethava, Y., McDonell, J., Wolfe, B., et al. (2021). Case studies in physiology: untangling the cause of hypoxemia in a patient with obesity with acute leukemia. J. Appl. Physiol. 131, 788–793. doi: 10.1152/japplphysiol.00867.2020
Cardus, J., Burgos, F., Diaz, O., Roca, J., Barbera, J. A., Marrades, R. M., et al. (1997). Increase in pulmonary ventilation-perfusion inequality with age in healthy individuals. Am. J. Respir. Crit. Care Med. 156, 648–653. doi: 10.1164/ajrccm.156.2.9606016
Comroe, J. H., and Dripps, R. D. (1944). The oxygen tension of arterial blood and alveolar air in normal human subjects. Am. J. Phys. 142, 700–707.
Filley, G. F., Gregoire, F., and Wright, G. W. (1954). Alveolar and arterial oxygen tensions and the significance of the alveolar-arterial oxygen tension difference in normal men. J. Clin. Invest. 33, 517–529. doi: 10.1172/JCI102922
Hopkins, S. R., and Wagner, P. D. (2017). The Multiple Inert Gas Elimination Technique. New York, NY: Springer.
Howe, C. A., MacLeod, D. B., Wainman, L., Oliver, S. J., and Ainslie, P. N. (2020). Validation of a noninvasive assessment of pulmonary gas exchange during exercise in hypoxia. Chest 158, 1644–1650. doi: 10.1016/j.chest.2020.04.017
Kelman, G. R. (1966). Calculation of certain indices of cardio-pulmonary function, using a digital computer. Respir. Physiol. 1, 335–343. doi: 10.1016/0034-5687(66)90050-8
Kelman, G. R. (1968). Computer program for the production of O2-CO2 diagrams. Respir. Physiol. 4, 260–269. doi: 10.1016/0034-5687(68)90057-1
Krogh, A., and Lindhard, J. (1920). The changes in respiration at the transition from work to rest. J. Physiol. 53, 431–439. doi: 10.1113/jphysiol.1920.sp001889
Liu, M. A., Stark, P. C., Prisk, G. K., and West, J. B. (2020). Oxygen deficit is a sensitive measure of mild gas exchange impairment at inspired O2 between 12.5% and 21%. Am. J. Physiol. Lung Cell. Mol. Physiol. 319, L91–L94. doi: 10.1152/ajplung.00003.2020
McGuire, W. C., Crouch, D. R., Pearce, A., West, J. B., Prisk, G. K., Elliott, A. R., et al. (2021). “The use of the alveolar gas meter for assessment of gas exchange abnormalities in COVID–19.” in International Conference of the American Thoracic Society; May 14–19, 2021.
Medbo, J. I., Mohn, A. C., Tabata, I., Bahr, R., Vaage, O., and Sejersted, O. M. (1988). Anaerobic capacity determined by maximal accumulated O2 deficit. J. Appl. Physiol. 64, 50–60. doi: 10.1152/jappl.1988.64.1.50
Patrician, A., Gasho, C., Spajic, B., Caldwell, H. G., Bakovic-Kramaric, D., Barak, O., et al. (2021a). Case studies in physiology: breath-hold diving beyond 100 meters-cardiopulmonary responses in world-champion divers. J. Appl. Physiol. 130, 1345–1350. doi: 10.1152/japplphysiol.00877.2020
Patrician, A., Spajic, B., Gasho, C., Caldwell, H. G., Dawkins, T., Stembridge, M., et al. (2021b). Temporal changes in pulmonary gas exchange efficiency when breath-hold diving below residual volume. Exp. Physiol. 106, 1120–1133. doi: 10.1113/EP089176
Prisk, G. K., and West, J. B. (2019). Deriving the arterial PO2 and oxygen deficit from expired gas and pulse oximetry. J. Appl. Physiol. 127, 1067–1074. doi: 10.1152/japplphysiol.01100.2018
Rahn, H., and Fenn, W. O. (1955). A Graphical Analysis of the Respiratory Gas Exchange. The O2-CO2 Diagram. Washington, DC: American Physiological Society.
Raine, J. M., and Bishop, J. M. (1963). A-a difference in O2 tension and physiological dead space in normal man. J. Appl. Physiol. 18, 284–288. doi: 10.1152/jappl.1963.18.2.284
Riley, R. L., Campbell, E. J., and Shepard, R. H. (1957). A bubble method for estimation of PCO2 and PO2 in whole blood. J. Appl. Physiol. 11, 245–249. doi: 10.1152/jappl.1957.11.2.245
Severinghaus, J. W. (1966). Blood gas calculator. J. Appl. Physiol. 21, 1108–1116. doi: 10.1152/jappl.1966.21.3.1108
Severinghaus, J. W. (2002). The invention and development of blood gas analysis apparatus. Anesthesiology 97, 253–256. doi: 10.1097/00000542-200207000-00031
West, J. B. (1969). Ventilation-perfusion inequality and overall gas exchange in computer models of the lung. Respir. Physiol. 7, 88–110. doi: 10.1016/0034-5687(69)90071-1
West, J. B., Crouch, D. R., Fine, J. M., Makadia, D., Wang, D. L., and Prisk, G. K. (2018a). A new, noninvasive method of measuring impaired pulmonary gas exchange in lung disease: an outpatient study. Chest 154, 363–369. doi: 10.1016/j.chest.2018.02.001
West, J. B., Liu, M. A., Stark, P. C., and Prisk, G. K. (2020). Measuring the efficiency of pulmonary gas exchange using expired gas instead of arterial blood: comparing the “ideal” PO2 of Riley with end-tidal PO2. Am. J. Phys. Lung Cell. Mol. Phys. 319, L289–L293. doi: 10.1152/ajplung.00150.2020
West, J. B., and Luks, A. M. (2016). Respiratory Physiology: The Essentials. Philadelphia: Wolters Kluwer.
West, J. B., Wang, D. L., and Prisk, G. K. (2018b). Measurements of pulmonary gas exchange efficiency using expired gas and oximetry: results in normal subjects. Am. J. Physiol. Lung Cell. Mol. Physiol. 314, L686–L689. doi: 10.1152/ajplung.00499.2017
Keywords: alveolar-arterial PO2 difference, A-aDO2, pulse oximetry, hypoxemia, Bohr effect
Citation: Prisk GK and West JB (2021) Non-invasive Measurement of Pulmonary Gas Exchange Efficiency: The Oxygen Deficit. Front. Physiol. 12:757857. doi: 10.3389/fphys.2021.757857
Edited by:
Walter Araujo Zin, Federal University of Rio de Janeiro, BrazilReviewed by:
Stephen Rees, Aalborg University, DenmarkDavid Hill, University of North Texas, United States
Copyright © 2021 Prisk and West. This is an open-access article distributed under the terms of the Creative Commons Attribution License (CC BY). The use, distribution or reproduction in other forums is permitted, provided the original author(s) and the copyright owner(s) are credited and that the original publication in this journal is cited, in accordance with accepted academic practice. No use, distribution or reproduction is permitted which does not comply with these terms.
*Correspondence: G. Kim Prisk, a3ByaXNrQGhlYWx0aC51Y3NkLmVkdQ==