 Alyssa D. Brown
 Leah A. Davis
 Matthew J. Fogarty
 Gary C. Sieck
94% of researchers rate our articles as excellent or good
Learn more about the work of our research integrity team to safeguard the quality of each article we publish.
Find out more
ORIGINAL RESEARCH article
Front. Physiol., 28 September 2021
Sec. Striated Muscle Physiology
Volume 12 - 2021 | https://doi.org/10.3389/fphys.2021.727585
This article is part of the Research TopicMuscle Quality in Skeletal Muscle Function Deficit: Recent Advances and Potential Clinical and Therapeutic ImplicationsView all 8 articles
Sarcopenia is characterized by muscle fiber atrophy and weakness, which may be associated with mitochondrial fragmentation and dysfunction. Mitochondrial remodeling and biogenesis in muscle fibers occurs in response to exercise and increased muscle activity. However, the adaptability mitochondria may decrease with age. The diaphragm muscle (DIAm) sustains breathing, via recruitment of fatigue-resistant type I and IIa fibers. More fatigable, type IIx/IIb DIAm fibers are infrequently recruited during airway protective and expulsive behaviors. DIAm sarcopenia is restricted to the atrophy of type IIx/IIb fibers, which impairs higher force airway protective and expulsive behaviors. The aerobic capacity to generate ATP within muscle fibers depends on the volume and intrinsic respiratory capacity of mitochondria. In the present study, mitochondria in type-identified DIAm fibers were labeled using MitoTracker Green and imaged in 3-D using confocal microscopy. Mitochondrial volume density was higher in type I and IIa DIAm fibers compared with type IIx/IIb fibers. Mitochondrial volume density did not change with age in type I and IIa fibers but was reduced in type IIx/IIb fibers in 24-month rats. Furthermore, mitochondria were more fragmented in type IIx/IIb compared with type I and IIa fibers, and worsened in 24-month rats. The maximum respiratory capacity of mitochondria in DIAm fibers was determined using a quantitative histochemical technique to measure the maximum velocity of the succinate dehydrogenase reaction (SDHmax). SDHmax per fiber volume was higher in type I and IIa DIAm fibers and did not change with age. In contrast, SDHmax per fiber volume decreased with age in type IIx/IIb DIAm fibers. There were two distinct clusters for SDHmax per fiber volume and mitochondrial volume density, one comprising type I and IIa fibers and the second comprising type IIx/IIb fibers. The separation of these clusters increased with aging. There was also a clear relation between SDHmax per mitochondrial volume and the extent of mitochondrial fragmentation. The results show that DIAm sarcopenia is restricted to type IIx/IIb DIAm fibers and related to reduced mitochondrial volume, mitochondrial fragmentation and reduced SDHmax per fiber volume.
The diaphragm muscle (DIAm) exhibits reduced specific force (force per cross-sectional area) and atrophy (decreased cross-sectional area) with aging, i.e., sarcopenia. In older (24 months) rats, DIAm fiber atrophy is restricted to type IIx/IIb fibers (Elliott et al., 2016; Khurram et al., 2018b; Fogarty et al., 2019b, 2020), which comprise more fatigable motor units (Sieck and Fournier, 1989; Sieck et al., 1989a; Sieck, 1991, 1995). Aging has no effect on type I and IIa fibers in the rat DIAm (Elliott et al., 2016; Khurram et al., 2018b; Fogarty et al., 2019b, 2020), which comprise fatigue resistant motor units that are recruited during breathing (Sieck and Fournier, 1989; Sieck et al., 1989a; Sieck, 1991, 1995).
It has been suggested that sarcopenia is triggered by mitochondrial fragmentation and dysfunction (Calvani et al., 2013; Marzetti et al., 2013). The aerobic capacity to generate ATP within muscle fibers depends on mitochondrial volume and the intrinsic respiratory capacity of mitochondria. Mitochondria are highly malleable and adapt to energy demand and oxidative stress (Aravamudan et al., 2017; Delmotte et al., 2017; Eisner et al., 2017; Delmotte and Sieck, 2019). This is evident by mitochondrial biogenesis in muscle fibers in response to exercise and increased muscle activity and the demands of homeostasis (Forman et al., 1987; Bereiter-Hahn and Voth, 1994; Prakash et al., 2017). Importantly, it has been reported that mitochondrial biogenesis decreases with age (Reznick et al., 2007; Ungvari et al., 2008). In the DIAm, type I and IIa fibers are very active being recruited to accomplish breathing with a duty cycle of ∼40% (Sieck and Fournier, 1989; Sieck, 1991, 1995; Khurram et al., 2018b). In contrast, type IIx/IIb DIAm fibers are far less active being infrequently recruited only during airway protective and expulsive behaviors with a duty cycle of <10% (Fogarty and Sieck, 2019a,b). Importantly, the ventilatory requirements for the recruitment of type I and IIa fibers continue in old age, whereas the selective atrophy and weakening of type IIx/IIb fibers impairs higher force airway protective and expulsive behaviors in rats (Fogarty et al., 2018b; Khurram et al., 2018b; Fogarty and Sieck, 2019b) and likely in humans (Enright et al., 1994; Tolep et al., 1995; Polkey et al., 1997; Fogarty and Sieck, 2019b). This reduced efficacy of airway defense maneuvers contributes to the increased incidence of respiratory morbidity and mortality in the aging cohort (Polkey et al., 1997; Mylotte et al., 2003; Fogarty et al., 2018a).
In a previous study, we used 2-D electron microscopic (EM) imaging of single type identified rat DIAm fibers to estimate mitochondrial volume densities. We found that there are marked differences in mitochondrial volume densities across rat DIAm fiber types reflecting differences in their activity (Sieck et al., 1998). The mitochondrial volume densities of type I and IIa DIAm fibers were found to be ∼10-fold greater than those of type IIx/IIb fibers (Sieck et al., 1998). However, this 2-D EM approach is greatly limited by the requirement for single fiber dissections, which yield very small sample sizes per fiber type. As an alternative, we recently, we developed and validated a 3-D confocal imaging technique based on MitoTracker Green labeling to quantify mitochondrial volume and morphology in airway smooth muscle cells (Aravamudan et al., 2014, 2017; Delmotte et al., 2017, 2020; Delmotte and Sieck, 2019), primary human skeletal muscle cells (hSkMCs) (Ryan et al., 2015), and phrenic motor neurons (Fogarty et al., 2021b). The present study used this confocal imaging technique to quantify mitochondrial volume and morphology in a large sample of type identified DIAm fibers.
To determine the maximum respiratory capacity of mitochondria in muscle fibers, we previously developed a quantitative histochemical technique to measure the maximum velocity of the succinate dehydrogenase reaction (SDHmax) (Sieck et al., 1986, 1995, 1996; Blanco et al., 1988, 1995; Watchko and Sieck, 1993). Succinate dehydrogenase is a key enzyme in the tricarboxylic acid (TCA) cycle as well as complex II of the mitochondrial electron transport chain. Normalizing SDHmax to muscle fiber volume provides a measure of the total respiratory capacity of a muscle fiber, which we found is higher in type I and IIa DIAm fibers as compared with type IIx/IIb fibers (Sieck et al., 1986, 1995, 1996; Blanco et al., 1988, 1995; Watchko and Sieck, 1993). In the present study, we hypothesize that fiber type differences in SDHmax per muscle fiber volume are due to differences in mitochondrial volume density. Normalizing SDHmax to mitochondrial volume provides a measure of the intrinsic respiratory capacity of mitochondria, which we hypothesize also varies across fiber types due to differences in morphology (e.g., extent of mitochondrial fragmentation). The purpose of the present study was to examine age-related changes in mitochondrial morphology, mitochondrial volume density, and SDHmax in different DIAm fiber types. Overall, we hypothesize that sarcopenia related changes in mitochondrial structure and function are restricted to type IIx/IIb DIAm fibers.
All protocols were approved by the Mayo Clinic Institute Animal Care and Use Committee (IACUC #A57714) and complied with National Institutes of Health (NIH) and American Physiological Society guidelines. Strips of diaphragm tissue were harvested from 24 pathogen-free 6- (young) and 24-month (old) Fischer 344 rats (6 month: 225–330 g; 24 month: 250–430 g; 12 females, 12 males; 6 months obtained from Charles River and 24 months from National Institute of Aging). Two rats per cage were housed under a 12:12 h light–dark cycle with ad libitum access to food and water. The animals were allowed at least 1 week to acclimatize to these conditions before experiments were performed. At the terminal experiment, animals were deeply anesthetized with intraperitoneal injection of ketamine (80 mg/kg) and xylazine (10 mg/kg) and euthanized via exsanguination. Following euthanasia, the DIAm was excised and two adjacent DIAm strips (∼2 mm width) were dissected from the mid-costal region and placed in Rees–Simpson solution (containing, in mM: 135 Na+, 5 K+, 2 Ca2+, 1 Mg2+, 120 Cl–, and 25 HCO3–) aerated with carbogen gas (95% O2–5% CO2) at room temperature. The first strip was used to measure DIAm specific force and fatigue, whereas the second DIAm strip was stretched to 1.5× resting length, which we previously found approximates optimal sarcomere length (2.5 μm) (Prakash et al., 1993a; Zhan et al., 1997). The muscle strip was then pinned to a piece of cork and rapidly frozen by submerging it in melting isopentane that had been cooled in liquid nitrogen. After mounting the strip in optimal cutting temperature (OCT) compound, muscle fibers were transversely sectioned with a cryostat (Reichert Jung Frigocut 2800 Cryostat, Reichert Microscope Services, Depew, NY, United States). For all histological and biochemical studies, alternate serial sections of the same muscle fibers were cut. These alternate sections were used for DIAm fiber type classification, measurement of fiber cross-sectional area, determination of fiber type proportions, calculation of the relative contribution of each fiber type to total DIAm volume, labeling mitochondria and measurement of mitochondrial morphology and volume density and measurement of SDHmax.
The method for determining DIAm fiber types based on immunoreactivity to specific MyHC isoform antibodies has been previously described in detail (Sieck et al., 1995, 1996; Fogarty et al., 2019b). Briefly, three serial sections (cut at 10 μm) were fixed in 4% PFA for 10 min and then were blocked for 2 h in 10% bovine serum albumin. After rinsing with 0.1 PBS, primary antibodies for MyHC isoforms were applied and the sections were incubated overnight (4°C). One section was double-reacted with a primary antibody for MyHCslow (Novus NBP2-50299) and MyHC2A (Novus N1511) isoforms. A second section was reacted with primary antibodies for MyHC2X (1:10 NPB1-22811) and the third was reacted for all-but-IIx MyHC (BF35) isoforms to identify fibers that co-express MyHC2X and MyHC2B isoforms (i.e., IIb fibers). A laminin primary antibody (anti-laminin Sigma L9393) was applied on all sections. The sections were thoroughly rinsed with 0.1 PBS and fluorescently conjugated secondary antibodies were applied at a 1:200 dilution for 2 h at room temperature. In one section, a secondary antibody, Alexa-Fluor 594 conjugated to IgG was used to visualize MyHCSlow and another secondary antibody, Cy5 conjugated to IgM was used to visualize MyHC2A. In an adjacent section, a secondary antibody Alexa-Fluor 594 conjugated to IgG was used to visualize MyHC2X. In all sections, a secondary antibody Alexa-Fluor 405 conjugated to IgG was used to visualize laminin.
The fluorescent signals from the immunoreacted sections were imaged using a 20× oil-immersion objective (NA 1.0) on an Olympus FV2000 laser confocal microscope capable of simultaneous multicolor fluorescence imaging using an argon 405 nm, an argon 594 nm, and HeNe 543 nm lasers for imaging Alexa-Fluor 405, Alexa-Flour 594, and Cy5, respectively. Images were captured in a 1024 × 1024 pixel array, with similar acquisition parameters across preparations. Based on the fluorescence pattern, DIAm fibers were classified as type I, type IIa, and type IIx/IIb as outlined previously (Sieck et al., 1995, 1996; Fogarty et al., 2019b). It should be noted that in previous single fiber studies, we found that the MyHC2B isoform was co-expressed in varying proportions with the MyHC2X isoform (Geiger et al., 1999, 2000, 2001b). In addition, we were not able to validate an antibody for the MyHC2B isoform. For these reasons, DIAm fibers displaying immunoreactivity for MyHC2X were classified as type IIx/IIb. The proportion of different DIAm fiber types and their cross-sectional areas were determined using morphometric tools in ImageJ (United States National Institutes of Health, Bethesda, MD, United States,1 1997–2018).
Methods for measuring DIAm isometric specific force have been previously described in detail (Prakash et al., 1993a; Zhan et al., 1997). Briefly, the DIAm strip was suspended in a tissue bath, with the costal margin clamped and the central tendon tied with silk and attached to a force transducer (6350, Cambridge Technology, MA, United States), and optimal DIAm length (Lo) and supramaximal stimulus settings were established. Electrical field stimulation was achieved via platinum plate electrodes placed on either side of the muscle, with stimulation current provided using a stimulator (701C, Aurora Scientific, ON, Canada). Supramaximal (∼150 mA) stimulus pulses (0.5 ms duration) were delivered at 5, 10, 20, 30, 40, 50, 75, and 100 Hz in 1 s trains.
Fatigue of the DIAm was assessed using a pattern of direct muscle stimulation as previously described (Sieck et al., 1989b, 1991; Lewis et al., 1992; Fogarty et al., 2019b). Briefly, supramaximal (∼150 mA) stimulus pulses (0.05 ms duration) were delivered at 40 Hz in 333 ms trains repeated each second [33% duty cycle, approximating the duty cycle of ventilation (Sieck et al., 1984; Richards et al., 2018)] for 120 s.
Output of the force transducer data was digitized (1 kHz sampling rate) and recorded in LabChart software (ADInstuments, Dunedin, New Zealand). Specific force of the DIAm was calculated by normalizing force to the estimated cross-sectional area of the DIAm strip {muscle cross-sectional area = muscle strip weight (g)/[Lo (cm) × 1.056 g/cm3]} and expressed as N/cm2.
To model the relative contribution of different fiber types to DIAm force generation in 6- and 24-month rats, we used previously published data for maximum specific force generated by different fiber types that were obtained using single permeabilized fibers maximally activated at a pCa = 4.0 (Geiger et al., 1999, 2000, 2001b). The model assumed the previously reported ∼15% decrease in total MyHC isoform concentration with aging (Elliott et al., 2016) were exclusive to the vulnerable type IIx/IIb fibers, as previously established in male and female Fischer 344 rats (Khurram et al., 2018a; Fogarty et al., 2019a,b, 2020). The specific DIAm force in the model was obtained by multiplying the fiber type-specific contribution to total DIAm volume by the calculated fiber type specific specific force, and normalizing for interstitial space. The parameters used in modeling DIAm specific force are reported in Table 1. For modeling the specific force following 2 min of repeated fatiguing activations, we assumed type-specific fatigue indices (0.8 for type I and IIa and 0.1 for type IIx/IIb), based on prior reports (Fournier and Sieck, 1988).
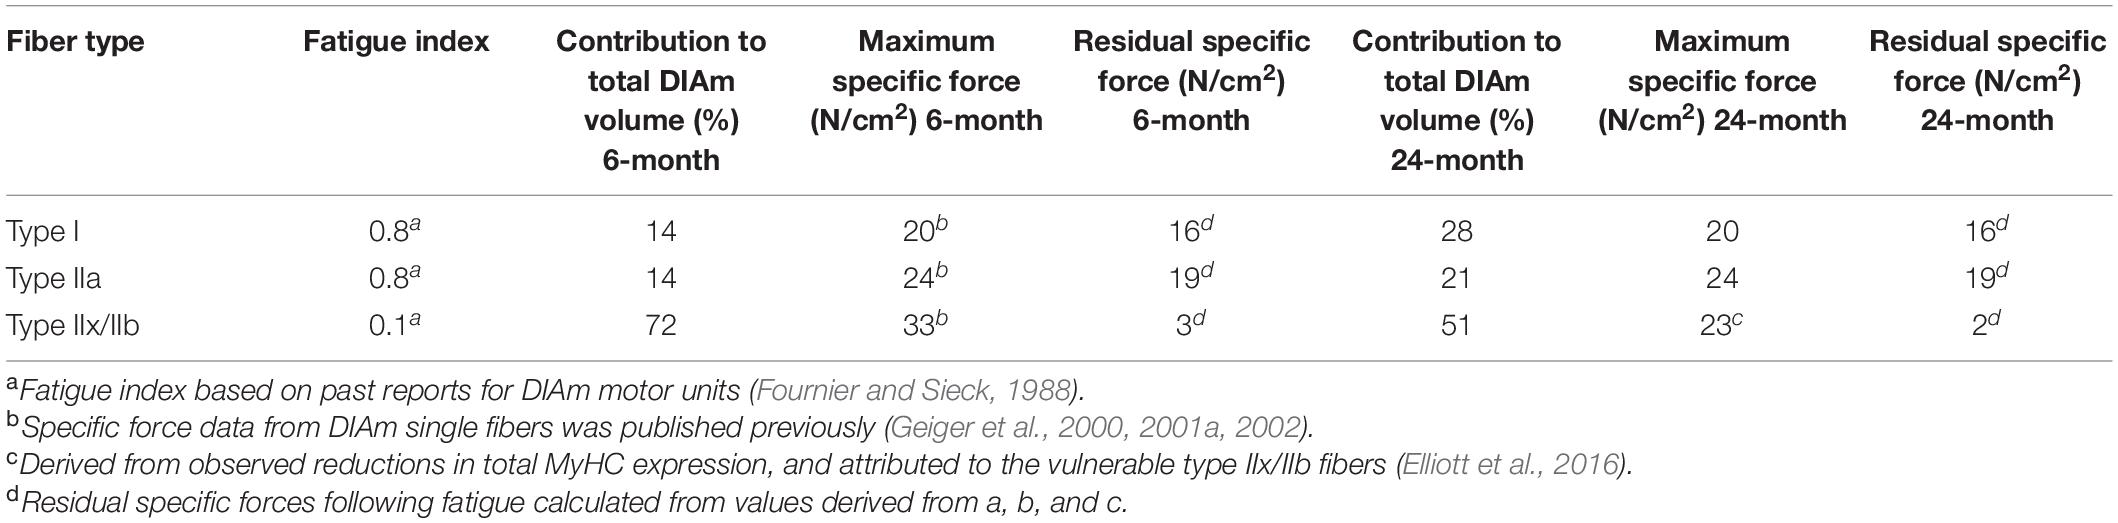
Table 1. Single fiber characteristics for DIAm Force Model.
The methods used to label and image mitochondria using MitoTracker Green and confocal microscopy have been previously described in detail (Delmotte et al., 2017, 2020). Briefly, 10 μm transverse sections of the same muscle fibers were incubated for 30 min in a MitoTracker Green solution (1.5 μL MitoTracker Green in 5 mL PBS). After thoroughly washing the sections with PBS three times (10 min each), the sections were cover-slipped for imaging. Mitochondria were visualized using an Olympus FV2000 laser scanning confocal microscope (Olympus Life Sciences Solutions, Waltham, MA, United States) at 16-bit resolution (1.096 gray levels), 1024 × 1024 pixels using a 40× Plan Apo oil-immersion objective (NA 1.40). The confocal imaging techniques used have been previously reported in detail (Prakash et al., 1993b; Sieck et al., 1999). The calculated point spread function for the 40× objective was used to set a Z-axis step size of 0.5 μm (voxel dimensions: 0.207 × 0.207 × 0.5 μm). The photomultiplier settings and laser intensity were adjusted using two different regions of interests (ROI): one with no MitoTracker Green signal and a second ROI with saturated MitoTracker Green signal. The ROI with no MitoTracker Green signal was used to adjust the black level so that the gray levels were not saturated, but the gray levels were <10% of the dynamic range. The other ROI with the most intense MitoTracker Green fluorescence was used to adjust the gain to maximize the dynamic range, while preventing saturation of the image.
To improve spatial resolution, each 0.5 μm optical slice within the 10 μm Z-stack (20 optical slices) was deconvolved using a blind deconvolution algorithm (Point Scan Confocal, three iterations; NIS-Elements; Nikon Instruments Inc., SCR_014329) (Fogarty et al., 2021b). This deconvolution algorithm increases spatial resolution twofold. The deconvolved images were then processed for background correction, ridge filter detection, skeletonization, and thresholding using ImageJ software (see text footnote 1, Fiji, SCR_002285), as previously described (Koopman et al., 2005, 2006; Delmotte et al., 2017). In this method, the gray level of MitoTracker Green fluorescence in the images was thresholded to identify MitoTracker containing voxels, and binary images were created (Figure 3). These binarized images were reconstructed in 3-D using ImageJ and NIS-Elements.
The ImageJ/Fiji Mitochondria Analyzer plug-in was used to assess mitochondrial morphology, including mitochondrial volume, surface area, mean branch length (μm), and mitochondrial complexity index (MCI) (Vincent et al., 2019). MCI is calculated using the following equation:
where SA is total mitochondrial surface area within a fiber. V is the total mitochondrial volume within the muscle. Mitochondria that are more fragmented exhibit a lower mean branch length and a lower MCI.
The quantitative histochemical procedure for measuring SDHmax in muscle fibers has been previously described in detail (Sieck et al., 1986; Blanco et al., 1988). Briefly, 6 μm thick transverse serial sections of the same DIAm fibers were placed in a solution containing 80 mM succinate with 1.5 mM nitro blue tetrazolium (NBT – reaction indicator), 5 mM EDTA, 0.2 mM mPMS, and 0.1 mM azide in 0.1 M phosphate buffer (pH = 7.6) kept at 25°C. Previously, we confirmed that succinate concentrations >80 mM does not substrate limit the SDH reaction in DIAm fibers. In the quantitative histochemical procedure, the progressive precipitation of a reduced NBT (NBT diformazan, NBTdfz) is used as the reaction indicator. The accumulation of the NBTdfz precipitate in muscle fibers was quantified using a computer-based imaging system consisting of a light microscope (Olympus IX71, Olympus America, Melville, NY, United States) with an attached camera (Hamamatsu ORCA Flash 4.0, Model C11440). An interference filter (570 nm) was used to limit the spectral range of the light source to the maximum absorption wavelength of NBTdfz. Images were acquired every 15 s as the SDH reaction proceeded using a 60× objective (1.0 NA) and captured in a 1024 × 1024 pixel array, with similar acquisition parameters across preparations. In a separate preliminary study, we confirmed that the OD of fibers exposed to a control solution containing no succinate substrate was the same as that for fibers exposed to the succinate-containing solution at the initiation of the reaction (i.e., at time 0 s). Thus, [NBTdfz] (OD at 570 nm) in delineated DIAm fibers was measured every 15 s, and the linearity of the change in [NBTdfz] during the SDH reaction was confirmed for all fibers. From repeated images, the SDHmax was calculated using the Beer–Lambert–Bouguer law (below):
where OD is the average optical density within the boundary of a DIAm fiber, k is the molar extinction coefficient for NBTdfz (26,478 mol/cm), and l is the path length of light absorbance (6 μm). OD was calibrated with a series of known gray levels at 16-bit resolution (1096 gray levels).
In separate studies, we assessed whether the measurement of SDHmax reflects the maximum respiratory capacity of muscle fibers by using a stress test similar to that used in respirometry systems. In the stress test, the muscle sections were treated (or untreated) with 1 mM FCCP (2-[2-[4-(trifluoromethoxy)phenyl]hydrazinylidene]-propanedinitrile), a protonophore that uncouples O2 consumption from the proton gradient. In a second part of the stress test, alternate sections of the same fibers were treated (or untreated) with rotenone (1 mM) to inhibit complex I of the electron transport chain and antimycin A (1 mM) to inhibit complex III (Ly and Ryall, 2017; Jacques et al., 2020). Respirometry systems rely on changes in O2 consumption rate in response to these same compounds to determine the basal and maximum respiratory capacity (O2 consumption rate). The rate of the SDH reaction was unaffected by treatment with FCCP across all fiber types, indicating that SDHmax reflects the maximum respiratory capacity of muscle fibers. In contrast, the rate of the SDH reaction was markedly blunted by treatment with rotenone and antimycin A across all DIAm fiber types (P < 0.002 for all combinations, Bonferroni post hoc tests), again consistent with SDHmax as a measure of the maximum respiratory capacity of muscle fibers.
Based on the Beer–Lambert–Bouguer law, SDHmax within individual DIAm fiber volumes was expressed as millimoles of fumarate/Lfiber/min. The SDHmax per fiber volume was also normalized for mitochondrial volume density within DIAm fibers to calculate SDHmax per mitochondrial volume, which was expressed as millimoles of fumarate/Lmito/min. This provided a measure of the maximum respiratory capacity of mitochondria within type identified DIAm fibers.
The number of animals required for adequate power when assessing force and fatigue data was estimated based on previous data (n = 8–10 per group) (Gosselin et al., 1994; Fogarty et al., 2019b, 2020). Power analysis to determine the sample size for the SDH procedures (n = 15 fibers per type per animal) based on previous SDHmax data from type-identified DIAm fibers in 6-month adult rats (Sieck et al., 1995; Fogarty et al., 2020). The expected effect size (Cohen’s d) was calculated with an a priori biologically relevant difference of 25% and equal variance, with sample size required estimated using d = 1.4, α = 0.05, and β = 0.8. Two-way repeated measures ANOVA and Bonferroni post hoc tests were used to compare differences between age groups and factor (fiber type). Although we were not powered to detect a sex difference, and our force, fatigue, and DIAm fiber type specific outcome measurements have previously included both males and females, sex differences were explored using either two- or one-way ANOVAS. outcome Linear relations were assessed with Pearson’s coefficients. All data were assessed for normality with Shapiro–Wilk tests. Significance was set as P < 0.05, all data are presented as mean ± 95% confidence intervals (CIs), unless otherwise stated. All statistics were performed in Prism 8 (GraphPad, CA, United States).
Classification of DIAm fiber types was based on immunoreactivity to specific MyHC antibodies (Figure 1A). The proportional volume of DIAm occupied by interstitial, non-muscle fiber space was unchanged in 6-month (22 ± 7%) compared with 24-month (20 ± 6%) rats (P = 0.78, unpaired t-test; Figure 1B), similar to past reports (Khurram et al., 2018b). The proportions of different fiber types in the DIAm were dependent on the interaction of fiber type and age [F(2,44) = 13.8, P < 0.0001], but not fiber type alone [F(1.9,41.2) = 2.4, P = 0.10], nor age alone [F(1,22) = 1.2, P = 0.28; two-way ANOVAs; Figure 1C]. Bonferroni post hoc tests showed an increase in the proportion of type I fibers in 24-month compared with 6-month (P = 0.01) rats, and a decrease in the proportion of type IIx/IIb fibers in 24-month compared with 6-month rats (P = 0.002; Figure 1C). The cross-sectional areas of DIAm fibers were dependent on fiber type [F(1.2,25.9) = 824.9, P < 0.0001], age [F(1,22) = 43.0, P < 0.0001], and the interaction between fiber type and age [F(2,44) = 68.5, P < 0.0001; two-way ANOVAs; Figure 1D]. Bonferroni post hoc test show no difference in the cross sectional areas of type I (6-month: 802 ± 105 μm2; 24-month: 734 ± 74 μm2; P = 0.46) nor type IIa fibers (6-month: 755 ± 87 μm2; 24-month: 793 ± 92 μm2; P > 0.99) between 6-month and 24-month rats (Figure 1D). However, the cross-sectional areas of type IIx/IIb DIAm fibers were ∼39% smaller in 24-month (2306 ± 249 μm2) compared to 6-month (3584 ± 437 μm2) rats (P < 0.0001; Figure 1D). The relative contributions of different fiber types to total DIAm volume was dependent on fiber type [F(1.6,34.2) = 268.2, P < 0.0001] and the interaction between fiber type and age [F(2,44) = 36.3, P < 0.0001], but not age alone [F(1,22) = 0.4, P = 0.57; two-way ANOVAs; Figure 1E]. Bonferroni post hoc test showed a greater relative contribution of type I (P = 0.002) and type IIa (P < 0.0001) fibers to total DIAm volume in 24-month compared with 6-month rats, and a lower relative contribution of type IIx/IIb fibers to total DIAm volume in 24-month compared with 6-month rats (P < 0.0001; Figure 1E).
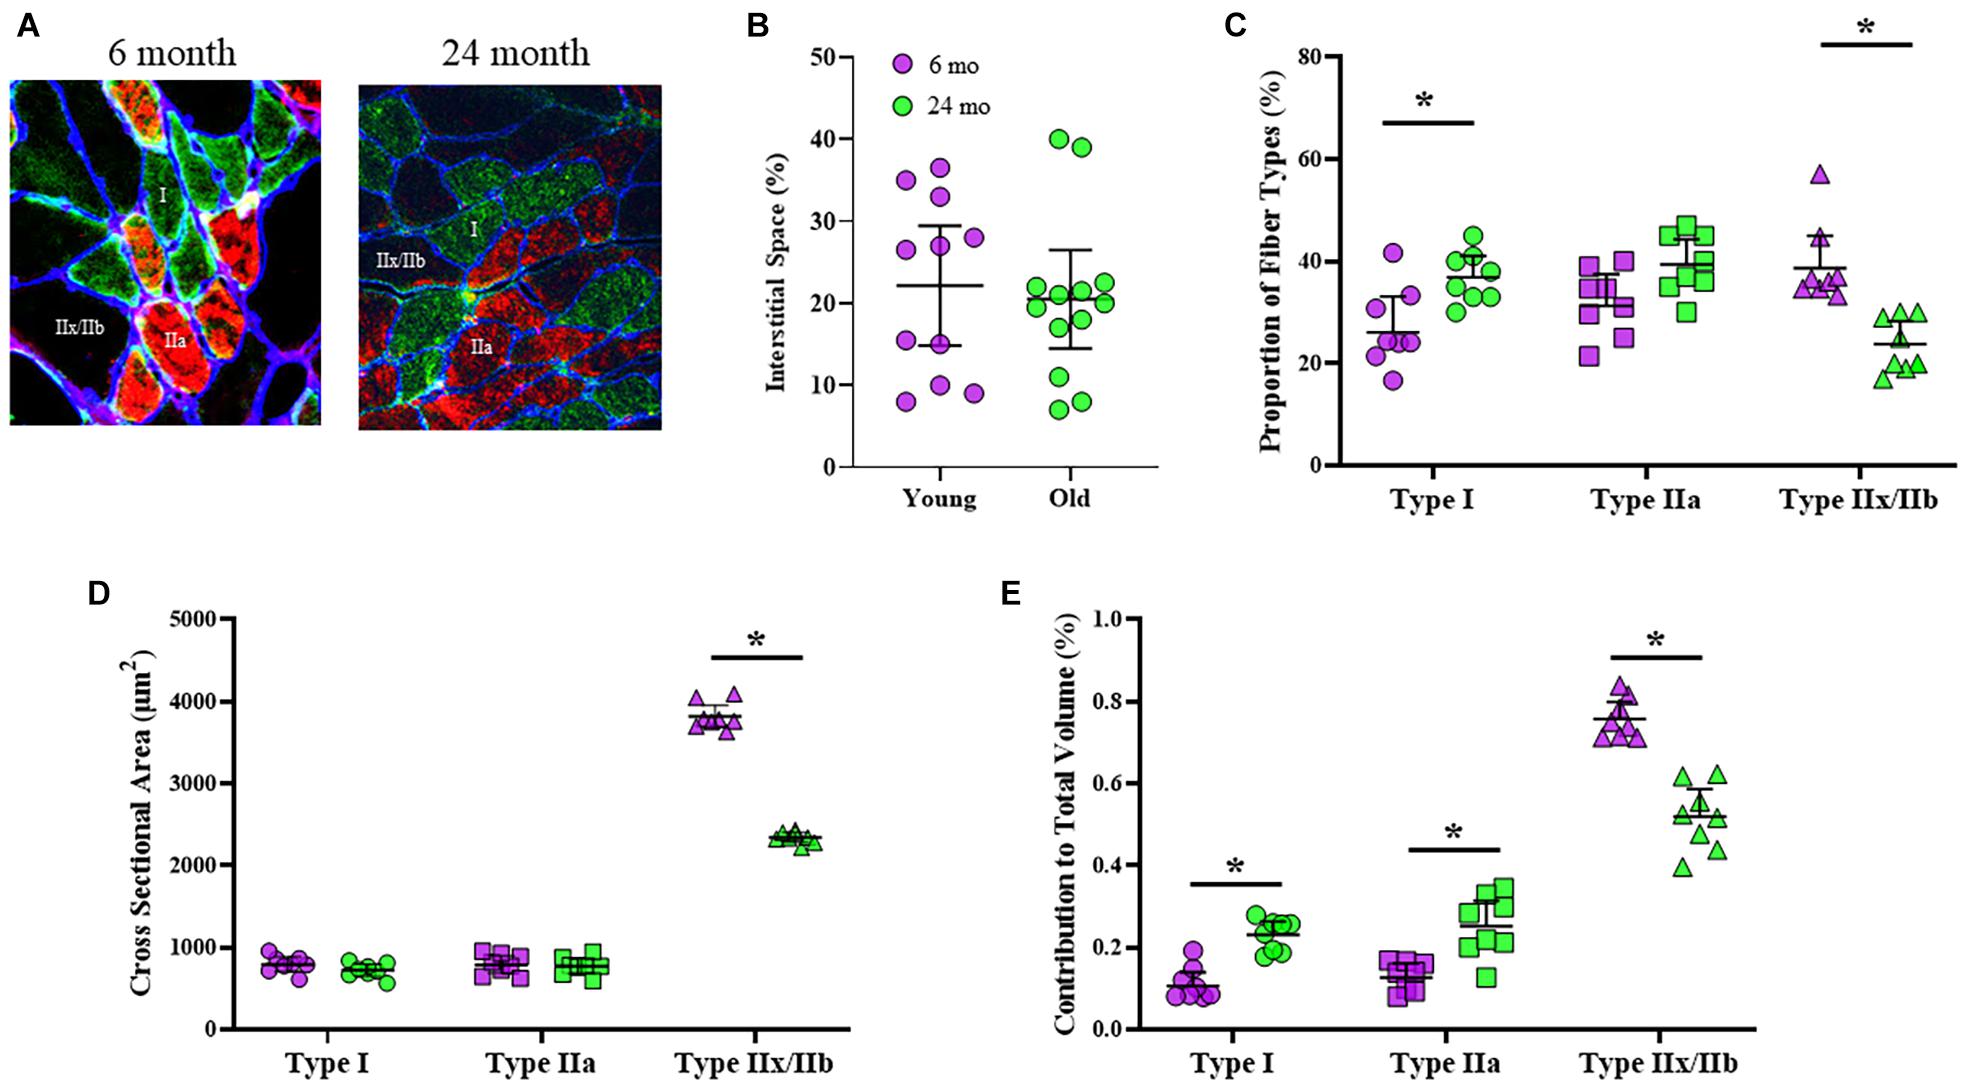
Figure 1. (A) Representative, triple-labeled images of fiber typing based on immunoreactivity to primary antibodies for MyHCslow (red) and MyHC2A (green) isoforms with the inclusion of a primary antibody for laminin (blue) to clearly define the muscle fiber borders. (B) Scatterplot showing that the relative contribution of interstitial space to total DIAm cross-sectional area was unchanged between 6-month (purple) and 24-month (green) Fischer 344 rats (Student’s unpaired t-test, P > 0.05). (C) Scatterplot showing an increased proportion of type I fibers (circles) and a decreased proportion of type IIx/IIb fibers (triangles) in 24-month compared with 6-month rats (two-way ANOVA, *P < 0.05). (D) Scatterplot showing the mean fiber cross-sectional areas of type I (circles), type IIa (squares), and type IIx/IIb (triangles) fibers. Note the selective reduction in cross-sectional area of type IIx/IIb DIAm fibers in 24-month compared with 6-month rats (two-way ANOVA, *P < 0.05). (E) Scatterplot showing the relative contributions of each fiber type to total DIAm volume. Note the increased contribution of both type I and IIa DIAm fibers and the reduction in type IIx/IIb fibers to total DIAm volume in 24-month compared with 6-month rats (two-way ANOVA, *P < 0.05). All data sets include female and male rats per age group (see Table 2) with 15 fibers per type in each DIAm.
When type specific cross-sectional areas of DIAm fibers were stratified by sex, we observed no significant differences between males and females [F(1,20) = 0.3, P = 0.56; three-way ANOVA; Table 2], with Bonferroni post hoc tests confirming a selective effect of reduced cross-sectional area of type IIx/IIb fibers in 24-month female (P = 0.02) and male (P = 0.04) rats (Table 2).
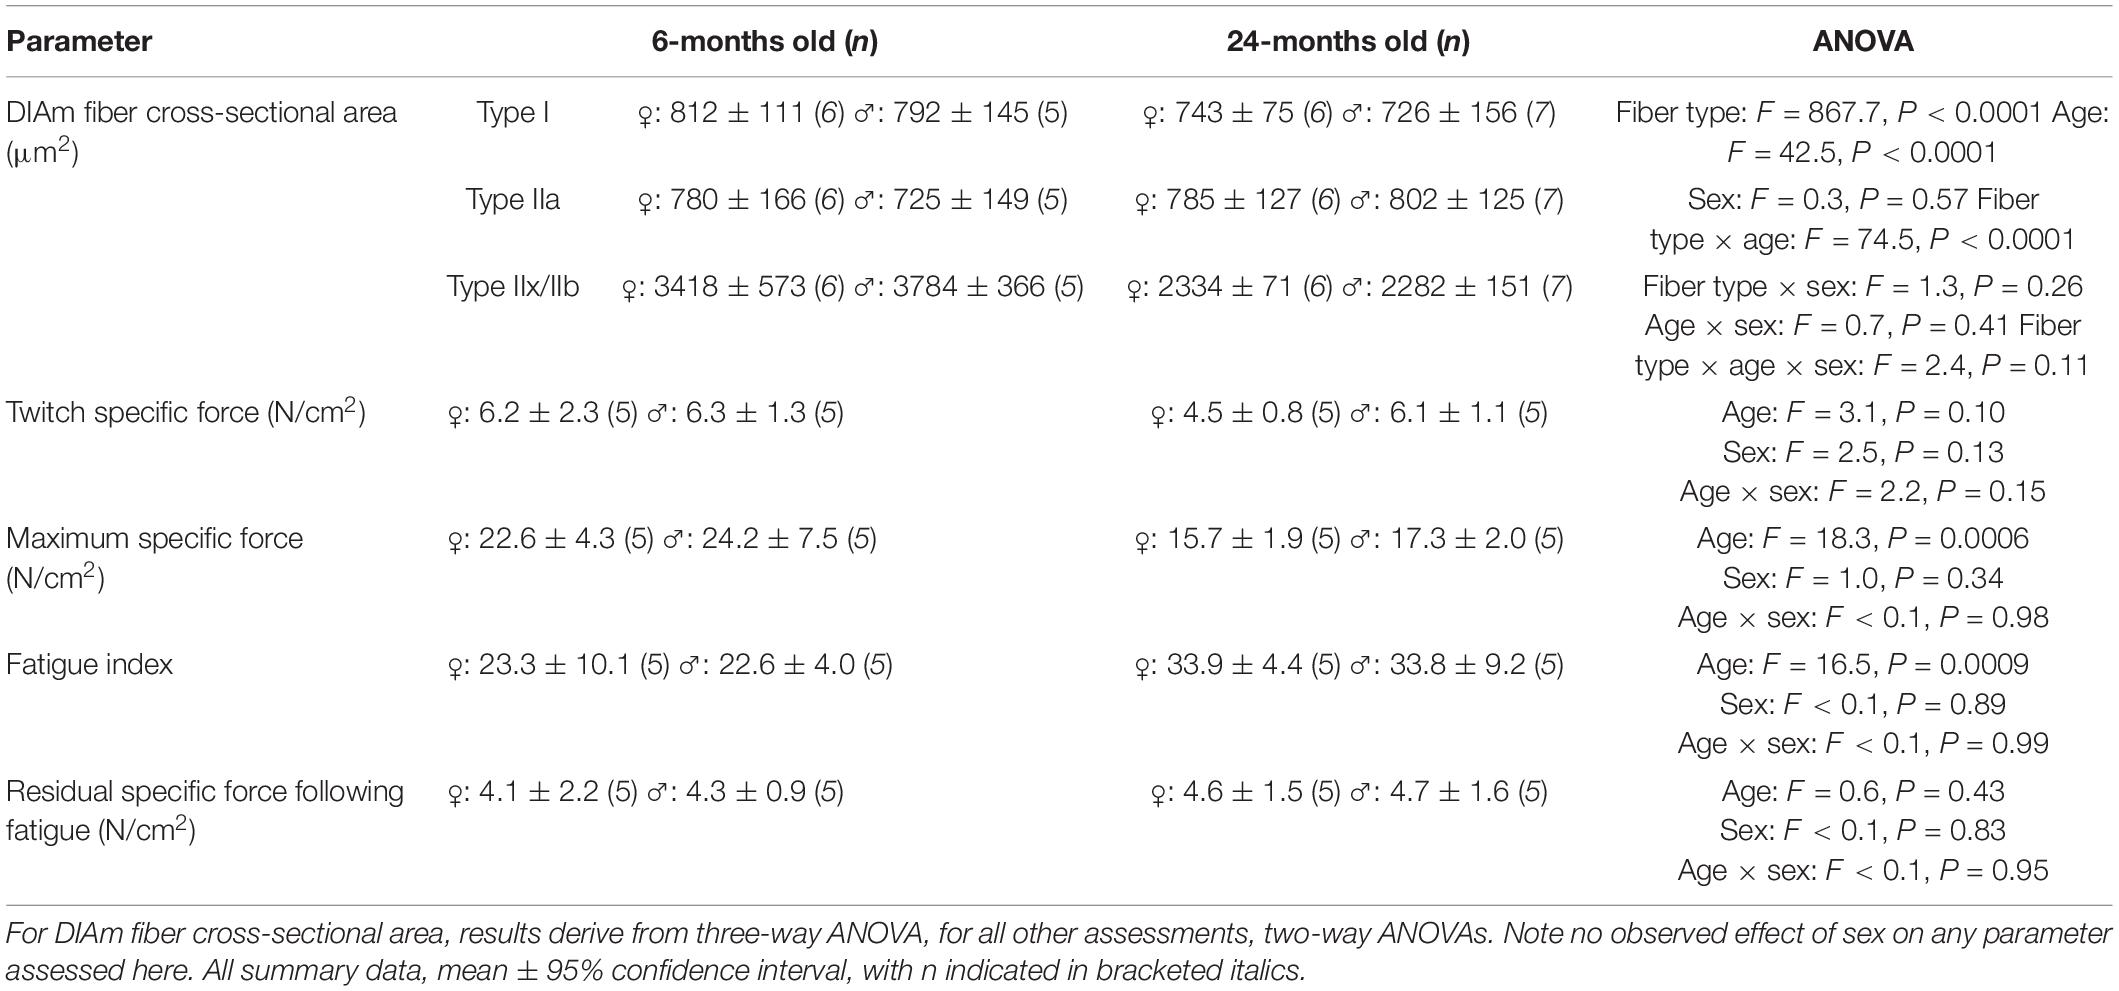
Table 2. Results for DIAm cross-sectional area, force, and fatigue stratified by sex.
Specific isometric force generation was assessed in 6- and 24-month rats (Figure 2A). No significant change in DIAm specific twitch force was observed between 6-month (5.9 ± 1.0 N/cm2, n = 10) and 24-month (4.6 ± 1.1 N/cm2, n = 10) rats (P = 0.08, unpaired t-test). When stratified for sex, we observed no differences in twitch force between females and males [F(1,16) = 2.5, P = 0.13; two-way ANOVA; Table 2], nor with age [F(1,16) = 3.1, P = 0.10; two-way ANOVA; Table 2].
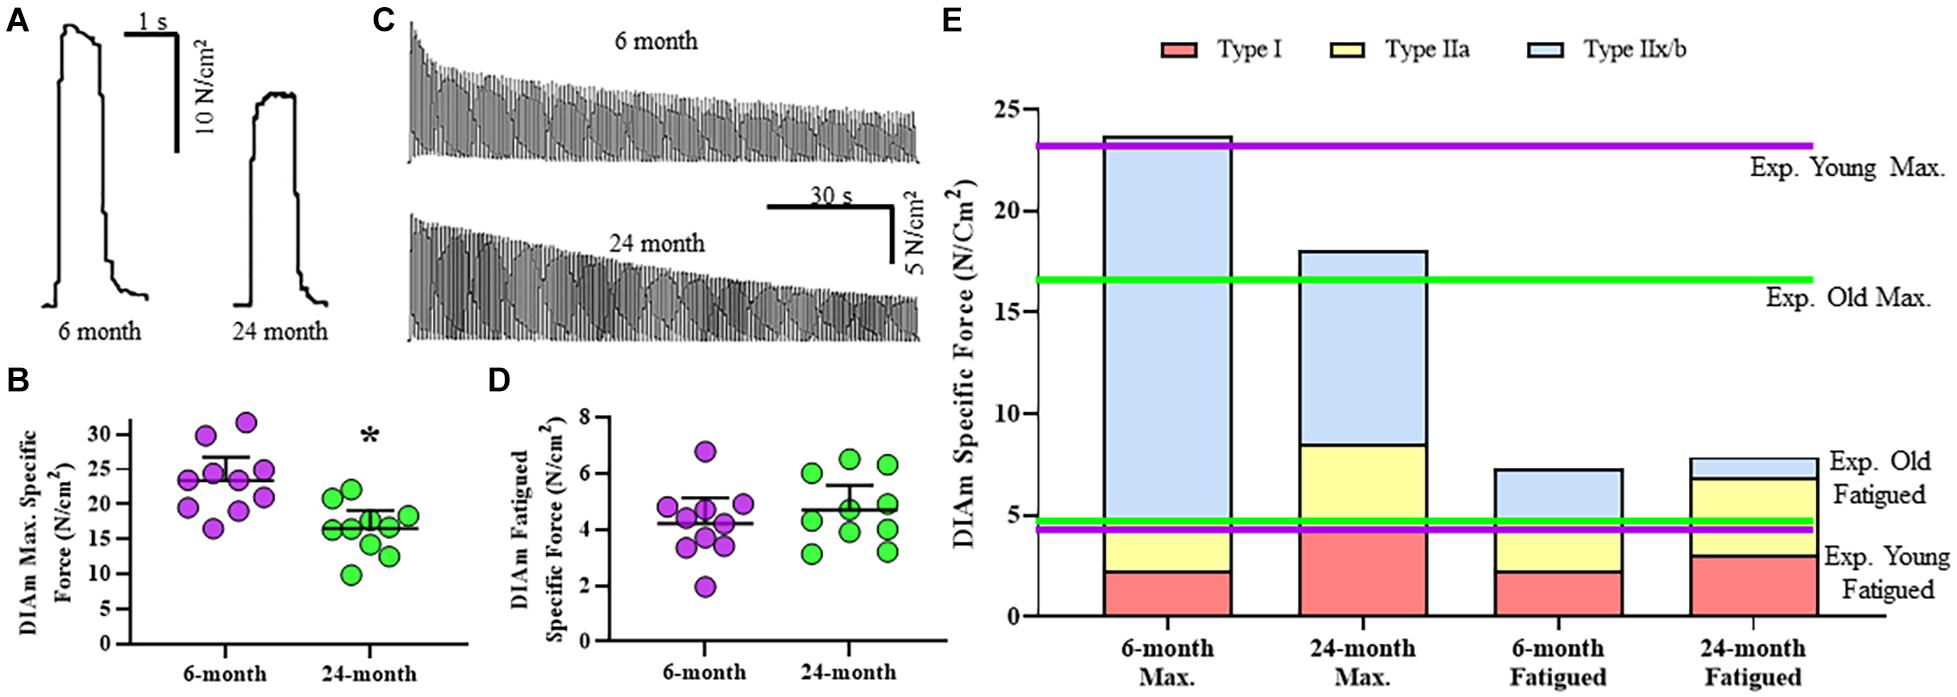
Figure 2. (A) Representative raw tracings of the maximum specific force generated at 75 Hz stimulation by the DIAm from a 6-month compared with a 24-month Fischer 344 rat (both male rats). (B) Scatterplot showing reduced DIAm maximum specific force in 24-month compared with 6-month rats (Student’s unpaired t-test, *P < 0.05). (C) Representative traces of the force decline (fatigue) of the DIAm during repeated stimulation at 40 Hz in 0.33 s duration trains repeated each second across a 2 min period from a 6-month compared with a 24-month rat. (D) Scatterplot showing unchanged DIAm specific force following 2 min of repeated activations in 24-month compared with 6-month rats (Student’s unpaired t-test, P > 0.05). (E) The maximum specific force contributed by type I (red boxes), type IIa (yellow boxes), and type IIx/IIb (blue boxes) DIAm fibers was modeled for 6-month compared with 24-month rats based on differences in fiber type contributions to total DIAm volume and previously reported differences in specific force generated by each fiber type (see Table 1). Experimental observations of DIAm specific force were superimposed in dashed lines for 6-month (dashed purple line) and 24-month (dashed green line) rats.
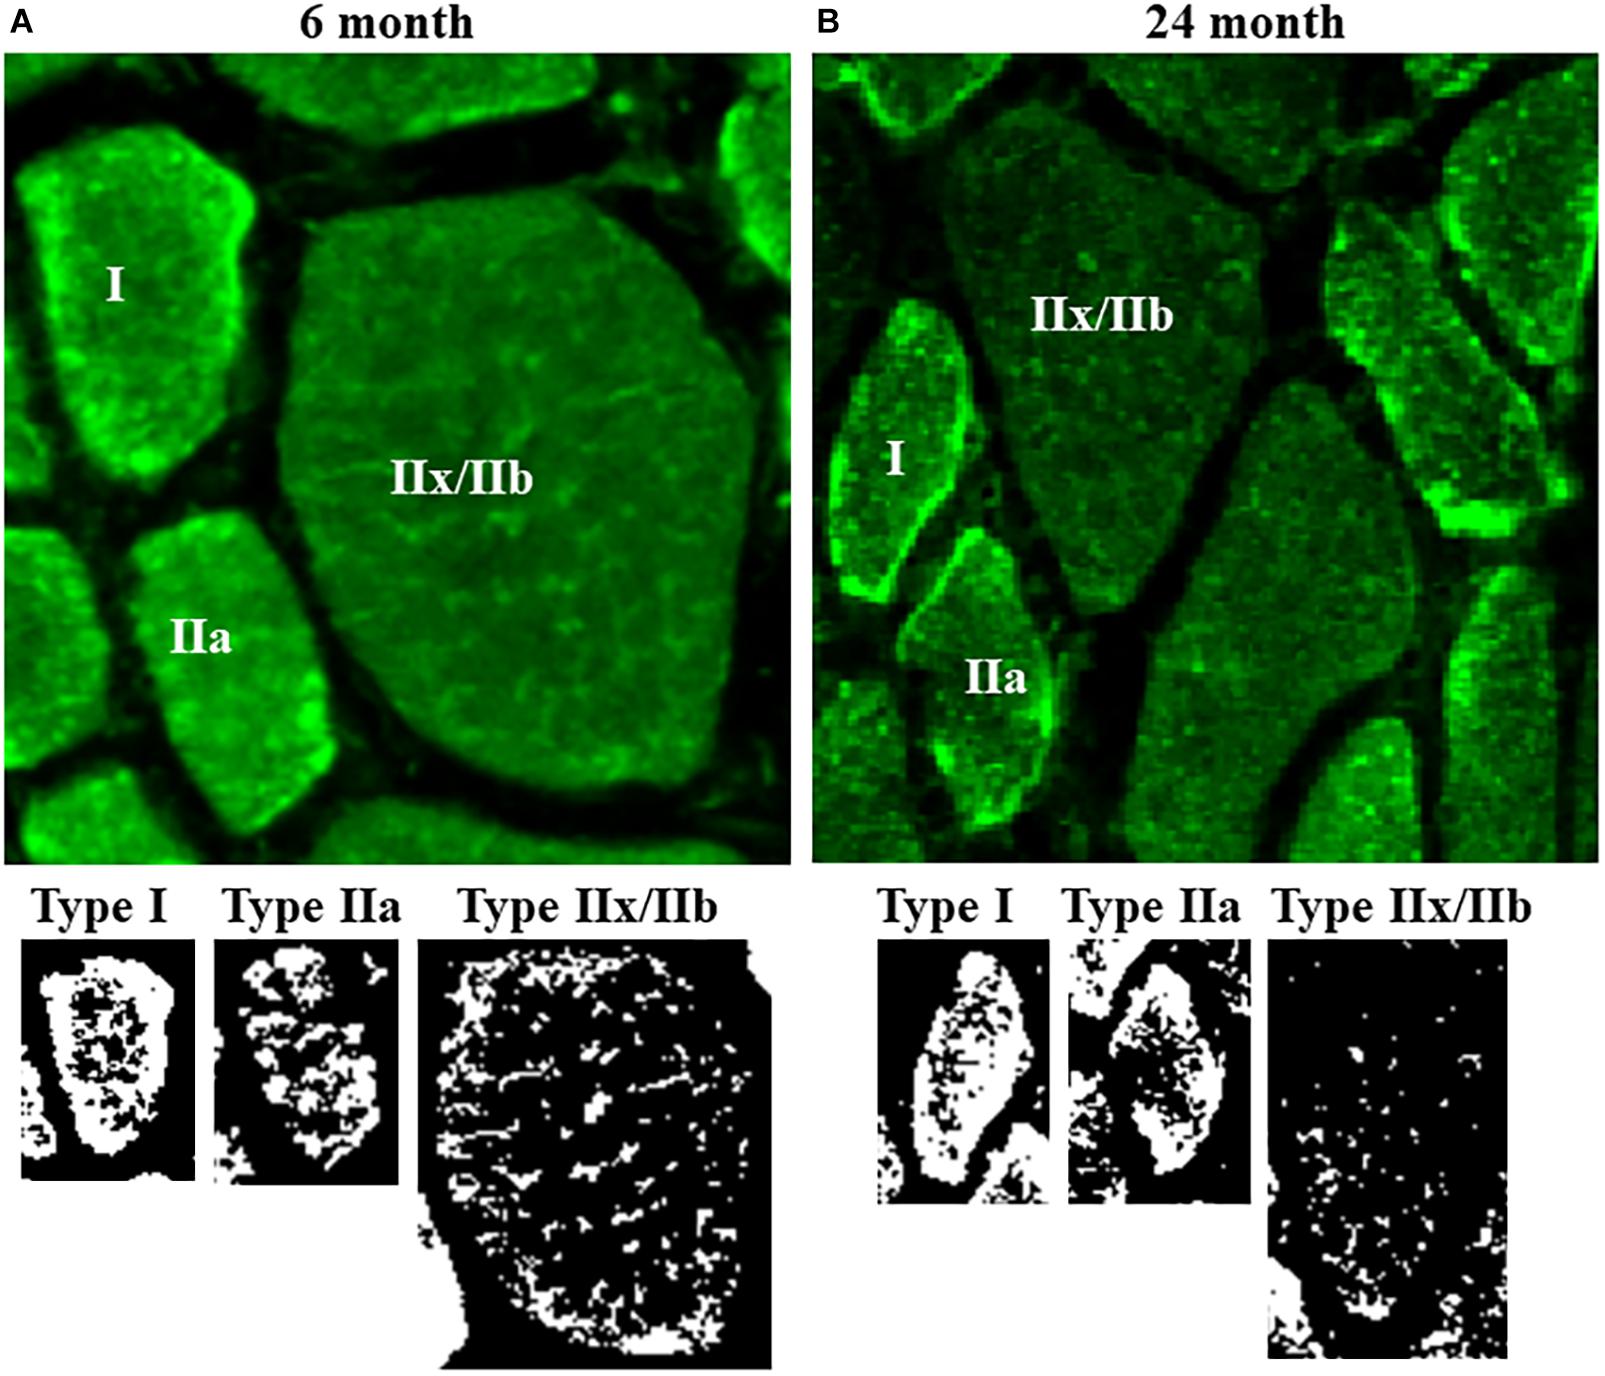
Figure 3. (A) Representative photomicrographs of mitochondria labeled using MitoTracker Green in DIAm fibers from 6-month and 24-month Fischer 344 rats in alternate serial sections (same fibers used for MyHC fiber type classification and SDHmax measurements) cut at 10 μm thickness. MitoTracker Green fluorescence was visualized using an Olympus FV2000 laser scanning confocal microscope. (B) Fluorescence intensity was thresholded to produce binary images of the MitoTracker Green labeled mitochondria.
The maximum DIAm specific force (generated at 75 Hz stimulation) was reduced by 29% in 24-month (16.5 ± 2.6 N/cm2, n = 10) compared with 6-month rats (23.4 ± 3.4 N/cm2, n = 10; P = 0.002, unpaired t-test; Figure 2B). When stratified for sex, we observed no differences in maximum DIAm force between females and males [F(1,16) = 1.0, P = 0.34; two-way ANOVA; Table 2], however, the effect of reduced force with age [F(1,16) = 18.3, P = 0.0006; two-way ANOVA; Table 2] was maintained in both 24-month female (P = 0.01, Bonferroni post hoc test) and male (P = 0.04, Bonferroni post hoc test) rats.
Age-related changes in maximum specific force in DIAm from 6- and 24-month rats were estimated in a model based on measured changes in fiber type proportions, cross-sectional areas, the relative contribution of each fiber type to total DIAm volume. The model also included previously reported differences in maximum specific force across fiber types (Geiger et al., 1999, 2000, 2001b). The model also accounted for an ∼37% combined reduction in the concentration of MyHC2X and/or MyHC2B isoforms previously reported (Elliott et al., 2016) and the consequent impact on the specific force of type IIx/IIb DIAm fibers. The estimates of maximum DIAm specific force were compared to actual measured specific force for 6- and 24-month rats (Figure 2E). Notably, in 6-month rats, the estimated maximum specific force closely approximated the maximum specific force that was observed experimentally (∼2.5% difference; Figure 2E). For 24-month rats, the estimate of maximum DIAm specific force predicted by modeling also closely approximated that observed experimentally (Figure 2E).
Diaphragm muscle force generated at 40 Hz stimulation declined with repetitive activation across a 2-min period in both 6- and 24-month rats, reflecting force fatigue (Figure 2C). Due to the higher initial force generated by the DIAm in 6-month rats, the decline in force was greater in 6-month compared with 24-month rats. This decline in force was reflected by the fatigue index calculated as the ratio of residual force after 2 min to the initial force. Accordingly, the fatigue index of the DIAm of 24-month rats was improved compared with 6-month rats (6-month: 22.9 ± 4.2%, n = 10; 24-month: 33.8 ± 4.0%, n = 10; P = 0.0004, unpaired t-test). When stratified for sex, we observed no differences in fatigue index between females and males [F(1,16) < 0.1, P = 0.89; two-way ANOVA; Table 2].
This apparent improvement in fatigue resistance was due primarily to the lower initial specific force generated by the DIAm from the 24- compared with 6-month rats. Importantly, the residual specific forces of the DIAm following 2 min of repetitive activation were not statistically different between 6- (4.2 ± 0.9 N/cm2, n = 10) and 24-month (4.7 ± 1.1 N/cm2, n = 10) rats (P = 0.41, unpaired t-test; Figure 2D). When stratified for sex, we observed no differences in residual DIAm force following fatigue between females and males [F(1,16) < 0.1, P = 0.83; two-way ANOVA; Table 2].
Similar to the maximum specific force, we modeled the residual DIAm specific force predicted after 2 min of repetitive activation in 6- and 24-month rats (Figure 2E). Our model accounted for differences in fatigue indices that define motor unit types (Fournier and Sieck, 1988), fiber type specific contribution to total DIAm volume and fiber-type dependent specific forces (Geiger et al., 1999, 2000, 2001a,b). In contrast to the model of maximum specific force, the model of residual force following fatigue did not match the experimentally observed results for the DIAm in both 6- and 24-month rats (Figure 2E). The actual residual force measured experimentally was ∼27–30% less than that predicted by our model (∼4.7 N/cm2 predicted vs. ∼6.5 N/cm2 actual; Figure 2E).
Mitochondria within type identified DIAm fibers were labeled using MitoTracker Green, imaged using confocal microscopy and converted to binary images post acquisition (Figure 3). Within 10 μm transverse sections of DIAm fibers, mitochondrial volume was dependent on age [F(1,42) = 658.9, P < 0.0001], fiber type [F(2,42) = 598.3, P < 0.0001], and the interaction between age and fiber type [F(2,42) = 561.3, P < 0.0001; two-way ANOVA; Figure 4A]. Bonferroni post hoc tests showed no age-associated differences in mitochondrial volume in type I (6-month: 238 ± 27 μm3; 24-month: 212 ± 14 μm3; P = 0.64) and IIa (6-month: 237 ± 20 μm3; 24-month: 234 ± 22 μm3; P > 0.99) fibers (Figure 4A). However, mitochondrial volume was markedly reduced with age in type IIx/IIb fibers (6-month: 749 ± 21 μm3; 24-month: 231 ± 17 μm3; P < 0.0001; Figure 4A). Mitochondrial volume was greater in type IIx/IIb fibers from 6-month rats compared with all other fibers of all ages (P < 0.05 for all comparisons; Figure 4A). However, the ∼3.8-fold greater mitochondrial volume in type IIx/IIb DIAm fibers in 6-month rats was disproportionately less than the ∼4-5-fold difference in fiber volume, as reflected in differences in mitochondrial volume density across fiber types (Figure 4A). Accordingly, mitochondrial volume density was significantly lower in type IIx/IIb DIAm fibers compared with type I and IIa fibers in both 6- and 24-month rats (P < 0.05 for all comparisons; Figure 4B). Mitochondrial volume density was dependent on age [F(1,42) = 115.5, P < 0.0001], fiber type [F(2,42) = 2397, P < 0.0001], and the interaction between age and fiber type [F(2,42) = 101.7, P < 0.0001; two-way ANOVA; Figure 4B]. Bonferroni post hoc tests showed no age-associated differences in mitochondrial volume density in type I (6-month: 32.8 ± 0.5; 24-month: 32.0 ± 0.6; P = 0.85) and IIa (6-month: 32.2 ± 1.0; 24-month: 32.6 ± 0.7; P > 0.99) fibers (Figure 4B). However, mitochondrial volume density was markedly reduced with age in type IIx/IIb fibers (6-month: 18.0 ± 0.6; 24-month: 10.4 ± 0.7; P < 0.0001; Figure 4B).
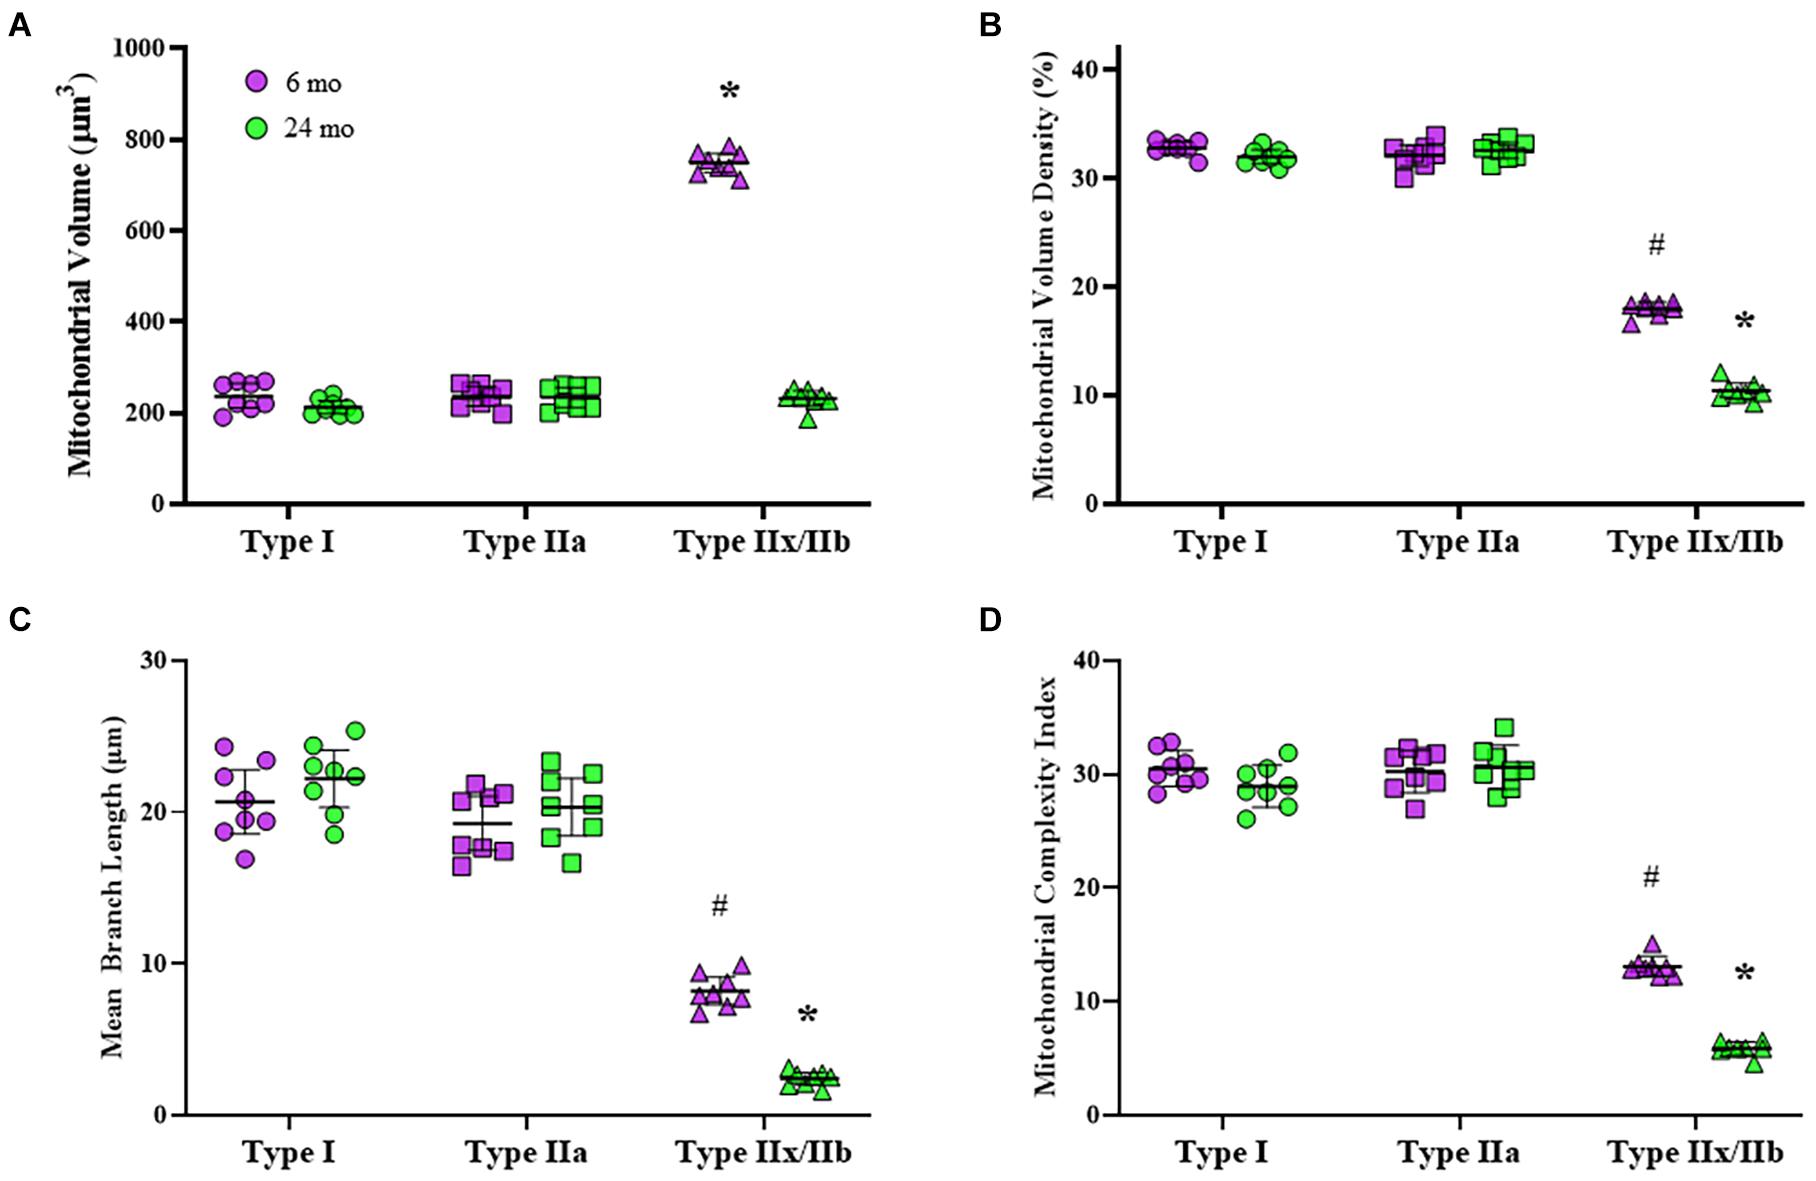
Figure 4. (A) Scatterplot showing that mean mitochondrial volume in type I (circles) and IIa (squares) DIAm fibers is unchanged between 6-month (purple) and 24-month (green) Fischer 344 rats. Mitochondrial volume in type IIx/IIb (triangles) DIAm fibers was significantly lower in 24-month compared with 6-month rats (two-way ANOVA, *P < 0.05). (B) Scatterplot of the mean mitochondrial volume density of type I, type IIa, and type IIx/IIb fibers. There were no differences in mitochondrial volume densities between type I and IIa fibers at either age. Mitochondrial volume density in type IIx/IIb fibers was lower than that of type I or IIa fibers at both ages and was significantly reduced in 24-month compared with 6-month rats (two-way ANOVA, *P < 0.05). (C) Scatterplot showing that mean mitochondrial branch length (μm) in type I and IIa fibers was similar at both ages and was not different between 6-month and 24-month rats. Mitochondrial branch length in type IIx/IIb fibers was shorter than that in type I and IIa fibers at both ages. In addition, mitochondrial branch length in type IIx/IIb fibers was reduced in 24-month compared with the 6-month rats (two-way ANOVA, *P < 0.05). (D) Scatterplot showing mean DIAm fiber mitochondrial complexity index (MCI). The MCI was similar between type I and IIa fibers and did not change with age. The MCI of in type IIx/IIb DIAm fibers was lower than that of type I and IIa fibers at both ages. In addition, the MCI in type IIx/IIb DIAm fibers was reduced in 24-month compared with the 6-month rats (two-way ANOVA, *P < 0.05). # indicated difference between type IIx/IIb fibers and type I and IIa fibers of all ages.
The morphology of mitochondria within DIAm fibers differed across fiber types. The mean mitochondrial branch length was different across fiber types [F(2.42) = 335.1, P < 0.0001] and affected by the interaction between fiber type and age [F(2.42) = 17.9, P < 0.0001], although not by aging alone [F(1.42) = 3.7, P = 0.07; two-way ANOVA; Figure 4C]. Bonferroni post hoc tests showed no age-related difference in mean mitochondrial branch lengths in type I (6-month: 20.7 ± 2.1 μm; 24-month: 22.2 ± 1.9 μm; P > 0.99) and type IIa (6-month: 19.3 ± 1.7 μm; 24-month: 20.3 ± 1.9 μm; P > 0.99) DIAm fibers (Figure 4C). However, the mean mitochondrial branch length in type IIx/IIb fibers was lower in both 6- (8.2 ± 0.9 μm) and 24-month rats (2.4 ± 0.4 μm) compared with type I and IIa fibers (P < 0.0001; Figure 4C), reflecting mitochondrial fragmentation. In addition, mean mitochondrial branch length in type IIx/IIb DIAm fibers from 24-month rats were significantly lower than that of type IIx/IIb fibers from 6-month animals (P < 0.0001; Figure 4C).
The MCI also varied across DIAm fiber types being lowest in type IIx/IIb fibers in both 6- and 24-month rats, reflecting greater mitochondrial fragmentation (Figure 4D). The MCI in DIAm fibers was affected by age [F(1.42) = 39.4, P < 0.0001], fiber type [F(2.42) = 950.3, P < 0.0001], and the interaction between age and fiber type [F(2.42) = 26.3, P < 0.0001; two-way ANOVA; Figure 4D]. Bonferroni post hoc tests show unchanged MCI with age in type I (6-month: 30.5 ± 1.3; 24-month: 28.9 ± 0.6; P > 0.99) and type IIa (6-month: 30.2 ± 1.6; 24-month: 30.6 ± 1.6; P > 0.99) DIAm fibers (Figure 4D). We did observe a reduction in the MCI in type IIx/IIb fibers of 24-month rats (5.9 ± 0.5) compared with 6-month (13.1 ± 0.7; P < 0.0001; Figure 4D).
We measured the SDH reaction across a 10-min period in type I, type IIa, and type IIx/IIb DIAm fibers in 6- and 24-month rats, and found that changes in [NBTdfz] (average OD) within DIAm fibers was highly linear in each case (Figures 5A,B). We found that SDHmax was dependent on age [F(1,42) = 51.6, P < 0.0001], fiber type [F(2,42) = 1787, P < 0.0001], and the interaction between age and fiber type [F(2,42) = 11.2, P = 0.0001; two-way ANOVA; Figure 5C]. Bonferroni post hoc tests showed no age-associated differences in SDHmax in type I (6-month: 4.97 ± 0.17 mmol fumarate L fiber–1 min–1; 24-month: 4.80 ± 0.21 mmol fumarate L fiber–1 min–1; P > 0.99) and IIa (6-month: 4.88 ± 0.17 mmol fumarate L fiber–1 min–1; 24-month: 4.58 ± 0.22 mmol fumarate L fiber–1 min–1; P = 0.11) DIAm fibers (Figure 5C). However, SDHmax per fiber volume was markedly reduced with age in type IIx/IIb DIAm fibers (6-month: 1.39 ± 0.17 mmol fumarate L fiber–1 min–1; 24-month: 0.56 ± 0.03 mmol fumarate L fiber–1 min–1; P < 0.0001; Figure 5C).
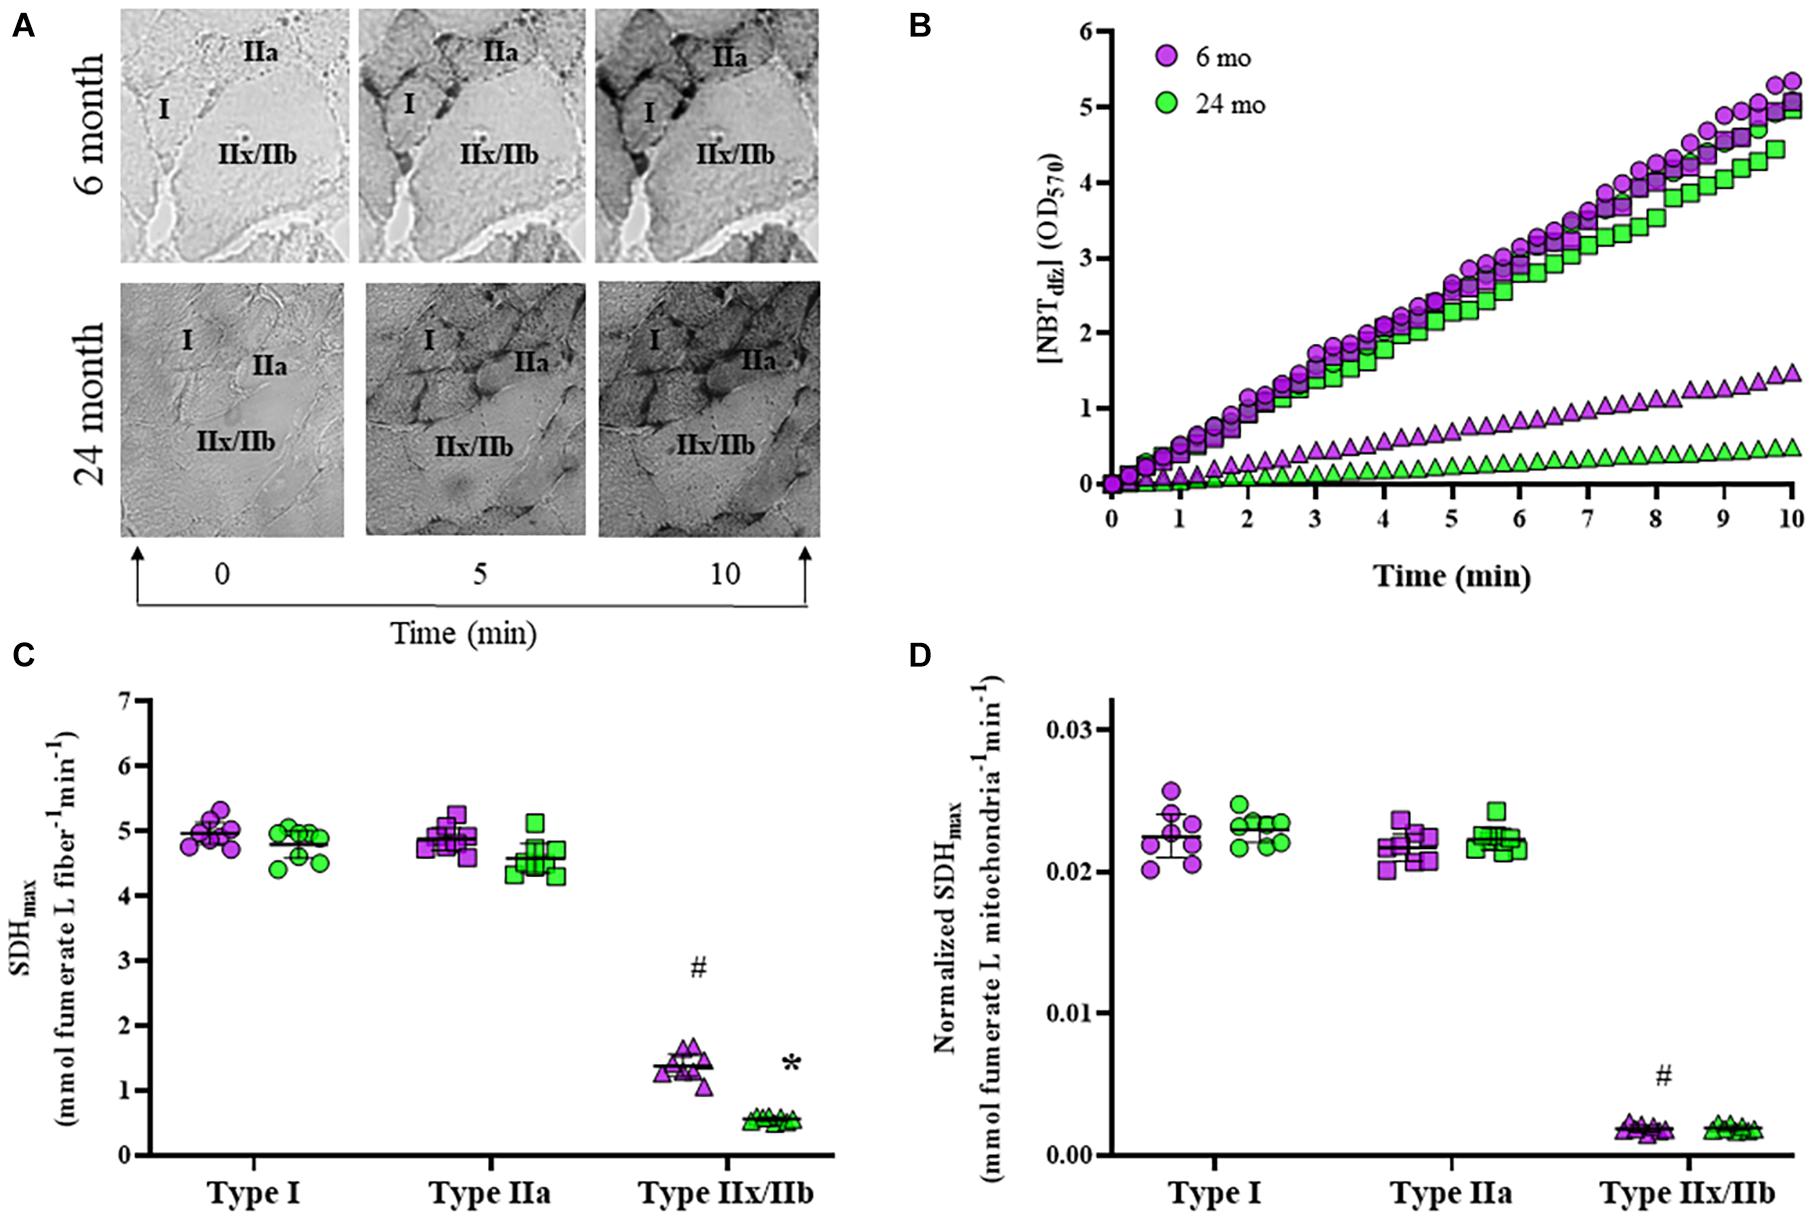
Figure 5. (A) Representative images of the accumulation of NBTdfz (SDH reaction indicator) in DIAm fibers from 6- and 24-month Fischer 344 rats at 0, 5, and 10 min during the progression of the SDH reaction. (B) Measurements of mean fiber OD [indicating [NBTdfz] were obtained every 15 s during the SDH reaction for type I (circles), IIa (squares), and IIx/IIb (triangles) DIAm fibers from both 6-month (purple) and 24-month (green) male and female rats]. The SDH reaction was found to be highly linear (R2 = 0.99) during this period. From the slope of accumulation of [NBTdfz] (dOD/dt), the maximum velocity of the SDH reaction (SDHmax) was determined for each fiber. (C) SDHmax normalized to fiber volume was higher in type I and IIa DIAm fibers compared to type IIx/IIb fibers. SDHmax normalized to fiber volume was not different in type I and IIa DIAm fibers between 6-month and 24-month rats. SDHmax normalized to fiber volume in type IIx/IIb fibers was lower than that in type IIx/IIb DIAm fibers in 24-month compared with 6-month rats (two-way ANOVA, *P < 0.05). (D) SDHmax normalized to mitochondrial volume per fiber was higher in type I and IIa DIAm fibers compared to type IIx/IIb fibers. SDHmax normalized to mitochondrial volume per fiber was not different in type I and IIa DIAm fibers between 6-month and 24-month rats. SDHmax normalized to mitochondrial volume in type IIx/IIb DIAm fibers was lower in 24-month compared with 6-month rats (two-way ANOVA, *P < 0.05). # indicated difference between type IIx/IIb fibers and type I and IIa fibers of all ages.
The SDHmax per fiber volume was normalized for mitochondrial volume density to determine SDHmax per mitochondrial volume. We found that SDHmax per mitochondrial volume was dependent on fiber type [F(2,42) = 1943, P < 0.0001] but not age [F(1,42) = 1.2, P = 0.28], and the interaction between age and fiber type [F(2,42) = 0.3, P = 0.76; two-way ANOVA; Figure 5D]. Bonferroni post hoc tests showed no age-associated differences in SDHmax per mitochondrial volume in type I (6-month: 0.023 ± 0.002 mmol fumarate L mitochondria–1 min–1; 24-month: 0.023 ± 0.001 mmol fumarate L mitochondria–1 min–1; P > 0.99), IIa (6-month: 0.022 ± 0.002 mmol fumarate L mitochondria–1 min–1; 24-month: 0.022 ± 0.001 mmol fumarate L mitochondria–1 min–1; P > 0.99), or IIx/IIb fibers (6-month: 0.0019 ± 0.0003 mmol fumarate L mitochondria–1 min–1; 24-month: 0.0019 ± 0.0002 mmol fumarate L mitochondria–1 min–1; P > 0.99; Figure 5C). However, SDHmax per mitochondrial volume was markedly reduced with in type IIx/IIb fibers compared with type I and IIa fibers of all ages (P < 0.05 for all comparisons; Figure 5D).
Within an individual DIAm fiber, the relation between SDHmax per fiber volume and mitochondrial volume density revealed two distinct clusters of DIAm fibers, one comprising type I and IIa fibers and a second comprising type IIx/IIb fibers (Figures 6A,B). Type I and IIa DIAm fibers from both 6- and 24-month rats had higher SDHmax per fiber volume and higher mitochondrial volume densities as compared with type IIx/IIb fibers of both ages. Type IIx/IIb fibers from 24-month rats had lower SDHmax per fiber volume and lower mitochondrial volume densities compared with DIAm fibers from 6-month rats. For all DIAm fibers, the SDHmax per fiber volume was dependent in a positive linear fashion on mitochondrial volume density in both 6-month (slope = 0.21, P < 0.0001, R2 = 0.82) and 24-month rats (slope = 0.17, P < 0.0001, R2 = 0.87), with, the slope being greater in 6-month rat DIAm fibers [F(1,716) = 42.9, P < 0.0001; Figures 6A,B]. Note that the clustering showed overlap between 6- and 24-month type I and IIa DIAm fibers, but clear separation between type IIx/IIb fibers with age (Figures 6A,B).
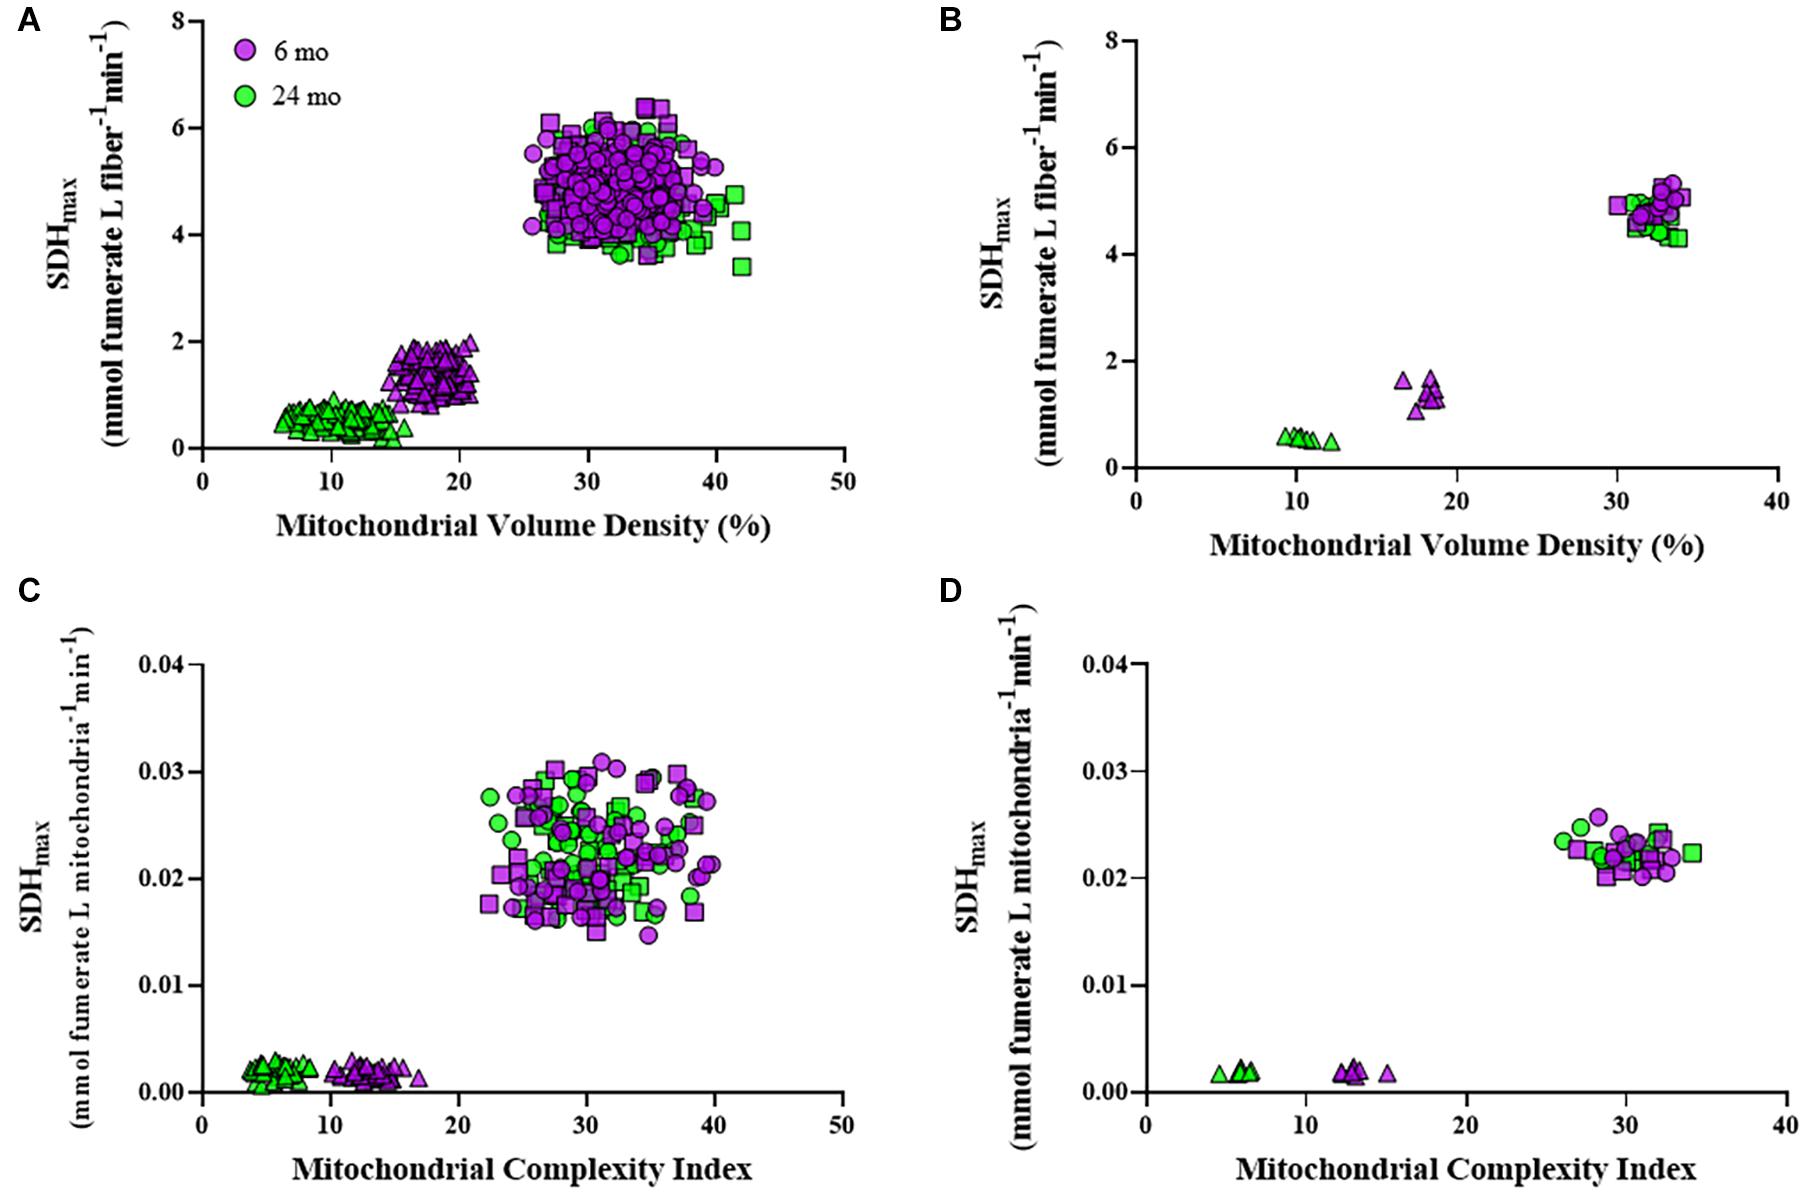
Figure 6. Scatter plots showing the relationships between SDHmax normalized to fiber volume and mitochondrial volume density for all type I (circles), IIa (squares), and IIx/IIb (triangles) DIAm fibers (A) and for the mean values per fiber type for each Fischer 344 rat (B). Note the overlapping clusters for values from type I and IIa DIAm fibers, with a clear separation from values for type IIx/IIb fibers at both ages. In type IIx/IIb fibers, there was a clear separation of values for both SDHmax normalized to fiber volume and mitochondrial volume density in 6-month compared with 24-month rats. Scatter plots showing the relationships between SDHmax normalized to mitochondrial volume per fiber and mitochondrial complexity index (MCI) for all type I (circles), IIa (squares), and IIx/IIb (triangles) DIAm fibers (C) and for the mean values per fiber type for each animal (D). Note the overlapping clusters for values from type I and IIa DIAm fibers, with a clear separation from values for type IIx/IIb fibers at both ages. In type IIx/IIb fibers, there was a clear separation of values for both SDHmax normalized to mitochondrial volume per fiber and MCI in 6-month compared with 24-month rats.
Within an individual DIAm fiber, the relation between SDHmax per mitochondrial volume and mitochondrial fragmentation (MCI) also revealed two distinct clusters of DIAm fibers, one comprising type I and IIa fibers, and a second comprising type IIx/IIb fibers (Figures 6C,D). Type I and IIa DIAm fibers of both 6- and 24-month rats had higher SDHmax per mitochondrial volume and higher MCI as compared with type IIx/IIb fibers. In 24-month rats, SDHmax per mitochondrial volume of type IIx/IIb fibers was similar to 6-month rats, but MCI was lower as compared with DIAm fibers from 6-month rats. Note that the clustering shows overlap between 6- and 24-month type I and IIa DIAm fibers, but clear separation between type IIx/IIb fibers with age (Figures 6C,D).
The novel findings of the present study are that DIAm sarcopenia in 24-month Fischer 344 rats is associated with changes in mitochondrial structure and function in type IIx/IIb fibers. These mitochondrial changes include: (1) reduced mitochondrial volume and volume density; (2) mitochondrial fragmentation; and (3) reduced SDHmax normalized to fiber volume. In both 6- and 24-month rats, there was a clear relation between SDHmax per fiber volume and mitochondrial volume density in DIAm fibers, with two distinct clusters, one comprising type I and IIa fibers and the second comprising type IIx/IIb fibers. This distinction was further exaggerated in 24-month rats with a reduction in both SDHmax per fiber volume and mitochondrial volume density. There was also a clear relation between SDHmax per mitochondrial volume and mitochondrial fragmentation (MCI), with two distinct clusters of DIAm fibers, one comprising type I and IIa fibers, which were more filamentous, and the second comprising type IIx/IIb fibers, which were more fragmented. This relation also persisted and was exaggerated in 24-month rats with increased mitochondrial fragmentation in type IIx/IIb fibers.
In accordance with past reports in Fischer 344 rats, where colony survival at 24 months old is ∼50% (Cameron et al., 1985; Turturro et al., 1999), the cohort assessed here exhibited marked sarcopenia. The results of the present study showed an ∼29% reduction in DIAm specific force and an ∼35% reduction in the contribution of type IIx/IIb fibers to total DIAm volume. These results are commensurate with previous reports (Gosselin et al., 1994; Elliott et al., 2016; Khurram et al., 2018b; Fogarty et al., 2019b, 2020). In Fischer 344 rats, DIAm sarcopenia is associated with a disproportionate loss of larger phrenic motor neurons (Fogarty et al., 2018b), resulting in denervation, contributing to increased vulnerability to neuromuscular transmission failure (Fogarty et al., 2019a) and impaired maximum transdiaphragmatic pressures (Khurram et al., 2018b). These deficits reflect the reduced ability to perform expulsive and straining maneuvers (Tolep et al., 1995; Polkey et al., 1997; Fogarty and Sieck, 2019a).
In the present study, DIAm sarcopenia in Fischer 344 rats was confirmed by the selective atrophy of type IIx/IIb fibers and a reduction in maximum specific force. These results are in agreement with our previous results in male and female Fischer 344 rats (Gosselin et al., 1994; Elliott et al., 2016; Khurram et al., 2018b; Fogarty et al., 2019a,b, 2020), although the ∼35% reduction in cross-sectional areas of type IIx/IIb DIAm fibers observed in the present study was greater than our previous observations, i.e., ∼20–30% reduction in cross-sectional area (Elliott et al., 2016; Khurram et al., 2018b). As a result of the selective atrophy of type IIx/IIb fibers, the relative contribution of these fibers to total DIAm volume was reduced. Previously in the rat DIAm, we found that the maximum specific force of type IIx/IIb fibers is considerably greater than that of type I and IIa fibers (Geiger et al., 1999, 2000, 2001a,b) and is related to a higher concentration of MyHC. With aging, we also found that the total DIAm MyHC concentration is reduced by ∼15% (Elliott et al., 2016). Together, the age-related changes in the relative contribution of type IIx/IIb fibers to mass and the reduced MyHC concentration in type IIx/IIb fibers would limit the ability of the DIAm to perform higher force, airway clearance and expulsive behaviors (Sieck and Fournier, 1989; Khurram et al., 2018b; Fogarty and Sieck, 2019b). It is also important to note that the cross-sectional areas of type I and IIa DIAm fibers were unaffected by aging. Type I and IIa fibers comprise fatigue resistant motor units that are well suited to perform repeated low-pressure necessitating behaviors such as breathing (Sieck and Fournier, 1989; Sieck, 1991, 1995; Khurram et al., 2018b; Fogarty and Sieck, 2019b). With aging, the ventilatory requirements of DIAm force (pressure) generation persist (Khurram et al., 2018b; Fogarty et al., 2019b). In this regard, it should be noted that the residual force of the DIAm after repeated fatiguing activation was not affected by aging, and sufficient to accomplish ventilatory behaviors (Fogarty et al., 2019b).
In the current study, we modeled the effect of sarcopenia and denervation on the fiber type specific contributions to total DIAm isometric specific force, using data determined from type identified single DIAm fibers (Han et al., 1999; Geiger et al., 2000, 2001a). No differences were observed between males and females rats in isometric force generation of the DIAm in past studies using Fischer 344, so these groups were combined for modeling (Khurram et al., 2018b; Fogarty et al., 2019a,b, 2020). This model accounted for the altered relative contributions to DIAm mass and the previously determined ∼37% reduction in the concentration MyHC2x and MyHC2B isoforms (Elliott et al., 2016) and the associated reduction in specific force of type IIx/IIb fibers. Notably, the decline in DIAm specific force observed experimentally with sarcopenia (Gosselin et al., 1994; Elliott et al., 2016; Khurram et al., 2018b; Fogarty et al., 2019b, 2020) was closely approximated using this modeling approach. Thus, changes in MyHC concentration per half sarcomere volume, which we assumed to be exclusive to type IIx/IIb fibers and force per cross-bridge that may be apparent in sarcopenic DIAm fibers (Brenner, 1986; Brenner and Eisenberg, 1986; Sieck et al., 1998), a phenomenon consistent with a selective effect on type IIx/IIb DIAm fibers in our past experiments in denervation (Sieck and Zhan, 2000; Geiger et al., 2001a, 2003; Fogarty and Sieck, 2020).
The ability of the DIAm to sustain ventilation without fatigue is essential to ensure uninterrupted gaseous exchange within the lungs (Belman and Sieck, 1982; Sieck and Fournier, 1989; Sieck, 1991; Fogarty and Sieck, 2019b). The preservation of type I and type IIa fibers in aging is supported by data from the current study, which shows that following 2 min of repetitive activation, the residual specific force generated by the DIAm is unchanged with age, even though the extent of DIAm force fatigue is greater in 6- compared with 24-month rats. Importantly, the improved fatigue index of the DIAm from 24-month rats was entirely due to the lower initial DIAm force, consistent with previous reports in aged Fischer 344 rats (Fogarty et al., 2019b, 2020).
In the current study, we modeled the effect of fatigue on DIAm specific force with aging, using the same determinations of reduced contributions to total mass and reduced contributions of type IIx/IIB fiber specific force as outlined above (Han et al., 1999; Geiger et al., 2000, 2001a; Elliott et al., 2016). In addition, differential fatigability was factored into our assessment, with type I and IIa fibers assumed to have a fatigue index of 0.8, while type IIx/IIb fibers were assumed to have a fatigue index of 0.1, based on previous studies in the cat (Sieck and Fournier, 1989). The modeling of specific forces predicted a residual force following repetitive activation that was greater than that experimentally observed in both the present study and in previous studies (Fogarty et al., 2019b, 2020). Notably, in cases where DIAm fibers were stimulated at lower frequencies (i.e., at 10 Hz) during the fatigue test, the model better predicted the experimentally observed residual forces (Fogarty et al., 2019b). Regardless of the utility of the model, the experimental residual forces generated by DIAm following fatigue are sufficient to provide for the generation of eupneic pressures necessary for ventilation (Fogarty et al., 2019b). The maintenance of function and morphology of type I and IIa DIAm fibers with age is also evident in their maximum respiratory capacities (i.e., SDHmax), which were preserved with aging (Fogarty et al., 2020). We speculate that the difference between modeled and experimentally observed results relates to mitochondrial function in the ex vivo environment, which may be impaired at room temperature, as evidenced by the lack of mitochondrial movement at reduced temperatures (Delmotte et al., 2017; Delmotte and Sieck, 2019).
Previous observations have shown that mitochondrial morphology may affect their respiratory capacity in a variety of cell types (Vincent et al., 2019; Delmotte et al., 2021). For example, in human airway smooth muscle (hASM), we found that maximum cellular O2 consumption rate of mitochondria was higher when mitochondrial morphometry was more filamentous (Delmotte et al., 2021). In another study, mitochondrial morphology was a distinguishing characteristic across muscle fiber types: type I and IIa being more filamentous and type IIx/IIb being more fragmented (Mishra et al., 2015), results similar to those of the present study in the DIAm. In highly active tissues, like the DIAm, mitochondria exhibiting a more filamentous morphology have been suggested to represent the standard state (Trewin et al., 2018; Chaudhry et al., 2020). Filamentous mitochondria have a higher surface area compared with volume ratio, which suggests a greater inner mitochondrial membrane surface area, which would allow for increased O2 consumption and oxidative phosphorylation.
In the present study, mitochondrial morphology was assessed in a fiber type specific manner, and the morphology of these individual mitochondria within the DIAm fibers differed across fiber types. Both measurements of mitochondrial morphology (mean branch length and MCI) varied across fiber types. In all type I and IIa DIAm fibers, regardless of age, mitochondrial morphology was more filamentous, with increased mean branch lengths and MCIs. In type IIx/IIb DIAm fibers, regardless of age, mitochondrial morphology was more fragmented, with shorter mean branch lengths and lower MCIs. With age, the fragmentation of mitochondria within type IIx/IIb fibers was exacerbated, with lower branch lengths and lower MCIs compared with type IIx/IIb DIAm fibers from 6-month rats. We propose that these morphological changes in type IIx/IIb DIAm fibers in 24-month rats reflect impaired mitochondrial function, with reduced maximum respiratory capacity (SDHmax or O2 consumption rate) and oxidative phosphorylation due to the reduced surface area of the inner mitochondrial membrane. The mitochondrial morphology of the type I and IIa fibers remains unchanged with age, indicating that maximum mitochondrial respiratory capacity does not change due to their continued activity as required to sustain ventilation. Notably, the maintenance of mitochondrial morphology in aged type I and type IIa fibers is entirely consistent with the resilience of smaller phrenic motor neurons, the preservation of type I and type IIa DIAm fiber cross-sectional areas, unchanged residual forces following fatigue and functional maintenance of eupnea (Elliott et al., 2016; Fogarty et al., 2018b,2019b, 2020; Khurram et al., 2018b).
The mitochondrial volume density results of the present study are in general agreement with results in rat DIAm from a previous study from our lab using EM, with type I and IIa fibers having greater mitochondrial volume density than type IIx/IIb fibers (Sieck et al., 1998). In the present study, we provide novel results showing that the absolute volume of mitochondria and mitochondria volume density within type I and IIa DIAm fibers are not affected by age. However, there was a marked decrease in absolute volume of mitochondria and mitochondrial volume density in type IIx/IIb DIAm fibers from 24-month rats when compared with 6-month type IIx/IIb DIAm fibers. Regardless of age, type I and IIa fibers had a greater mitochondrial volume density compared with type IIx/IIb fibers, consistent with their incessant requirements for activation during breathing. Similar to the conservation of mitochondrial structure, the maintenance of mitochondrial volume density in type I and IIa fibers is consistent with their selective resilience to sarcopenia.
In the present study, both 6- and 24-month type I and IIa fibers in the rat DIAm had higher SDHmax than type IIx/IIb fibers. This is consistent with past reports in the rat DIAm (Sieck et al., 1989b, 1995; Johnson and Sieck, 1993; Lattari et al., 1997; Zhan et al., 1997; Fogarty et al., 2020). There SDHmax in type IIx/IIb fibers was markedly lower in DIAm from 24-month compared with 6-month rats, consistent with a past report in Fischer 344 rats (Fogarty et al., 2020). The higher SDHmax of the type I and IIa fibers is consistent with their frequent activation during ventilation (Sieck and Fournier, 1989; Sieck, 1991; Fogarty and Sieck, 2019b) and their higher mitochondrial volume densities. The substantially lower SDHmax of type IIx/IIb fibers is consistent with their less frequent activity associated only with expulsive behaviors (Sieck and Fournier, 1989; Sieck, 1991; Fogarty and Sieck, 2019b) and their lower mitochondrial volume densities. Consistent with our previously reported denervation of Fisher 344 DIAm at 24-months (Fogarty et al., 2018b,2019a), our current observation of lower SDHmax in type IIx/IIb DIAm fibers from 24-month rats is strikingly similar to SDHmax results from surgically denervated rats (Miyata et al., 1995; Zhan et al., 1997).
A major innovation of the current study is our novel observations quantifying the relation between SDHmax per fiber volume and mitochondrial volume density identified two distinct populations of DIAm fibers. Type I and IIa DIAm fibers displayed higher SDHmax per fiber volume and mitochondrial volume densities compared with type IIx/IIb fibers. This relation between SDHmax per fiber volume and mitochondrial volume density was unaffected by aging in type I and II DIAm fibers but became more exaggerated in type IIx/IIb fibers with a reduction in both SDHmax per fiber volume and mitochondrial volume density. We are unaware of any previous study that has explored this basic structure function relation of mitochondria at the single fiber level.
In a significant advance from previous approaches, we normalized SDHmax to mitochondrial volume in individual type identified DIAm fibers and assessed the relation to mitochondrial morphology. Importantly, SDHmax per mitochondrial volume was significantly higher in type I and IIa DIAm fibers compared with type IIx/IIb fibers, indicating intrinsic differences in the maximum respiratory capacity of mitochondria across fiber types. Strikingly, a unitary mitochondrion in a type I or IIa fiber is capable of ∼4 times the oxidative capacity of a type IIx/IIb fiber. Thus, the higher SDHmax per fiber volume in type I and IIa DIAm fibers is not due entirely to higher mitochondrial volume density but reflects a higher intrinsic respiratory capacity of mitochondria as well. Notably, the higher intrinsic respiratory capacity of mitochondria in type I and IIa DIAm fibers was unaffected by aging, again consistent with their increased activation with breathing.
When comparing SDHmax per mitochondrial volume to MCI, two distinct clusters of DIAm were also apparent, one comprising type I and IIa fibers and a second comprising type IIx/IIb fibers. Type I and IIa DIAm fibers from both 6-month and 24-month rats had higher SDHmax per mitochondrial volume and higher MCI as compared with type IIx/IIb fibers. In type IIx/IIb DIAm fibers from 24-month rats, the SDHmax per mitochondrial volume was similar to type IIx/IIb fibers from 6-month animals, but the MCI was lower. The relation between SDHmax per mitochondrial volume and MCI indicated that more filamentous mitochondria in type I and IIa DIAm fibers have a higher maximum respiratory capacity compared with the more fragmented mitochondria in type IIx/IIb fibers. With aging not only is there a reduction in mitochondrial volume in type IIx/IIb fibers, but mitochondria also become more fragmented. These combined factors appear to contribute to the age-associated reduction in SDHmax per fiber volume in type IIx/IIb DIAm fibers.
In a plethora of conditions, including those involving selective motor neuron and degeneration of fatigable motor units lead to denervated type IIx/IIb skeletal muscle fibers, such as amyotrophic lateral sclerosis (ALS) (Hegedus et al., 2007, 2008; Dukkipati et al., 2018; Fogarty, 2018; Fogarty et al., 2019c,2021a), altered mitochondrial structures and vacuolations accounts for some of the earliest pathology (Wong et al., 1995; Bendotti et al., 2001; Sasaki et al., 2004; Martin et al., 2007; Sasaki and Iwata, 2007; Fogarty et al., 2017; Gautam et al., 2019). Indeed, mutations of mitochondria (i.e., the SOD1 mutant) underpin one of the most widely used (and extensively validated) ALS rodent models (Gurney et al., 1994; Jara et al., 2012; Fogarty, 2018), with mitochondria are a proposed target of recently approved clinical therapies (Takayasu et al., 2007; Writing and Edaravone (MCI-186) ALS 19 Study Group, 2017; Ohta et al., 2020). Consistent with these phenomena, albeit over a more protracted temporal scale, is our observation of increased mitochondrial fragmentation in the type IIx/IIb DIAm fibers from 24-month rats. These type IIx/IIb fibers are likely to be the denervated DIAm fiber population (Fogarty et al., 2018b), and SDHmax reduction and fragmented mitochondrial morphology data we present, exclusive to type IIx/IIb fibers may be fundamental to their vulnerability to sarcopenia.
In conclusion, we have assessed and modeled the DIAm in a systematic manner to assess muscle quality, as defined by the capacity for force generation and energy production to support motor unit/muscle fiber type recruitment. These assessments and models show that muscle quality, namely specific force generation, oxidative capacity, mitochondrial abundance, and mitochondrial morphology is perturbed with aging, exclusively in type IIx/IIb fibers. Type I and IIa DIAm fibers remain highly active in sustaining breathing throughout life. Accordingly, aging does not appear to affect mitochondrial structure and function in these fibers. Mitochondria in type I and IIa DIAm fibers are abundant and more filamentous with greater intrinsic respiratory capacity. In contrast, mitochondria in type IIx/IIb DIAm fibers are less abundant and more fragmented with lower intrinsic respiratory capacity. Indeed, mitochondrial fragmentation may be a prime determinant of muscle fiber quality, with aging mitochondria in type IIx/IIb fibers become more fragmented and less functional. Increased fragmentation and dysfunction of mitochondria is a proposed etiology and major pathogenic component of an accelerated condition of age-associated motor neuron loss, ALS. In ALS, efforts to mitigate mitochondrial morphological and functional perturbations have recently met with clinical success. Based on the results of the present study, approaches geared toward ameliorating mitochondrial deficits within these vulnerable fibers may be successful in combating the age-associated decline in skeletal muscle quality.
The raw data supporting the conclusions of this article will be made available by the authors, without undue reservation.
All protocols were approved by the Mayo Clinic Institute Animal Care and Use Committee (IACUC #A57714) and complied with National Institutes of Health (NIH) and American Physiological Society guidelines.
AB, LD, MF, and GS: conceptualization, methodology, formal analysis, investigation, and writing. All authors contributed to the article and approved the submitted version.
This work was supported by National Institutes of Health grants R01-AG044615 (GS), R01-HL146114 (GS), and T32-HL105355 (AB and LD).
The authors declare that the research was conducted in the absence of any commercial or financial relationships that could be construed as a potential conflict of interest.
All claims expressed in this article are solely those of the authors and do not necessarily represent those of their affiliated organizations, or those of the publisher, the editors and the reviewers. Any product that may be evaluated in this article, or claim that may be made by its manufacturer, is not guaranteed or endorsed by the publisher.
We would like to thank Rebecca Macken, Yun-Hua Fang, Philippe Delmotte, and Wen-Zhi Zhan for their assistance in this project.
Aravamudan, B., Kiel, A., Freeman, M., Delmotte, P., Thompson, M., Vassallo, R., et al. (2014). Cigarette smoke-induced mitochondrial fragmentation and dysfunction in human airway smooth muscle. Am. J. Physiol. Lung Cell. Mol. Physiol. 306, L840–L854. doi: 10.1152/ajplung.00155.2013
Aravamudan, B., Thompson, M., Sieck, G. C., Vassallo, R., Pabelick, C. M., and Prakash, Y. S. (2017). Functional effects of cigarette smoke-induced changes in airway smooth muscle mitochondrial morphology. J. Cell. Physiol. 232, 1053–1068. doi: 10.1002/jcp.25508
Belman, M. J., and Sieck, G. C. (1982). The ventilatory muscles: fatigue, endurance and training. Chest 82, 761–766. doi: 10.1378/chest.82.6.761
Bendotti, C., Calvaresi, N., Chiveri, L., Prelle, A., Moggio, M., Braga, M., et al. (2001). Early vacuolization and mitochondrial damage in motor neurons of FALS mice are not associated with apoptosis or with changes in cytochrome oxidase histochemical reactivity. J. Neurol. Sci. 191, 25–33. doi: 10.1016/S0022-510X(01)00627-X
Bereiter-Hahn, J., and Voth, M. (1994). Dynamics of mitochondria in living cells: shape changes, dislocations, fusion, and fission of mitochondria. Microsc. Res. Tech. 27, 198–219. doi: 10.1002/jemt.1070270303
Blanco, C. E., Micevych, P. E., Zhan, W. Z., and Sieck, G. C. (1995). Succinate dehydrogenase activity of sexually dimorphic muscles of rats. J. Appl. Physiol. 78, 2147–2152. doi: 10.1152/jappl.1995.78.6.2147
Blanco, C. E., Sieck, G. C., and Edgerton, V. R. (1988). Quantitative histochemical determination of succinic dehydrogenase activity in skeletal muscle fibres. Histochem. J. 20, 230–243. doi: 10.1007/BF01747468
Brenner, B. (1986). Kinetics of the crossbridge cycle derived from measurements of force, rate of force development and isometric ATPase. J. Muscle Res. Cell Motil. 7, 75–76.
Brenner, B., and Eisenberg, E. (1986). Rate of force generation in muscle: correlation with actomyosin ATPase activity in solution. Proc. Natl. Acad. Sci. U.S.A. 83, 3542–3546. doi: 10.1073/pnas.83.10.3542
Calvani, R., Joseph, A. M., Adhihetty, P. J., Miccheli, A., Bossola, M., Leeuwenburgh, C., et al. (2013). Mitochondrial pathways in sarcopenia of aging and disuse muscle atrophy. Biol. Chem. 394, 393–414. doi: 10.1515/hsz-2012-0247
Cameron, T. P., Hickman, R. L., Kornreich, M. R., and Tarone, R. E. (1985). History, survival, and growth patterns of B6C3F1 mice and F344 rats in the National Cancer Institute Carcinogenesis Testing Program. Fundam. Appl. Toxicol. 5, 526–538. doi: 10.1016/0272-0590(85)90100-9
Chaudhry, A., Shi, R., and Luciani, D. S. (2020). A pipeline for multidimensional confocal analysis of mitochondrial morphology, function, and dynamics in pancreatic β-cells. Am. J. Physiol. Endocrinol. Metab. 318, E87–E101. doi: 10.1152/ajpendo.00457.2019
Delmotte, P., Marin Mathieu, N., and Sieck, G. C. (2021). TNFα induces mitochondrial fragmentation and biogenesis in human airway smooth muscle. Am. J. Physiol. Lung Cell. Mol. Physiol. 320, L137–L151. doi: 10.1152/ajplung.00305.2020
Delmotte, P., and Sieck, G. C. (2019). Endoplasmic reticulum stress and mitochondrial function in airway smooth muscle. Front. Cell Dev. Biol. 7:374. doi: 10.3389/fcell.2019.00374
Delmotte, P., Zavaletta, V. A., Thompson, M. A., Prakash, Y. S., and Sieck, G. C. (2017). TNFalpha decreases mitochondrial movement in human airway smooth muscle. Am. J. Physiol. Lung Cell. Mol. Physiol. 313, L166–L176. doi: 10.1152/ajplung.00538.2016
Delmotte, P. F., Marin Mathieu, N., and Sieck, G. C. (2020). TNFalpha induces mitochondrial fragmentation and biogenesis in human airway smooth muscle. Am. J. Physiol. Lung Cell. Mol. Physiol. 320, L137–L151. doi: 10.1152/ajplung.00305.2020
Dukkipati, S. S., Garrett, T. L., and Elbasiouny, S. M. (2018). The vulnerability of spinal motoneurons and soma size plasticity in a mouse model of amyotrophic lateral sclerosis. J. Physiol. 596, 1723–1745. doi: 10.1113/JP275498
Eisner, V., Cupo, R. R., Gao, E., Csordas, G., Slovinsky, W. S., Paillard, M., et al. (2017). Mitochondrial fusion dynamics is robust in the heart and depends on calcium oscillations and contractile activity. Proc. Natl. Acad. Sci. U.S.A. 114, E859–E868. doi: 10.1073/pnas.1617288114
Elliott, J. E., Omar, T. S., Mantilla, C. B., and Sieck, G. C. (2016). Diaphragm muscle sarcopenia in Fischer 344 and Brown Norway rats. Exp. Physiol. 101, 883–894. doi: 10.1113/EP085703
Enright, P. L., Kronmal, R. A., Manolio, T. A., Schenker, M. B., and Hyatt, R. E. (1994). Respiratory muscle strength in the elderly. Correlates and reference values. Cardiovascular Health Study Research Group. Am. J. Respir. Crit. Care Med. 149, 430–438. doi: 10.1164/ajrccm.149.2.8306041
Fogarty, M. J. (2018). Driven to decay: excitability and synaptic abnormalities in amyotrophic lateral sclerosis. Brain Res. Bull. 140, 318–333. doi: 10.1016/j.brainresbull.2018.05.023
Fogarty, M. J., Mantilla, C. B., and Sieck, G. C. (2019b). Impact of sarcopenia on diaphragm muscle fatigue. Exp. Physiol. 104, 1090–1099. doi: 10.1113/EP087558
Fogarty, M. J., Mu, E. W., Lavidis, N. A., Noakes, P. G., and Bellingham, M. C. (2019c). Size-dependent vulnerability of lumbar motor neuron dendritic degeneration in SOD1G93A mice. Anat. Rec. 303, 1455–1471. doi: 10.1002/ar.24255
Fogarty, M. J., Gonzalez Porras, M. A., Mantilla, C. B., and Sieck, G. C. (2019a). Diaphragm neuromuscular transmission failure in aged rats. J. Neurophysiol. 122, 93–104. doi: 10.1152/jn.00061.2019
Fogarty, M. J., Marin Mathieu, N., Mantilla, C. B., and Sieck, G. C. (2020). Aging reduces succinate dehydrogenase activity in rat type IIx/IIb diaphragm muscle fibers. J. Appl. Physiol. (1985) 128, 70–77. doi: 10.1152/japplphysiol.00644.2019
Fogarty, M. J., Mu, E. W. H., Lavidis, N. A., Noakes, P. G., and Bellingham, M. C. (2017). Motor areas show altered dendritic structure in an amyotrophic lateral sclerosis mouse model. Front. Neurosci. 11:609. doi: 10.3389/fnins.2017.00609
Fogarty, M. J., Omar, T. S., Zhan, W. Z., Mantilla, C. B., and Sieck, G. C. (2018b). Phrenic motor neuron loss in aged rats. J. Neurophysiol. 119, 1852–1862. doi: 10.1152/jn.00868.2017
Fogarty, M. J., Mantilla, C. B., and Sieck, G. C. (2018a). Breathing: motor control of diaphragm muscle. Physiology 33, 113–126. doi: 10.1152/physiol.00002.2018
Fogarty, M. J., Rana, S., Mantilla, C. B., and Sieck, G. C. (2021b). Quantifying mitochondrial volume density in phrenic motor neurons. J. Neurosci. Methods 353:109093. doi: 10.1016/j.jneumeth.2021.109093
Fogarty, M. J., Mu, E. W. H., Lavidis, N. A., Noakes, P. G., and Bellingham, M. C. (2021a). Size-dependent dendritic maladaptations of hypoglossal motor neurons in SOD1(G93A) mice. Anat. Rec. 304, 1562–1581. doi: 10.1002/ar.24542
Fogarty, M. J., and Sieck, G. C. (2019a). Diaphragm muscle adaptations in health and disease. Drug Discov. Today Dis. Models 29-30, 43–52. doi: 10.1016/j.ddmod.2019.10.002
Fogarty, M. J., and Sieck, G. C. (2019b). Evolution and functional differentiation of the diaphragm muscle of mammals. Compr. Physiol. 9, 715–766. doi: 10.1002/cphy.c180012
Fogarty, M. J., and Sieck, G. C. (2020). Spinal cord injury and diaphragm neuromotor control. Expert Rev. Respir. Med. 14, 453–464. doi: 10.1080/17476348.2020.1732822
Forman, D. S., Lynch, K. J., and Smith, R. S. (1987). Organelle dynamics in lobster axons: anterograde, retrograde and stationary mitochondria. Brain Res. 412, 96–106. doi: 10.1016/0006-8993(87)91443-0
Fournier, M., and Sieck, G. C. (1988). Mechanical properties of muscle units in the cat diaphragm. J. Neurophysiol. 59, 1055–1066. doi: 10.1152/jn.1988.59.3.1055
Gautam, M., Jara, J. H., Kocak, N., Rylaarsdam, L. E., Kim, K. D., Bigio, E. H., et al. (2019). Mitochondria, ER, and nuclear membrane defects reveal early mechanisms for upper motor neuron vulnerability with respect to TDP-43 pathology. Acta Neuropathol. 137, 47–69. doi: 10.1007/s00401-018-1934-8
Geiger, P. C., Bailey, J. P., Zhan, W. Z., Mantilla, C. B., and Sieck, G. C. (2003). Denervation-induced changes in myosin heavy chain expression in the rat diaphragm muscle. J. Appl. Physiol. 95, 611–619. doi: 10.1152/japplphysiol.00862.2002
Geiger, P. C., Cody, M. J., Han, Y. S., Hunter, L. W., Zhan, W. Z., and Sieck, G. C. (2002). Effects of hypothyroidism on maximum specific force in rat diaphragm muscle fibers. J. Appl. Physiol. 92, 1506–1514. doi: 10.1152/japplphysiol.00095.2001
Geiger, P. C., Cody, M. J., Macken, R. L., Bayrd, M. E., and Sieck, G. C. (2001b). Mechanisms underlying increased force generation by rat diaphragm muscle fibers during development. J. Appl. Physiol. 90, 380–388. doi: 10.1152/jappl.2001.90.1.380
Geiger, P. C., Cody, M. J., Macken, R. L., Bayrd, M. E., and Sieck, G. C. (2001a). Effect of unilateral denervation on maximum specific force in rat diaphragm muscle fibers. J. Appl. Physiol. 90, 1196–1204. doi: 10.1152/jappl.2001.90.4.1196
Geiger, P. C., Cody, M. J., Macken, R. L., and Sieck, G. C. (2000). Maximum specific force depends on myosin heavy chain content in rat diaphragm muscle fibers. J. Appl. Physiol. 89, 695–703. doi: 10.1152/jappl.2000.89.2.695
Geiger, P. C., Cody, M. J., and Sieck, G. C. (1999). Force-calcium relationship depends on myosin heavy chain and troponin isoforms in rat diaphragm muscle fibers. J. Appl. Physiol. 87, 1894–1900. doi: 10.1152/jappl.1999.87.5.1894
Gosselin, L. E., Johnson, B. D., and Sieck, G. C. (1994). Age-related changes in diaphragm muscle contractile properties and myosin heavy chain isoforms. Am. J. Respir. Crit. Care Med. 150, 174–178. doi: 10.1164/ajrccm.150.1.8025746
Gurney, M. E., Pu, H., Chiu, A. Y., Dal Canto, M. C., Polchow, C. Y., Alexander, D. D., et al. (1994). Motor neuron degeneration in mice that express a human Cu,Zn superoxide dismutase mutation. Science 264, 1772–1775. doi: 10.1126/science.8209258
Han, Y. S., Iyanoye, A., Geiger, P. C., Cody, M. J., and Sieck, G. C. (1999). Effects of denervation on mechanical and energetic properties of single fibers in rat diaphragm muscle. Biophys. J. 76:A34.
Hegedus, J., Putman, C. T., and Gordon, T. (2007). Time course of preferential motor unit loss in the SOD1 G93A mouse model of amyotrophic lateral sclerosis. Neurobiol. Dis. 28, 154–164. doi: 10.1016/j.nbd.2007.07.003
Hegedus, J., Putman, C. T., Tyreman, N., and Gordon, T. (2008). Preferential motor unit loss in the SOD1 G93A transgenic mouse model of amyotrophic lateral sclerosis. J. Physiol. 586, 3337–3351. doi: 10.1113/jphysiol.2007.149286
Jacques, M., Kuang, J., Bishop, D. J., Yan, X., Alvarez-Romero, J., Munson, F., et al. (2020). Mitochondrial respiration variability and simulations in human skeletal muscle: the gene SMART study. FASEB J. 34, 2978–2986. doi: 10.1096/fj.201901997RR
Jara, J. H., Villa, S. R., Khan, N. A., Bohn, M. C., and Ozdinler, P. H. (2012). AAV2 mediated retrograde transduction of corticospinal motor neurons reveals initial and selective apical dendrite degeneration in ALS. Neurobiol. Dis. 47, 174–183. doi: 10.1016/j.nbd.2012.03.036
Johnson, B. D., and Sieck, G. C. (1993). Activation-induced reduction of SDH activity in diaphragm muscle fibers. J. Appl. Physiol. 75, 2689–2695. doi: 10.1152/jappl.1993.75.6.2689
Khurram, O. U., Fogarty, M. J., Sarrafian, T. L., Bhatt, A., Mantilla, C. B., and Sieck, G. C. (2018b). Impact of aging on diaphragm muscle function in male and female Fischer 344 rats. Physiol. Rep. 6:e13786. doi: 10.14814/phy2.13786
Khurram, O. U., Fogarty, M. J., Rana, S., Vang, P., Sieck, G. C., and Mantilla, C. B. (2018a). Diaphragm muscle function following mid-cervical contusion injury in rats. J. Appl. Physiol. (1985) 126, 221–230. doi: 10.1152/japplphysiol.00481.2018
Koopman, W. J., Visch, H. J., Smeitink, J. A., and Willems, P. H. (2006). Simultaneous quantitative measurement and automated analysis of mitochondrial morphology, mass, potential, and motility in living human skin fibroblasts. Cytometry A 69, 1–12. doi: 10.1002/cyto.a.20198
Koopman, W. J., Visch, H. J., Verkaart, S., Van Den Heuvel, L. W., Smeitink, J. A., and Willems, P. H. (2005). Mitochondrial network complexity and pathological decrease in complex I activity are tightly correlated in isolated human complex I deficiency. Am. J. Physiol. Cell Physiol. 289, C881–C890. doi: 10.1152/ajpcell.00104.2005
Lattari, A., Daood, M. J., Sieck, G. C., and Watchko, J. F. (1997). Rat diaphragm oxidative capacity, antioxidant enzymes, and fatigue: newborn versus adult. Pediatr. Res. 42, 60–65. doi: 10.1203/00006450-199707000-00010
Lewis, M. I., Monn, S. A., and Sieck, G. C. (1992). Effect of corticosteroids on diaphragm fatigue, SDH Activity, and muscle fiber size. J. Appl. Physiol. 72, 293–301. doi: 10.1152/jappl.1992.72.1.293
Ly, C. H., and Ryall, J. G. (2017). Measuring mitochondrial substrate utilization in skeletal muscle stem cells. Methods Mol. Biol. 1668, 61–73. doi: 10.1007/978-1-4939-7283-8_5
Martin, L. J., Liu, Z., Chen, K., Price, A. C., Pan, Y., Swaby, J. A., et al. (2007). Motor neuron degeneration in amyotrophic lateral sclerosis mutant superoxide dismutase-1 transgenic mice: mechanisms of mitochondriopathy and cell death. J. Comp. Neurol. 500, 20–46. doi: 10.1002/cne.21160
Marzetti, E., Calvani, R., Cesari, M., Buford, T. W., Lorenzi, M., Behnke, B. J., et al. (2013). Mitochondrial dysfunction and sarcopenia of aging: from signaling pathways to clinical trials. Int. J. Biochem. Cell Biol. 45, 2288–2301. doi: 10.1016/j.biocel.2013.06.024
Mishra, P., Varuzhanyan, G., Pham, A. H., and Chan, D. C. (2015). Mitochondrial dynamics is a distinguishing feature of skeletal muscle fiber types and regulates organellar compartmentalization. Cell Metab. 22, 1033–1044. doi: 10.1016/j.cmet.2015.09.027
Miyata, H., Zhan, W. Z., Prakash, Y. S., and Sieck, G. C. (1995). Myoneural interactions affect diaphragm muscle adaptations to inactivity. J. Appl. Physiol. 79, 1640–1649. doi: 10.1152/jappl.1995.79.5.1640
Mylotte, J. M., Goodnough, S., and Naughton, B. J. (2003). Pneumonia versus aspiration pneumonitis in nursing home residents: diagnosis and management. J. Am. Geriatr. Soc. 51, 17–23. doi: 10.1034/j.1601-5215.2002.51004.x
Ohta, Y., Yamashita, T., Nomura, E., Hishikawa, N., Ikegami, K., Osakada, Y., et al. (2020). Improvement of a decreased anti-oxidative activity by edaravone in amyotrophic lateral sclerosis patients. J. Neurol. Sci. 415:116906. doi: 10.1016/j.jns.2020.116906
Polkey, M. I., Harris, M. L., Hughes, P. D., Hamnegard, C. H., Lyons, D., Green, M., et al. (1997). The contractile properties of the elderly human diaphragm. Am. J. Respir. Crit. Care Med. 155, 1560–1564. doi: 10.1164/ajrccm.155.5.9154857
Prakash, Y. S., Fournier, M., and Sieck, G. C. (1993a). Effects of prenatal undernutrition on developing rat diaphragm. J. Appl. Physiol. 75, 1044–1052. doi: 10.1152/jappl.1993.75.3.1044
Prakash, Y. S., Pabelick, C. M., and Sieck, G. C. (2017). Mitochondrial dysfunction in airway disease. Chest 152, 618–626. doi: 10.1016/j.chest.2017.03.020
Prakash, Y. S., Smithson, K. G., and Sieck, G. C. (1993b). Measurements of motoneuron somal volumes using laser confocal microscopy: comparisons with shape-based stereological estimations. Neuroimage 1, 95–107. doi: 10.1006/nimg.1993.1003
Reznick, R. M., Zong, H., Li, J., Morino, K., Moore, I. K., Yu, H. J., et al. (2007). Aging-associated reductions in AMP-activated protein kinase activity and mitochondrial biogenesis. Cell Metab. 5, 151–156. doi: 10.1016/j.cmet.2007.01.008
Richards, R., Fogarty, M. J., Sieck, G. C., and Schwartzstein, R. M. (2018). “Initiating the breath: the drive to breathe, muscle pump,” in Pulmonary Function Testing, eds D. Kaminsky and C. G. Irvin (New York, NY: Humana Press), 151–170. doi: 10.1007/978-3-319-94159-2_8
Ryan, Z. C., Craig, T. A., Folmes, C. D., Wang, X., Lanza, I. R., Schaible, N. S., et al. (2015). 1α,25-Dihydroxyvitamin D 3 regulates mitochondrial oxygen consumption and dynamics in human skeletal muscle cells. J. Biol. Chem. 291, 1514–1528. doi: 10.1074/jbc.M115.684399
Sasaki, S., and Iwata, M. (2007). Mitochondrial alterations in the spinal cord of patients with sporadic amyotrophic lateral sclerosis. J. Neuropathol. Exp. Neurol. 66, 10–16. doi: 10.1097/nen.0b013e31802c396b
Sasaki, S., Warita, H., Murakami, T., Abe, K., and Iwata, M. (2004). Ultrastructural study of mitochondria in the spinal cord of transgenic mice with a G93A mutant SOD1 gene. Acta Neuropathol. 107, 461–474. doi: 10.1007/s00401-004-0837-z
Sieck, G. C. (1991). Neural control of the inspiratory pump. NIPS 6, 260–264. doi: 10.1152/physiologyonline.1991.6.6.260
Sieck, G. C. (1995). “Organization and recruitment of diaphragm motor units,” in The Thorax, 2nd Edn. ed. C. Roussos (New York, NY: Marcel Dekker), 783–820.
Sieck, G. C., and Fournier, M. (1989). Diaphragm motor unit recruitment during ventilatory and nonventilatory behaviors. J. Appl. Physiol. 66, 2539–2545. doi: 10.1152/jappl.1989.66.6.2539
Sieck, G. C., Fournier, M., and Blanco, C. E. (1991). Diaphragm muscle fatigue resistance during postnatal development. J. Appl. Physiol. 71, 458–464. doi: 10.1152/jappl.1991.71.2.458
Sieck, G. C., Fournier, M., and Enad, J. G. (1989a). Fiber type composition of muscle units in the cat diaphragm. Neurosci. Lett. 97, 29–34. doi: 10.1016/0304-3940(89)90134-1
Sieck, G. C., Fournier, M., Prakash, Y. S., and Blanco, C. E. (1996). Myosin phenotype and SDH enzyme variability among motor unit fibers. J. Appl. Physiol. 80, 2179–2189. doi: 10.1152/jappl.1996.80.6.2179
Sieck, G. C., Han, Y. S., Prakash, Y. S., and Jones, K. A. (1998). Cross-bridge cycling kinetics, actomyosin ATPase activity and myosin heavy chain isoforms in skeletal and smooth respiratory muscles. Comp. Biochem. Physiol. B Biochem. Mol. Biol. 119, 435–450. doi: 10.1016/S0305-0491(98)00005-4
Sieck, G. C., Lewis, M. I., and Blanco, C. E. (1989b). Effects of undernutrition on diaphragm fiber size, SDH activity, and fatigue resistance. J. Appl. Physiol. 66, 2196–2205. doi: 10.1152/jappl.1989.66.5.2196
Sieck, G. C., Mantilla, C. B., and Prakash, Y. S. (1999). Volume measurements in confocal microscopy. Methods Enzymol. 307, 296–315. doi: 10.1016/S0076-6879(99)07019-6
Sieck, G. C., Sacks, R. D., Blanco, C. E., and Edgerton, V. R. (1986). SDH activity and cross-sectional area of muscle fibers in cat diaphragm. J. Appl. Physiol. 60, 1284–1292. doi: 10.1152/jappl.1986.60.4.1284
Sieck, G. C., Trelease, R. B., and Harper, R. M. (1984). Sleep influences on diaphragmatic motor unit discharge. Exp. Neurol. 85, 316–335. doi: 10.1016/0014-4886(84)90143-2
Sieck, G. C., and Zhan, W. Z. (2000). Denervation alters myosin heavy chain expression and contractility of developing rat diaphragm muscle. J. Appl. Physiol. 89, 1106–1113. doi: 10.1152/jappl.2000.89.3.1106
Sieck, G. C., Zhan, W. Z., Prakash, Y. S., Daood, M. J., and Watchko, J. F. (1995). SDH and actomyosin ATPase activities of different fiber types in rat diaphragm muscle. J. Appl. Physiol. 79, 1629–1639. doi: 10.1152/jappl.1995.79.5.1629
Takayasu, Y., Nakaki, J., Kawasaki, T., Koda, K., Ago, Y., Baba, A., et al. (2007). Edaravone, a radical scavenger, inhibits mitochondrial permeability transition pore in rat brain. J. Pharmacol. Sci. 103, 434–437. doi: 10.1254/jphs.SC0070014
Tolep, K., Higgins, N., Muza, S., Criner, G., and Kelsen, S. G. (1995). Comparison of diaphragm strength between healthy adult elderly and young men. Am. J. Respir. Crit. Care Med. 152, 677–682. doi: 10.1164/ajrccm.152.2.7633725
Trewin, A. J., Berry, B. J., and Wojtovich, A. P. (2018). Exercise and mitochondrial dynamics: keeping in shape with ROS and AMPK. Antioxidants 7:7. doi: 10.3390/antiox7010007
Turturro, A., Witt, W. W., Lewis, S., Hass, B. S., Lipman, R. D., and Hart, R. W. (1999). Growth curves and survival characteristics of the animals used in the biomarkers of aging program. J. Gerontol. A Biol. Sci. Med. Sci. 54, B492–B501. doi: 10.1093/gerona/54.11.B492
Ungvari, Z., Labinskyy, N., Gupte, S., Chander, P. N., Edwards, J. G., and Csiszar, A. (2008). Dysregulation of mitochondrial biogenesis in vascular endothelial and smooth muscle cells of aged rats. Am. J. Physiol. Heart Circ. Physiol. 294, H2121–H2128. doi: 10.1152/ajpheart.00012.2008
Vincent, A. E., White, K., Davey, T., Philips, J., Ogden, R. T., Lawless, C., et al. (2019). Quantitative 3D mapping of the human skeletal muscle mitochondrial network. Cell Rep. 26, 996–1009.e4. doi: 10.1016/j.celrep.2019.01.010
Watchko, J. F., and Sieck, G. C. (1993). Respiratory muscle fatigue resistance relates to myosin phenotype and SDH activity during development. J. Appl. Physiol. 75, 1341–1347. doi: 10.1152/jappl.1993.75.3.1341
Wong, P. C., Pardo, C. A., Borchelt, D. R., Lee, M. K., Copeland, N. G., Jenkins, N. A., et al. (1995). An adverse property of a familial ALS-linked SOD1 mutation causes motor neuron disease characterized by vacuolar degeneration of mitochondria. Neuron 14, 1105–1116. doi: 10.1016/0896-6273(95)90259-7
Writing, G., Edaravone (MCI-186) ALS 19 Study Group (2017). Safety and efficacy of edaravone in well defined patients with amyotrophic lateral sclerosis: a randomised, double-blind, placebo-controlled trial. Lancet Neurol. 16, 505–512. doi: 10.1016/S1474-4422(17)30115-1
Keywords: sarcopenia, fiber type, SDHmax, maximum respiratory capacity, mitochondrial fragmentation
Citation: Brown AD, Davis LA, Fogarty MJ and Sieck GC (2021) Mitochondrial Fragmentation and Dysfunction in Type IIx/IIb Diaphragm Muscle Fibers in 24-Month Old Fischer 344 Rats. Front. Physiol. 12:727585. doi: 10.3389/fphys.2021.727585
Received: 18 June 2021; Accepted: 09 September 2021;
Published: 28 September 2021.
Edited by:
Mauro Zamboni, University of Verona, ItalyReviewed by:
Ricardo Aparecido Baptista Nucci, University of São Paulo, BrazilCopyright © 2021 Brown, Davis, Fogarty and Sieck. This is an open-access article distributed under the terms of the Creative Commons Attribution License (CC BY). The use, distribution or reproduction in other forums is permitted, provided the original author(s) and the copyright owner(s) are credited and that the original publication in this journal is cited, in accordance with accepted academic practice. No use, distribution or reproduction is permitted which does not comply with these terms.
*Correspondence: Gary C. Sieck, c2llY2suZ2FyeUBtYXlvLmVkdQ==
†These authors have contributed equally to this work and share first authorship
Disclaimer: All claims expressed in this article are solely those of the authors and do not necessarily represent those of their affiliated organizations, or those of the publisher, the editors and the reviewers. Any product that may be evaluated in this article or claim that may be made by its manufacturer is not guaranteed or endorsed by the publisher.
Research integrity at Frontiers
Learn more about the work of our research integrity team to safeguard the quality of each article we publish.