 Clément Brault
 Yoann Zerbib
 Loay Kontar
- Intensive Care Department, CHU Amiens-Picardie, Amiens, France
Introduction: The effect of positive end-expiratory pressure (PEEP) depends closely on the potential for lung recruitment. Bedside assessment of lung recruitability is crucial for personalized lung-protective mechanical ventilation in acute respiratory distress syndrome (ARDS) patients.
Methods: We developed a transoesophageal lung ultrasound (TE-LUS) method in which a quantitative (computer-assisted) grayscale determination served as a guide to PEEP-induced lung recruitment. The method is based on the following hypothesis: when the PEEP increases, inflation of the recruited alveoli leads to significant changes in the air/water ratio. Normally ventilated areas are hypoechoic because the ultrasound waves are weakly reflected while poorly aerated areas or non-aerated areas are hyperechoic. We calculated the TE-LUS re-aeration score (RAS) as the ratio of the mean gray scale level at low PEEP to that value at high PEEP for the lower and upper lobes. A RAS > 1 indicated an increase in ventilated area. We used this new method to detect changes in ventilation in patients with a low (<0.5) vs. high (≥0.5) recruitment-to-inflation (R/I) ratio (i.e., the ratio between the recruited lung compliance and the respiratory system compliance at low PEEP).
Results: We included 30 patients with moderate-to-severe ARDS. In patients with a high R/I ratio, the TE-LUS RAS was significantly higher in the lower lobes than in the upper lobes (1.20 [1.12–1.63] vs. 1.05 [0.89–1.38]; p = 0.05). Likewise, the TE-LUS RAS in the lower lobes was significantly higher in the high R/I group than in the low R/I group (1.20 [1.12–1.63] vs. 1.07 [1.00–1.20]; p = 0.04).
Conclusion: The increase in PEEP induces a substantial gain in the ventilation detected by TE-LUS of poorly or non-aerated lower lobes (dependent lung regions), especially in patients with a high R/I ratio.
Introduction
Acute respiratory distress syndrome (ARDS) is characterized by a nonhomogeneous distribution of ventilation. The non-aerated lung comprises a recruitable volume (which can be re-aerated by applying the appropriate pressure) and a consolidated volume (Gattinoni et al., 2006). Furthermore, the amount of lung parenchyma that can respond to high positive end-expiratory pressure (PEEP) and/or lung recruitment maneuvers also varies widely from one ARDS patient to another. In patients with a high recruitable lung volume, the aerated lung volume will increase and the cyclical closing-reopening of the alveoli (atelectrauma) will decrease. Conversely, the application of a high level of pressure to patients with a low recruitable lung volume can lead to lung overdistention (volotrauma) and cardiac dysfunction (Gattinoni et al., 2020). Consequently, bedside assessment of lung recruitability is crucial for personalized lung-protective mechanical ventilation.
The most frequently evaluated method to assess lung recruitability is based on a computed tomography (CT) scan performed at two pressure levels. Lung recruitability is then calculated as the difference in aerated lung volume between the two scans (Gattinoni et al., 2006; Constantin et al., 2010). Although this CT method is reliable, it is not feasible in routine practice: the patient has to be moved and is exposed to ionizing radiation (Sahetya et al., 2017). A second approach is based on the analysis of multiple pressure-volume (PV) curves, starting at different end-expiratory lung volumes (EELVs) and pressures. Again, this tool is accurate but is also complicated to implement (Hess, 2015; Chen et al., 2020). More recently, Chen et al. (2020) validated a bedside method for calculating the recruitment-to-inflation (R/I) ratio and thus provide a reliable and non-invasive means of evaluating lung recruitability.
In the last decade, transthoracic lung ultrasound (TT-LUS) has been evaluated in many critical care situations, such as the diagnosis of ventilator-associated pneumonia or weaning from mechanical ventilation (Mojoli et al., 2019). In patients with ARDS, the measurement of changes in ultrasound patterns in 12 different thoracic areas and at different PEEPs provides a semiquantitative lung aeration score (from 0 to 36) that is well correlated with the CT-based lung recruitability volume (Bouhemad et al., 2011). We have developed a new method based on a similar principle, i.e., the measurement of PEEP-related changes during a transoesophageal ultrasound assessment of the lung (TE-LUS). Here, we conducted an exploratory study to assess the effects of an increase in PEEP on the lung re-aeration detected by transoesophageal lung ultrasound (TE-LUS) according to lung recruitability (assessed by the R/I ratio).
Materials and Methods
Study population: the study was conducted in the intensive care medicine department of Amiens University Hospital (Amiens, France) from January to November 2020. All patients presenting ARDS with an arterial oxygen partial pressure to inspired oxygen fraction (PaO2/FiO2) ratio of less than 150 mmHg at a PEEP of 5 cmH2O. The exclusion criteria were age under 18, pregnancy, hemodynamic instability (defined as a change in vasoactive drug administration in the previous 6 h), pleural effusion, and contraindications to TE-LUS (such as oesophageal stenosis, oesophageal tumors, oesophageal varices, or gastrointestinal hemorrhage). The study was approved by the local independent ethics committee (CPP Nord-Ouest II, Amiens, CEERNI 110). In accordance with French legislation, written informed consent was obtained from the patient. Patients who were unable to provide consent prior to randomization due to orotracheal intubation or other medical conditions were informed as soon as conditions permitted.
Study procedures: all patients were ventilated in volume-control mode using V500 (Drager, Lübeck, Germany) or Servo i (Maquet, Solna, Sweden) systems. Patients received continuous intravenous sedation, analgesia, and curarization. The patients were in a semi-recumbent position, with the torso at an angle of 30–45 degrees to the horizontal. The tidal volume was set to 6 mL per kilogram of predicted body weight and the pressure plateau was kept below 28–30 cmH2O. The FiO2 level was adjusted to achieve arterial oxygen saturation (SpO2) of 88–92%. We evaluated airway closure during low-flow (5 L/min) insufflation, starting at a PEEP of 5 cmH2O. Airway closure was defined as the presence of an inflection point on the time-pressure curve, and the airway opening pressure (AOP) was defined as the pressure at this inflection point. An AOP above 5 cmH2O was considered to be clinically significant. We calculated the R/I ratio by applying the method recently described by Chen et al. (2020). Briefly, we abruptly decreased the PEEP (from 15 cmH2O or the AOP+10 cmH2O to 5 cmH2O or the AOP), in order to measure the induced change in end-expiratory lung volume (ΔEELV). We then calculated the change in lung volume (ΔVrec) as the difference between the measured ΔEELV and the predicted ΔEELV (i.e., the compliance at low PEEP multiplied by the change in PEEP). Next, we calculated the recruited lung’s compliance (Crec) as the ratio between ΔVrec and the effective change in pressure (i.e., 10 cmH2O). Lastly, we calculated the R/I ratio as the ratio between Crec and compliance at a low PEEP. Thus, the R/I ratio quantifies the risk-benefit ratio of the application of PEEP. The higher the R/I ratio (≥ 0.5), the more the recruited lung is compliant (i.e., recruited volume is higher than alveolar overdistention). Conversely, the lower the R/I ratio (<0.5), the greater the risk of alveolar overdistention (without benefit in terms of recruitment induced by the increase of PEEP).
The TE-LUS assessment was performed with a VIVID 7 system (GE Medical Systems, Milwaukee, WI, United States). After removal of the gastric tube, we introduced the ultrasound transducer (9T Multi Plane Phased Array, 4.0-10.0 MHz, GE Medical Systems, Milwaukee, WI, United States) into the upper esophagus (20-25 cm below the incisors, corresponding to the ascending aortic short-axis view. We turned the transducer toward the left shoulder and then the right shoulder, corresponding, respectively, to the left upper and right upper lobes. The transducer was then placed in the mid-esophagus (30–40 cm from incisors), which corresponded to a four-chamber view. We again turned the transducer toward the left shoulder and then the right shoulder, corresponding, respectively, to the left lower and right lower lobes. To avoid interference from the heart, we made sure that the organ was not visible on the ultrasound system’s screen. To ensure that the frame rate did not change, we set the depth to 15 cm and the sector size to 90 degrees. Each image was captured during a 5-s end-expiratory occlusion at low PEEP (i.e., 5 cmH2O or the AOP) or high PEEP (i.e., 15 cmH2O or the AOP+10 cmH2O) (Figure 1). The ventilator settings were the same at the two PEEP levels, as were the ultrasound system settings (including the gain).
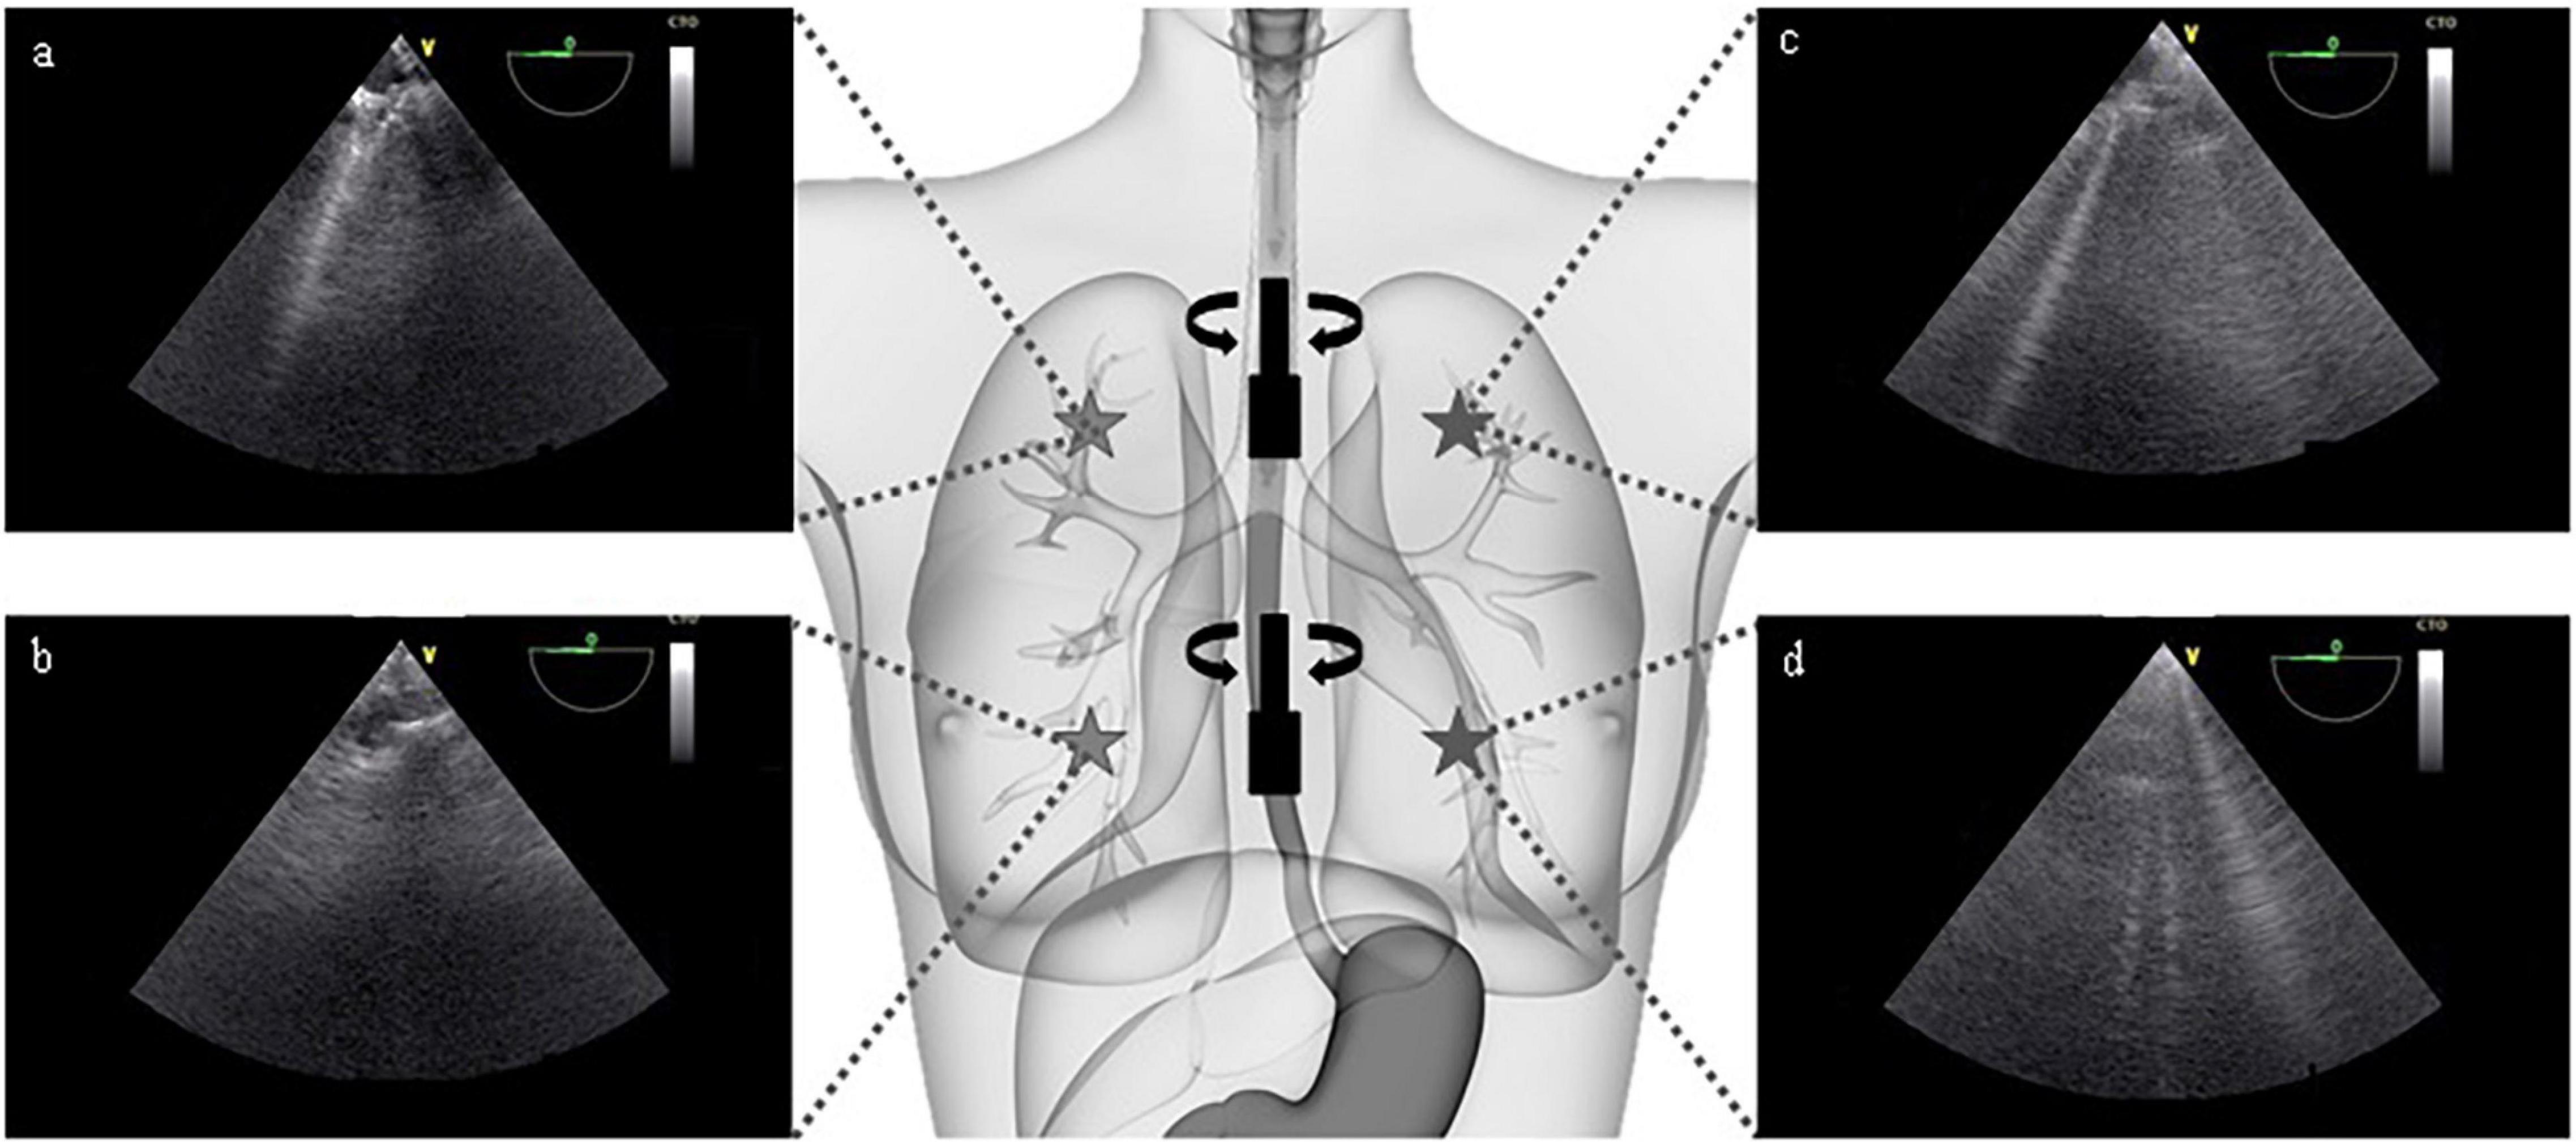
Figure 1. Selected transoesophageal views of the upper right (a), lower right (b), upper left (c), and lower left (d) lobes of the lung (patient #10). The transducer is introduced into the esophagus to a depth of 20–25 cm and then 30–40 cm below the incisors. At each step, the transducer is turned to the left and to the right, in order to avoid the heart and view the lung parenchyma. It should be noted that all images were captured at a multiplane angle of 0 degree. The view depth was set to 15 cm. Each image was captured during a 5-s end-expiratory occlusion.
Image analysis: in TE-LUS, normally ventilated areas are dark (i.e., hypoechoic) because the ultrasound waves are weakly reflected. Conversely, poorly aerated areas or non-aerated areas are light (i.e., hyperechoic) (Gargani and Volpicelli, 2014). We used ImageJ software (U.S. National Institutes of Health, Bethesda, MD, United States) (Schneider et al., 2012) to determine the images’ gray scale distribution. Each image was converted into a 32-bit format, corresponding to 256 bins. The region of interest (ROI) was a circle with a diameter of 150 pixels and a depth of 6 cm. The mean (SD) gray scale value at each pixel in the ROI was measured using the histogram function (Figure 2). Hence, we defined the mean gray scale value in the lower lobes and the upper lobes at a low PEEP and a high PEEP (LLPEEPlow, LLPEEPhigh, ULPEEPlow, and ULPEEPhigh). We then calculated the TE-LUS re-aeration score (RAS) as the ratio of the mean gray scale level at low PEEP to that value at high PEEP for the lower lobes (RASLL) and upper lobes (RASUL). A ratio higher than 1 indicates an increase in ventilated area.
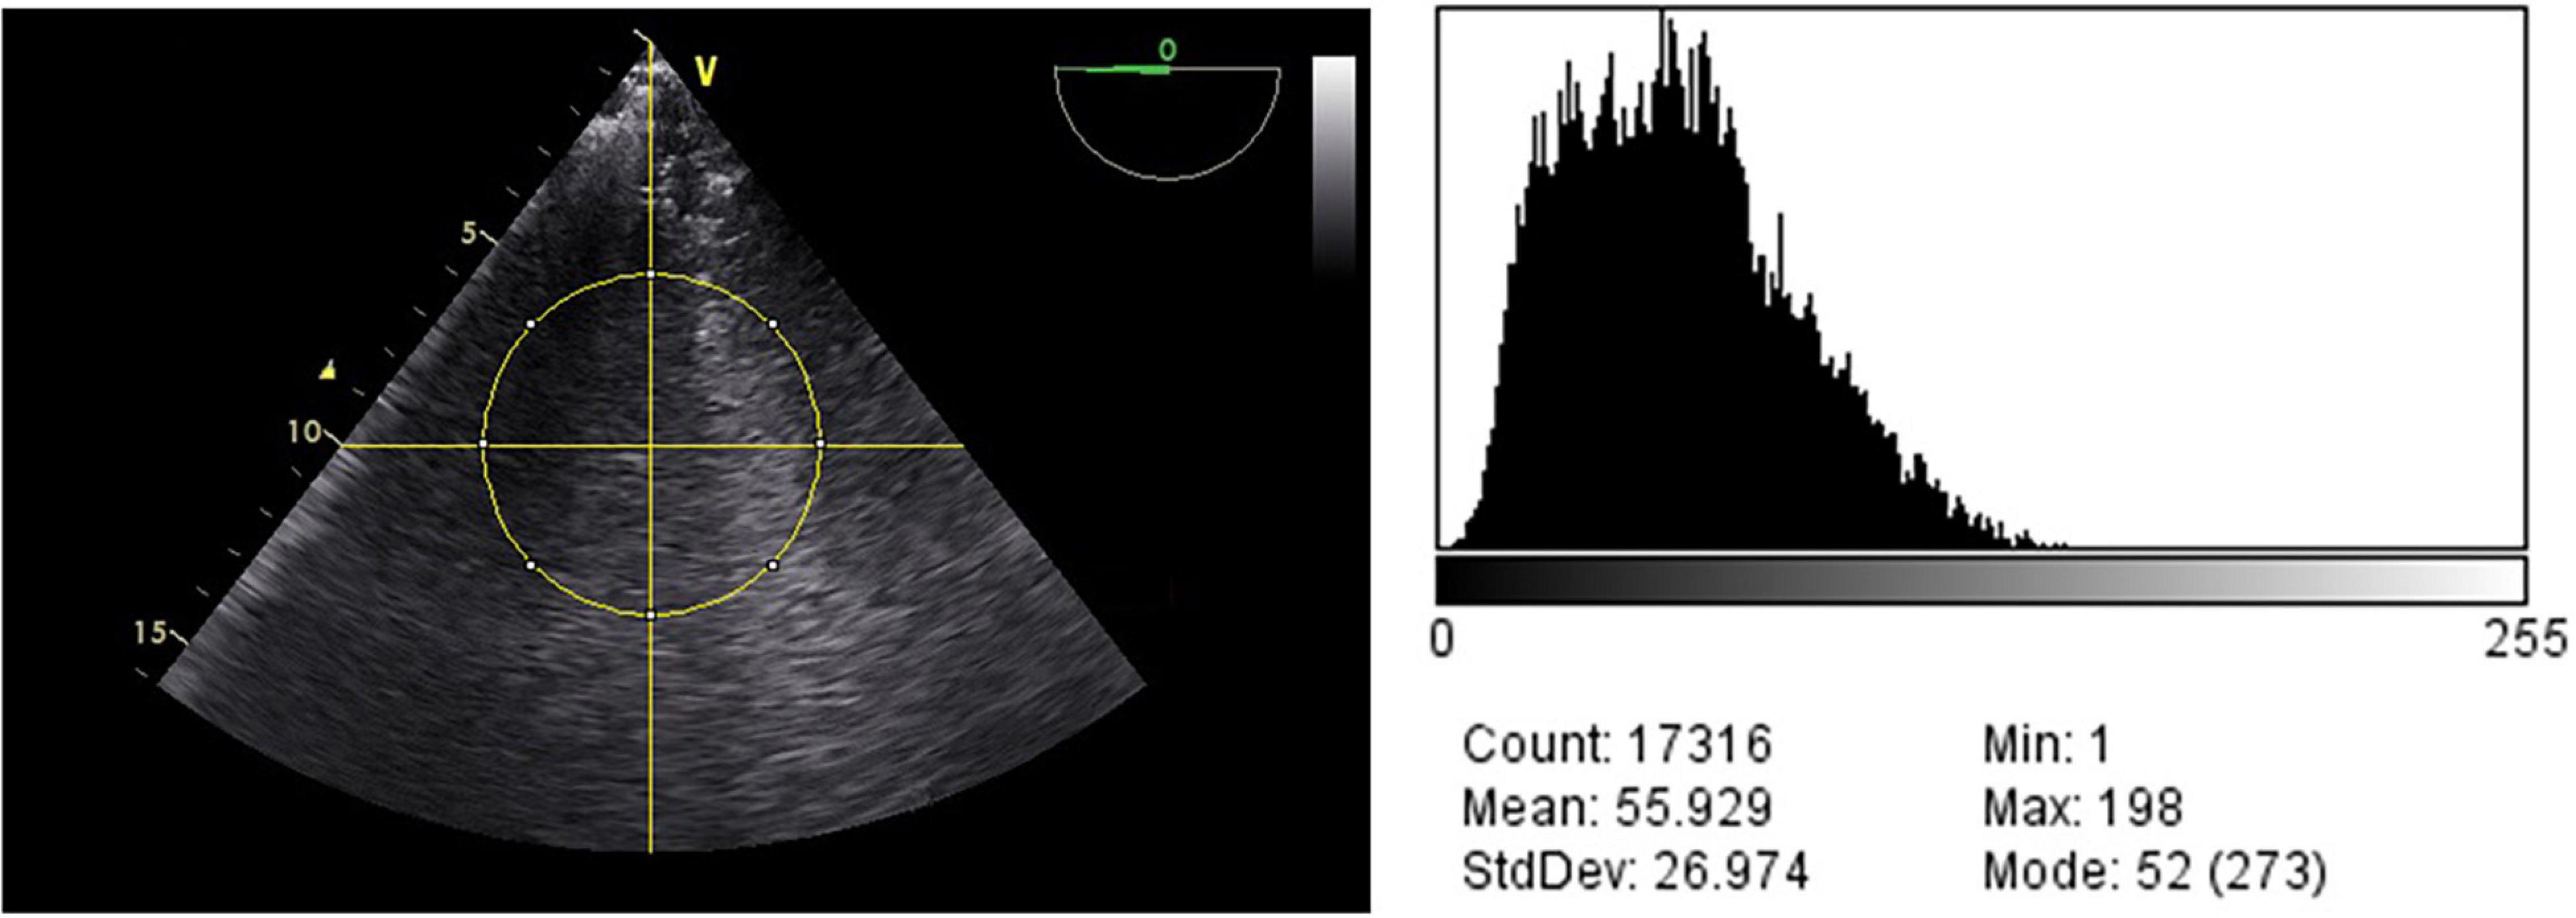
Figure 2. Characteristics (the mean, standard deviation, mode, and range) for the ROI, using the histogram function (patient #11).
Statistical analysis: Data were quoted as the median [interquartile range (IQR)]. Groups were compared using an unpaired two-sample t-test or the Mann-Whitney U-test, as appropriate. All statistical analyses were performed using GraphPad Prism (version 8.0.0, GraphPad Software, San Diego, CA, United States).
Results
Study Population
We included 38 patients with moderate-to-severe primary ARDS. Eight of the 38 (21%) were excluded because of pleural effusion. The main characteristics of the study population are summarized in Table 1. Twenty (67%) of the 30 patients were male, and the overall median [IQR] age was 63 [54–75]. Twenty-six (87%) patients were obese; the median body mass index was 31 [27–37] kg/m2. The median [IQR] PaO2/FiO2 ratio was 103 [88–128] mmHg, and 15 (50%) patients had severe ARDS. With regard to the CT scan, 27 (90%) patients had a diffuse alveolar pattern. Alveolar consolidations of the lower lobes were present in 13 (43%) patients.
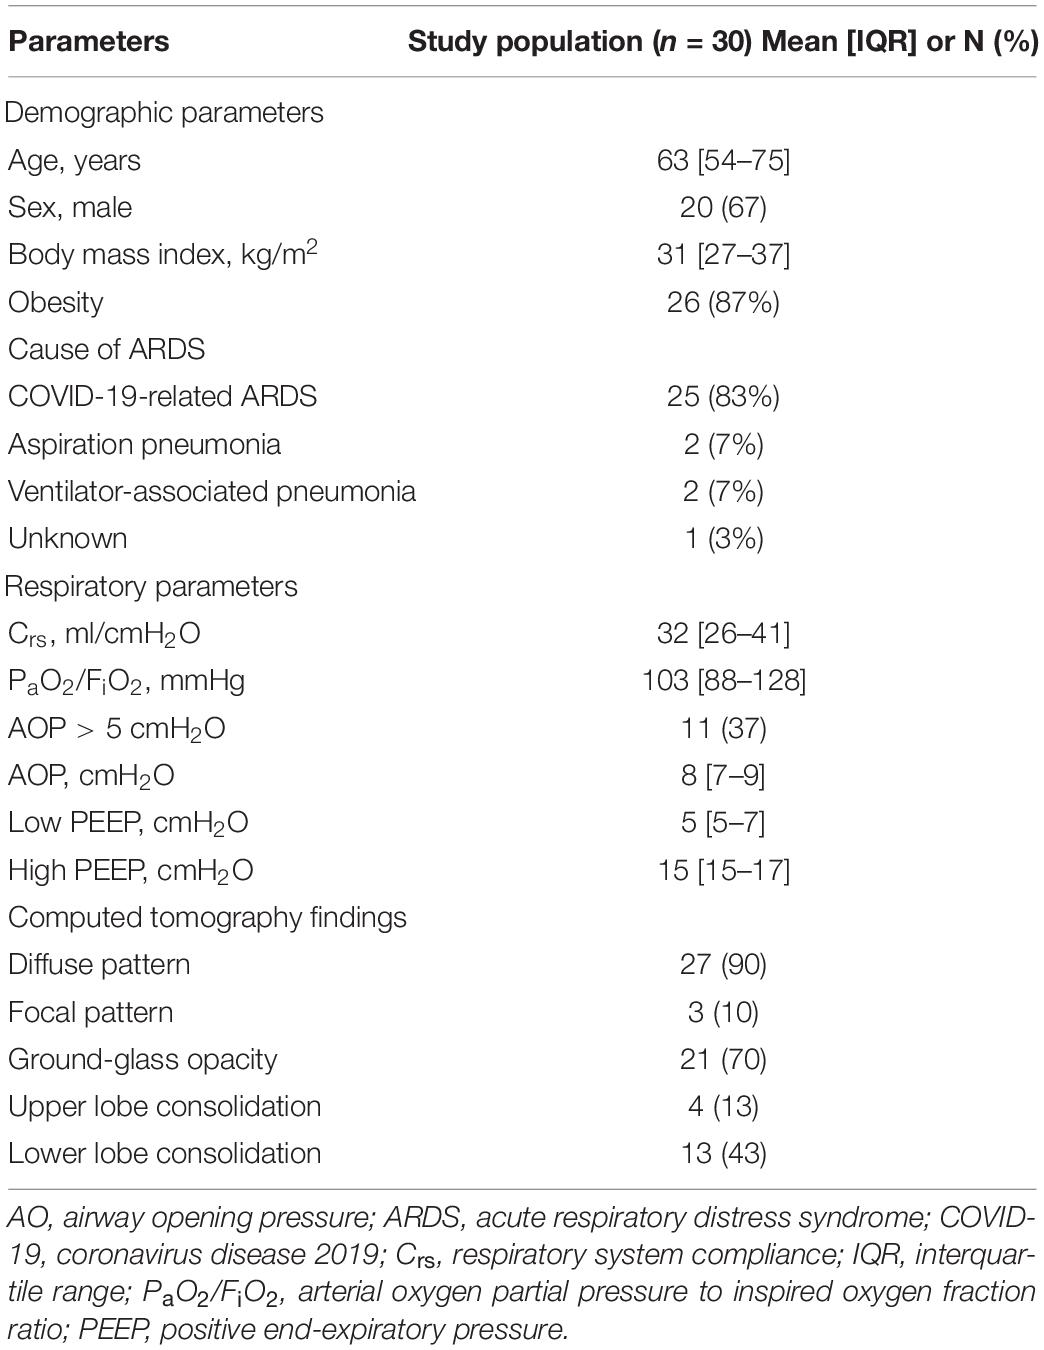
Table 1. Demographic and respiratory data for the study population.
Intragroup Comparisons
Eleven (37%) patients presented airway closure at a median [IQR] AOP of 8 [7–9] cmH2O. The median [IQR] low and high PEEPs used to calculate the R/I ratio and the TE-LUS RAS were 5 [5–7] and 15 [15–17] cmH2O, respectively (Table 1).
Nineteen (63%) patients had a high R/I ratio (≥0.5) with a median [IQR] of 0.75 [0.58–0.83], corresponding to a high degree of recruitability. Within this group, there was no significant difference between the gray scale values for LLPEEPlow vs. LLPEEPhigh (40 [32–44] and 38 [27–44], respectively, p = 0.84) or for ULPEEPlow vs. ULPEEPhigh (44 [30–69] and 48 [38–56], respectively, p = 0.79) (Table 2 and Figure 3). The median [IQR] RASLL and RASUL were 1.20 [1.12–1.63] and 1.05 [0.89–1.38], respectively. The increase in PEEP induced a greater rise in ventilation in the lower lobes than in the upper lobes (p = 0.05) (Table 2 and Figure 4).
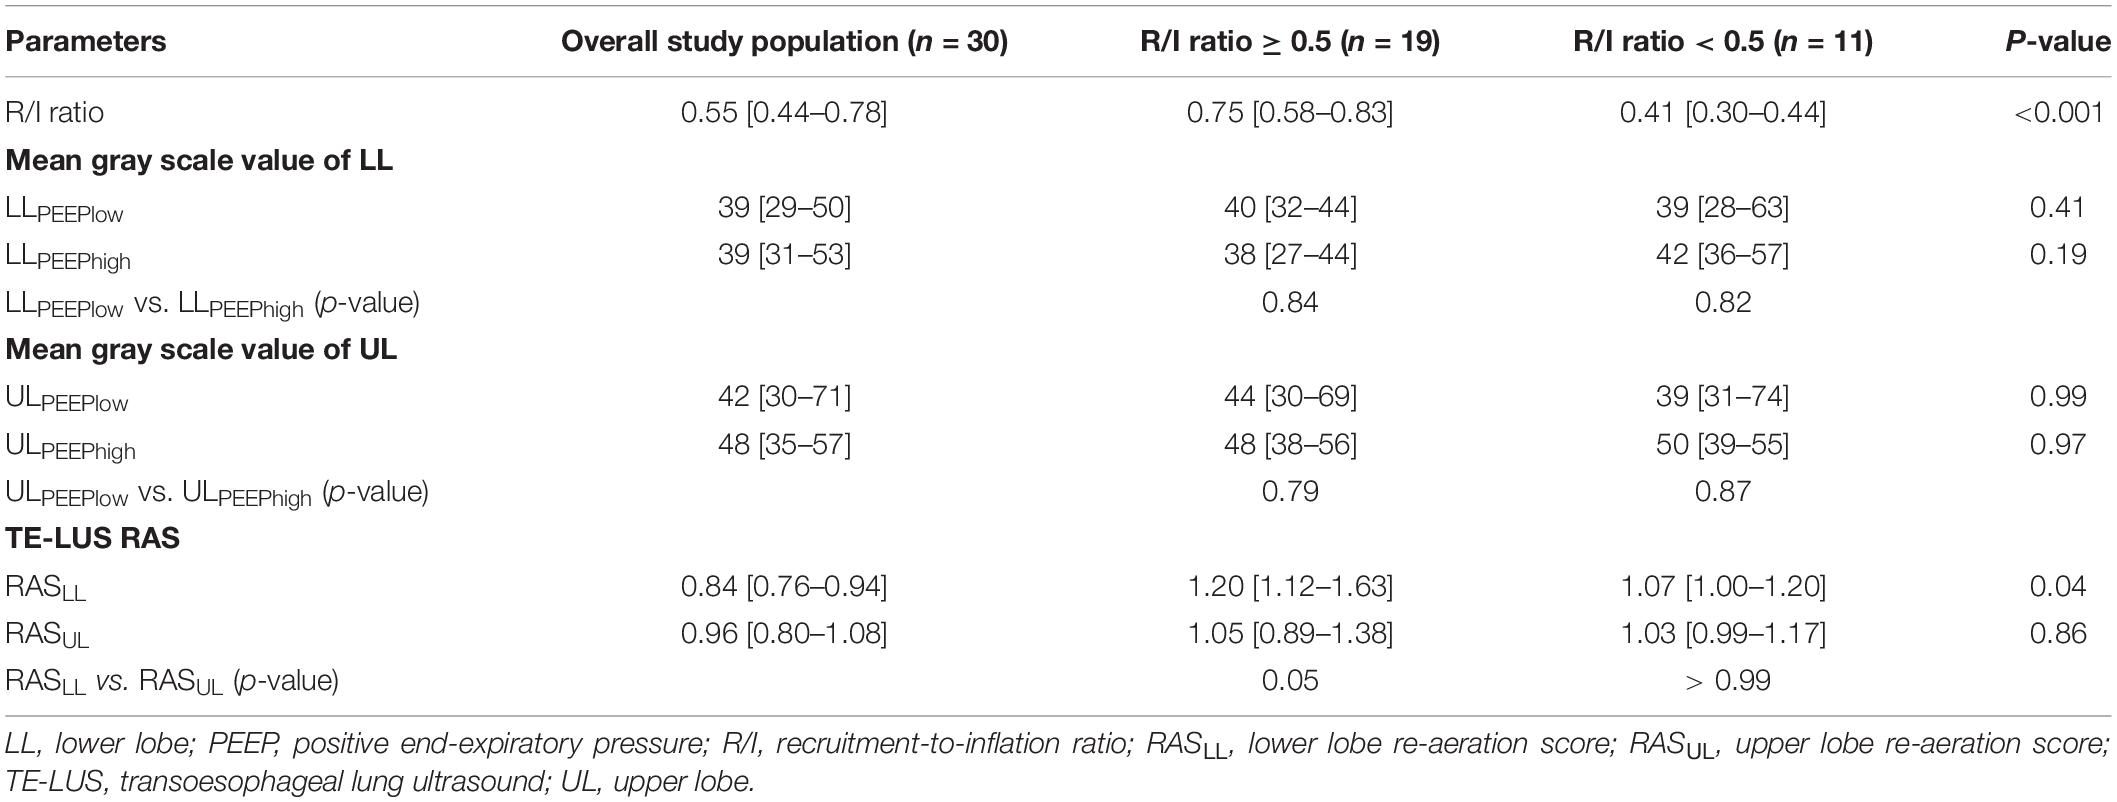
Table 2. Relationships between the R/I ratio, the mean gray scale value, and the TE-LUS RAS.
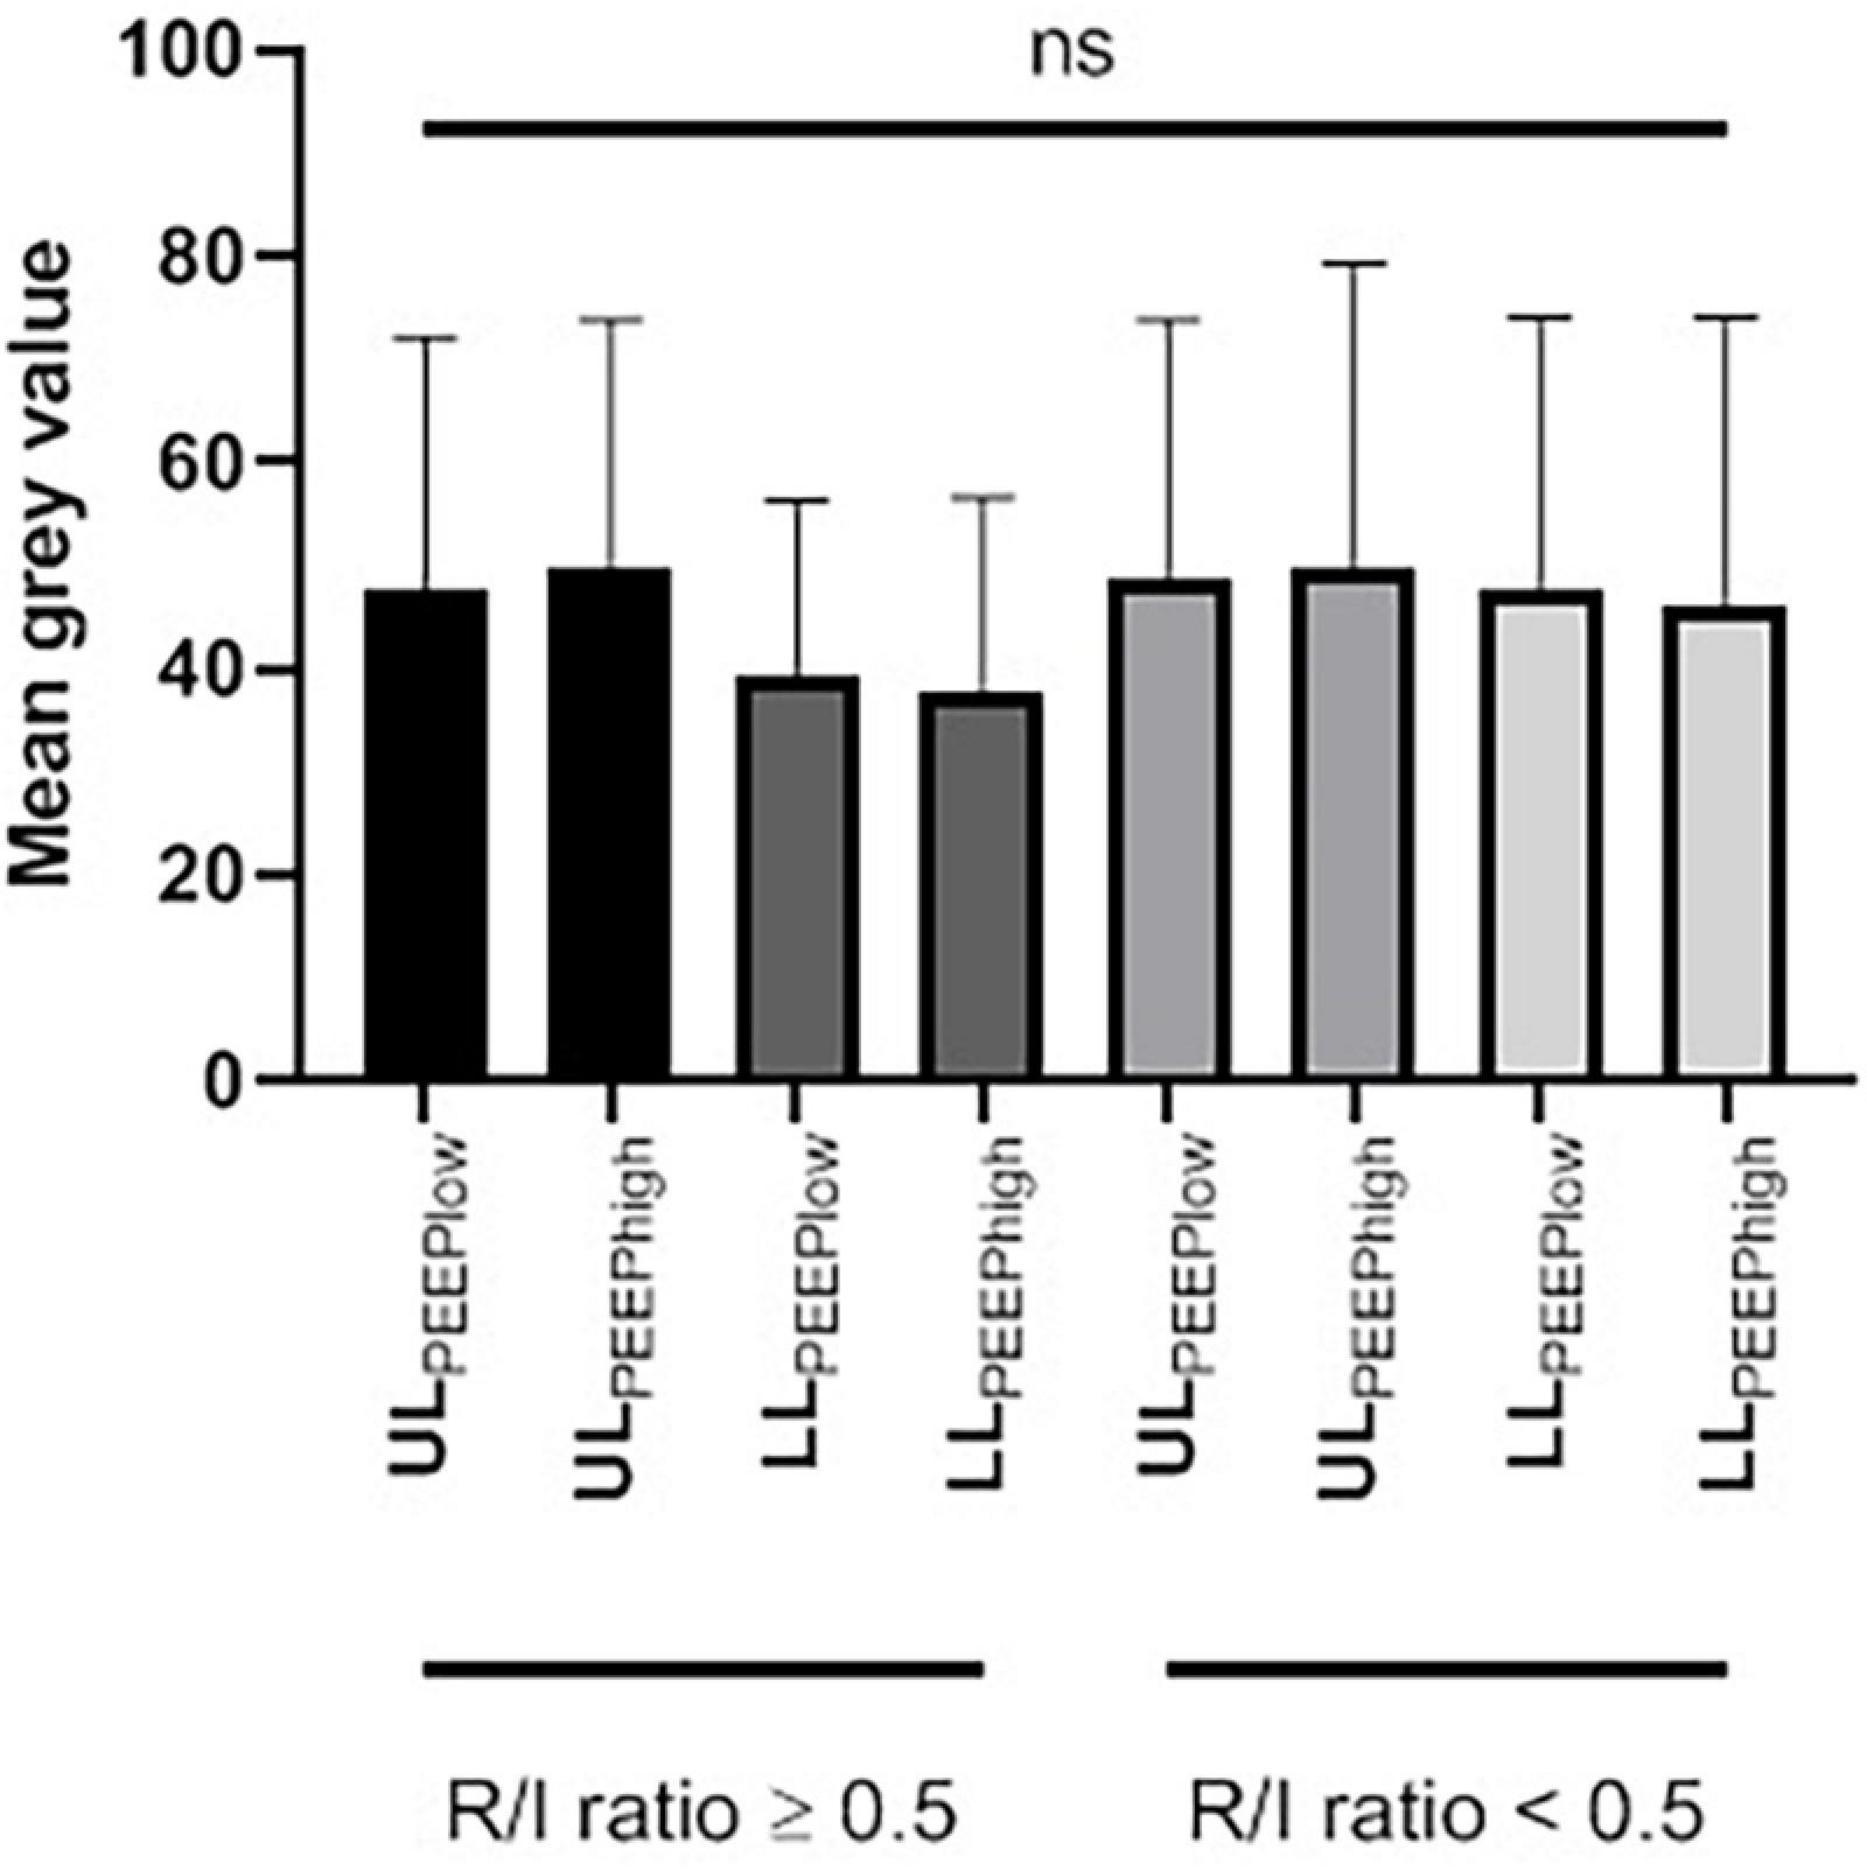
Figure 3. The mean gray scale value of the upper and lower lobes at a low and a high PEEP, as a function of the R/I ratio. LL, lower lobe; PEEP, positive end-expiratory pressure; ns, not significant; R/I, recruitment-to-inflation; UL, upper lobe.
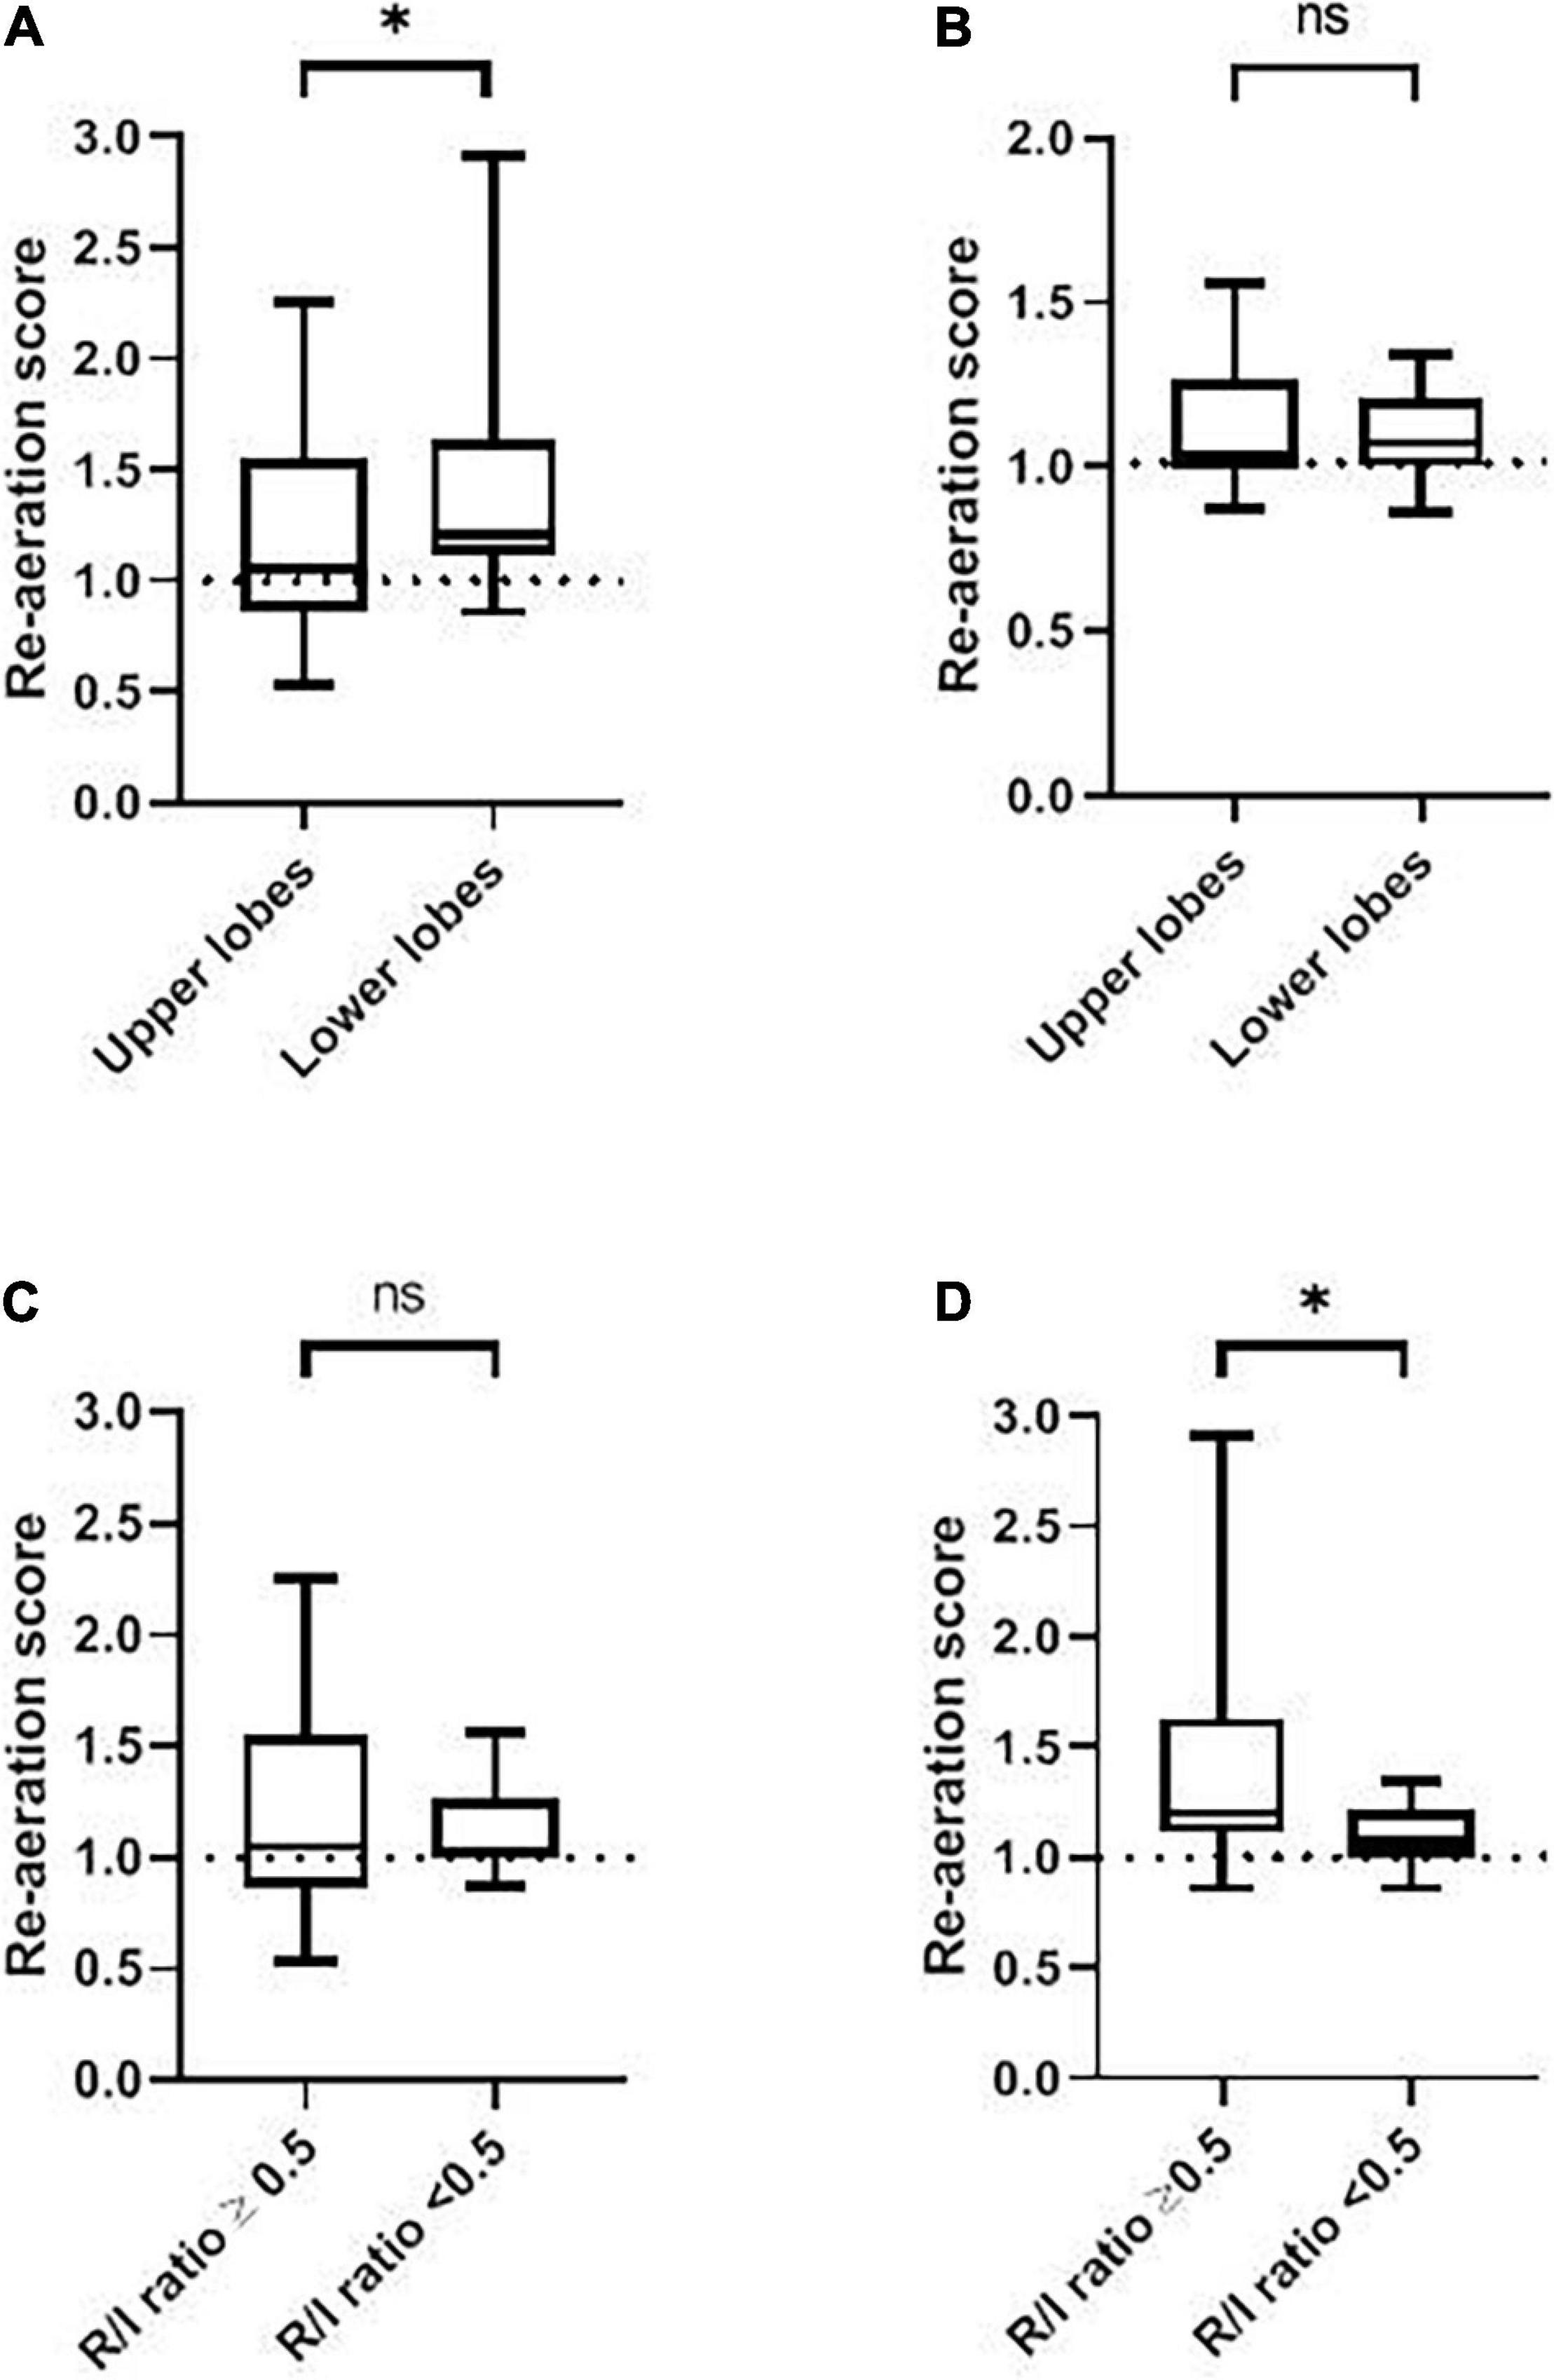
Figure 4. The RAS as a function of the recruitment-to-inflation ratio. (A) The RAS for the upper and lower lobes in patients with a high R/I ratio (≥0.5). (B) The RAS for the upper and lower lobes in patients with a low R/I ratio (<0.5). (C) The RAS for a high vs. low R/I ratio in the upper lobes. (D) The RAS for a high vs. low R/I ratio in the lower lobes. ns, not significant; R/I, recruitment-to-inflation. ∗p < 0.05.
Eleven (37%) patients had a low R/I ratio (<0.5) with a median [IQR] of 0.41 [0.30–0.44], corresponding to a low degree of recruitability. Within this group, there was no significant difference between the gray scale values for LLPEEPlow vs. LLPEEPhigh (39 [28-63] and 42 [36-57], respectively, p = 0.82) and between the gray scale value of ULPEEPlow and ULPEEPhigh (39 [31–74] and 50 [39–55], respectively, p = 0.87) (Table 2 and Figure 3). The median [IQR] RASLL and RASUL were 1.07 [1.00–1.20] and 1.03 [0.99–1.17], respectively. There was no significant difference in the increase in ventilation for the lower vs. upper lobes (p > 0.99) (Table 2 and Figure 4).
Intergroup Comparisons
There were no significant differences in the gray scale values at LLPEEPlow, LLPEEPhigh, ULPEEPlow and ULPEEPhigh between patients with a high R/I and those with a low R/I (p = 0.41, p = 0.19, p = 0.99 and p = 0.97; respectively) (Table 2 and Figure 3).
The RASLL was significantly higher in the high R/I group than in the low R/I group (1.20 [1.12–1.63] vs. 1.07 [1.00–1.20], respectively, p = 0.04). This is consistent with a significantly greater increase in lower lobe ventilation in the high R/I than in the low R/I group. In contrast, there was no significant difference in the RASUL between the high R/I and low R/I groups (1.05 [0.89–1.38] vs. 1.03 [0.99–1.17], respectively, p = 0.86) (Table 2 and Figure 4). We found non-significant correlations the R/I ratio and both RASLL and RASUL (Spearman’s Rho = 0.32 and 0.03, respectively, p > 0.05) (see Figure 5).
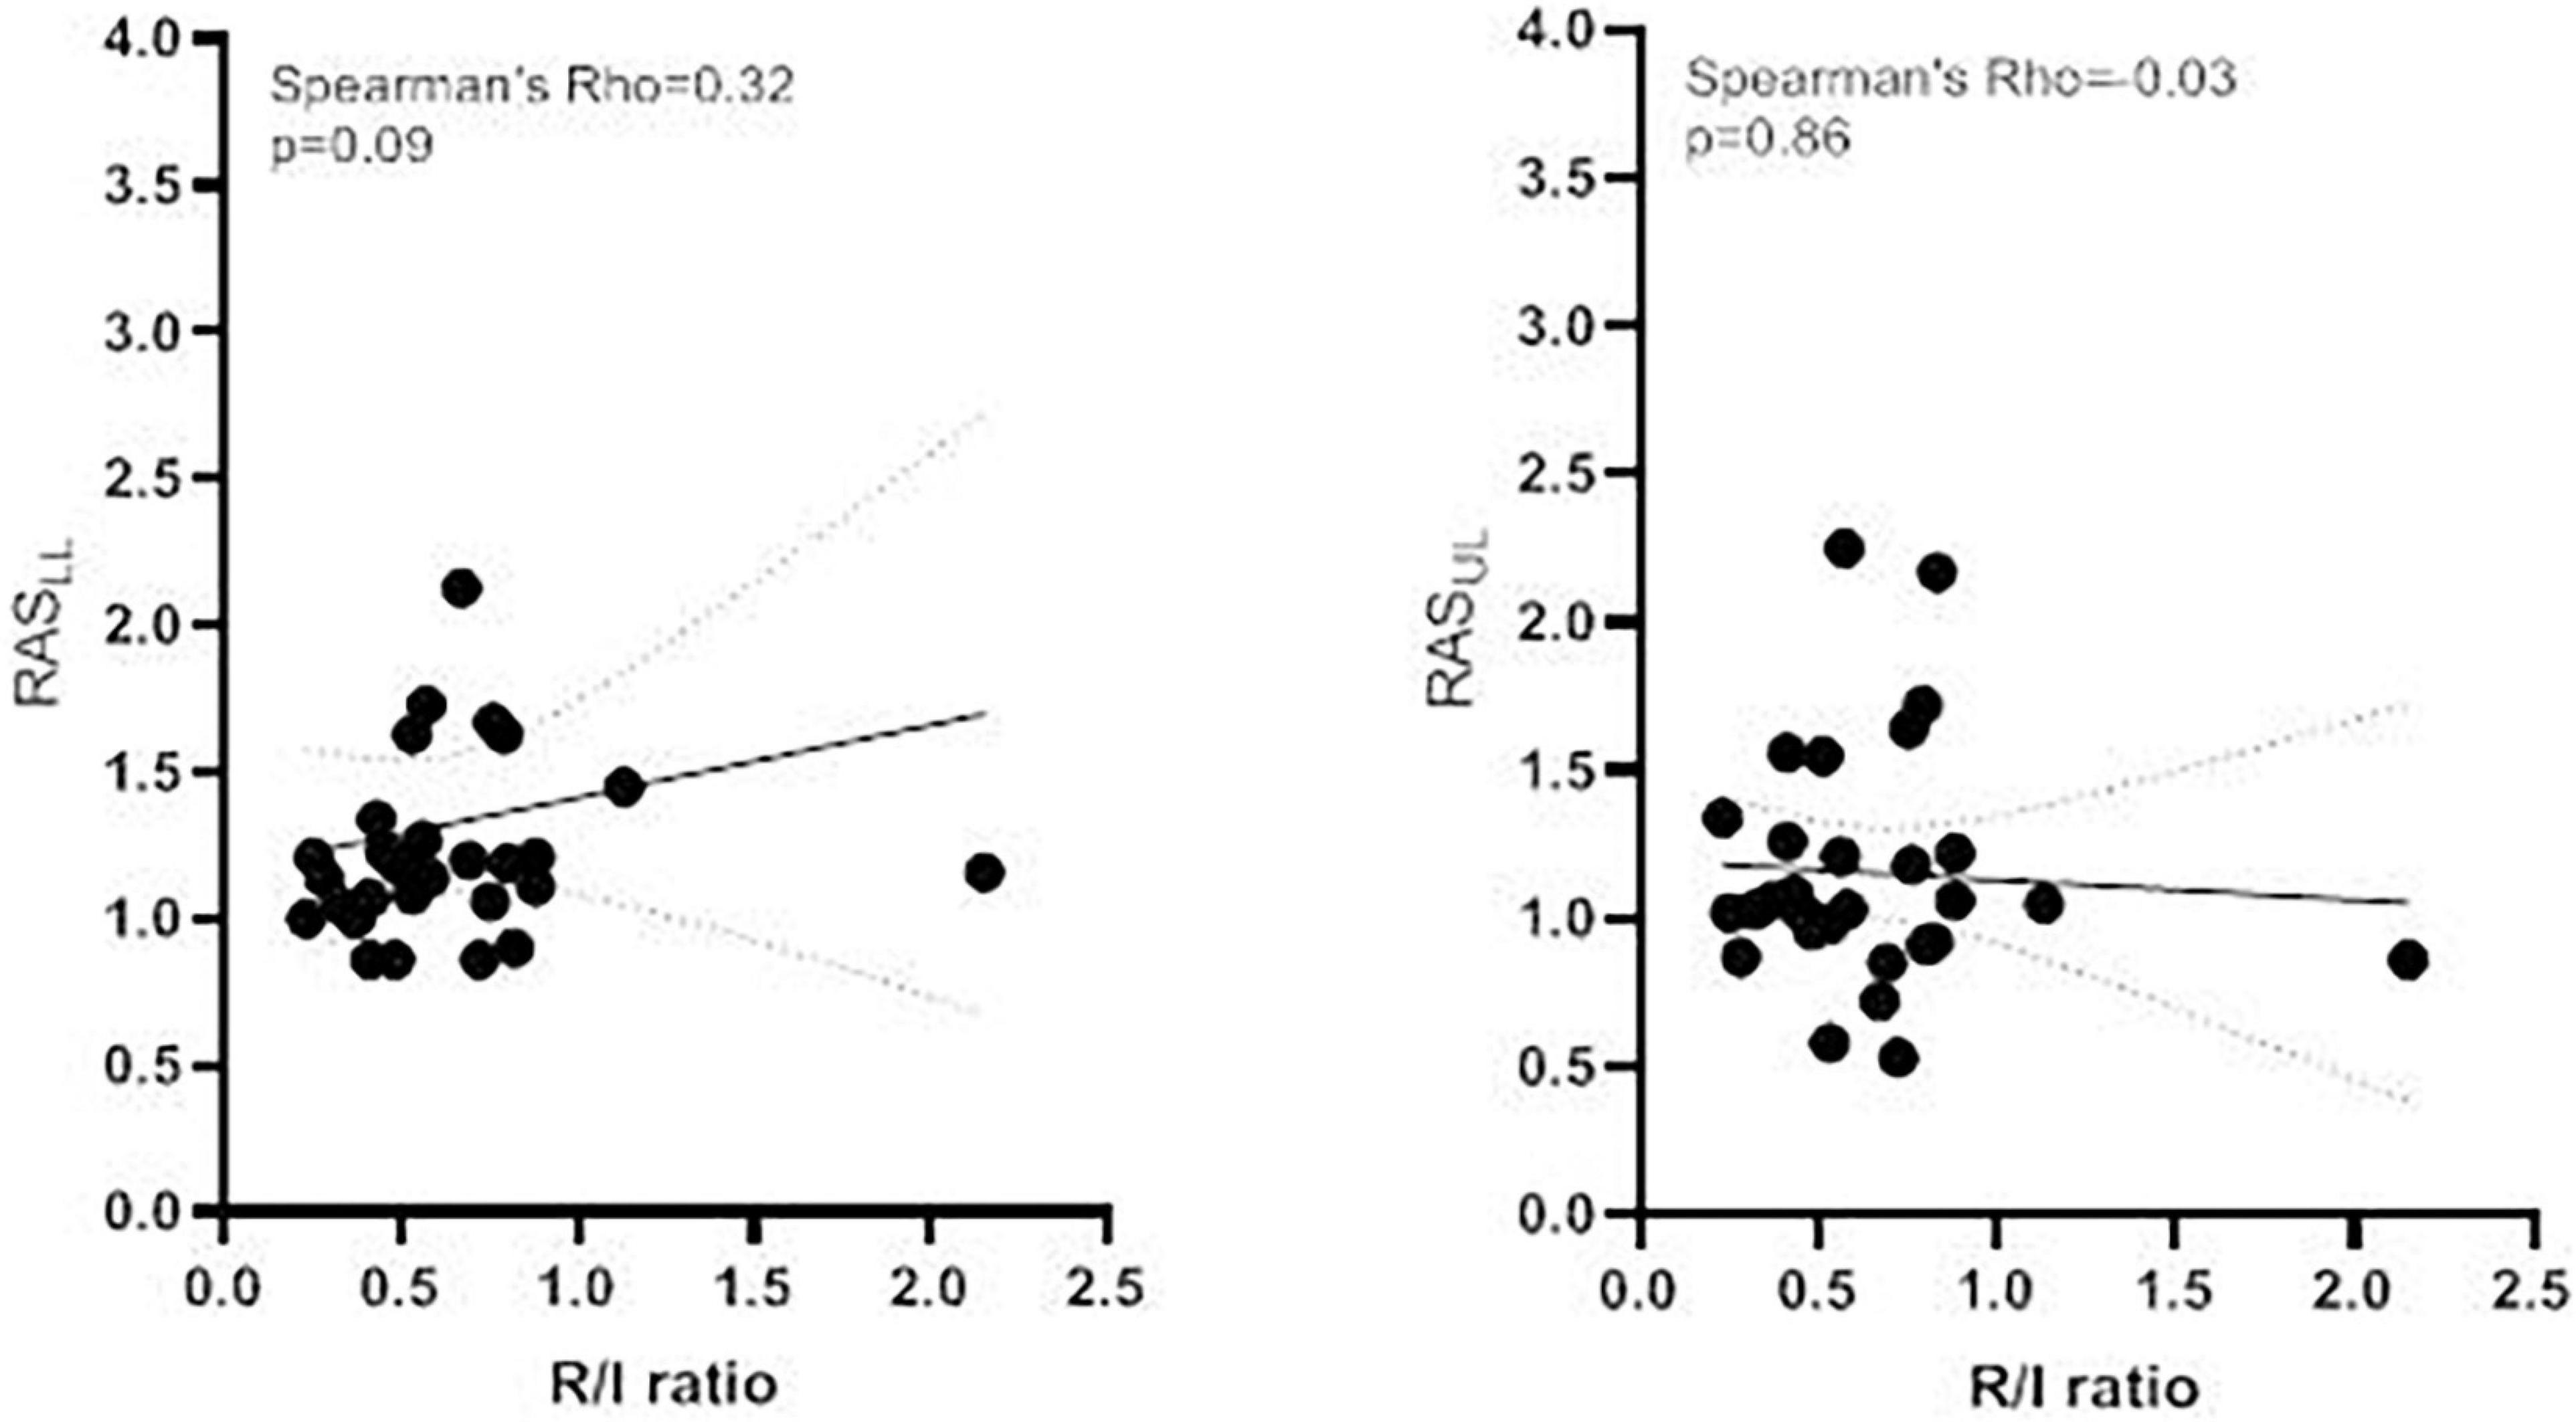
Figure 5. Correlation between the R/I ratio and the RAS Correlation between the R/I ratio and (A) the RASLL and the (B) RASUL. The continuous line shows the linear regression (with 95% confidence interval in dashed lines). R/I, recruitment-to-inflation; RASLL, lower lobe re-aeration score; RASUL, upper lobe re-aeration score.
Discussion
In our population of patients with moderate-to-severe ARDS, we found that the mean gray scale value of an ROI in the lower lobes and upper lobes did not depend on the PEEP or the R/I ratio. However, in patients with a high R/I ratio, the TE-LUS RAS was significantly higher in the lower lobes than in the upper lobes. Likewise, the TE-LUS RAS in the lower lobes was significantly higher in the high R/I group than in the low R/I group. These findings show that the increase in PEEP induces a substantial gain in the ventilation of poorly or non-aerated lower lobes (dependent lung regions), especially in patients with a high R/I ratio.
The literature data show clearly that TT-LUS is a reliable means (vs. PV curves or CT scan) of assessing PEEP-induced lung recruitment at the bedside in patients with ARDS (Bouhemad et al., 2011; Rode et al., 2012; Algieri et al., 2014). Furthermore, TT-LUS has several advantages: it avoids exposure to radiation exposure, the equipment is portable, and the method is non-invasive, inexpensive, and easily repeatable. Although TT-LUS is available in nearly every intensive care unit, correct interpretation of the findings requires formal training. Bouhemad et al. (2011) developed the TT-LUS RAS as a guide to the change in aeration (which is graded between 1 and 5) induced by a PEEP increase in each of 12 regions of the lung. An TT-LUS RAS of 8 or more was associated with a PEEP-induced lung recruitment of greater than 600 mL measured by PV curves (Bouhemad et al., 2011). Other methods based on TT-LUS have been described, such as measurement of the non-aerated lung surface area and the detection of alveolar consolidation in dependent lung regions during a PEEP trial (Lichtenstein et al., 2004; Gardelli et al., 2009; Stefanidis et al., 2011; Du et al., 2015; Tusman et al., 2016). (Tsubo et al., 2001a,b, 2004) used TE-LUS to estimate the change in density in dependent regions of the left lung during a PEEP trial or in the prone position. However, these methods only provided information of the dependent lung regions which are not representative of the whole lung, especially in non-focal ARDS (Bello and Blanco, 2019).
We have developed a new TE-LUS method in which a quantitative (computer-assisted) grayscale determination serves as a guide to PEEP-induced lung recruitment. The method is based on the following hypothesis: when the PEEP increases, inflation of the recruited alveoli leads to dramatic changes in the air/water ratio, which can be detected with ultrasound (Tang et al., 2017). Hence, when the PEEP is low, the ROI is hyperechoic and the mean gray scale value increases (up to a maximum value of 255) as a massive loss of alveoli aeration leads to lung consolidation and poor ultrasound transmission. Conversely, with a high PEEP, the ROI is hypoechoic and the mean gray scale value decreases (down to a minimum value of 0) because ultrasound is not transmitted through the re-aerated (gas-filled) alveoli (Aldrich, 2007; Bouhemad et al., 2007). We calculated the TE-LUS RAS (the ratio of the mean gray scale value at a low PEEP to the value at a high PEEP); a value above 1 reflects an increase in the ventilated area. We found that an increase of PEEP induced aeration gain on the whole lung, but predominantly in lower lobes and in patients with high lung recruitability. The effect of PEEP on the regional ventilation assessed by TT-LUS, CT scan and electrical impedance tomography provided conflicting results (Puybasset et al., 1998; Bouhemad et al., 2011; Bello and Blanco, 2019). Briefly, the effect of PEEP depended on the distribution of aeration loss (i.e., focal, diffuse or patchy) (Constantin et al., 2010). In a seminal TT-LUS study, Bouhemad et al. (2011) found that in diffuse ARDS, PEEP-induced lung re-aeration predominated in all but posterior and caudal regions. While in focal ARDS, lung consolidation predominated in the lower lung regions and the application of PEEP led to a significant re-aeration of these regions (Bouhemad et al., 2011). In our patients, a diffuse alveolar pattern predominated but alveolar consolidation of the lower lobes was relatively common (13 patients, 43%) which might partly explain our results.
The TE-LUS is a simple bedside tool that does not require interpretation of LUS pictures, especially when the propagation of ultrasound from the skin to the edge of the lung is hampered by adipose tissue or subcutaneous emphysema. However, several limitations of this pilot study need to be acknowledged and could partially explain the lack of correlation between the RE-LUS RAS and the R/I ratio. First, a R/I threshold of 0.5 was chosen to distinguish low and high recruitability while the median of our population was 0.55. However, the main results of the study remained unchanged using a threshold of 0.55 (see Supplementary Table 1). Second, the technique lacks spatial resolution, and ultrasound cannot penetrate deep into tissues (Gattinoni et al., 2017). This shortcoming can be exacerbated by lung oedema, pleural effusion or atelectasis in the ROI; the resulting noise interferes with the determination of the mean gray scale value. We tried to correct for these limitations (at least in part) by excluding patients with pleural effusion and by assessed only two PEEP levels (low to high) that differed by 10 cmH2O; this change was not perhaps large enough to elicit significant differences in the mean gray scale value. Third, our TE-LUS method inherently focused on the PEEP-induced change in aeration in the base and apex of the lung but not in the ventral and dorsal regions. Nonetheless, gravitational forces induce a ventral-to-dorsal gradient in the transpulmonary pressure; collapse predominates in the dorsal (gravity-dependent) regions, while over-inflation predominates in the ventral (gravity-independent) zones (Gattinoni and Pesenti, 2005). Fourth, when the TE-LUS RAS indicates a PEEP-induced increase in the ventilated area, it is not possible to differentiate between the further inflation of open alveoli and the reopening of previously closed alveoli (i.e., lung recruitment). Indeed, it has been reported out that LUS cannot detect lung over-inflation (Bouhemad et al., 2007; Pesenti et al., 2016; Chiumello et al., 2018). In this regard, we did not assess the effect of PEEP increase and lung re-aeration on ventilatory mechanics and gas exchange. Finally, we did not compare the TE-LUS RAS with the gold standard method for testing lung recruitability (i.e., chest CT-scan).
Conclusion
In patients with a recruitable lung volume (according to the R/I ratio), PEEP-induced re-expansion varies from one region of the lung to another. A TE-LUS assessment with calculation of the RAS evidenced a preferential increase in ventilation in the lower lobes in patients with an R/I ratio ≥ 0.5. However, this TE-LUS technique cannot differentiate the further PEEP-induced inflation of open alveoli and the reopening of previously closed alveoli.
Data Availability Statement
The raw data supporting the conclusions of this article will be made available by the authors, without undue reservation.
Ethics Statement
The studies involving human participants were reviewed and approved by the CPP Nord-Ouest II, Amiens, CEERNI 110. The patients/participants provided their written informed consent to participate in this study.
Author Contributions
CB and YZ collected the data. CB performed the analysis. CB, YZ, JM, and MS wrote the manuscript. LK, JM, and MS critically reviewed the manuscript. All authors approved the final version of the manuscript.
Conflict of Interest
The authors declare that the research was conducted in the absence of any commercial or financial relationships that could be construed as a potential conflict of interest.
Publisher’s Note
All claims expressed in this article are solely those of the authors and do not necessarily represent those of their affiliated organizations, or those of the publisher, the editors and the reviewers. Any product that may be evaluated in this article, or claim that may be made by its manufacturer, is not guaranteed or endorsed by the publisher.
Supplementary Material
The Supplementary Material for this article can be found online at: https://www.frontiersin.org/articles/10.3389/fphys.2021.716949/full#supplementary-material
References
Aldrich, J. E. (2007). Basic physics of ultrasound imaging. Crit. Care Med. 35(5 Suppl.), S131–S137.
Algieri, I., Mongodi, S., Chiumello, D., Mojoli, F., Cressoni, M., Via, G., et al. (2014). CT scan and ultrasound comparative assessment of PEEP-induced lung aeration changes in ARDS. Crit. Care 18(Suppl. 1):285.
Bello, G., and Blanco, P. (2019). Lung ultrasonography for assessing lung aeration in acute respiratory distress syndrome: a narrative review. J. Ultrasound Med. 38, 27–37. doi: 10.1002/jum.14671
Bouhemad, B., Brisson, H., Le-Guen, M., Arbelot, C., Lu, Q., and Rouby, J.-J. (2011). Bedside ultrasound assessment of positive end-expiratory pressure-induced lung recruitment. Am. J. Respir. Crit. Care Med. 183, 341–347. doi: 10.1164/rccm.201003-0369oc
Bouhemad, B., Zhang, M., Lu, Q., and Rouby, J.-J. (2007). Clinical review: bedside lung ultrasound in critical care practice. Crit. Care 11:205.
Chen, L., Del Sorbo, L., Grieco, D. L., Junhasavasdikul, D., Rittayamai, N., Soliman, I., et al. (2020). Potential for lung recruitment estimated by the recruitment-to-inflation ratio in acute respiratory distress syndrome. a clinical trial. Am. J. Respir. Crit. Care Med. 201, 178–187. doi: 10.1164/rccm.201902-0334oc
Chiumello, D., Mongodi, S., Algieri, I., Vergani, G. L., Orlando, A., Via, G., et al. (2018). Assessment of lung aeration and recruitment by CT scan and ultrasound in acute respiratory distress syndrome patients. Crit. Care Med. 46, 1761–1768. doi: 10.1097/ccm.0000000000003340
Constantin, J.-M., Grasso, S., Chanques, G., Aufort, S., Futier, E., Sebbane, M., et al. (2010). Lung morphology predicts response to recruitment maneuver in patients with acute respiratory distress syndrome. Crit. Care Med. 38, 1108–1117. doi: 10.1097/ccm.0b013e3181d451ec
Du, J., Tan, J., Yu, K., and Wang, R. (2015). Lung recruitment maneuvers using direct ultrasound guidance: a case study. Respir. Care 60, e93–e96.
Gardelli, G., Feletti, F., Gamberini, E., Bonarelli, S., Nanni, A., and Mughetti, M. (2009). Using sonography to assess lung recruitment in patients with acute respiratory distress syndrome. Emerg. Radiol. 16, 219–221. doi: 10.1007/s10140-008-0734-1
Gargani, L., and Volpicelli, G. (2014). How i do it: lung ultrasound. Cardiovasc. Ultrasound 12, 25.
Gattinoni, L., and Pesenti, A. (2005). The concept of “baby lung”. Intensive Care Med. 31, 776–784. doi: 10.1007/s00134-005-2627-z
Gattinoni, L., Caironi, P., Cressoni, M., Chiumello, D., Ranieri, V. M., Quintel, M., et al. (2006). Lung recruitment in patients with the acute respiratory distress syndrome. N. Engl. J. Med. 354, 1775–1786.
Gattinoni, L., Collino, F., Maiolo, G., Rapetti, F., Romitti, F., Tonetti, T., et al. (2017). Positive end-expiratory pressure: how to set it at the individual level. Ann. Transl. Med. 5:288. doi: 10.21037/atm.2017.06.64
Gattinoni, L., Marini, J. J., and Quintel, M. (2020). Recruiting the acutely injured lung: how and why? Am. J. Respir. Crit. Care Med. 201, 130–132. doi: 10.1164/rccm.201910-2005ed
Hess, D. R. (2015). Recruitment maneuvers and PEEP titration. Respir. Care 60, 1688–1704. doi: 10.4187/respcare.04409
Lichtenstein, D. A., Lascols, N., Mezière, G., and Gepner, A. (2004). Ultrasound diagnosis of alveolar consolidation in the critically ill. Intensive Care Med. 30, 276–281. doi: 10.1007/s00134-003-2075-6
Mojoli, F., Bouhemad, B., Mongodi, S., and Lichtenstein, D. (2019). Lung ultrasound for critically ill patients. Am. J. Respir. Crit. Care Med. 199, 701–714.
Pesenti, A., Musch, G., Lichtenstein, D., Mojoli, F., Amato, M. B. P., Cinnella, G., et al. (2016). Imaging in acute respiratory distress syndrome. Intensive Care Med. 42, 686–698.
Puybasset, L., Cluzel, P., Chao, N., Slutsky, A. S., Coriat, P., and Rouby, J.-J. A. (1998). Computed tomography scan assessment of regional lung volume in acute lung injury. Am. J. Respir. Crit. Care Med. 158, 1644–1655. doi: 10.1164/ajrccm.158.5.9802003
Rode, B., Vučić, M., Siranović, M., Horvat, A., Krolo, H., Kelečić, M., et al. (2012). Positive end-expiratory pressure lung recruitment: comparison between lower inflection point and ultrasound assessment. Wien. Klin. Wochenschr. 124, 842–847. doi: 10.1007/s00508-012-0303-1
Sahetya, S. K., Goligher, E. C., and Brower, R. G. (2017). Fifty years of research in ARDS. Setting positive end-expiratory pressure in acute respiratory distress syndrome. Am. J. Respir. Crit. Care Med. 195, 1429–1438.
Schneider, C. A., Rasband, W. S., and Eliceiri, K. W. (2012). NIH image to imagej: 25 years of image analysis. Nat. Methods 9, 671–675. doi: 10.1038/nmeth.2089
Stefanidis, K., Dimopoulos, S., Tripodaki, E.-S., Vitzilaios, K., Politis, P., Piperopoulos, P., et al. (2011). Lung sonography and recruitment in patients with early acute respiratory distress syndrome: a pilot study. Crit. Care 15:R185.
Tang, K.-Q., Yang, S.-L., Zhang, B., Liu, H.-X., Ye, D.-Y., Zhang, H.-Z., et al. (2017). Ultrasonic monitoring in the assessment of pulmonary recruitment and the best positive end-expiratory pressure. Medicine 96:e8168. doi: 10.1097/md.0000000000008168
Tsubo, T., Sakai, I., Suzuki, A., Okawa, H., Ishihara, H., and Matsuki, A. (2001a). Density detection in dependent left lung region using transesophageal echocardiography. Anesthesiology 94, 793–798. doi: 10.1097/00000542-200105000-00017
Tsubo, T., Yatsu, Y., Suzuki, A., Iwakawa, T., Okawa, H., Ishihara, H., et al. (2001b). Daily changes of the area of density in the dependent lung region – evaluation using transesophageal echocardiography. Intensive Care Med. 27, 1881–1886. doi: 10.1007/s00134-001-1115-3
Tsubo, T., Yatsu, Y., Tanabe, T., Okawa, H., Ishihara, H., and Matsuki, A. (2004). Evaluation of density area in dorsal lung region during prone position using transesophageal echocardiography. Crit. Care Med. 32, 83–87. doi: 10.1097/01.ccm.0000104944.18636.b2
Keywords: lung ultrasound, acute respiratory distress syndrome, positive end-expiratory pressure, lung recruitment, alveolar recruitment
Citation: Brault C, Zerbib Y, Kontar L, Maizel J and Slama M (2021) Transoesophageal Ultrasound Assessment of Lung Aeration in Patients With Acute Respiratory Distress Syndrome. Front. Physiol. 12:716949. doi: 10.3389/fphys.2021.716949
Received: 29 May 2021; Accepted: 16 August 2021;
Published: 09 September 2021.
Edited by:
Peter Markus Spieth, University Hospital Carl Gustav Carus, GermanyReviewed by:
Thomas Bluth, Dresden University of Technology, GermanyCarmen Silvia Valente Barbas, University of São Paulo, Brazil
Copyright © 2021 Brault, Zerbib, Kontar, Maizel and Slama. This is an open-access article distributed under the terms of the Creative Commons Attribution License (CC BY). The use, distribution or reproduction in other forums is permitted, provided the original author(s) and the copyright owner(s) are credited and that the original publication in this journal is cited, in accordance with accepted academic practice. No use, distribution or reproduction is permitted which does not comply with these terms.
*Correspondence: Clément Brault, YnJhdWx0LmNsZW1lbnRAY2h1LWFtaWVucy5mcg==