 Elizabeth DiBona1
 Lee J. Pinnell1
 Annika Heising-Huang2
 Simon Geist1
 Jeffrey W. Turner1,3
 Frauke Seemann1,3*
- 1Department of Life Sciences, Texas A&M University-Corpus Christi, Corpus Christi, TX, United States
- 2Institut für Genetik, Technische Universität Braunschweig, Braunschweig, Germany
- 3Center for Coastal and Marine Studies, Texas A&M University-Corpus Christi, Corpus Christi, TX, United States
Microplastic pollution is of public concern for global environmental health, aquaculture, and fisheries. Toxicity studies have shown that microplastic ingestion may cause intestinal damage, microbiota dysbiosis, and disturb the lipid and energy metabolism in fish. To determine the impact of environmentally relevant, chronic, low dose microplastic fibers on fish health, medaka larvae, and juveniles were exposed to five concentrations of polyethylene (PE) fibers for 21 days through the feed. Fish growth and condition were assessed to determine the overall impact on fish health. To identify impaired energy intake, the gastrointestinal tract (GIT) integrity was evaluated at the molecular and cellular levels. Microbiota analysis was performed by comparing the top seven most abundant phyla present in both larval and juvenile fish exposed to 0, 1.5, and 3 PE fibers/fish/day. A shift in the phyla Proteobacteria and Bacteroidetes were observed. Larval samples demonstrated decreased proteobacteria abundance, while juvenile samples displayed an increase in abundance. Relative gene expression of key digestive genes from GIT tissue was quantified using real time-quantitative polymerase chain reaction. An effect on digestive gene expression potentially affecting nutrient absorption and antioxidant production was indicated via a significant decrease of solute carrier family 6 member 6 expression in larvae exposed to 6 fibers/fish/day. No significant molecular changes were observed in juvenile GIT tissue, although a non-monotonous dose-response was observed. GIT morphology was analyzed using histomorphological observations of the GIT mucus and cell types. No significant impairment of the GIT epithelial layers was observed in larvae or juveniles. To assess growth and condition, Fulton’s condition factor was measured. No differences were observed in larval or juvenile growth. Comparisons of different developmental stages allowed for identifying vulnerable developmental stages for microplastic exposure; larvae were more susceptible to molecular changes, while shifts in juvenile microbial communities were similar to changes reported post-polystyrene microplastic sphere exposure. This study is one of the first to provide toxicological data on the risk of PE fiber ingestion during fish development stages. Results indicate no imminent threat to fish condition at current measured environmental levels of microplastics; however, close monitoring of vital spawning grounds for commercially important fishes is recommended.
Introduction
Awareness of widespread plastic pollution in marine, freshwater, and terrestrial ecosystems is a worldwide environmental issue. Over 220 wild species have been found to consume microplastics (Cole et al., 2011; Lusher et al., 2017). Microplastics (plastics particles < 5 mm) are the most numerous form of marine debris found in the environment, with fibers and fragments being the most abundant shapes of ingested microplastics (de Sa et al., 2018). Fibers are mainly sourced from the degradation of macroplastics and textile fiber shedding from domestic washing with polyethylene (PE) being the most common microplastic type found (Pirc et al., 2016; de Sa et al., 2018). The location of microplastics in the aquatic environment depends on their chemical composition and density, which directly affects the potential of marine organisms’ exposure to these contaminants.
Many different types of aquatic organisms, including teleost fish, mussels, and zooplankton, ingest microplastics inadvertently while feeding (Browne et al., 2008; Cole et al., 2013; Deudero and Alomar, 2015; Romeo et al., 2015; Granby et al., 2018). Ingestion of microplastic can harm the GIT mechanically and lead to injury and tissue structure alteration (Peda et al., 2016; Law, 2017). Various forms of physical damage in fish have been attributed to microplastic ingestion, such as intestinal lesions, dead tissue, and pro-inflammatory response (Ahrendt et al., 2020; Solomando et al., 2020; Zhang et al., 2020). Microplastic ingestion has also been observed to affect digestive function, immune response, and microbiota dysbiosis (Huang et al., 2020). Different polystyrene microplastic shapes caused intestinal damage and malfunction, specifically microbiota dysbiosis (Jin et al., 2018; Lu et al., 2018; Qiao et al., 2019; Feng et al., 2020). One recent study, sequencing the V3-V4 region of the 16S rRNA gene, revealed changes at the phylum level in colon microbiota of mice; both Proteobacteria and Actinobacteria abundances increased in the microplastic exposure groups (Lu et al., 2018). Microbiota communities can affect the interaction of the GIT and multiple body systems, e.g., brain, endocrine and immune system and modify feeding behavior, digestion, and metabolism (Butt and Volkoff, 2019). Identification of a shift in the microbiota community of exposed medaka will provide insight into effects on digestion and metabolism. Metagenomic sequencing of the V4 region of the 16S rRNA gene will provide information on the taxonomic composition of the microbiota within medaka GITs (Costa and Weese, 2018).
Moreover, significant changes on the molecular level indicative of oxidative stress and inflammation have been evidenced in aquatic organisms exposed to microplastics (Cole et al., 2011; Choi et al., 2018). Measuring changes in expression of key genes found in the GIT can identify the potential impacts PE fiber has on fish nutritional competence and overall GIT function. The digestive hormones glucagon-like peptide 1 (GLP) and peptide YY (PYY) is secreted by intestinal epithelial endocrine L-cells and regulate food intake (Rønnestad et al., 2013). GLP increases glucose availability through glycogenolysis (Holst, 2007; Polakof et al., 2012). PYY has been shown to decrease gastric and pancreatic secretions (Batterham and Bloom, 2003; Holzer et al., 2012; Polakof et al., 2012). Insulin (ISN), as the third hormone released by the pancreas, promotes critical nutrient uptake and stimulates energy reserves (Smith, 1980; Nelson and Sheridan, 2006). Trypsinogen (TRP), representing the proteolytic enzymes, is the enzyme trypsin’s precursor and is necessary for protein digestion (Nelson and Sheridan, 2006; Rønnestad et al., 2013). Upon release, TRP is activated in the fish’s GIT and becomes the digestive enzyme trypsin, which is vital for the digestion of proteins and has been found to have a positive relationship with growth (Smith, 1980; Rungruangsak-Torrissen et al., 2006). Like the taurine transporter solute carrier family 6 member 6 (slc6a6), nutrient membrane transporters are found in the plasma membrane throughout the GIT. Slc6a6 is required for amino acids and glucose uptake and plays a role in the Nrf2 pathway, which induces antioxidant production (Smith, 1980; Hybertson et al., 2011; Rønnestad et al., 2013). Deregulated expression of these genes can provide an insight into feeding, digestion, and nutrient uptake post microplastic exposure. Together, mechanical damage, microbiota community, and molecular assessments can give insight into the impact microplastics have on organism growth and overall health (Masura et al., 2015; Sussarellu et al., 2016; Beiras et al., 2018; Pannetier et al., 2020).
The majority of studies have focused on the impacts of polystyrene microplastic spheres on mature organisms using exposure concentrations 2–7 times higher than concentrations currently observed in the environment (Lenz et al., 2016). To further knowledge surrounding the impacts of microplastic environmental pollution, potentially susceptible developmental stages of fish inhabiting contaminated bays and estuaries should be assessed utilizing the more commonly found PE fibers.
Employing a chronic exposure scenario to PE fibers at concentrations similar to those found in previous research sampling both marine and freshwater environments, the potential impacts of PE fiber ingestion on microbiota composition, molecular gene expression, tissue integrity, and growth and condition are evaluated in larvae and juvenile Japanese Medaka fish (Oryzias latipes) in the present study (Lusher et al., 2013; Beer et al., 2018; de Sa et al., 2018). The GIT integrity, growth, and condition are critical indicators of fish health. Chronic exposure to environmentally relevant PE fiber concentrations is predicted to negatively affect growth and condition in a dose- and age-dependent manner. It is hypothesized that oral uptake of PE fibers targets the gastrointestinal tract (GIT). Ingestion of microplastics can disturb the GIT epithelial layer and increase inflammation in the GIT. Furthermore, we hypothesize that impacts will be life-stage dependent, and higher doses of PE fibers are expected to induce more drastic effects. Molecular deregulation of nutrient uptake pathways can increase GIT inflammation and change the GIT mucus layers affecting nutrient uptake, altering the fish’s energy budget, and potentially leading to reduced fish health.
Materials and Methods
Exposure Experiment
Microplastic Fiber Preparation
Polyethylene fibers were chosen due to their commonality and abundance among microplastics found in wild specimens. A microplastic:fish size ratio of 1:4 was observed by Hajovsky and Geist (pers. communication) while assessing microplastic ingestion of juvenile fish in Corpus Christi Bay, Texas. Blue PE multifilament yarn was provided by Lumat (United States) (Supplementary Figure 1). The plastic material was received and analyzed using an FTIR-ATR (Thermo Fisher Scientific) and identified as an 86% match to PE low-density material (Figure 1). These PE fibers were observed to sink, but not to cluster, and thus, aeration was added to each tank to prevent sinking and allow fibers to be distributed within the water column during exposure. A microtome was used to cut the PE fibers into 100 μm increments (Cole et al., 2016). The PE multifilament yarn was folded and cut into approximately 9 mm long sections. The sections were then embedded in paraffin and cut into 100 μm sections. The paraffin film from the microplastic fibers was removed by overnight clearing (HistoChoice® clearing agent). Fibers were then washed and filtered using DI water onto a cellulose nitrate filter. Microplastic fibers were stored on the filter in a closed glass petri dish until later. To obtain 400 μm sections of the multifilament yarn, a paper cutter and ruler were used to cut microplastic into the appropriate length. The sections were then placed on the cellulose nitrate filter and stored in a closed glass petri dish until later use. The respective PE fiber lengths were chosen according to the 4:1 fish size/fiber length ratio reported in fish field samples from the Gulf of Mexico (Hajovsky, 2019).
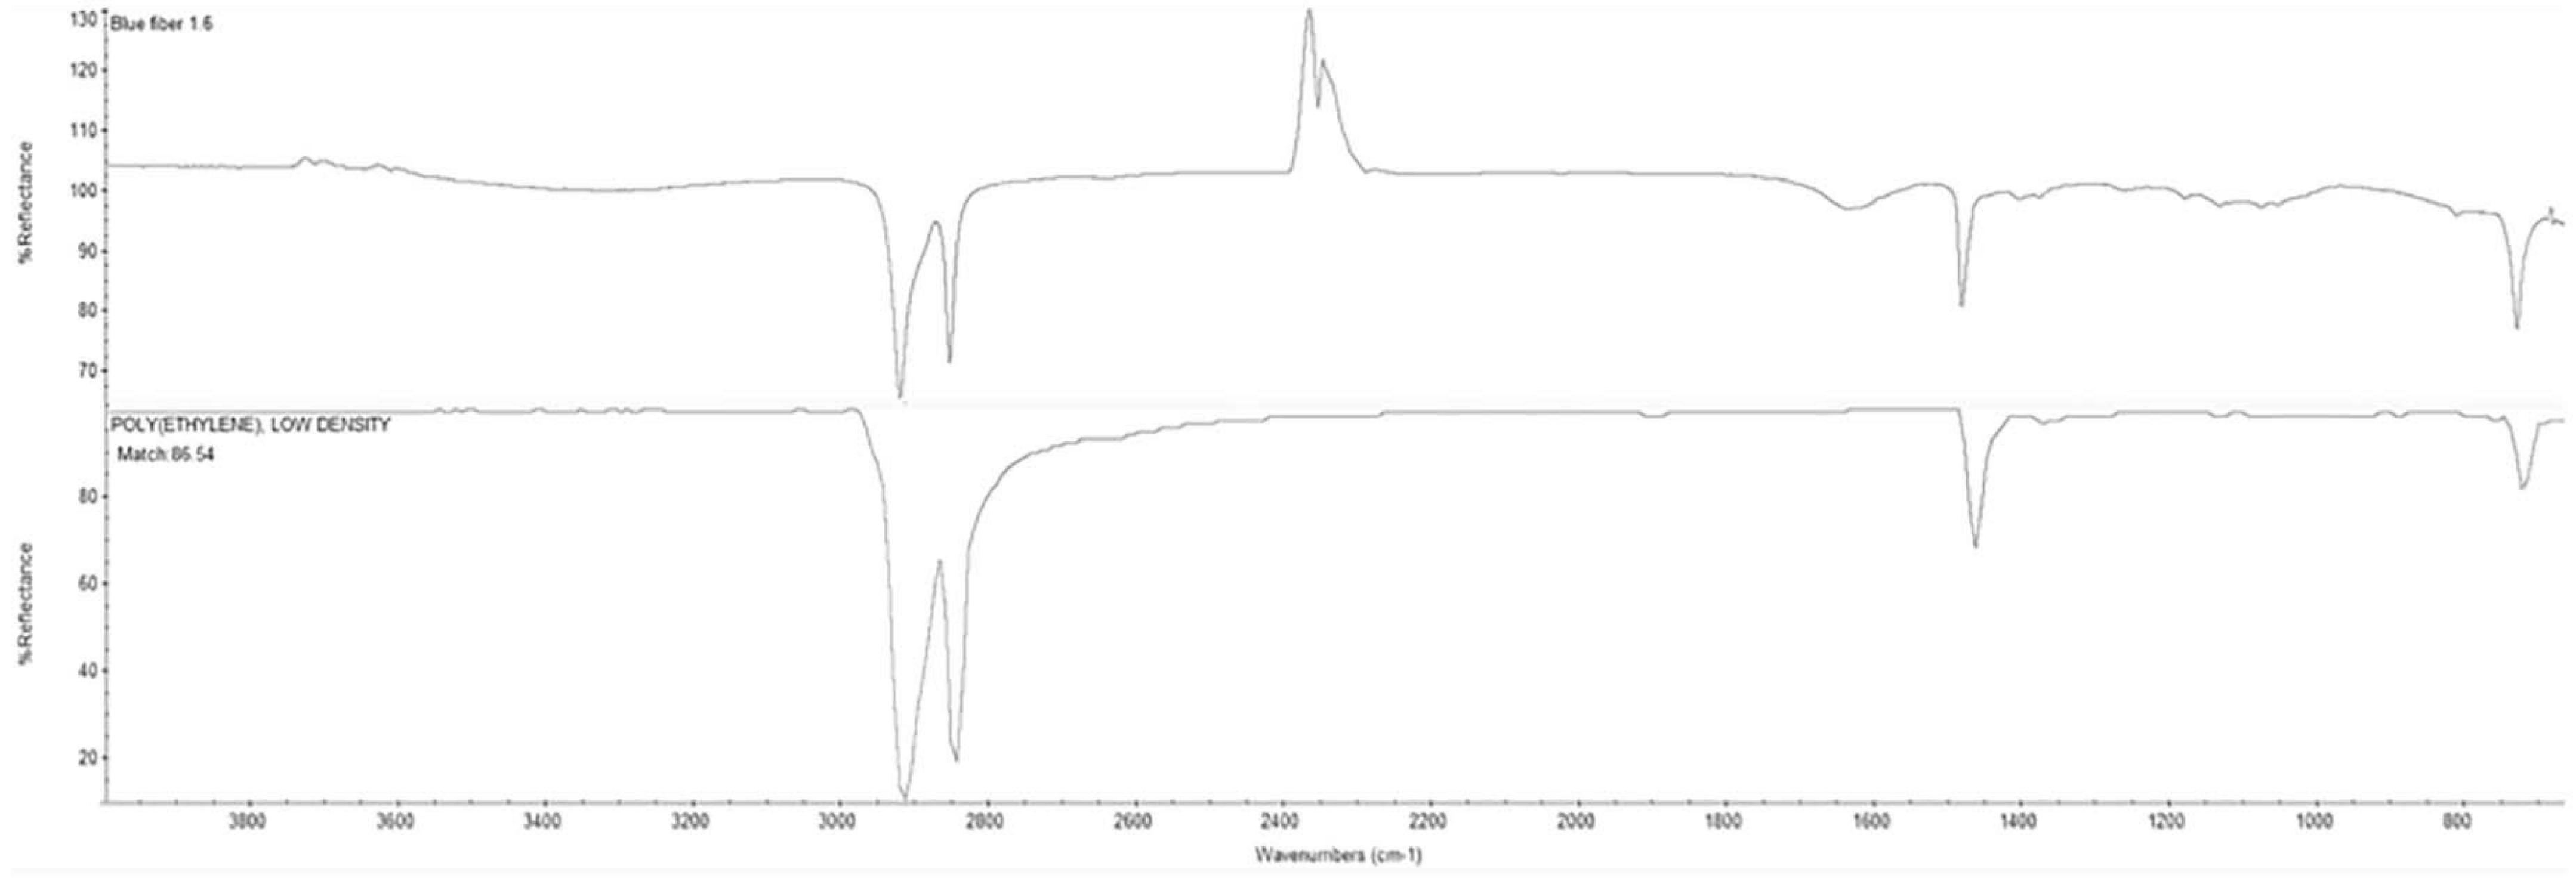
Figure 1. Fourier Transform Infrared - Attenuated Total Reflectance (FTIR-ATR) results (upper spectrum) for blue PE multifilament yarn from Lumat (United States) revealed an 86% match to standard polyethylene low density signal from the XYZ database (lower spectrum).
Model Organism
Japanese medaka, Oryzias latipes (OL) orange-red inbred strain established at TAMU-CC in 2018 were used as a model for this study (IACUC # 19-03). Larval and juvenile age groups were selected based on development stage and potential vulnerability to microplastic ingestion: 7 days post-hatching (dph) represents the period of mouth opening and beginning of feeding for medaka larvae, and 1-month post-hatching presents a critical period for organ maturation and body growth for medaka (Kinoshita et al., 2009). Larvae at 7 dph (total length (TL): 0.04 ± 0.02 cm) and 1-month old juveniles (28 dph; total length (TL): 0.16 ± 0.04 cm) were randomly allocated to 2 L tanks at a density of 50 individuals per tank (n = 5). Water quality was maintained via weekly water changes (100%). Tanks were maintained at a temperature range of 25 ± 1°C, 12-h photoperiod, dissolved oxygen at 6 mg/per liter, nitrates below 20 mg per liter, nitrites below 0.1 mg per liter, ammonia below 0.01 mg per liter, and pH range from 7.7 to 8.2. Tanks were provided aeration to keep microplastic fibers circulating in the water column and to prevent settling of PE fibers on the bottom of the tank. Tanks were covered to prevent potential cross-contamination of microplastic fibers. All animal experimental procedures have been approved by the institutional animal care and use committee #19-05.
Larval and Juvenile Exposure
Larval and juvenile OL were exposed to five concentrations of 100 μm (larvae) and 400 μm (juvenile) long PE fibers, respectively. The PE fibers were added to approximately 0.1 g of ground dry larval feed and stored in 0.2 ml sterile PCR tubes before the exposure experiment. The daily dose of PE fibers was administered to larvae through two feedings for a 21-day chronic exposure period. The environmentally relevant exposure concentrations were 0, 0.5, 1.5, 3, and 6 PE fibers per individual per day for both age groups, with 5 independent replicate tanks holding 50 individuals per replicate. Upon completing the experiment, individuals were sacrificed through hypothermic shock, weighed, measured, dissected for tissue samples, and preserved for subsequent analyses.
Microplastic Fiber Long-Term Retention
To assess retention of microplastic fibers in the GIT, 10 larvae and juvenile medaka per replicate (n = 5 pools of 10 individuals) were sacrificed 12 h after the last microplastic feeding via hypothermic shock and stored at -20°C until assessment. Fish were weighed, measured and the intestine was dissected out. PE fibers per individual GIT were counted with a stereomicroscope for each exposure concentration and the control.
Microbiota Assessment
The microbiota composition was analyzed to determine if microplastic consumption at these concentrations caused dysbiosis. GITs of both larvae (n = 5 pools of 1-2 individuals per concentration) and juveniles (n = 5 pools of 1-2 individuals per concentration) medaka were collected post exposure from the exposure groups dosed with 0, 1.5, and 3 PE fibers per fish per day. These concentrations (0, 1.5, and 3 fibers/fish/day) were chosen based on preliminary reproduction assessment data indicating these groups may be more at risk (DiBona, 2020). DNA was extracted from the samples using a QIAamp® PowerFecal® Pro DNA Kit from QIAGEN. The V4 region of the bacterial and archaeal 16S rRNA gene was amplified using 515f/806rB primer constructs (Walters et al., 2016). The constructs contained Illumina specific adapters followed by 12 bp Golay barcodes on each forward primer. PCR was performed in replicate reactions containing 12.5 μL Phusion Hot–Start Flex 2X MasterMix (New England Biolabs, Ipswich, MA, United States), 0.2 μM final concentration of forward and reverse primers, 2 μL template, and nuclease-free water to equal 25 μL. Mock microbial community DNA standards (Zymo Research, Irvine, CA, United States) and no template controls were prepared with each PCR replicate. Amplification conditions were 98°C for 30 s followed by 30 cycles of 10 s at 98°C, 30 s at 55°C, and 1 min at 72°C. Final extension occurred at 72°C for 5 min. 25 μL from each amplicon library was then cleaned and normalized using the SequalPrep Normalization Plate Kit (Applied Biosystems, Foster City, CA, United States), and equal volumes of each normalized library were pooled. The pooled library was quantified using a Qubit 3.0 fluorometer and dsDNA High Sensitivity Assay Kit (Life Technologies, Carlsbad, CA, United States). The molarity of the pooled library was calculated and was diluted to a loading concentration of 6 pM. The diluted, pooled library was sequenced on an Illumina MiSeq instrument using paired-end chemistry (2 × 250 bp) with the addition of a 10% PhiX Control Library (Illumina, San Diego, CA, United States) to increase sequence diversity at the Shedd Aquarium’s Molecular and Microbial Ecology Lab (Chicago, IL, United States).
Raw sequence reads were processed using a combination of QIIME2 and phyloseq (Caporaso et al., 2010; McMurdie and Holmes, 2013). Reads were demultiplexed and checked for quality using QIIME2. Due to low-quality scores, reverse reads were omitted from further processing and samples were processed as single-end reads using forward reads only. DADA2 was used to filter reads for quality, remove chimeric sequences, and generate amplicon sequence variants (ASVs) within QIIME2 using a trim length of 242 bp (Callahan et al., 2016). Taxonomy was assigned using a Naïve Bayes classifier trained on the SILVA 132 release 99% OTUs database, where sequences had been trimmed to include only the 250 bases from the V4 region bound by the 515F/806R primer pair (Quast et al., 2013). Reads that mapped to chloroplast and mitochondrial sequences were filtered from the sequence variants table using the “filter taxa” function, and a phylogenetic tree was then generated using the “q2-phylogeny” pipeline with default settings, which was used to calculate phylogeny-based diversity metrics. Data were then imported into phyloseq using the “import_biom,” and “import_qiime_sample_data” functions and merged into a phyloseq object (McMurdie and Holmes, 2013). Alpha diversity was measured using the number of observed ASVs, Shannon’s diversity, and Faith’s phylogenetic distance. Samples were then proportionally transformed to a normalized read count equal to the lowest per sample read depth (12,412). Beta diversity was analyzed using UniFrac distances calculated using the R packaged “GUniFrac” (Lozupone et al., 2011; Chen et al., 2012). These distances were ordinated and plotted using phyloseq. Further, the relative abundances of ASVs within each sample were calculated and plotted using phyloseq.
Digestive Gene Expression
Gastrointestinal tracts from larvae (n = 5 pools of 5 individuals per concentration) and juvenile (n = 5 pools of 5 individuals per concentration) medaka were isolated during dissection and stored at -80°C. mRNA was extracted from the tissue samples using 500 μl TRI-Reagent following the extraction protocol. Tissues were homogenized in 2 ml Precellys tubes with ceramic beads. Samples were incubated at room temperature (23°C) for 5 min. 50 μl of chloroform was added followed by gentle mixing. After incubation for 10 min at room temperature, the samples were centrifuged at 12,000∗g for 10 min at 4°C. The aqueous phase containing RNA was transferred into a new RNAse/DNAse-free 1.5 ml microcentrifuge tube and precipitated with 250 μl isopropanol, vortexed for 10 s, and incubated at room temperature for 10 min. Samples were then centrifuged at 12,000∗g for 8 min at 23°C. The supernatant was discarded, and the pellet was resuspended using 500 μl of 75% molecular grade ethanol. The samples were centrifuged at 7,500∗g for 5 min at 23°C. The supernatant was removed, and samples air dried to remove any remaining ethanol. Once dry, each sample pellet was resuspended using 50 μl of RNAse/DNAse free sterile water and stored at −80°C.
RNA quality and concentration were determined through gel electrophoresis and the BioSpectrometer (Eppendorf). Reverse transcription was performed to obtain cDNA for RT-qPCR using the Promega Reverse Transcriptase kit following the manufacturer’s instructions. Briefly, the RNA, oligo primers, random primers, and nuclease-free water were combined in a 0.2 ml PCR tube and incubated at 70°C for 5 min. Then, the reaction mix containing the reaction buffer, MgCl2, PCR nucleotide mix, reverse transcriptase, and water was prepared as a master reaction mix for all samples. The preincubated samples were removed from 70°C and placed on ice for 5 min. Next, 15 μl of the master reaction mix was added to each sample tube and the reverse transcription was performed (annealing: 25°C for 5 min, extension: 42°C for up to an hour, inactivation of the reverse transcriptase at 70°C for 15 min). The cDNA samples were stored at −20°C.
Real time quantitative polymerase chain reaction was performed with O. latipes digestive gene primers (TRP, ISN, GLP, PYY, and slc6a6) and three reference genes (18S, EF1a, and RPL7) (Supplementary Table 1) using a 1:2 dilution of template cDNA. Reference genes were selected based on previous research indicating 18S, EF1a, and RPL7 are suitable for normalization in RT-qPCR (Zhang and Hu, 2007; Kozera and Rapacz, 2013). Reference gene stability was verified using RefFinder (BestKeeper, DeltaCT, NormFinder, and Genorm) (Xie et al., 2012). Relative gene expression was performed using real time quantitative polymerase chain reaction in a 96-well plate with 10 μl of master mix and 2.5 μl of template per well for a total volume of 12.5 μl per well. The plate was sealed with a plastic membrane, centrifuged and then run in the qPCR machine (QuantStudio3) for 40 cycles (95°C for 5 min, 95°C for 25 s, 60°C for 20 s, 72°C for 30 s, 78–80°C for 15 s) followed by a meltcurve (95°C for 15 s, 60°C for 60 s).
Gastrointestinal Tract Histomorphometric Analyses
The histomorphology of the GIT epithelial layer will be assessed to obtain information on tissue integrity and inflammation post-PE fiber exposure. Larval and juvenile specimens were sacrificed via hypothermic shock and fixed in 4% formalin (5 individuals per replicate, n = 5 pools of 5 individuals). Whole fish were embedded in 1.5% Agarose gels, dehydrated and embedded in paraffin. Serial cuts of the GIT of the medaka were adhered to microscope slides and left to dry overnight. Slides were stained with either Hematoxylin and Eosin stain (H&E) or Alcian Blue and Periodic Acid Schiff stain (AB-PAS) using an automated slide stainer (Thermo Fisher Scientific) and subsequently mounted with a glass coverslip using. Pictures were taken with cellSens Standard software on an Olympus BX53 compound microscope at a magnification of 40X. Image J software (Fiji) was employed for all image analyses (Schindelin et al., 2012).
Leukocyte migration was assessed as an inflammation marker, affecting nutrient absorption (Smith, 1980). Inflammation was measured using H&E stain (Figure 2B). Sections from the hindgut of the fish were used for assessment; the hindgut was determined based on the presence of surrounding tissue such as gonadal tissue as well as the structure of the intestine (Mumford et al., 2007). Leukocytes counts were used to determine the degree of inflammation (Mumford et al., 2007). A score system of 0–4 was used to quantify the degree of inflammation (0 = no recruitment, 1 = minor recruitment (1–10 leukocytes), 2 = definite recruitment (11–20 leukocytes), 3 = significant inflammation (21–30 leukocytes), and 4 = severe inflammation (>31 leukocytes). An area from three sections of 5 individuals’ hindguts was assessed per concentration for a total of 15 sections per concentration. An area was defined to be 40 μm2, and areas were spaced by at least 20 μm to ensure no overlap. Assessed sections came from non-consecutive slides to ensure no duplicate counts or overlap.
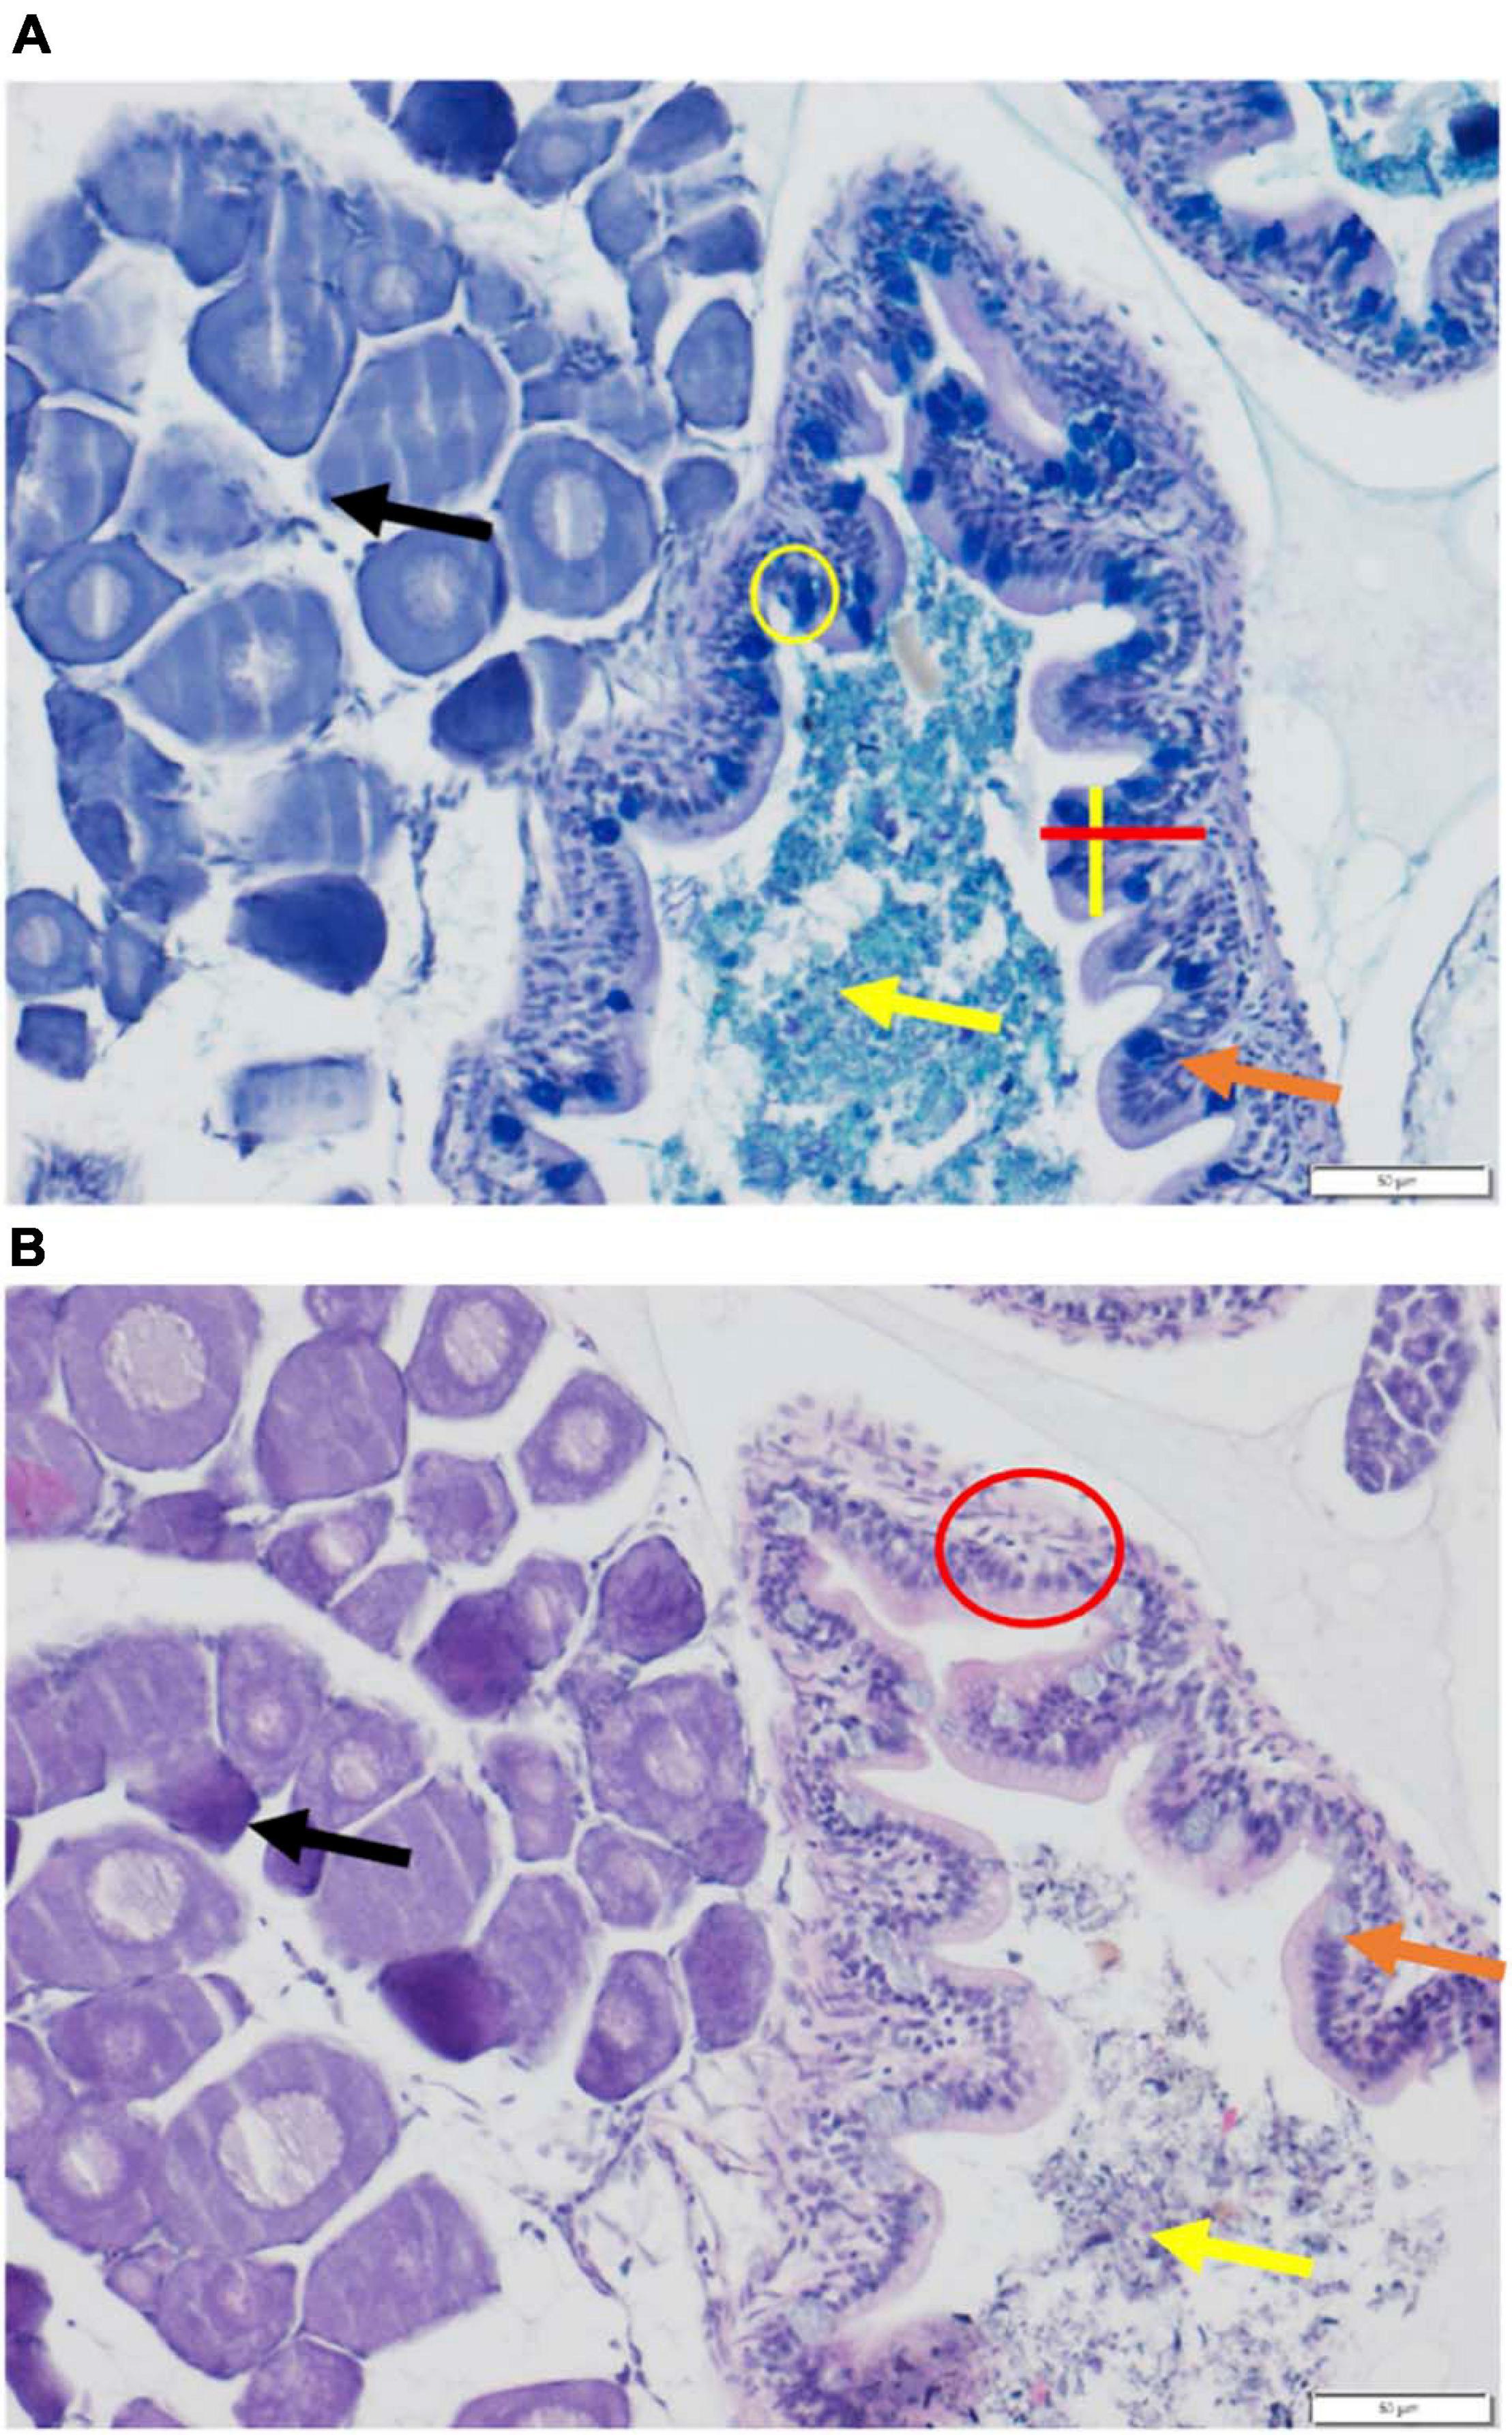
Figure 2. Stained histological sections of control (0 fibers/fish/day) larval medaka hindgut. (A) AB-PAS stained hindgut. Red line indicates a measurement of microvilli length. Yellow line indicates a measurement of microvilli width. Yellow circle encompasses goblet cell. Orange arrow indicates microvilli; yellow arrow indicates gut lumen/gut contents; black arrow indicates gonadal tissue. (B) H&E stained hindgut. Red circle encompasses example area assessed for leukocyte migration/inflammation. Orange arrow indicates microvilli; yellow arrow indicates gut/lumen contents; black arrow indicates gonadal tissue.
AB-PAS staining allowed the assessment of mucus pH, goblet cell abundance and microvilli length and width (Figure 2A). GIT mucus is crucial for protecting epithelial cells and supporting digestion, and was assessed for pH, as pH fluctuations affect enzymatic activity (Hur et al., 2016; Sylvian et al., 2016). Mucus pH was measured using AB-PAS-stained slides as this stain allows for the differentiation of mucus layers and pH. Image J software (Fiji) was employed for the image analyses. Foregut sections were used for mucus assessment; foreguts were determined by the structure of the intestine as well as surrounding tissues. Assessed sections came from non-consecutive slides to ensure no duplicate counts or overlap. Mucus pH was determined based on a color scale using Image J software; images were converted to 8-bit grayscale and analyzed. On this gray scale 0 = pure black and 255 = pure white. An area of 40 μm2 from three sections of 5 individuals’ foreguts was assessed per concentration, for a total of 15 sections per concentration (n = 5 pools of 5 individuals).
Comparison of the mucus-producing goblet cell abundance allowed for assessment of PE fiber influences on mucus production and release (Smith, 1980; Hur et al., 2016). Goblet cell abundance was assessed using AB-PAS stained slides as this stain allows for the easy identification of goblet cells. Hindgut regions were used for goblet cell counts. Goblet cells were counted per microvilli. Microvilli were selected randomly from the slide and only considered if entire and intact. Three microvilli per section were assessed and then averaged to give a section count. Three sections per individual were assessed. Assessed sections came from non-consecutive slides to ensure no duplicate counts or overlap. Five individuals per concentration were assessed for a total of 15 sections per concentration (n = 5 pools of 5 individuals).
Microvilli length and width were assessed to determine if there is a variation in the overall surface area available for nutrient absorption (Smith, 1980). Microvilli length and width measurement were assessed using AB-PAS stained slides. Hindgut regions were used for microvilli length and width measurements. Microvilli length was taken perpendicular to the intestinal membrane. Microvilli widths were taken at the widest points of the microvilli. Microvilli were selected based on the microvilli selected for the goblet cell abundance measurement; microvilli counted for goblet cells were also measured for length and width. The same sections used for goblet cell abundance were used for microvilli length and width assessment. Three microvilli per section of individual were assessed and then averaged to give a section count. Three sections per individual were assessed. Five individuals per concentration were assessed for a total of 15 sections per concentration (n = 5 pools of 5 individuals).
Condition Assessment
The assessment of growth and condition provide insights on the nutritional status and the fish’s overall health. Fulton’s condition factor (K) was measured to assess fish fitness and condition (Froese, 2006). Factor equation, , where K is the coefficient of condition factor, W is the body weight of the fish, and L is the standard length of the fish (Fulton, 1904). This index is a non-invasive biomarker used for the overall assessment of fish health. Each individual was measured before dissection (n = 5 pools of 45 individuals per replicate). A fish’s condition indicates the overall energy of the fish available for growth, feeding, reproduction, and other activities. With molecular and histomorphological analysis, the assessment of growth and condition will provide evidence of microplastic ingestion effects on fish health.
Data Analysis
Unless otherwise specified, R Studio and R version 4.0.3 were used to analyze all data (R Core Team, 2020). Data are presented as means ± standard deviation. Data were tested for homogeneity of variances and normality using the Shapiro–Wilk’s method. All comparisons were made between the control group and the experimental groups. P-values < 0.05 were considered significant for all analysis. A one-way A nested analysis of variances (ANOVA) was used for analysis of RT-qPCR data (n = 5 replicates/pools of 5 individuals per concentration). If significant differences were present, a TukeyHSD post-hoc test was performed to identify significant differences. ANOVA was used for long-term retention assessment (n = 5 replicates/pools of 10 individuals per concentration), GIT histomorphometric analysis (n = 5 replicates/pools of 5 individuals per concentration), and fish condition assessment (n = 5 replicates/pools of 45 individuals per concentration). To identify differences of the GIT microbiota, pairwise Wilcoxon rank-sum tests were performed with a Benjamini and Hochberg correction (PW+BH) to control for false discovery rates during multiple comparisons (Benjamini and Hochberg, 1995). Pairwise permutational multivariate analysis of variance (PERMANOVA) using 9,999 permutations and a Benjamini and Hochberg correction (Benjamini and Hochberg, 1995) was used to test for significant differences in microbial community structure using the “vegan” (Oksanen et al., 2019) and “pairwiseAdonis” (Arbizu, 2017) packages. To ensure PERMANOVA results were not solely the result of unequal dispersion of variability between groups, permutational analyses of dispersion (PERMDISP) using 9,999 permutations were conducted for all PERMANOVA comparisons with the “vegan” package in R.
Results
Microplastic Fiber Long-Term Retention
In comparison to a 1-h short-term exposure retention experiment (Supplementary Figures 2, 3), chronic PE fiber exposure resulted in an extended fiber retention time in the GIT for both larval and juvenile medaka. Larvae exposed to both 3 fibers/fish/day (p = 0.0168) and 6 fibers/fish/day (p = 0.0000) retained significantly more fibers in the GIT compared to the control group (Figure 3A). The data indicated a non-significant increase of microplastic fibers in the GITs for 1.5 fibers/fish/day and 3 fibers/fish/day exposed larvae. In the juvenile group, microplastic fiber retention was significantly increased in individuals exposed to 3 fibers/fish/day (p = 0.0249) and 6 fibers/fish/day (p = 0.0249) (Figure 3B) compared to the control.
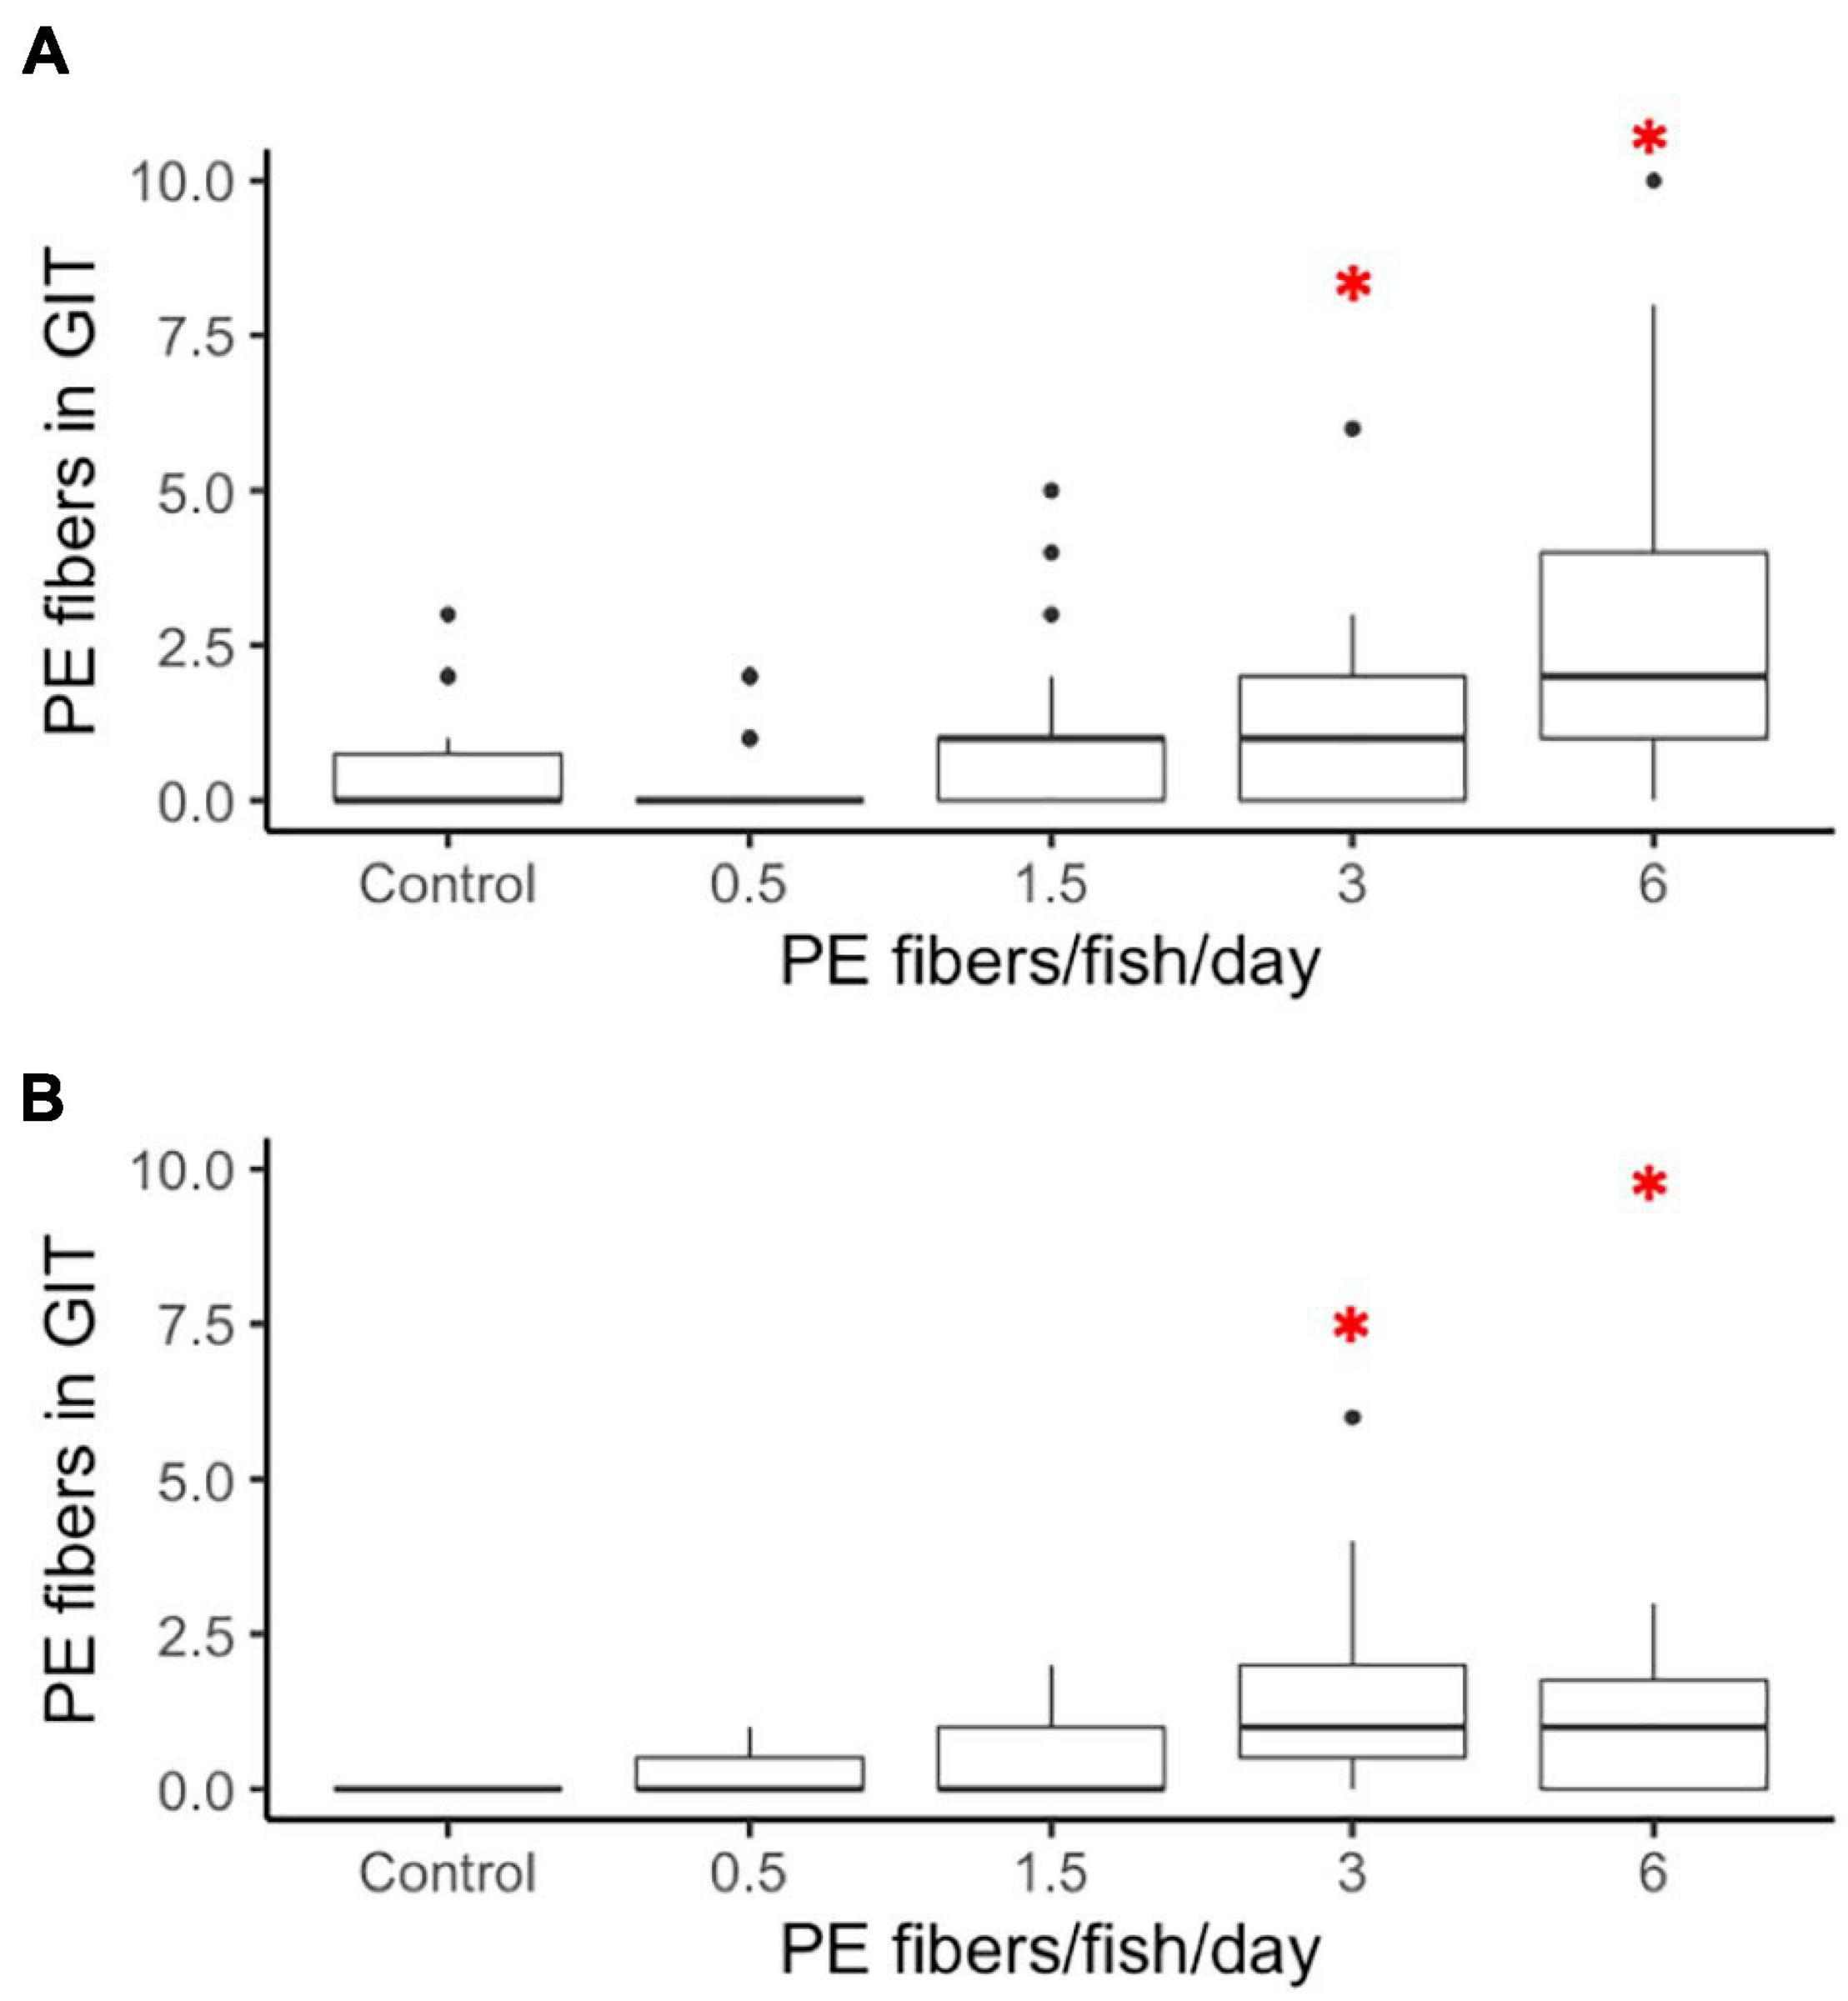
Figure 3. Long term retention of PE fibers in (A) larvae and (B) juveniles O. latipes after 21 days of exposure to control (0), 0.5, 1.5, 3, and 6 fibers/fish per day. Red stars indicate significant differences revealed by a nested ANOVA, ∗p < 0.05, n = 5.
Microbiota Analysis
Microbiota analysis was performed by comparing the top seven most abundant phyla present in both larval and juvenile fish exposed to 0, 1.5, and 3 PE fibers/fish/day. Although no statistically significant differences found on the phyla level in either larval (Figure 4A) or juvenile fish (Figure 4B), a shift of the phyla Proteobacteria and Bacteroidetes was observed. Upon PE fiber exposures, proteobacteria abundance was either decreased (larvae) or increased (juveniles), which could be attributed to a significant reduction of the Xanthobacteraceae family in the larvae (Figure 4C) and a significant increase of the Hyphomicrobium family in the order Rhizobiales in juvenile fish exposed to 3 PE fibers/fish/day (Figure 4D). Within the Bacteroidetes phyla, an increase, although not statistically significant, of the genus Flavobacterium may account for the PE fiber exposure-induced increase on the phyla level in larval fish, but not in juveniles (Figure 4E). It is noteworthy, that non-monotonous dose-response patterns were observed in the GIT microbiota composition of juvenile fish for the phyla Planctomycetes, Fusobacteria, and Actinobacteria. PERMANOVA analysis assessing microbial community structures did not show any significant differences between the microplastic exposure concentrations and the control (Supplementary Figure 4).
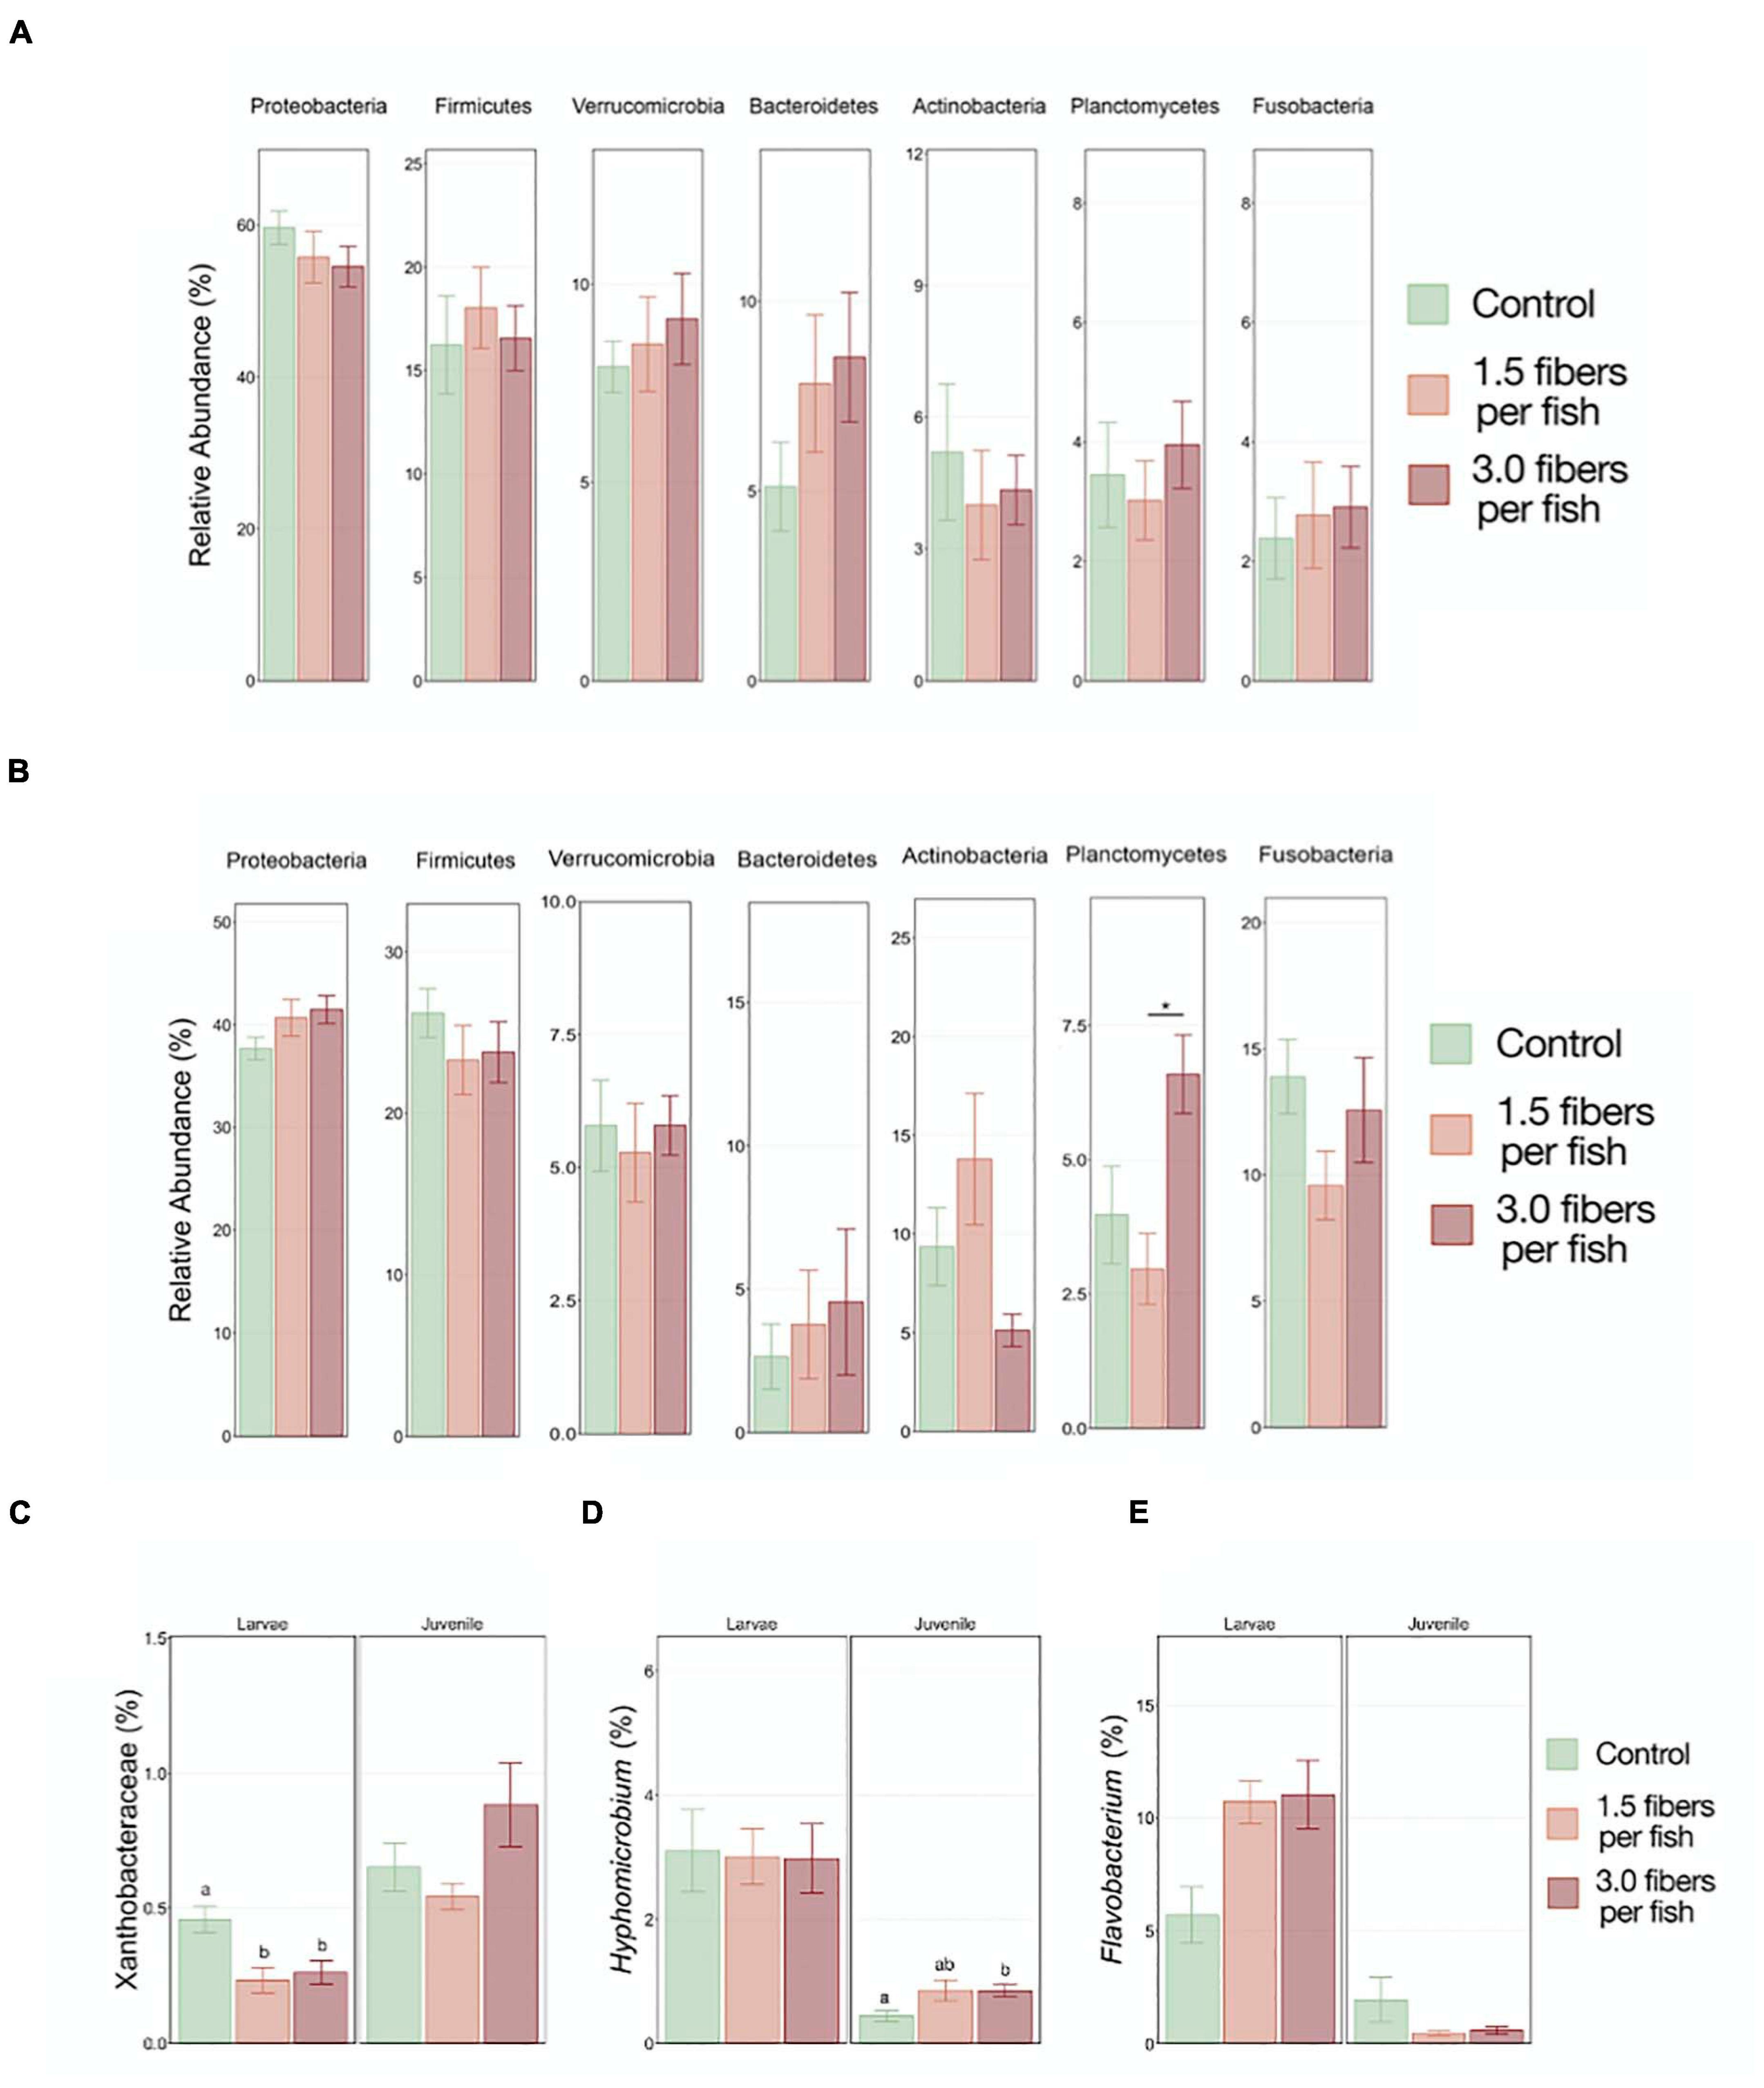
Figure 4. Comparison of the top seven most abundant gut microbiome phyla in larvae (A) and juvenile (B) O. latipes from the control, 1.5, and 3 fibers/fish/day exposure groups. Abundance of (C) Xanthobacteraceae (Proteobacteria), (D) Hyphomicrobium (Proteobacteria) and (E) Flavobacterium (Bacteroidetes) in larval and juvenile samples are depicted. Stars indicate statistically significant differences between treatment groups; different letters indicate statistically significant differences between control and treatment groups with (Kruskal–Wallis Test, p < 0.05; n = 4).
Impacts of PE Fiber Exposure on the Molecular Regulation of Nutrient Uptake
Polyethylene fiber-induced changes in the expression of selected molecular markers important for digestion and nutrient uptake may serve as early warning markers for adverse effects on the tissue and organism level. PE fiber exposure during the larval stage revealed non-monotonous dose responses of GLP and ISN (Figures 5A1,D1). For GLP, a reduced expression was observed in the 3 fibers/fish/day exposure concentration, while ISN expression was elevated for 1.5 and 3 fibers/fish/day exposure concentrations. Both expression levels returned to the control level at 6 fibers/fish/days exposure concentration; however, these trends were not statistically significant. The highest PE fiber concentration significantly decreased (p = 0.0151) the expression of slc6a6 (Figure 5E1). No significant differences were observed in the relative gene expression of PYY and TRP (Figures 5B1,C1).
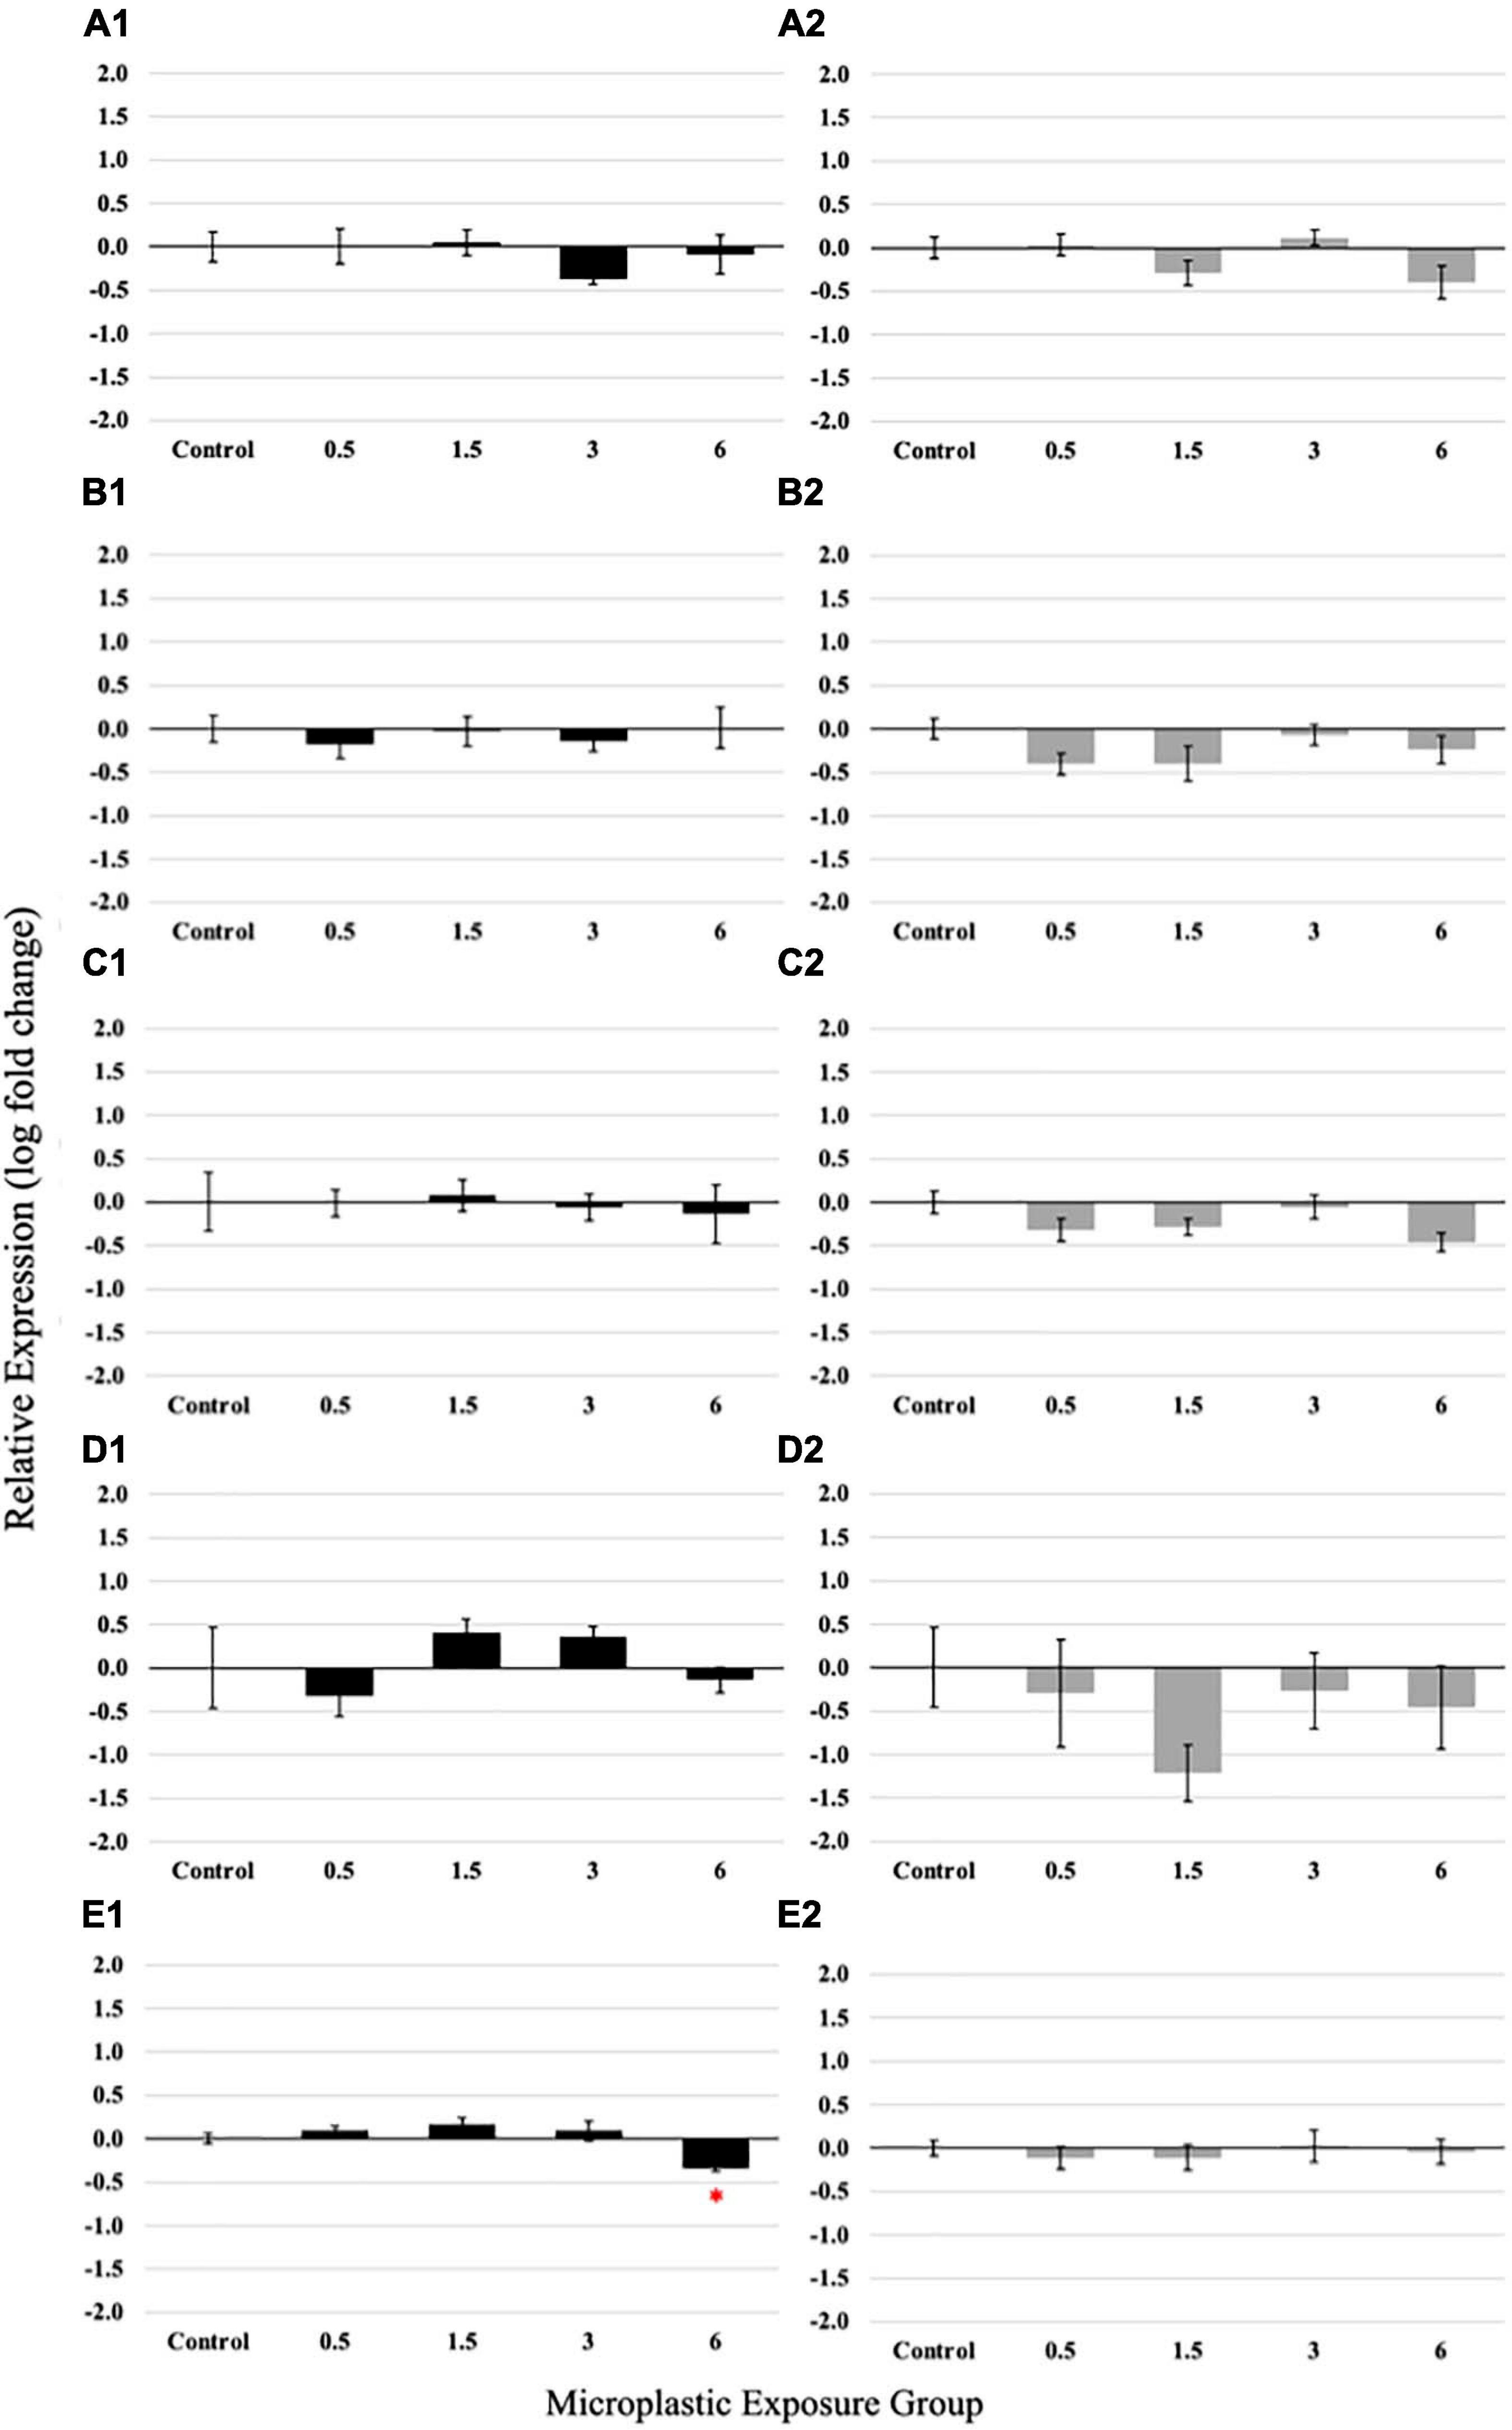
Figure 5. Relative expression of Glucagon (A1), Peptide YY (PYY) (B1), Trypsinogen (TRP) (C1), Insulin (ISN) (D1), and solute carrier family 6 member 6 (slc6a6) (E1) in larvae medaka after 21 days of exposure to 0 (control), 0.5, 1.5, 3, and 6 fibers/fish per day. Relative expression of Glucagon (A2), Peptide YY (B2), Trypsinogen (C2), Insulin (D2), and slc6a6 (E2) in juvenile medaka after 21 days of exposure to 0 (control), 0.5, 1.5, 3, and 6 fibers/fish per day. Data are presented as mean relative expression ± standard error (ANOVA, *p < 0.05, n = 5 replicates/pools of 5 individuals per concentration).
Non-monotonous dose-responses were even more prominently observed in juvenile fish exposed to PE fibers (Figures 5A2–E2); again, however, these trends were not significant. Expression of GLP, PYY, TRP, ISN, and scl6a6 showed a consistent pattern of decreased expression in the 0.5 and 1.5 PE fiber/fish/day groups, a return to control levels in 3 fibers/fish/day exposed juveniles and approximately a two-fold change decrease of the measured gene expression in juveniles exposed to 6 PE fibers/fish/day.
Impact of PE Fiber Exposure on the GIT Integrity
The PE fiber exposure regimes applied in this study did not induce inflammation of the hindgut of medaka larvae (Figure 6A1) or juveniles (Figure 6A2). All examined hindgut sections showed little to no leukocyte infiltration as indicator of inflammation. No significant changes in the mucus pH (Figures 6B1,B2), goblet cell abundance per microvilli (Figures 6C1,C2), and microvilli length and width (Figures 6D1,D2,E1,E2) were observed in either larvae or juveniles exposed to environmentally relevant levels of PE fibers. There were no variations in overall gut integrity for the larvae or juveniles (Supplementary Figures 5, 6).

Figure 6. Histologicalanalysis results from larval (A1–E1) and juvenile(A2–E2) medaka exposed to PE fibers. No significantvariation at the larval or juvenile life stage among themicroplastic concentrations compared to the control for(A1,2) inflammation, (B1,2) mucus pH, (C1,2) goblet cell abundance, (D1,2) microvillilength, or (E1,2) microvilli width. Data are displayed asmean ± standard deviation (nested ANOVA, *p < 0.05, n = 5).
Assessment of Overall Fish Condition
All fish weights and lengths (total length) were recorded after sacrifice. No significant differences were found for larvae condition factor between the exposure groups (Figure 7A). Similarly, no differences were seen in the condition factor in the juvenile fish in response to the PE fiber exposure (Figure 7B).
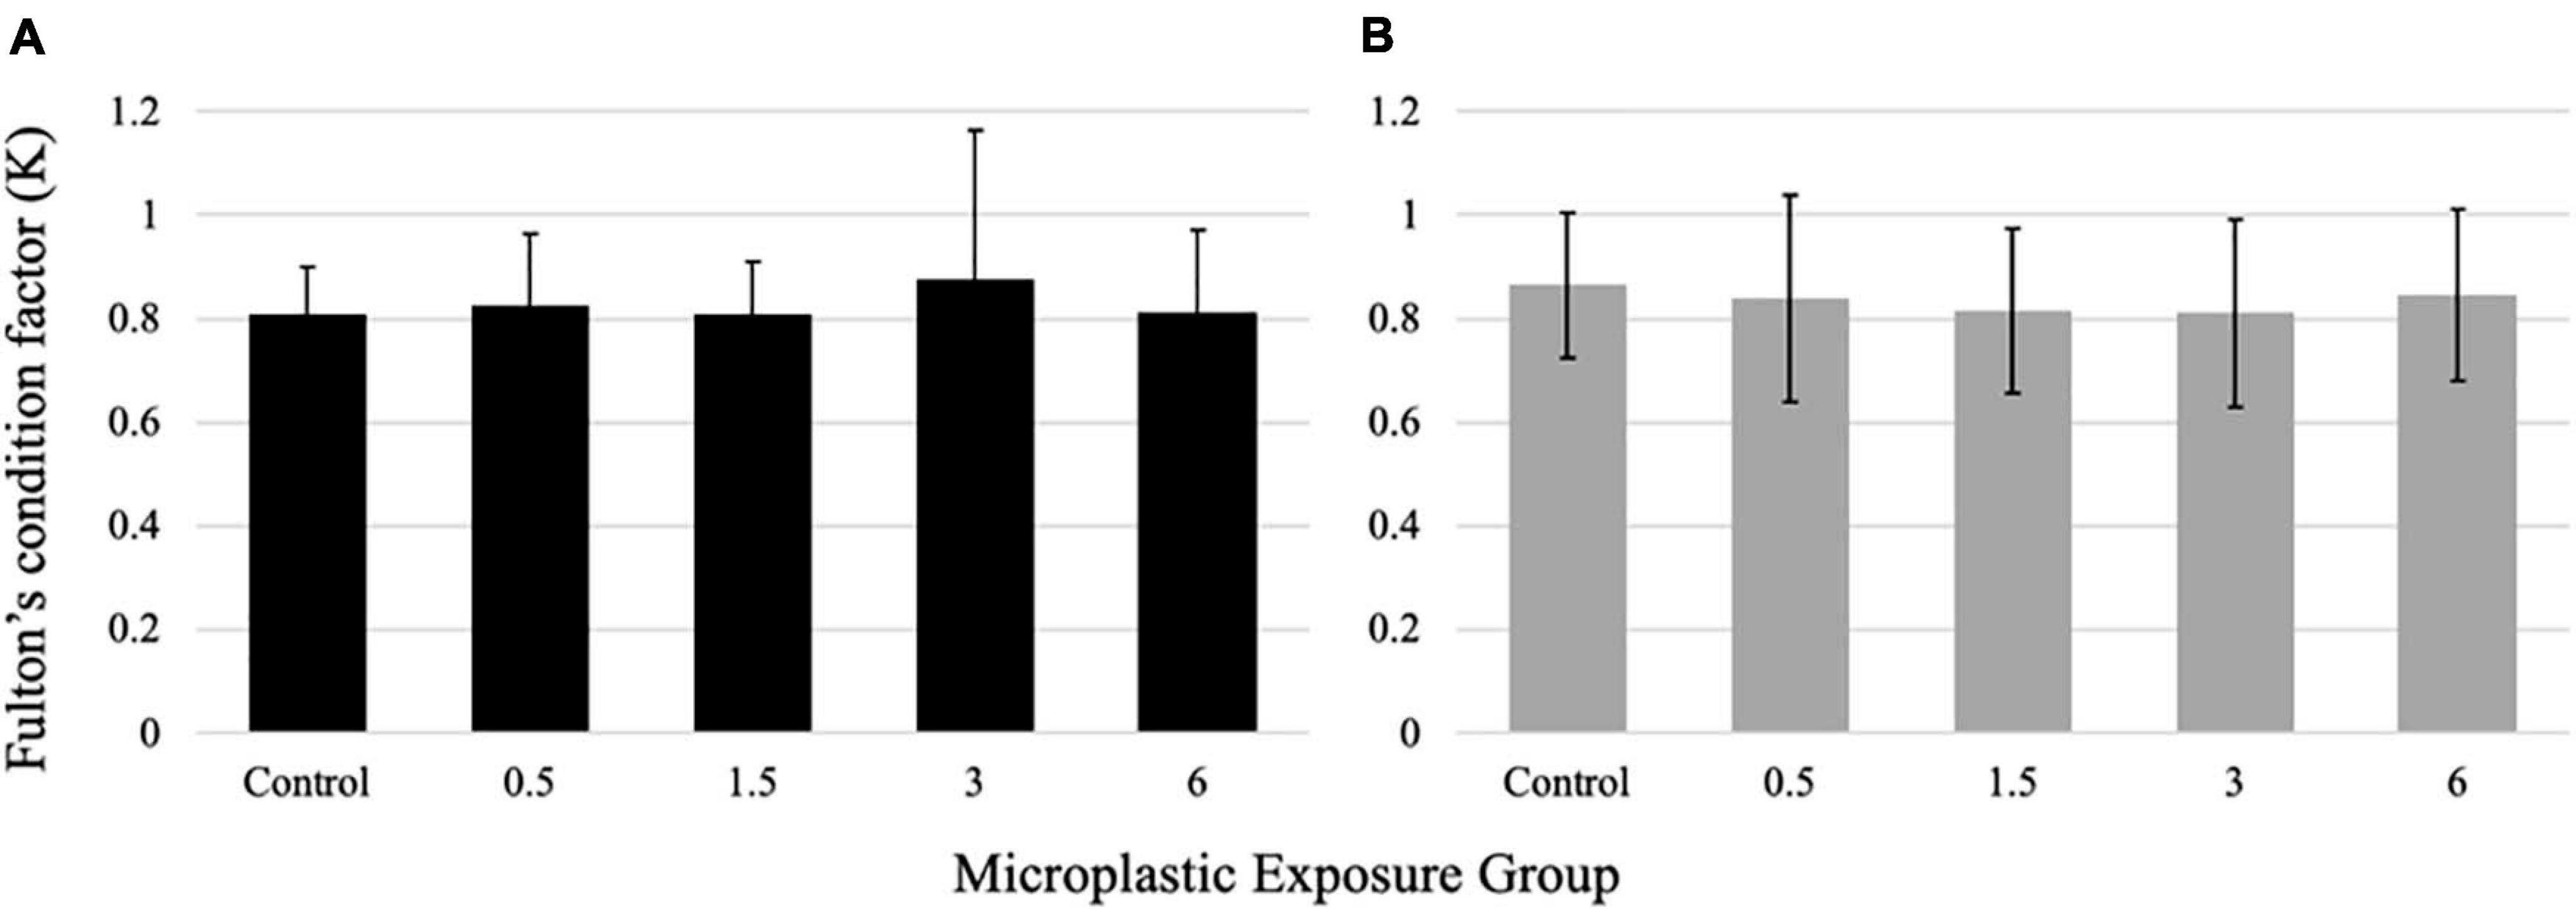
Figure 7. Fulton’s Condition Factor (K) for larval (A) and juvenile (B) medaka after 21 days of exposure to 0, 0.5,1.5, 3, and 6 fibers/fish per day. Data are displayed as mean ± standard deviation (nested ANOVA, *p < 0.05, n = 5 pools of 50 individuals).
Discussion
Chronic, low dose exposure to environmentally relevant PE fibers induced subtle changes in larval and juvenile fish health. The reported data indicate that juvenile stages are potentially more susceptible to PE fiber exposure compared to the early larval stage, as fibers were retained significantly longer in the GIT at lower concentrations (3 fibers/fish/day) and, although not statistically significant, digestive gene expression changes were more pronounced.
Polyethylene fiber exposure revealed that microplastic ingestion affects the expression of a key taurine transporter gene, slc6a6. Measurements of ISN, GLP, PYY, and TRP failed to demonstrate any statistically significant difference at the studied concentrations. While these molecular markers, which are involved in glucose metabolism, energy homeostasis, weight gain, and proteolysis, were not differentially expressed in both age groups, the taurine membrane transporter slc6a6 was significantly downregulated in the larvae exposed to the highest microplastic concentration in this study, similar to changes seen in previous studies (Murashita et al., 2009; Polakof et al., 2011; Rønnestad et al., 2013). A similar trend, but not significant, was also observed in juveniles. The primary function of slc6a6 is the transport of taurine across the cellular membrane; therefore, the downstream effect of slc6a6 downregulation is a decreased concentration of intracellular taurine (Hansen et al., 2006; Jong et al., 2012). Taurine is vital in mitochondrial function, which stabilizes mitochondria and prevents excess reactive oxygen species (ROS) leakage (Hansen et al., 2006; Jong et al., 2012; Seidel et al., 2019). Mitochondria have two primary functions, the production of energy and maintenance of cellular metabolism (Seidel et al., 2019). Oxidative stress results from an imbalance of ROS and antioxidants, controlled by mitochondria (Blier, 2014). Slc6a6 is also a solute transporter gene associated with the Nrf2 pathway. The Nrf2 pathway is a “master regulator” in antioxidant response (Hybertson et al., 2011). Since antioxidant pathways counterbalance oxidative stress, a change in the relative expression of key genes in the Nrf2 pathway could indicate oxidative stress (Ma, 2013). Slc6a6 expression is shown to be upregulated with the activation of the Nrf2 pathway indicating the observed downregulation of slc6a6 seen in this study could implicate lower activation of the Nrf2 pathway (Hiebert et al., 2018). Similar results were seen in copepods after ingestion of polystyrene beads resulting in modification of molecular expression of key genes involved in the Nrf2 pathway (Jeong et al., 2017). A study exposing fish kidney leukocytes to virgin microplastics also noted a molecular change in Nrf2 genes (Espinosa et al., 2018). The impact of PE microplastics on bivalves indicated that exposure altered the activity of antioxidant enzymes CAT and GST (Abidli et al., 2021). Similar changes were reported in Chironomus riparius (Diptera) larvae after exposure to PE microplastics; ingestion resulted in oxidative damage including the deregulation in antioxidants (Silva et al., 2021). Amphibian (Physalaemus cuvieri) exposure to PE also demonstrated increased ROS production and changes to antioxidant metabolism. Higher ROS production indicative of oxidative stress was also observed in human epithelial cells (T98G line) in response to PE microplastic exposure (Schirinzi et al., 2017). These findings collectively indicate antioxidant assessment related to oxidative stress, including enzyme activity and specific pathways like the Nrf2 pathway, are important endpoints for determining the impact of microplastic ingestion at the molecular level (Hybertson et al., 2011; Ma, 2013; Jeong et al., 2017; Abidli et al., 2021; Silva et al., 2021). Slc6a6 is also associated with colorectal adenocarcinomas, which could impact nutrient absorbance and overall fish health (Janikowska et al., 2018). Reduction in taurine could also implicate alteration to mitochondrial activity impacting energy production and metabolism (Hansen et al., 2006; Osellame et al., 2012; Seidel et al., 2019). While no significant differences were seen for the tested genes in juvenile fish, a trend of decreased expression was observed in a non-monotonous dose-response pattern, which was more prevalent than in the larvae (Araujo et al., 2020). However, the inter-individual variance and a relatively low n-value led to no statistical significance (Figures 5A2–E2) but indicating a potential threshold concentration between 3 and 6 PE fibers per day. Thus, it is hypothesized that higher exposure concentrations beyond this hormetic range may result in impaired GIT function and subsequently organism health.
Similar to polystyrene microplastic sphere exposure (O. latipes, adult and Oryzias melastigma, 3-month-old), GIT dysbiosis was observed after exposure to PE fibers at environmentally relevant concentrations comprising the phyla Proteobacteria and Bacteroidetes (Fackelmann and Sommer, 2019; Feng et al., 2020; Huang et al., 2020). PE fiber exposure oppositely modified the Proteobacteria proportion, the most abundant phylum in both larval and juvenile fish GITs. The reduction of proteobacteria in larvae may be attributed to the Xanthobacteraceae, majorly consisting of Pseudorhodoplanes, which has been similarly reported in the soil oligochaete Enchytraeus crypticus exposed to polystyrene microplastic spheres and been associated with nitrate reduction and nitrogen cycling (Oren, 2014; Zhu et al., 2018). These changes in Pseudorhodoplanes abundance were related to worm weight and reproduction changes, indicating reproduction may be a key endpoint for monitoring the effects of microplastic ingestion. However, for juveniles, an increasing abundance shift in Proteobacteria is consistent with other recent studies (Lu et al., 2018). For both, larval and juvenile samples, a trend of abundance increase paralleling the microplastic concentration was seen in Bacteroidetes, and a finding shared with Feng et al. (2020) and Zhu et al. (2018) upon polystyrene sphere exposure in adult medaka and oligochaetes. Bacteroidetes families, specifically Flavobacteriaceae, have been associated with biofilm development on microplastics, thus indicating the shift in microbiota composition observed in these studies may be due to the ingestion of microplastic surface biofilms (Pinto et al., 2019). Both, Proteobacteria and Bacteroidetes are microbial species known to colonize microplastic surfaces (Tu et al., 2020). Microbiota communities of exposed medaka shifting toward phylum profiles associated with biofilms indicate that microplastic ingestion possibly impacts the medaka’s intestinal function in a persistent manner. Shifts in microbial communities toward the order Flavobacteriales have been shown as a progressive oxidative stress response (Lai et al., 2020). While not significant, there is an increasing trend in Flavobacterium abundance for the larvae exposed to PE fibers; thus, this could indicate a low chronic oxidative stress level in the organism, further corroborated by an observed oxidative stress response in correlation to polystyrene exposure (Feng et al., 2020). Only few studies have assessed the effects of PE exposure on microbial communities. The results presented here indicated that PE may have impacts similar to those of polystyrene on microbial community composition.
Polyethylene fiber exposure did not result in modifications on the tissue level, like inflammation, microvilli morphology, goblet cell abundance, and mucus pH. Thus, chronic PE fiber consumption at these low doses for 21 days did not induce severe impacts on GIT morphology. Previous research revealed that the size of microplastic and exposure concentration per day play a significant role in the effects of microplastic exposure (Jeong et al., 2017). Thus, it may be carefully concluded that a 4:1 fish:microplastic length ratio, as measured in field samples is not inducing GIT tissue damage. In stark contrast to our results, microplastic exposure in adult medaka resulted in significant impacts at the cellular level after histological evaluation, including inflammation and altered morphology of most gill lamella as well as increased mucous cells and secretion in the foregut; however, that study employed an exposure concentration of 10,000 fibers/L, which is nearly 100 × higher than concentrations used in this study (Hu et al., 2020).
A fish’s energy budget has three significant components: maintenance, somatic growth, and gonad growth. The energy available for growth and reproduction is determined by the energy intake minus the energy used for baseline metabolism and excretion (Forseth et al., 1994). A reduction in energy intake reduces the energy budget available for growth as baseline metabolism and excretion must be maintained to survive. A restructuration of the energy budget has been seen in oysters upon ingestion of polystyrene microbeads at 0.023 mg/L; more energy was allocated to the growth and structure than reproduction (Sussarellu et al., 2016). A study on the effect of microplastic ingestion in clams noted a two-fold reduction in energy intake a resulting in reduced energy availability for maintenance and movement (Xu et al., 2017). The PE fiber exposure in the present study did not significantly impact the larvae or juvenile energy budget, as fish growth, an apical endpoint and a significant fish health indicator, was not affected. Literature reports are contradictory regarding microplastic effects on the fish condition. While some studies indicate that microplastic ingestion can impact growth and survivability, others reported the absence of whole-organism growth effects, similar to the here reported results (Jeong et al., 2017; Karami et al., 2017; Choi et al., 2018; Jovanovic et al., 2018; Weber et al., 2018; Hu et al., 2020). A study exposing seabream to six different types of microplastics, including PE, observed no significant alteration to the exposed fish’s growth rate (Jovanovic et al., 2018). Previous research on zebrafish exposed to low-density PE noted similarly no significant changes in exposed fish’s condition factor (Karami et al., 2017). However, a study assessing the impacts of both virgin PE and PE harbored from the environment on glassfish reported a decrease in overall fish size after exposure to microplastics for 3 months at a concentration of 0.010 g/20L (Naidoo and Glassom, 2019). The discrepancy among research observations is likely due to the variation of fish species, plastic polymers, sizes of microplastics, exposure duration, and concentrations utilized. Previous research involving different sizes and shapes of microplastics has identified these factors to be crucial in determining the impact of microplastic exposure (Jeong et al., 2017; Jabeen et al., 2018).
Based on this study’s findings, there is no imminent impact of microplastic exposure on fish health at microplastic concentrations resembling the present average concentrations being ingested by larval and juvenile fish in the field (Lusher et al., 2013; Lenz et al., 2016; Beer et al., 2018). No organism level consequences were observed after exposure to PE in the present study. However, it is noted that both larval and juvenile medaka demonstrated slight molecular alterations which may be regarded as an early warning sign for potentially more severe oxidative stress damage as seen in other studies which employed higher microplastic exposure concentrations. Notwithstanding the lack of immediate, severe consequences observed in this study, the results hint toward an increased need of monitoring microplastic levels in vital spawning and nursery grounds for commercially important fish as both the larval and juvenile stages could be even more susceptible to chronic exposure and possible long-term effects.
Conclusion
Several studies have reported significant adverse effects of microplastic consumption in fish. This study examined the effect of microplastic ingestion on gene expression, gut microbiota, GIT integrity, and fish growth and condition during two early life history stages. Our results indicate PE fibers pose little imminent threat to fish health at environmentally relevant concentrations when examining growth and condition. However, this study observed potential disruption to the energy intake at the highest concentration of exposed larvae based on gene expression and microbiota composition results. While not all significant, changes in microbial communities did show a shift in microbiota composition similar to previous studies, which indicate a stress response. While the concentrations of microplastics used in this study did not cause significant alterations to the overall microbiota communities, the trend of the results demonstrated there could be significant impacts of microplastic ingestion on GIT microbiota communities, potentially leading to long-term changes in digestive function and metabolism of exposed fish. Further investigation of the molecular effects of microplastic ingestion on key genes related to the Nrf2 pathway could provide more evidence supporting the conclusion that microplastic ingestion impacts fish energy metabolism. Expanding investigated life stages to adults would allow further investigation of potential reproductive effects, including gonad morphology and selected reproductive gene expression, and may deliver more insight into the underlying mechanisms. Assessing the exposed fish’s chemical body burden would provide evidence of any potential endocrine-disrupting chemicals leakage from the administered PE fibers. Future research on the effects of common microplastics, both virgin and UV weathered, could provide more insight into microplastics’ effects in the environment impacting wild fish. Specifically, a study targeting antioxidant responses would provide more direct assessment of potential effects of microplastic consumption on oxidative stress in fish given the data provided here. Future studies involving similar relevant concentrations could provide vital evidence on the current threat microplastic pollution poses to wild fish populations.
Data Availability Statement
The raw data supporting the conclusions of this article will be made available by the authors, without undue reservation. The 16S rRNA gene sequences generated for this study can be found through BioProject PRJNA748405 at the NCBI’s Sequence Read Archive. Other raw data can be found in a GitHub repository linked in the Supplementary Material.
Ethics Statement
The animal study was reviewed and approved by Texas A&M University-Corpus Christi Institutional Animal Care and Use Committee # 05-19.
Author Contributions
ED performed experiments, data analysis, and drafting of the manuscript. LP conducted the microbiota sequencing, figure design, and data analysis. AH-H developed methodological procedures and assisted with manuscript draft. JT contributed to the conception of microbiota analysis and provided supervision as well as feedback on the manuscript draft. SG contributed experimental design and theoretical framework of the research and feedback on manuscript draft. FS provided over all experimental design and research concept, data analysis, and the manuscript draft conceptualization. All authors contributed to the article and approved the submitted version.
Funding
This research has been funded through the College of Science and Engineering, Texas A&M University-Corpus Christi, and the Texas Sea grant Grants-in-Aid of graduate research.
Conflict of Interest
The authors declare that the research was conducted in the absence of any commercial or financial relationships that could be construed as a potential conflict of interest.
Publisher’s Note
All claims expressed in this article are solely those of the authors and do not necessarily represent those of their affiliated organizations, or those of the publisher, the editors and the reviewers. Any product that may be evaluated in this article, or claim that may be made by its manufacturer, is not guaranteed or endorsed by the publisher.
Acknowledgments
The authors acknowledge the support of this research by Carol Haley providing the experimental animals and assistance with the experiments, and the John G. Shedd Molecular and Microbial Ecology Lab for performing the 16S rRNA sequencing.
Supplementary Material
The Supplementary Material for this article can be found online at: https://www.frontiersin.org/articles/10.3389/fphys.2021.668645/full#supplementary-material
References
Abidli, S., Pinheiro, M., Lahbib, Y., Neuparth, T., Santos, M. M., and El Menif, N. T. (2021). Effects of environmentally relevant levels of polyethylene microplastic on Mytilus galloprovincialis (Mollusca: Bivalvia): filtration rate and oxidative stress. Environ. Sci. Pollut. R. 28, 26643–26652. doi: 10.1007/s11356-021-12506-8
Ahrendt, C., Perez-Venegas, D., Urbina, M., Gonzalez, C., Echeveste, P., Aldana, M., et al. (2020). Microplastic ingestion cause intestinal lesions in the intertidal fish Girella laevifrons. Mar. Pollut. Bull. 2:110795. doi: 10.1016/j.marpolbul.2019.110795
Araujo, A. P. D., de Melo, N. F. S., de Oliveira, A. G., Rodrigues, F. P., Fernandes, T., Vieira, J. E. D., et al. (2020). How much are microplastics harmful to the health of amphibians? A study with pristine polyethylene microplastics and Physalaemus cuvieri. J. Hazard. Mater. 2:382.
Arbizu, P. M. (2017). pairwiseAdonis: Pairwise Multilevel Comparison Using Adonis. R Package Version 0.4.
Batterham, R. L., and Bloom, S. R. (2003). The gut hormone peptide YY regulates appetite. Ann. N. Y. Acad. Sci. 994, 162–168. doi: 10.1111/j.1749-6632.2003.tb03176.x
Beer, S., Garm, A., Huwer, B., Dierking, J., and Nielsen, T. G. (2018). No increase in marine microplastic concentration over the last three decades–A case study from the Baltic Sea. Sci. Total Environ. 621, 1272–1279. doi: 10.1016/j.scitotenv.2017.10.101
Beiras, R., Bellas, J., Cachot, J., Cormier, B., Cousin, X., Engwall, M., et al. (2018). Ingestion and contact with polyethylene microplastics does not cause acute toxicity on marine zooplankton. J. Hazard. Mater. 360, 452–460. doi: 10.1016/j.jhazmat.2018.07.101
Benjamini, Y., and Hochberg, Y. (1995). Controlling the false discovery rate: a practical and powerful approach to multiple testing. J. R. Statist. Soc. 57, 289–300. doi: 10.1111/j.2517-6161.1995.tb02031.x
Browne, R., Dissanayake, A., Galloway, T., Lowe, D., and Thompson, R. (2008). Ingested microscopic plastic translocates to the circulatory system of mussel, Mytilus edulis (L.). Environ. Sci. Technol. 42, 5026–5031. doi: 10.1021/es800249a
Butt, R. L., and Volkoff, H. (2019). Gut microbiota and energy homeostasis in fish. Front. Endocrinol. (Lausanne) 10:9.
Callahan, B. J., McMurdie, P. J., Rosen, M. J., Han, A. W., Johnson, A. J., and Holmes, S. P. (2016). DADA2: High-resolution sample inference from Illumina amplicon data. Nat. Methods 13, 581–583. doi: 10.1038/nmeth.3869
Caporaso, J. G., Kuczynski, J., Stombaugh, J., Bittinger, K., Bushman, F. D., Costello, E. K., et al. (2010). QIIME allows analysis of high-throughput community sequencing data. Nat. Methods 7, 335–336.
Chen, J., Bittinger, K., Charlson, E. S., Hoffmann, C., Lewis, J., Wu, G. D., et al. (2012). Associating microbiome composition with environmental covariates using generalized UniFrac distances. Bioinformatics 28, 2106–2113. doi: 10.1093/bioinformatics/bts342
Choi, J. S., Jung, Y. J., Hong, N. H., Hong, S. H., and Park, J. W. (2018). Toxicological effects of irregularly shaped and spherical microplastics in a marine teleost, the sheepshead minnow (Cyprinodon variegatus). Mar. Pollut. Bull. 129, 231–240. doi: 10.1016/j.marpolbul.2018.02.039
Cole, M., Lindeque, P. K., Fileman, E., Clark, J., Lewis, C., Halsband, C., et al. (2016). Microplastics alter the properties and sinking rates of zooplankton faecal pellets. Environ. Sci. Technol. 50, 3239–3246. doi: 10.1021/acs.est.5b05905
Cole, M., Lindeque, P., Fileman, E., Halsband, C., Goodhead, R., Moger, J., et al. (2013). Microplastic ingestion by zooplankton. Environ. Sci. Technol. 47, 6646–6655. doi: 10.1021/es400663f
Cole, M., Lindeque, P., Halsband, C., and Galloway, T. S. (2011). Microplastics as contaminants in the marine environment: a review. Mar. Pollut. Bull. 62, 2588–2597. doi: 10.1016/j.marpolbul.2011.09.025
Costa, M. C., and Weese, J. S. (2018). Understanding the intestinal microbiome in health and disease. Vet. Clin. North Am. Equine Pract. 34, 1–12. doi: 10.1007/978-3-319-90545-7_1
de Sa, L. C., Oliveira, M., Ribeiro, F., Rocha, T. L., and Futter, M. N. (2018). Studies of the effects of microplastics on aquatic organisms: what do we know and where should we focus our efforts in the future? Sci. Total Environ. 645, 1029–1039. doi: 10.1016/j.scitotenv.2018.07.207
Deudero, S., and Alomar, C. (2015). Mediterranean marine biodiversity under threat: Reviewing influence of marine litter on species. Mar. Pollut. Bull. 98, 58–68. doi: 10.1016/j.marpolbul.2015.07.012
DiBona, E. R. (2020). Effects of microplastic pollution on fish health using Japanese Medaka as a model. College of Science and Engineering Theses and Dissertations Theses: Texas A&M University - Corpus Christi.
Espinosa, C., Garcia Beltran, J. M., Esteban, M. A., and Cuesta, A. (2018). In vitro effects of virgin microplastics on fish head-kidney leucocyte activities. Environ. Pollut. 235, 30–38. doi: 10.1016/j.envpol.2017.12.054
Fackelmann, G., and Sommer, S. (2019). Microplastics and the gut microbiome: how chronically exposed species may suffer from gut dysbiosis. Mar. Pollut. Bull. 143, 193–203. doi: 10.1016/j.marpolbul.2019.04.030
Feng, Z., Wang, R., Zhang, T., Wang, J., Huang, W., Li, J., et al. (2020). Microplastics in specific tissues of wild sea urchins along the coastal areas of northern China. Sci. Total Environ. 728:138660. doi: 10.1016/j.scitotenv.2020.138660
Forseth, T., Ugedal, O., and Jonsson, B. (1994). The energy budget, niche shift, reproduction and growth in a population of arctic charr, Salvelinus alpinus. J. Anim. Ecol. 63:1.
Froese, R. (2006). Cube law, condition factor and weight-length relationships: history, meta-analysis and recommendations. J. Appl. Ichthyol. 22, 241–253.
Granby, K., Rainieri, S., Rasmussen, R. R., Kotterman, M. J. J., Sloth, J. J., Cederberg, T. L., et al. (2018). The influence of microplastics and halogenated contaminants in feed on toxicokinetics and gene expression in European seabass (Dicentrarchus labrax). Environ. Res. 164, 430–443. doi: 10.1016/j.envres.2018.02.035
Hajovsky, P. A. (2019). Microplastic ingestion of juvenile fish in Corpus Christi bay and upper Laguna Madre, Texas. College of Science and Engineering Theses and Dissertations Theses: Texas A&M Univerisity – Corpus Christi.
Hansen, S. H., Anderson, M. L., Birkedal, H., Cornett, C., and Wibrand, F. (2006). The important role of taurine in oxidative metabolism. Taurine 6 Adv. Exp. Med. Biol. 583, 129–135. doi: 10.1007/978-0-387-33504-9_13
Hiebert, P., Wietecha, M. S., Cangkrama, M., Haertel, E., Mavrogonatou, E., Stumpe, M., et al. (2018). Nrf2-mediated fibroblast reprogramming drives cellular senescence by targeting the matrisome. Dev. Cell 46, 145–61.e10.
Holzer, P., Reichmann, F., and Farzi, A. (2012). Neuropeptide Y, peptide YY and pancreatic polypeptide in the gut-brain axis. Neuropeptides. 46, 261–274. doi: 10.1016/j.npep.2012.08.005
Hu, L., Chernick, M., Lewis, A. M., Ferguson, P. L., and Hinton, D. E. (2020). Chronic microfiber exposure in adult Japanese medaka (Oryzias latipes). PLoS One 15:e0229962. doi: 10.1371/journal.pone.0229962
Huang, J. N., Wen, B., Zhu, J. G., Zhang, Y. S., Gao, J. Z., and Chen, Z. Z. (2020). Exposure to microplastics impairs digestive performance, stimulates immune response and induces microbiota dysbiosis in the gut of juvenile guppy (Poecilia reticulata). Sci. Total Environ. 733:138929. doi: 10.1016/j.scitotenv.2020.138929
Hur, S. W., Kim, S. K., Kim, D. J., Lee, B. I., Park, S. J., Hwang, H. G., et al. (2016). Digestive physiological characteristics of the gobiidae:–characteristics of CCK-producing cells and mucus-secreting goblet cells of stomach fish and stomachless fish. Dev. Reprod. 20, 207–217.
Hybertson, B. M., Gao, B., Bose, S. K., and McCord, J. M. (2011). Oxidative stress in health and disease: the therapeutic potential of Nrf2 activation. Mol. Aspects Med. 32, 234–246. doi: 10.1016/j.mam.2011.10.006
Jabeen, K., Li, B., Chen, Q., Su, L., Wu, C., Hollert, H., et al. (2018). Effects of virgin microplastics on goldfish (Carassius auratus). Chemosphere 213, 323–332. doi: 10.1016/j.chemosphere.2018.09.031
Janikowska, G., Janikowska, T., Pyka-Pajak, A., Mazurek, U., Janikowski, M., Gonciarz, M., et al. (2018). Potential biomarkers for the early diagnosis of colorectal adenocarcinoma-transcriptomic analysis of four clinical stages. Cancer Biomark. 22, 88–99.
Jeong, C. B., Kang, H. M., Lee, M. C., Kim, D. H., Han, J., Hwang, D. S., et al. (2017). Adverse effects of microplastics and oxidative stress-induced MAPK/Nrf2 pathway-mediated defense mechanisms in the marine copepod Paracyclopina nana. Sci. Rep. 7:41323.
Jin, Y., Xia, J., Pan, Z., Yang, J., Wang, W., and Fu, Z. (2018). Polystyrene microplastics induce microbiota dysbiosis and inflammation in the gut of adult zebrafish. Environ. Pollut. 235, 322–329. doi: 10.1016/j.envpol.2017.12.088
Jong, C. J., Azuma, J., and Schaffer, S. (2012). Mechanism underlying the antioxidant activity of taurine: prevention of mitochondrial oxidant production. Amino Acids 42, 2223–2232. doi: 10.1007/s00726-011-0962-7
Jovanovic, B., Gokdag, K., Guven, O., Emre, Y., Whitley, E. M., and Kideys, A. E. (2018). Virgin microplastics are not causing imminent harm to fish after dietary exposure. Mar. Pollut. Bull. 130, 123–131. doi: 10.1016/j.marpolbul.2018.03.016
Karami, A., Groman, D. B., Wilson, S. P., Ismail, P., and Neela, V. K. (2017). Biomarker responses in zebrafish (Danio rerio) larvae exposed to pristine low-density polyethylene fragments. Environ. Pollut. 223, 466–475. doi: 10.1016/j.envpol.2017.01.047
Kinoshita, M., Murata, K., Naruse, K., and Tanaka, M. (2009). Medaka: Biology, Management, and Experimental Protocols. Hoboken, NJ: John Wiley & Sons.
Lai, K. P., Lin, X., Tam, N., Ho, J. C. H., Wong, M. K., Gu, J., et al. (2020). Osmotic stress induces gut microbiota community shift in fish. Environ. Microbiol. 22, 3784–3802. doi: 10.1111/1462-2920.15150
Lenz, R., Enders, K., and Nielsen, T. G. (2016). Microplastic exposure studies should be environmentally realistic. Proc. Natl. Acad. Sci. U.S.A. 113, E4121–E4122.
Lozupone, C., Lladser, M. E., Knights, D., Stombaugh, J., and Knight, R. (2011). UniFrac: an effective distance metric for microbial community comparison. ISME J. 5, 169–172. doi: 10.1038/ismej.2010.133
Lu, L., Wan, Z., Luo, T., Fu, Z., and Jin, Y. (2018). Polystyrene microplastics induce gut microbiota dysbiosis and hepatic lipid metabolism disorder in mice. Sci. Total Environ. 631–632, 449–458. doi: 10.1016/j.scitotenv.2018.03.051
Lusher, A. L., McHugh, M., and Thompson, R. C. (2013). Occurrence of microplastics in the gastrointestinal tract of pelagic and demersal fish from the English Channel. Mar. Pollut. Bull. 67, 94–99. doi: 10.1016/j.marpolbul.2012.11.028
Lusher, A. L., Welden, N. A., Sobral, P., and Cole, M. (2017). Sampling, isolating and identifying microplastics ingested by fish and invertebrates. Anal. Methods 9, 1346–1360. doi: 10.1039/c6ay02415g
Ma, Q. (2013). Role of nrf2 in oxidative stress and toxicity. Annu. Rev. Pharmacol. Toxicol. 53, 401–426. doi: 10.1146/annurev-pharmtox-011112-140320
Masura, J., Baker, J., Foster, G., Arthur, C., and Herring, C. (2015). Laboratory Methods for the Analysis of Microplastics in the Marine Environment: Recommendations for Quantifying Synthetic Particles in Water and Sediments. NOAA Technical Memorandum NOS-OR&R-48. Washington, DC: NOAA.
McMurdie, P. J., and Holmes, S. (2013). phyloseq: an R package for reproducible interactive analysis and graphics of microbiome census data. PLoS One 8:e61217. doi: 10.1371/journal.pone.0061217
Mumford, S., Heidel, J., Smith, C., Morrison, J., MacConnell, B., and Blazer, V. (2007). Fish Histology and Histopathology. Shepherdstown, WV: USFWS-NCTC.
Murashita, K., Kurokawa, T., Nilsen, T. O., and Ronnestad, I. (2009). Ghrelin, cholecystokinin, and peptide YY in Atlantic salmon (Salmo salar): molecular cloning and tissue expression. Gen. Comp. Endocrinol. 160, 223–235. doi: 10.1016/j.ygcen.2008.11.024
Naidoo, T., and Glassom, D. (2019). Decreased growth and survival in small juvenile fish, after chronic exposure to environmentally relevant concentrations of microplastic. Mar. Pollut. Bull. 145, 254–259. doi: 10.1016/j.marpolbul.2019.02.037
Nelson, L. E., and Sheridan, M. A. (2006). Gastroenteropancreatic hormones and metabolism in fish. Gen. Comp. Endocrinol. 148, 116–124. doi: 10.1016/j.ygcen.2006.01.011
Oksanen, J., Blanchet, F. G., Friendly, M., Kindt, R., Legendre, P., McGlinn, D., et al. (2019). vegan: Community Ecology Package. R Package Version 2.5-5 ed. Available online at: https://CRAN.R-project.org/package=vegan (accessed July 21, 2021).
Oren, A. (2014). Taxonomy of halophilic Archaea: current status and future challenges. Extremophiles 18, 825–834. doi: 10.1007/s00792-014-0654-9
Osellame, L. D., Blacker, T. S., and Duchen, M. R. (2012). Cellular and molecular mechanisms of mitochondrial function. Best Pract. Res. Clin. Endocrinol. Metab. 26, 711–723. doi: 10.1016/j.beem.2012.05.003
Pannetier, P., Morin, B., Le Bihanic, F., Dubreil, L., Clerandeau, C., Chouvellon, F., et al. (2020). Environmental samples of microplastics induce significant toxic effects in fish larvae. Environ. Int. 134:105047. doi: 10.1016/j.envint.2019.105047
Peda, C., Caccamo, L., Fossi, M. C., Gai, F., Andaloro, F., Genovese, L., et al. (2016). Intestinal alterations in European sea bass Dicentrarchus labrax (Linnaeus, 1758) exposed to microplastics: preliminary results. Environ. Pollut. 212, 251–256. doi: 10.1016/j.envpol.2016.01.083
Pinto, M., Langer, T. M., Huffer, T., Hofmann, T., and Herndl, G. J. (2019). The composition of bacterial communities associated with plastic biofilms differs between different polymers and stages of biofilm succession. PLoS One 14:e0217165. doi: 10.1371/journal.pone.0217165
Pirc, U., Vidmar, M., Mozer, A., and Krzan, A. (2016). Emissions of microplastic fibers from microfiber fleece during domestic washing. Environ. Sci. Pollut. Res. Int. 23, 22206–22211. doi: 10.1007/s11356-016-7703-0
Polakof, S., Mommsen, T. P., and Soengas, J. L. (2011). Glucosensing and glucose homeostasis: from fish to mammals. Comp. Biochem. Physiol. B Biochem. Mol. Biol. 160, 123–149. doi: 10.1016/j.cbpb.2011.07.006
Polakof, S., Panserat, S., Soengas, J. L., and Moon, T. W. (2012). Glucose metabolism in fish: a review. J. Comp. Physiol. B 182, 1015–1045. doi: 10.1007/s00360-012-0658-7
Qiao, R., Deng, Y., Zhang, S., Wolosker, M. B., Zhu, Q., Ren, H., et al. (2019). Accumulation of different shapes of microplastics initiates intestinal injury and gut microbiota dysbiosis in the gut of zebrafish. Chemosphere. 236:124334. doi: 10.1016/j.chemosphere.2019.07.065
Quast, C., Pruesse, E., Yilmaz, P., Gerken, J., Schweer, T., Yarza, P., et al. (2013). The SILVA ribosomal RNA gene database project: improved data processing and web-based tools. Nucleic Acids Res. 41, D590–D596.
R Core Team (2020). R: A language and environment for statistical computing. Available from: http://www.R-project.org/ (Accessed July 21, 2021).
Romeo, T., Pietro, B., Peda, C., Consoli, P., Andaloro, F., and Fossi, M. C. (2015). First evidence of presence of plastic debris in stomach of large pelagic fish in the Mediterranean Sea. Mar. Pollut. Bull. 95, 358–361. doi: 10.1016/j.marpolbul.2015.04.048
Rønnestad, I., Yúfera, M., Ueberschär, B., Ribeiro, L., and Saele, Ø, and Boglione, C. (2013). Feeding behaviour and digestive physiology in larval fish: current knowledge, and gaps and bottlenecks in research. Rev. Aquacult. 5, S59–S98.
Rungruangsak-Torrissen, K., Moss, R., Andresen, L. H., Berg, A., and Waagbo, R. (2006). Different expressions of trypsin and chymotrypsin in relation to growth in Atlantic salmon (Salmo salar L.). Fish Physiol. Biochem. 32, 7–23. doi: 10.1007/s10695-005-0630-5
Schindelin, J., Arganda-Carreras, I., Frise, E., Kaynig, V., Longair, M., Pietzsch, T., et al. (2012). Fiji: an open-source platform for biological-image analysis. Nat. Methods 9, 676–682. doi: 10.1038/nmeth.2019
Schirinzi, G. F., Perez-Pomeda, I., Sanchis, J., Rossini, C., Farre, M., and Barcelo, D. (2017). Cytotoxic effects of commonly used nanomaterials and microplastics on cerebral and epithelial human cells. Environ. Res. 159, 579–587. doi: 10.1016/j.envres.2017.08.043
Seidel, U., Huebbe, P., and Rimbach, G. (2019). Taurine: a regulator of cellular redox homeostasis and skeletal muscle function. Mol. Nutr. Food Res. 63:e1800569.
Silva, C. J. M., Silva, A. L. P., Campos, D., Machado, A. L., Pestana, J. L. T., and Gravato, C. (2021). Oxidative damage and decreased aerobic energy production due to ingestion of polyethylene microplastics by Chironomus riparius (Diptera) larvae. J. Hazard. Mater. 2:402.
Smith, L. S. (1980). Fish Feed Technology: Digestion in Telesot Fishes. Rome: Food and Agriculture Organization.
Solomando, A., Capo, X., Alomar, C., Alvarez, E., Compa, M., Valencia, J. M., et al. (2020). Long-term exposure to microplastics induces oxidative stress and a pro-inflammatory response in the gut of Sparus aurata Linnaeus, 1758. Environ. Pollut. 266(Pt 1):115295. doi: 10.1016/j.envpol.2020.115295
Sussarellu, R., Suquet, M., Thomas, Y., Lambert, C., Fabioux, C., Pernet, M. E., et al. (2016). Oyster reproduction is affected by exposure to polystyrene microplastics. Proc. Natl. Acad. Sci. U.S.A. 113, 2430–2435. doi: 10.1073/pnas.1519019113
Sylvian, F. E., Cheaib, B., Llewellyn, M., Correia, T. G., Fagundes, D. B., Val, A. L., et al. (2016). pH drop impacts differentially skin and gut microbiota of the Amazonian fish tambaqui (Colossoma macropomum). Sci. Rep. 6:32032.
Tu, C., Chen, T., Zhou, Q., Liu, Y., Wei, J., Waniek, J. J., et al. (2020). Biofilm formation and its influences on the properties of microplastics as affected by exposure time and depth in the seawater. Sci. Total Environ. 734:139237. doi: 10.1016/j.scitotenv.2020.139237
Walters, W., Hyde, E. R., Berg-Lyons, D., Ackermann, G., Humphrey, G., Parada, A., et al. (2016). Improved bacterial 16S rRNA Gene (V4 and V4-5) and fungal internal transcribed spacer marker gene primers for microbial community surveys. mSystems 1:e00009-15.
Weber, A., Scherer, C., Brennholt, N., Reifferscheid, G., and Wagner, M. (2018). PET microplastics do not negatively affect the survival, development, metabolism and feeding activity of the freshwater invertebrate Gammarus pulex. Environ. Pollut. 234, 181–189. doi: 10.1016/j.envpol.2017.11.014
Xie, F. L., Xiao, P., Chen, D. L., Xu, L., and Zhang, B. H. (2012). miRDeepFinder: a miRNA analysis tool for deep sequencing of plant small RNAs. Plant Mol. Biol. 80, 75–84. doi: 10.1007/s11103-012-9885-2
Xu, X. Y., Lee, W. T., Chan, A. K. Y., Lo, H. S., Shin, P. K. S., and Cheung, S. G. (2017). Microplastic ingestion reduces energy intake in the clam Atactodea striata. Mar. Pollut. Bull. 124, 798–802. doi: 10.1016/j.marpolbul.2016.12.027
Zhang, Y., Wolosker, M. B., Zhao, Y., Ren, H., and Lemos, B. (2020). Exposure to microplastics cause gut damage, locomotor dysfunction, epigenetic silencing, and aggravate cadmium (Cd) toxicity in Drosophila. Sci. Total Environ. 744:140979. doi: 10.1016/j.scitotenv.2020.140979
Zhang, Z. B., and Hu, J. Y. (2007). Development and validation of endogenous reference genes for expression profiling of medaka (Oryzias latipes) exposed to endocrine disrupting chemicals by quantitative real-time RT-PCR. Toxicol Sci. 95, 356–368. doi: 10.1093/toxsci/kfl161
Keywords: microplastic, pollution, fish, toxicology, fiber, development
Citation: DiBona E, Pinnell LJ, Heising-Huang A, Geist S, Turner JW and Seemann F (2021) A Holistic Assessment of Polyethylene Fiber Ingestion in Larval and Juvenile Japanese Medaka Fish. Front. Physiol. 12:668645. doi: 10.3389/fphys.2021.668645
Received: 16 February 2021; Accepted: 13 July 2021;
Published: 04 August 2021.
Edited by:
Guangxu Liu, Zhejiang University, ChinaReviewed by:
Dariel Tovar-Ramírez, Centro de Investigación Biológica del Noroeste (CIBNOR), MexicoJia-Song Zhang, South China Sea Fisheries Research Institute, Chinese Academy of Fishery Sciences (CAFS), China
Copyright © 2021 DiBona, Pinnell, Heising-Huang, Geist, Turner and Seemann. This is an open-access article distributed under the terms of the Creative Commons Attribution License (CC BY). The use, distribution or reproduction in other forums is permitted, provided the original author(s) and the copyright owner(s) are credited and that the original publication in this journal is cited, in accordance with accepted academic practice. No use, distribution or reproduction is permitted which does not comply with these terms.
*Correspondence: Frauke Seemann, ZnJhdWtlLnNlZW1hbm5AdGFtdWNjLmVkdQ==