 Inseok HwangZe Jin
 Je-Wook Park
 Oh-Seok KwonByounghyun LimMyunghee HongMin KimHee-Tae YuTae-Hoon Kim
 Jae-Sun UhmBoyoung JoungMoon-Hyoung Lee
 Hui-Nam Pak*
- Yonsei University Health System, Seoul, South Korea
Background: The efficacy of antiarrhythmic drugs (AAD) can vary in patients with atrial fibrillation (AF), and the PITX2 gene affects the responsiveness of AADs. We explored the virtual AAD (V-AAD) responses between wild-type and PITX2+/−-deficient AF conditions by realistic in silico AF modeling.
Methods: We tested the V-AADs in AF modeling integrated with patients' 3D-computed tomography and 3D-electroanatomical mapping, acquired in 25 patients (68% male, 59.8 ± 9.8 years old, 32.0% paroxysmal type). The ion currents for the PITX2+/− deficiency and each AAD (amiodarone, sotalol, dronedarone, flecainide, and propafenone) were defined based on previous publications.
Results: We compared the wild-type and PITX2+/− deficiency in terms of the action potential duration (APD90), conduction velocity (CV), maximal slope of restitution (Smax), and wave-dynamic parameters, such as the dominant frequency (DF), phase singularities (PS), and AF termination rates according to the V-AADs. The PITX2+/−-deficient model exhibited a shorter APD90 (p < 0.001), a lower Smax (p < 0.001), mean DF (p = 0.012), PS number (p < 0.001), and a longer AF cycle length (AFCL, p = 0.011). Five V-AADs changed the electrophysiology in a dose-dependent manner. AAD-induced AFCL lengthening (p < 0.001) and reductions in the CV (p = 0.033), peak DF (p < 0.001), and PS number (p < 0.001) were more significant in PITX2+/−-deficient than wild-type AF. PITX2+/−-deficient AF was easier to terminate with class IC AADs than the wild-type AF (p = 0.018).
Conclusions: The computational modeling-guided AAD test was feasible for evaluating the efficacy of multiple AADs in patients with AF. AF wave-dynamic and electrophysiological characteristics are different among the PITX2-deficient and the wild-type genotype models.
Introduction
Atrial fibrillation (AF) is found in 1.6% of the overall population, and the prevalence is steadily increasing with the aging population (Kim et al., 2018). Because AF is a progressive chronic disease, the more AF progresses to the persistent form, the more difficult it is to control the rhythm (Calkins et al., 2017). On the other hand, active rhythm control of AF, including catheter ablation, helps prevent AF complications such as ischemic strokes, dementia, heart failure, and renal failure (Friberg et al., 2016; Marrouche et al., 2018; Jin et al., 2019; Noseworthy et al., 2019; Park et al., 2019). Nevertheless, using drugs for AF rhythm control is not easy because of the low efficacy and safety of antiarrhythmic drugs (AAD) (Singh et al., 2005). AF has been proven to be a heritable disease (Lubitz et al., 2010). Although it is still disputable, the genetic characteristics might play an essential role in AAD responsiveness and AF recurrence in de novo AF or after electrical cardioversion (Parvez et al., 2012). Previous studies reported that a PITX2+/−-deficient condition modulated atrial resting membrane potentials and increased both AF susceptibility and the efficacy of AADs, especially class IC drugs (Syeda et al., 2016; Bai et al., 2021) and that dronedarone restored the action potential of myocytes affected by hERG mutations to that of wild-type (WT) myocytes (Loewe et al., 2014). Amiodarone has also been found to decrease APD heterogeneity and to affect AF termination (Varela et al., 2016). However, it is not clinically possible to predict the efficacy of toxic AADs prior to dosing. With the development of high-speed parallel computing hardware system (Boyle et al., 2019), AF simulation modeling has become more efficient for clinical applications. In particular, we previously reported that AF catheter ablation results can be predicted and improved by using computational modeling before the procedure (Kim et al., 2019). In this study, we created the realistic atrial model by reflecting personalized electroanatomy and modulating the specific ion currents for AADs. We then compared the effects of AADs based on wild-type and PITX2+/−-deficient AF models. The purpose of this study was to evaluate whether computational modeling of AAD study was a useful method for studying AF susceptibility and dose-dependent responses of virtual AADs.
Materials and Methods
Ethical Approval
The study protocol adhered to the Declaration of Helsinki and approved by the Institutional Review Board of the Severance Cardiovascular Hospital, Yonsei University Health System. All participants provided written consent for the researchers to access their genetic data, CT images, and clinical mapping data. Patients that participated in the study were included in the Yonsei AF Ablation Cohort Database (ClinicalTrials.gov Identifier: NCT02138695).
Realistic AF Modeling
To reflect tissue characteristics in the atrial model, we performed electroanatomical modeling, fibrosis and fiber orientation modeling, and simulation setup. Electroanatomical modeling involved combining personalized CT images with voltage data. Electroanatomical maps combining clinical voltage data with CT images were used to obtain personalized 3D LA models for each study subject. We collected bipolar electrogram data for over 500 points on the left atrial (LA) surface to produce interpolated voltage data for 25 AF catheter ablation procedures (Figures 1A,B). Interpolation of clinical voltage data was used to create the virtual voltage data (Figure 1A). Such interpolation was based on the inverse distance weighting method (IDW) (Ugarte et al., 2015). The voltage data were depicted in amplitude maps obtained from bipolar electrograms with over 500 points on the left atrial (LA) surface to produce voltage. The bipolar electrograms consisted of sequential recordings of clinical electrogram during a paced rhythm with a cycle length of 500 ms. Virtual voltage data were also included in amplitude maps, which were produced by the interpolation of clinical voltage data. Interpolation of the voltage data was performed within a 10-mm radius from the region of interest. IDW was a signal interpolation method used to determine unknown data values which were weighted average of the neighboring values. IDW assumed that the closest neighboring values have the largest weight. The equation for IDW (Ugarte et al., 2015) was indicated:
where W represents the weighted average of neighboring values; i and j indicate the known and unknown values of points; dij−a is the distance between known and unknown points; Rij represents the value of known point; and Rj indicates the interpolation value at unknown point j. Next, the voltage data were combined with CT images to create a 3D LA model map using the Ensite NavX system (Abbott Inc., Lake Bluff, IL USA). This 3D LA model map was then matched with coordinates of personalized clinical maps for accurate representation of voltage and CT images through transition and rotation. Positioning of the electroanatomical maps containing clinical voltage data and 3D LA maps onto the CT-based mesh models (Lim et al., 2020a) was conducted over four steps: geometry, trimming, field scaling, and alignment. The geometry step reflected the production of electroanatomical maps using a catheter. After the geometry step, unnecessary artifacts were removed, and the ostial position was used for separation of the LA appendage and the pulmonary vein (PV) regions during the trimming step. The field scaling step indicated the optimal scaling of interelectrode spacing and CT images. Lastly, the alignment step involved the registration of alignment points through coordinate transformation using an accurately defined ostium, along with the integration of CT images and anatomical maps. Fiber orientation environment was created using atlas-based mesh method (Ho et al., 2002) in two consecutive steps: fiber tracking and visualization. Parallel tasking was used for fiber tracking step, and visual display of fiber orientation onto 3D-LA map was conducted during visualization step. Fiber tracking was handled as an independent parallel task, which was used to determine the direction of conduction. A vector following the myocardial fiber direction could be produced at each location in the heart. The conductivity was smaller in the direction perpendicular to the vector than the conductivity in the vector direction. Fibrosis area was determined using relationship between probability of fibrosis and bipolar voltage (Zahid et al., 2016; Hwang et al., 2019) (Figure 1C). To achieve personalized virtual LA model, synchronization of clinical local activation time (LAT) map and virtual LAT map was performed. Diffusion coefficient for virtual LAT map was adjusted to accurately match conduction velocity (CV) of clinical LAT map (Lim et al., 2020a). Color scales of clinical and virtual LAT maps were compared for synchronization (Figure 1D). Finally, ion currents for sinus rhythm and AF state were set up for analysis (Figures 1E,F). The detailed protocol of AF mechanism was indicated in Figure 1G and Supplementary Materials.
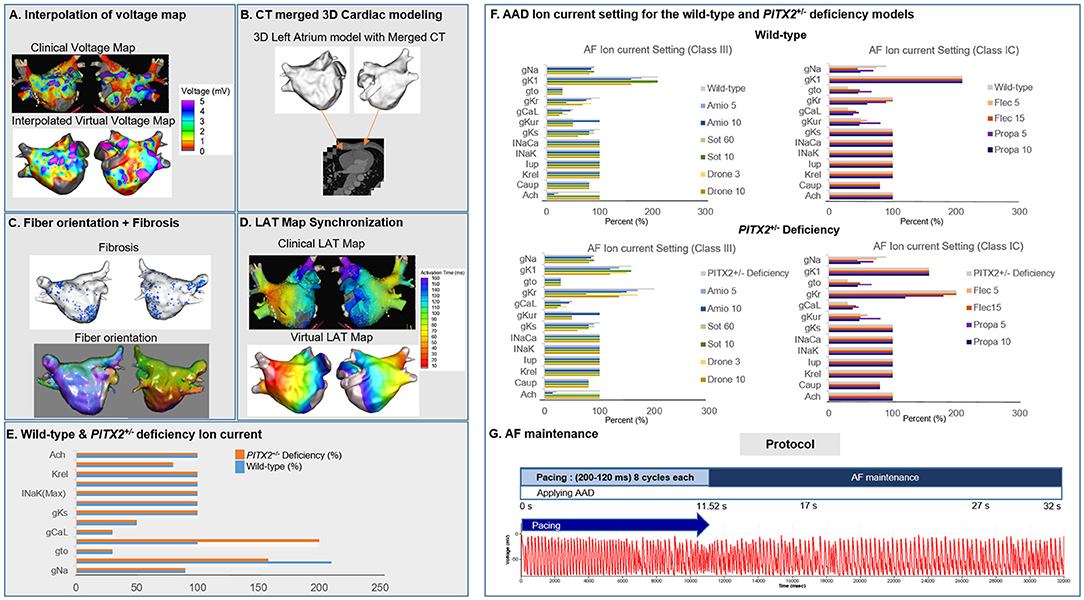
Figure 1. Study method for the 3D left atrial modeling. The voltage map (A), CT images (B), fiber orientation (C), fibrosis (C), and LAT synchronization (D) were used for the LA modeling. The wild-type and PITX2+/− deficiency ion currents (E,F) was implemented to simulate for wave dynamics analysis. AF pacing protocol (G) was conducted to analyze the AF initiation and maintenance.
PITX2+/– Deficiency Incorporation
The Courtemanche model (Courtemanche et al., 1998) reflecting the human atrial myocyte model was implemented for the wild-type sinus rhythm (SR) status while AF status was defined as ion current remodeling of the Courtemanche model (Lee et al., 2016). For the wild-type AF state, INa, Ito, ICaL, IKur, and ICaup were decreased by 10, 70, 70, 50, and 20%, and IK1 was increased by 110% compared with the Courtemanche model (Lee et al., 2016). The Syeda et al. (2016) model was used for the PITX2+/− SR status, and the PITX2+/− deficiency AF state was modulated with the same proportion as the wild-type SR to wild-type AF. For the PITX2+/− deficiency AF state, INa, Ito, ICaL, IKur, and ICaup were decreased by 10, 70, 70, 50, and 20% whereas IK1 and IKr were increased by 58 and 100% compared with the Courtemanche model. The same percent change from sinus rhythm to AF for CRN was applied to normal sinus rhythm to AF for PITX2+/− deficiency (Table 1). For the PITX2+/− deficiency AF state, INa, Ito, ICaL, IKur, and ICaup were decreased by 10, 70, 70, 50, and 20%, whereas IK1 and IKr increased by 58 and 100%, compared with the Courtemanche model.
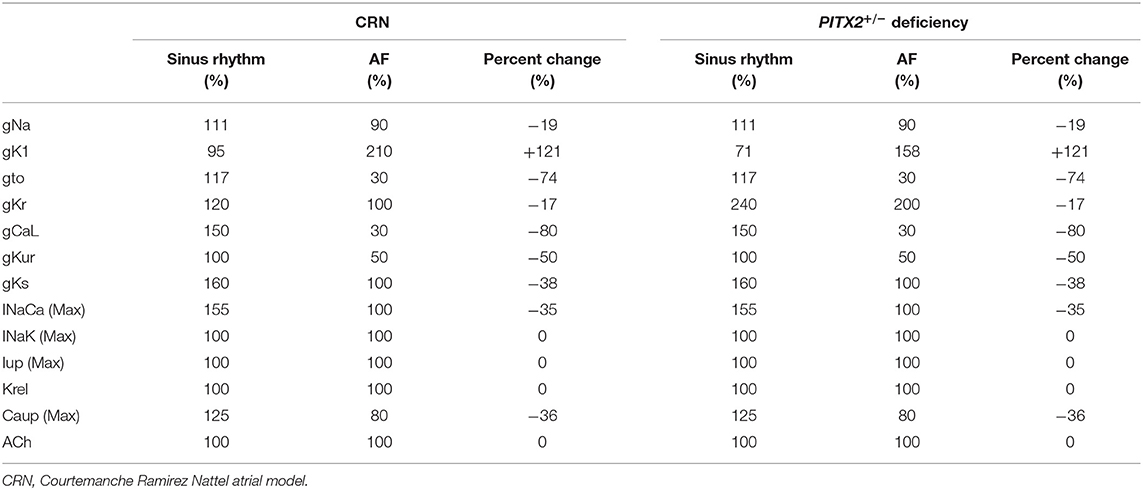
Table 1. Ion currents change for genotypes.
Virtual AAD Intervention
AADs were applied to wild-type and PITX2+/− deficiency backgrounds. Sinus rhythm and AF ion current, class III, and class IC characteristics were defined by blocking potassium and sodium channels and were compared with baseline values (Supplementary Figure 1). Ion currents for each AAD in wild-type and PITX2+/− deficiency models are described in Table 2, and Supplementary Table 1. Supplementary Table 1 indicated the complete lists of ion currents for baselines and AADs. CRN sinus rhythm was set to 100%. Ion currents for AADs and AF status were modulated based on CRN sinus rhythm. The decrease in percentage of potassium channels and sodium channels each resembled the characteristics of class III and class IC. The references for each AAD ion current setting was described in Table 2. The degree of blocking varied within each AAD to resemble low and high dosage. The APD90 and CV were measured using the SR ion currents while the mean Smax, DF, PS, and AFCL were calculated using AF ion currents.
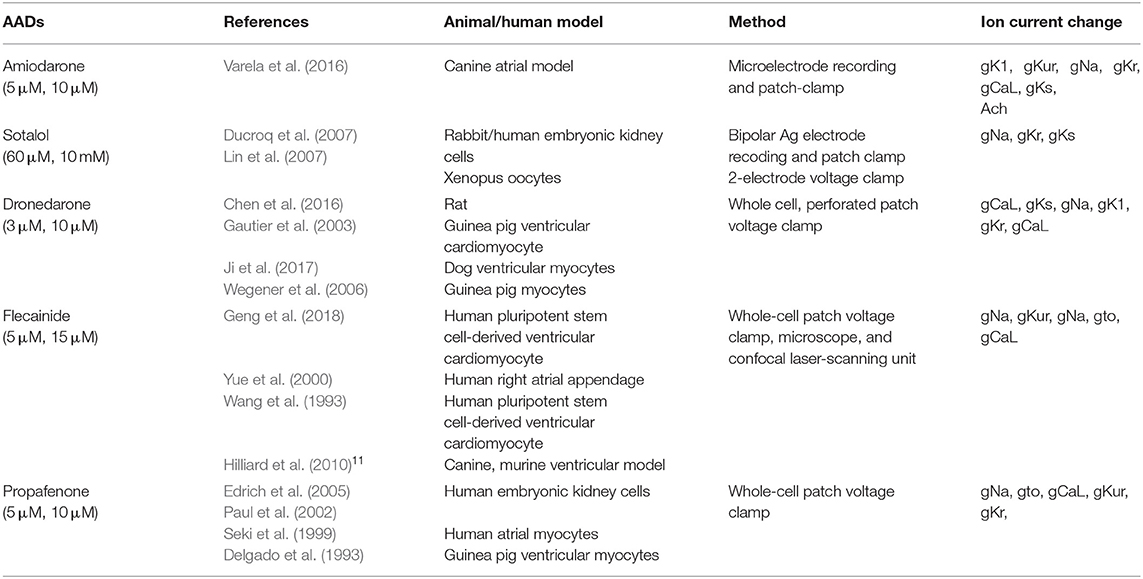
Table 2. References for atrial cell ion currents depending on AADs.
Smax Evaluation, AF Induction, and Dominant Frequency Analyses
Our graphic user interface (GUI)-based customized software (CUVIA ver. 2.5, Model: SH01; Laonmed Inc., Seoul, Korea) was utilized to visualize and analyze the action potential duration at 90% repolarization (APD90), conduction velocity (CV), maximal slope of the restitution curves (Smax), AF cycle length, and wave-dynamic characteristics such as the dominant frequency (DF) and phase singularity (PS). We estimated the location of the highest Smax region by generating the 3D-Smax maps. The highest Smax location matches to the high wave break points during fibrillation (Pak et al., 2003). Although precise defining of the highest Smax location was challenging, considering the heterogeneity of tissue characteristics, we localized it based on the digital numbers of Smax values in each node. A pacing cycle length of 600 ms was used to measure the APD90 (Song et al., 2019) and CV. The region of interest for the APD90 and CV was from the LA high septum (pacing sites) to the LA appendage (Figures 2A,B). Action potential duration (90%) was measured in the single cell environment. However, at the tissue level, the values of APD90 were heterogeneous among patients due to electroanatomical characteristics and tissue curvature of the left atrial (LA) (Song et al., 2019). The relationship between the APD90 and diastolic interval was plotted, and the Smax was calculated after non-linear fitting (Figure 2C) (Franz, 2003; Shattock et al., 2017). Non-linear fitting involved an exponential equation comprising a free-fitting variable, diastolic interval, action potential duration, and time constant: . Details of study protocol and quantification methods for basic electrophysiologic parameters and wave-dynamic parameters, such as AF cycle length (AFCL), dominant frequency (DF), or phase singularity (PS), are available in the Supplementary Material (Figures 2D–F).
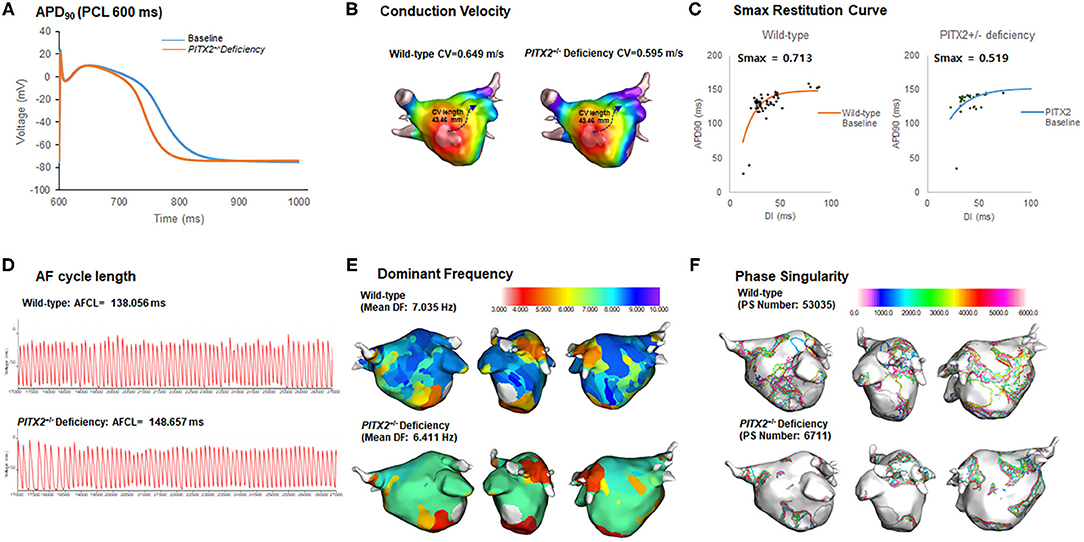
Figure 2. Wild-type vs. PITX2+/− baseline model analysis. (A–F) The baseline APD90, CV, Smax, AF cycle length, and wave-dynamics parameters for wild-type and PITX2+/− deficiency were measured for a comparison. The PITX2+/− deficiency had a shorter APD90 (A), lower mean Smax (C), and PS number (F) than the wild-type.
Statistical Analyses
Categorical variables are reported as numbers (percentages), and continuous variables represent the mean with the standard deviation. We compared the changes in those parameters after virtual AADs between the two models using the Student's t-test. We compared the changes in the wave-dynamic parameters between the class IC and class III AADs in the overall, wild-type, and PITX2+/− deficiency models using the Student's t-test. To investigate the dose-dependent effect of AADs in each model, we used the paired t-test to compare the change in the wave-dynamic parameters before and after the AADs with different doses. The effect sizes were calculated using Cohen's d (Cohen, 1988). The effect sizes were included along with p-values. Patients without appropriate AF wave-dynamic parameters due to termination were excluded from the statistical analysis.
Results
Characteristics of PITX2+/– Deficiency AF Model
The number of cases on the tables was calculated by multiplying the number of patients and AADs with the dosage. The classes were composed of 100 cases for class IC and 150 cases for class III, and the genotype models consisted of 250 cases for each model (wild type and PITX2+/− deficiency). Table 3 compares the electrophysiological parameters between the wide-type AF model and PITX2+/− deficiency model, which reflected the left atrial anatomy and electrophysiology of 25 patients (68.0% male, 59.8 ± 9.8 years old, 32.0% paroxysmal AF). Study group was composed of inclusively Korean population. One patient refused genetic analysis, and two patients did not try AAD because of significant bradyarrhythmia. We did not use AADs in two patients because of associated sinus node dysfunction. AAD may aggravate their bradyarrhythmia based on the clinical decision. However, we conducted AF ablation procedures acquiring clinical electroanatomical maps. Therefore, we did not have any problem in conducting simulation studies in those two patients. The total number of patients in the study was 25. Simulation episodes included 25 cases for baseline and 250 cases with AADs.
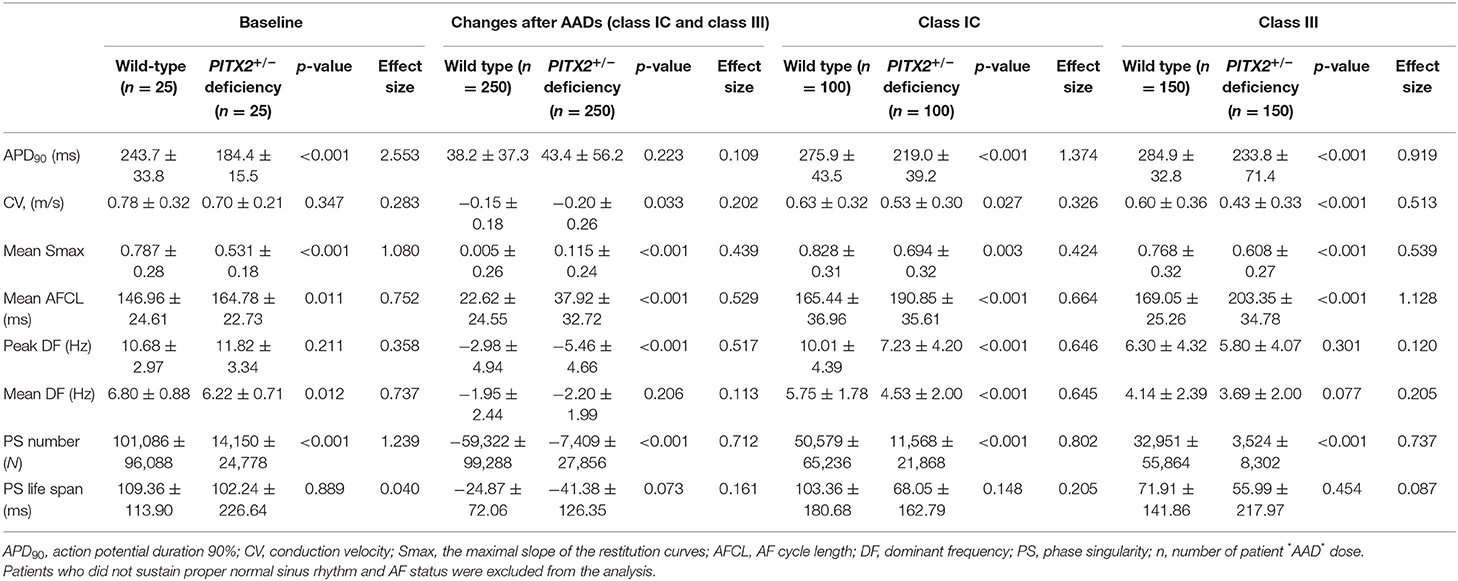
Table 3. Effects of AADs in the wild-type and PITX2+/− deficiency groups.
In Table 3, we compared electrophysiological parameters at baseline, after using class IC and class III AADs, and their changes after using any AADs (including both class IC and class III AADs) with wild type and PITX2+/− deficiency. During the baseline conditions without AADs, the PITX2+/− deficiency group had a shorter APD90 at a pacing cycle length of 600 ms (p < 0.001, effect size = 2.553, Figure 2A), lower mean Smax during ramp pacing (p < 0.001, effect size = 1.080, Figure 2C), and lower mean DF (p = 0.012, effect size = 0.737, Figure 2E) and PS number (p < 0.001, effect size = 1.239, Figure 2F) after AF induction as compared with the wild type (Table 3).
AAD Responsiveness Based on the PITX2+/– Genotypes
We tested five different V-AADs, and the outcomes are summarized in Table 3. Changes after AADs in Table 3 indicated the effects of any AADs (including both class IC and III AADs) compared with baseline. When we compared the effects of the AADs between the wild-type and PITX2+/− deficiency models (Table 3), the APD90 changes were similar (p = 0.223, effect size = 0.109), but the reductions in the CV (p = 0.033, effect size = 0.202), peak DF (p < 0.001, effect size = 0.517), and PS number (p < 0.001, effect size = 0.712) and AFCL prolongation (p = 0.001, effect size = 0.529) and change of Smax (p < 0.001, effect size = 0.439) were more significant in the PITX2+/− deficiency model than in the wild-type AF model. For independent analyses of class IC and class III, class IC lowered APD90 (p < 0.001, Effect size = 1.374), CV (p < 0.027, effect size = 0.326), mean Smax (p = 0.003, effect size = 0.424), peak DF (p < 0.001, effect size = 0.646), mean DF (p < 0.001, effect size = 0.645), and PS number (p < 0.001, effect size = 0.802) in PITX2+/− deficiency while mean AFCL (p < 0.001, effect size = 0.664) was increased with class IC in PITX2+/− deficiency. Class III decreased APD90 (p < 0.001, effect size = 0.919), CV (p < 0.001, effect size = 0.513), mean Smax (p < 0.001, effect size = 0.539), and PS number (p < 0.001, effect size = 0.737) but increased the mean AFCL (p < 0.001, Effect size = 1.128) in PITX2+/− deficiency.
Class IC and Class III Virtual AAD Effects
Table 4 summarizes the effects of the virtual AADs, which included class IC AADs, flecainide, and propafenone, and the class III AADs amiodarone, sotalol, and dronedarone. At a pacing cycle length of 600 ms, the dose-dependent effect of the AADs indicated a prolonged APD90 with high-dose AADs (Figure 3A). The dose-dependent effects of each AAD are summarized in Supplementary Figures 2–4. APD90, CV, mean DF, peak DF, PS life span, PS number, Smax, and AFCL were compared for each AAD between baseline values and those after treatment. Both class III and class IC AADs changed APD90, CV, and AFCL, significantly compared with baseline state, regardless of wild-type or PITX2+/− deficiency model (Figure 3B). In contrast, Smax was not changed in wild type, but rather increased in PITX2+/− deficiency model after class III and class IC AADs (Figure 3B). The class III AADs were more effective in reducing the CV (p = 0.004, effect size = 0.299), the peak DF (p < 0.001, effect size = 0.101), mean DF (p < 0.001, effect size = 0.547), and PS life span (p = 0.020, effect size = 0.213) and prolonging of AFCL (p < 0.001, effect size = 0.402) than the class IC AADs (Table 4). APD90 prolongation (p = 0.040, effect size = 0.284), CV reduction (p = 0.003, effect size = 0.444), and AFCL lengthening (p = 0.002, effect size = 0.498) effects were more significant, but Smax increase was less significant (p = 0.010, effect size = 0.333) by class III AADs than by class IC AADs in PITX2+/− deficiency models but not in wild-type models (Table 4).
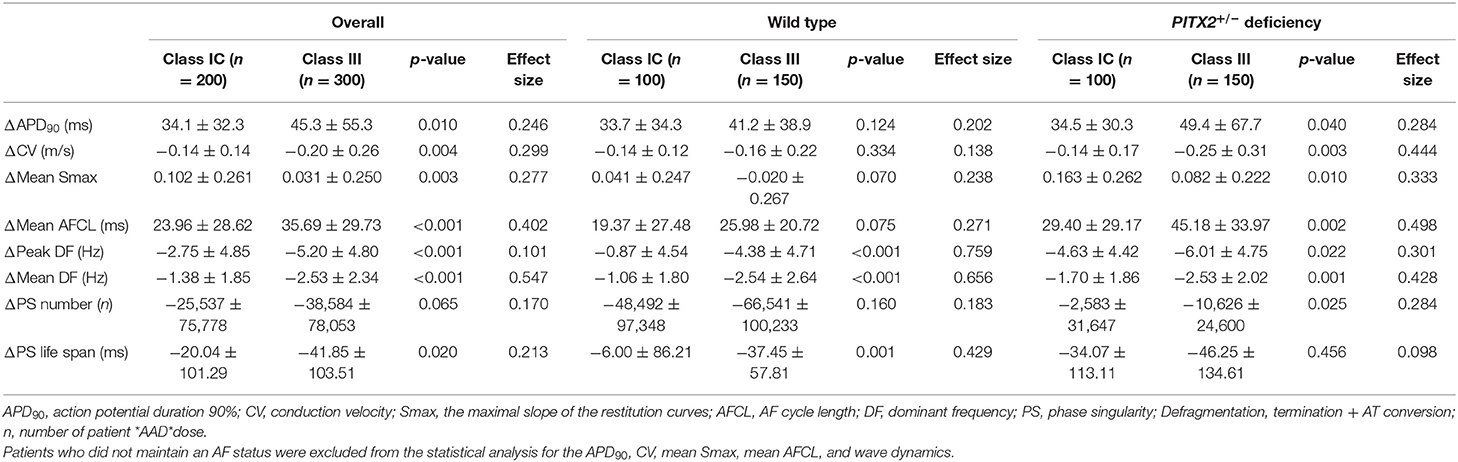
Table 4. Change in the AAD effects in the wild-type and PITX2+/− deficiency groups.
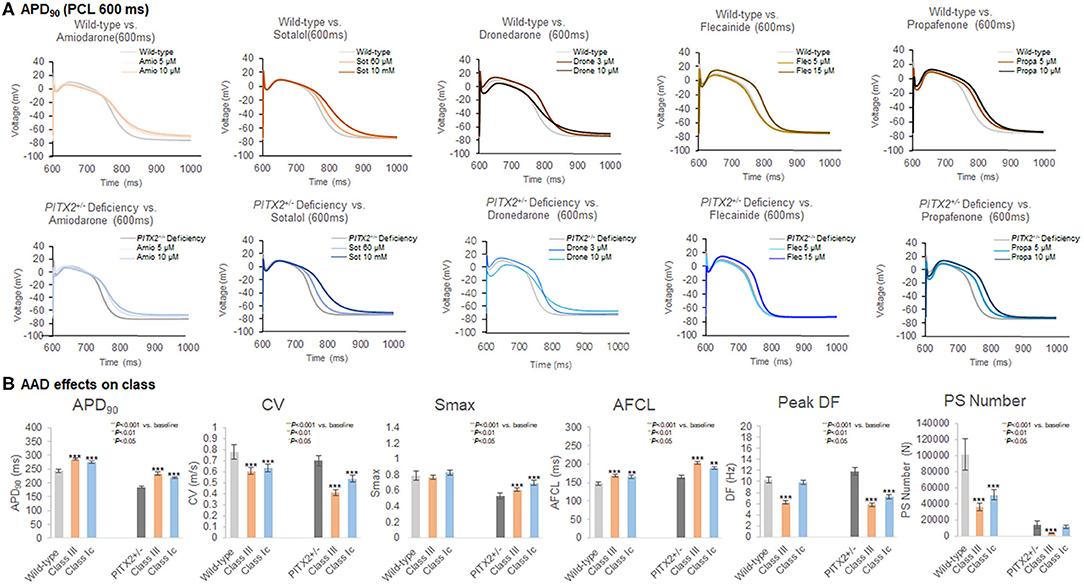
Figure 3. Characteristics of the wild-type and PITX2+/− deficiency with the response to AADs. (A,B) The APD90, CV, Smax, AF cycle length, and wave-dynamics parameters were compared with baseline after AADs. (B) Both class III and class IC increased APD90, and AFCL in wild-type and PITX2+−− deficiency model. Class III and class IC decreased CV in wild-type and PITX2+/− deficiency model while both classes increased Smax in PITX2+/− deficiency model.
AF Termination Under Virtual AADs
AF termination was determined between 0 and 32 s after AF induction. Individual-level termination rates of AADs are described in Figure 4A. AF termination rate was significantly higher under class III AADs (43.7%) than class IC AADs (19.0%, p < 0.001, Figure 4B). The class IC AADs in the PITX2+/− deficiency indicated a higher termination rate than the wild type (12.0 vs. 26.0%, p = 0.012, Figure 4C). Overall, the AF termination rate was 36.0% after using virtual AADs. When we compared the overall AF termination rate, there was no statistical difference between the wild-type AF (34.4%) and PITX2+/− deficiency AF (37.6%, p = 0.514, Table 5). However, the PITX2+/− deficiency AF had a statistically higher termination response to the class IC AADs (26.0%) than the wild-type AF (12.0%, p = 0.018, Table 5).
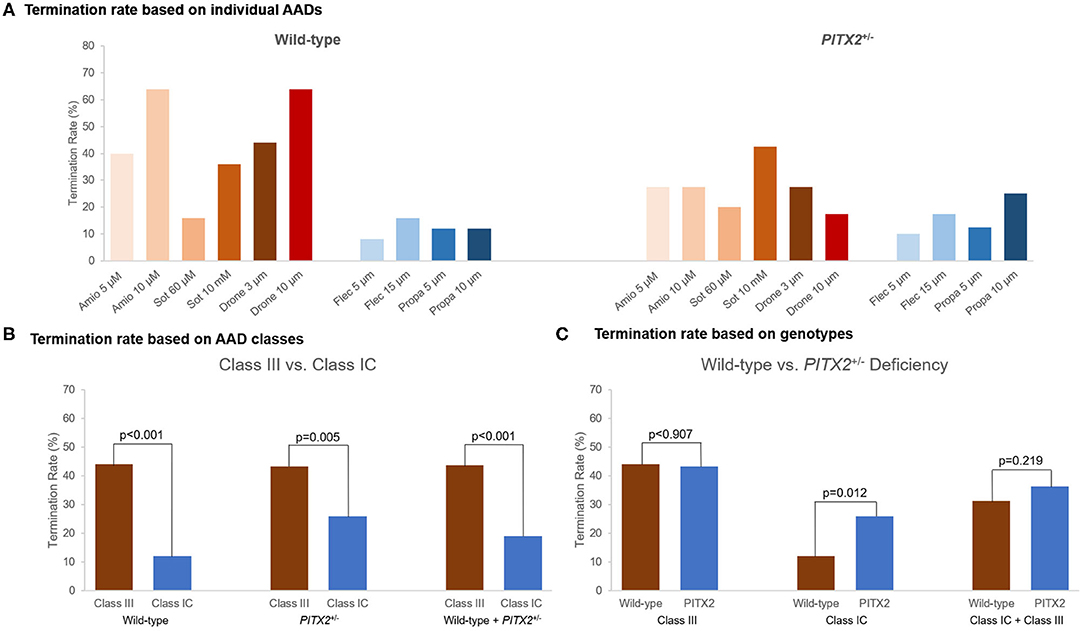
Figure 4. Termination rate of the wild-type and PITX2+/− deficiency based on the AADs. (A) Termination rate for different AADs was described. (B,C) Termination rate was compared between the wild-type and PITX2+/− deficiency and class III and class IC. (B) Class III showed higher AF termination rate compared with class IC. (C) Class IC AADs in PITX2+/− deficiency indicated the higher AF termination rate compared with the wild type. Class III showed the higher termination rate than class IC.
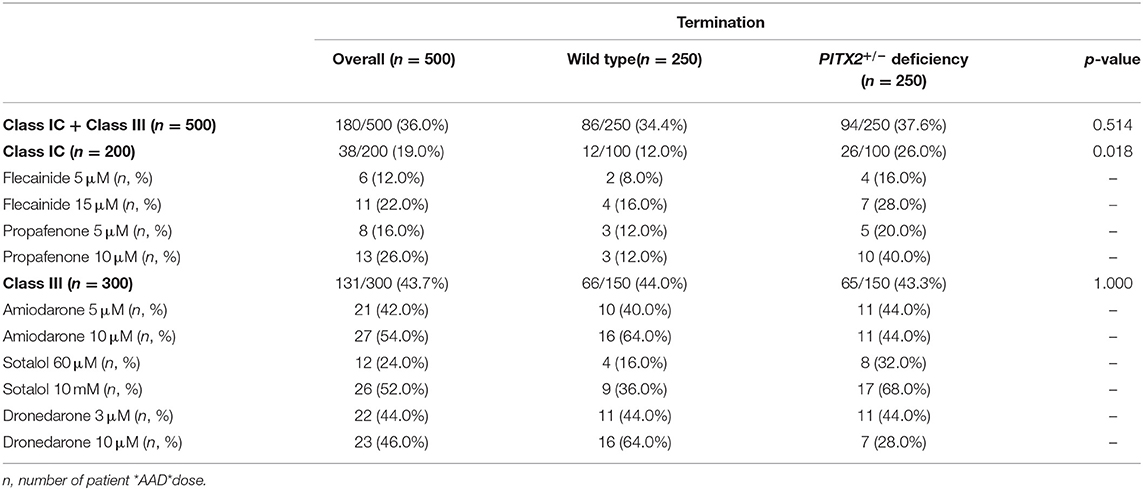
Table 5. Termination results based on the wild-type and PITX2+/− deficiency.
Discussion
Main Findings
In this study, we invented a highly efficient patient-specific AF computation modeling system that could be applied to the virtual AAD test. We conducted a virtual AAD modeling after integrating the atrial geometry taken from the patient's cardiac CT image and electrophysiology acquired from the 3D-electroanatomical voltage map. We also evaluated the virtual AAD responsiveness by simulating the effects of five different AADs according to the PITX2+/− genotypes. The PITX2+/−-deficient model had a shorter APD90, lower Smax, longer AFCL, lower mean DF, and lower PS number. The PITX2+/− deficiency AF was easier to terminate by class IC AADs than the wild-type AF. Dose-dependent AF termination rates were significantly higher after using virtual class III AADs than class IC AADs. Although class III AADs were classified as a potassium channel blocker, amiodarone is a multichannel blocker and dronedarone is a modification of amiodarone without the iodine component. Therefore, amiodarone and dronedarone affect CV and the tissue excitability (Gautier et al., 2003; Patel et al., 2009; Saengklub et al., 2016). On the other hand, sotalol is a relatively pure potassium channel blocker (Roden, 2016), and it did not alter CV as much as amiodarone or dronedarone (Supplementary Figure 2B). The virtual AAD test was a feasible approach for evaluating the efficacy of multiple AADs in patients with AF.
AADs in AF Rhythm Control
AADs are the most commonly used first-line therapy for AF rhythm control. Nevertheless, <50% of AF patients maintain adequate SR for more than 1 year with AADs, which is significantly lower than in AF catheter ablation (Singh et al., 2005). The first obstacle to the proper use of AADs is the risk of various adverse effects such as sinus node dysfunction, proarrhythmias, and an increased mortality, and the second is the difference in the drug effects, depending on the patient characteristics (Parvez et al., 2012). Because of this, a sufficient dose of the AAD carries the potential risk of side effects, while an excessively careful reduced-dose AAD administration lowers the effect of the rhythm control. The virtual AAD simulation test considered the personal and genetic characteristics of the AF patients, and therefore, it has the potential as an important breakthrough for more efficient AF drug therapy in the future.
PITX2 Variant Characteristics
AF is already well-known as a heritable disease (Lubitz et al., 2010). In particular, the PITX2 gene has been known to be the universal first AF-associated SNP in European, Japanese, and Korean populations (Lee et al., 2017; Low et al., 2017; Roselli et al., 2018). Unique electrophysiological changes that create AF vulnerable conditions are observed in PITX2+/−-deficient animal models. First, a PITX2+/− deficiency results in a condition with a shortening of the APD by reducing the IK1 and ICa−L and by increasing the IKs (Syeda et al., 2016). Second, it generates a slower CV by raising the atrial cell resting membrane potential and changing the gap junctional conduction (Chinchilla et al., 2011). Third, the PITX2+/− deficiency is related to triggered activity caused by abnormal calcium management (Denham et al., 2018).
Parvez et al. (2012) reported that rs10033464 in the PITX2 gene is independently associated with the response to the AAD treatment in patients with AF. This report is in agreement with a study by Syeda et al. (2016) on the sensitivity to flecainide, a sodium channel blocker, in the PITX2 deficiency animal model (Parvez et al., 2012). In this study, we observed significant electrophysiological changes related to the PITX2 deficiency and its responsiveness to class IC AADs in the AF computational modeling of 25 patients, which was consistent with the previous studies (Syeda et al., 2016). Moreover, the AF wave dynamics, including the Smax also exhibited characteristic changes according to the genetic traits or specific AADs.
Virtual AAD Modeling in AF
Since the first human AF computational modeling was presented by Moe et al. (1964), sophisticated simulation modeling that integrates the patient's anatomical, histological, and electrophysiological characteristics have been utilized in various physiological studies (Trayanova, 2014). The biggest obstacle to the clinical use of a sophisticated AF computational modeling so far has been the long computational speed of a complex simulation. However, recent innovations in the hardware and software have opened the gate for the clinical utilization of AF computational modeling (Kwon et al., 2013). Lim et al. (2020b) used a graphic process unit to analyze the AF modeling and a wave-dynamics analysis within 45 min while considering the patient's anatomy (cardiac computed tomogram), electrophysiology (3D-electroanatomical map), fibrosis (voltage map), and fiber orientation (LAT map). In this study, we further clinically applied the computational modeling by testing five different virtual AADs, depending on the PITX2 genotypes, in a realistic AF modeling in 25 patients.
Limitations
The LA model used a personalized/realistic electroanatomy, fibrosis, and fiber orientation; however, the LA model was designed to be a monolayer. Implementation of epicardial conduction could provide the endocardial-acquired local activation pattern and clinical voltage. Including the atrial wall thickness in the LA model could provide more accurate representation of the wave-dynamics analyses, thus, the results would be a more clinically applicable LA model. Bilayers, including both endocardial and epicardial layers, were not reflected in the model (Labarthe et al., 2014). The fiber orientation can be a simplistic version of a rather sophisticated image or a rule-based approach of the fiber orientation (Krueger et al., 2013). Multisite induction could be conducted to reflect the complicated AF dynamics (Prakosa et al., 2018). The majority of the references for the PITX2+/− deficiency and AAD-induced changes of the trans-membrane ion currents were based on in vivo experiments with animal models. In this study, a detailed analysis of sarcoplasmic reticular calcium leaking and triggered activity was not performed. There are still obstacles to this approach, such as the need for invasive mapping data. Invasive LA modeling was conducted, whereas other modeling using LDGE MRI (Lopez-Perez et al., 2015) or ECGi (Perez Alday et al., 2019) could be considered for further study.
Conclusion
We conducted a virtual AAD test with five different AADs, according to the PITX2+/− genotype, after integrating the atrial geometry taken from the patient's cardiac CT image and electrophysiology acquired from a 3D-electroanatomical voltage map. The PITX2+/−-deficient model exhibited different electrophysiology and AF wave dynamics than the wild type. PITX2+/− deficiency AF was easier to terminate by class IC AADs than the wild-type AF. Therefore, the virtual AAD test was a feasible approach for evaluating the efficacy of multiple AADs in patients with AF.
Data Availability Statement
The raw data supporting the conclusions of this article will be made available by the authors, without undue reservation.
Ethics Statement
The studies involving human participants were reviewed and approved by the institutional Review Board of the Yonsei University Health System. The patients/participants provided their written informed consent to participate in this study.
Author Contributions
H-NP participated in the study design, study protocol design, data review, and writing manuscript. IH and ZJ was involved in the data collection, analysis, and writing manuscript. J-WP was involved in the data interpretation and statistical analysis. O-SK participated in the study tool design. BL was involved in the data collection, and study protocol design. MH, MK, and H-TY participated in the data interpretation. T-HK, J-SU, BJ, and M-HL were involved in the data interpretation and data review. All authors contributed to the article and approved the submitted version.
Funding
This work was supported by a grant (HI19C0114) from the Ministry of Health and Welfare. Additionally, the work was funded by grants (NRF-2019R1C1C100907512) and (NRF-2020R1A2B01001695) from the Basic Science Research Program run by the National Research Foundation of Korea (NRF) under the Ministry of Science, ICT & Future Planning (MSIP). This work was supported by the Brain Korea 21 PLUS Project for Medical Science, Yonsei University.
Conflict of Interest
The authors declare that the research was conducted in the absence of any commercial or financial relationships that could be construed as a potential conflict of interest.
Acknowledgments
We thank Mr. John Martin for his linguistic assistance.
Supplementary Material
The Supplementary Material for this article can be found online at: https://www.frontiersin.org/articles/10.3389/fphys.2021.650449/full#supplementary-material
References
Bai, J., Zhu, Y., Lo, A., Gao, M., Lu, Y., Zhao, J., et al. (2021). In silico assessment of class i antiarrhythmic drug effects on Pitx2-induced atrial fibrillation: insights from populations of electrophysiological models of human atrial cells and tissues. Int. J. Mol. Sci. 22:1265. doi: 10.3390/ijms22031265
Boyle, P. M., Zghaib, T., Zahid, S., Ali, R. L., Deng, D., Franceschi, W. H., et al. (2019). Computationally guided personalized targeted ablation of persistent atrial fibrillation. Nature Biomed. Eng. 3, 870–879. doi: 10.1038/s41551-019-0437-9
Calkins, H., Hindricks, G., Cappato, R., Kim, Y. H., Saad, E. B., Aguinaga, L., et al. (2017). 2017 HRS/EHRA/ECAS/APHRS/SOLAECE expert consensus statement on catheter and surgical ablation of atrial fibrillation. Heart Rhythm 14, 275–444. doi: 10.1016/j.hrthm.2017.05.012
Chen, K. H., Xu, X. H., Sun, H. Y., Du, X. L., Liu, H., Yang, L., et al. (2016). Distinctive property and pharmacology of voltage-gated sodium current in rat atrial vs ventricular myocytes. Heart Rhythm 13, 762–770. doi: 10.1016/j.hrthm.2015.11.022
Chinchilla, A., Daimi, H., Lozano-Velasco, E., Dominguez, J. N., Caballero, R., Delpón, E., et al. (2011). PITX2 insufficiency leads to atrial electrical and structural remodeling linked to arrhythmogenesis. Circ. Cardiovasc. Genet. 4, 269–279. doi: 10.1161/CIRCGENETICS.110.958116
Cohen, J. (1988). Statistical Power Analysis for the Behavioral Sciences. New York, NY: Academic Press.
Courtemanche, M., Ramirez, R. J., and Nattel, S. (1998). Ionic mechanisms underlying human atrial action potential properties: insights from a mathematical model. Am. J. Physiol. 275, H301–321. doi: 10.1152/ajpheart.1998.275.1.H301
Delgado, C., Tamargo, J., Henzel, D., and Lorente, P. (1993). Effects of propafenone on calcium current in guinea-pig ventricular myocytes. Br. J. Pharmacol. 108, 721–727. doi: 10.1111/j.1476-5381.1993.tb12868.x
Denham, N. C., Pearman, C. M., Caldwell, J. L., Madders, G. W. P., Eisner, D. A., Trafford, A. W., et al. (2018). Calcium in the pathophysiology of atrial fibrillation and heart failure. Front. Physiol. 9:1380. doi: 10.3389/fphys.2018.01380
Ducroq, J., Printemps, R., Guilbot, S., Gardette, J., Salvetat, C., and Le Grand, M. (2007). Action potential experiments complete hERG assay and QT-interval measurements in cardiac preclinical studies. J. Pharmacol. Toxicol. Methods 56, 159–170. doi: 10.1016/j.vascn.2007.03.009
Edrich, T., Wang, S. Y., and Wang, G. K. (2005). State-dependent block of human cardiac hNav1.5 sodium channels by propafenone. J. Membr. Biol. 207, 35–43. doi: 10.1007/s00232-005-0801-4
Franz, M. R. (2003). The electrical restitution curve revisited: steep or flat slope–which is better? J. Cardiovasc. Electrophysiol. 14, S140–147. doi: 10.1046/j.1540.8167.90303.x
Friberg, L., Tabrizi, F., and Englund, A. (2016). Catheter ablation for atrial fibrillation is associated with lower incidence of stroke and death: data from Swedish health registries. Eur. Heart J. 37, 2478–2487. doi: 10.1093/eurheartj/ehw087
Gautier, P., Guillemare, E., Marion, A., Bertrand, J. P., Tourneur, Y., and Nisato, D. (2003). Electrophysiologic characterization of dronedarone in guinea pig ventricular cells. J Cardiovasc. Pharmacol. 41, 191–202. doi: 10.1097/00005344-200302000-00007
Geng, L., Kong, C. W., Wong, A. O. T., Shum, A. M., Chow, M. Z. Y., Che, H., et al. (2018). Probing flecainide block of I(Na) using human pluripotent stem cell-derived ventricular cardiomyocytes adapted to automated patch-clamping and 2D monolayers. Toxicol. Lett. 294, 61–72. doi: 10.1016/j.toxlet.2018.05.006
Hilliard, F. A., Steele, D. S., Laver, D., Yang, Z., Le Marchand, S. J., Chopra, N., et al. (2010). Flecainide inhibits arrhythmogenic Ca2+ waves by open state block of ryanodine receptor Ca2+ release channels and reduction of Ca2+ spark mass. J. Mol. Cell Cardiol. 48, 293–301. doi: 10.1016/j.yjmcc.2009.10.005
Ho, S. Y., Anderson, R. H., and Sánchez-Quintana, D. (2002). Atrial structure and fibres: morphologic bases of atrial conduction. Cardiovasc. Res. 54, 325–336. doi: 10.1016/S0008-6363(02)00226-2
Hwang, M., Kim, J., Lim, B., Song, J. S., Joung, B., Shim, E. B., et al. (2019). Multiple factors influence the morphology of the bipolar electrogram: an in silico modeling study. PLoS Comput. Biol. 15:e1006765. doi: 10.1371/journal.pcbi.1006765
Ji, Y., Takanari, H., Qile, M., Nalos, L., Houtman, M. J. C., Romunde, F. L., et al. (2017). Class III antiarrhythmic drugs amiodarone and dronedarone impair KIR 2.1 backward trafficking. J. Cell. Mol. Med. 21, 2514–2523 doi: 10.1111/jcmm.13172
Jin, M.-N., Kim, T.-H., Kang, K.-W., Yu Hee, T., Uhm, J.-S., Joung, B., et al. (2019). Atrial fibrillation catheter ablation improves 1-year follow-up cognitive function, especially in patients with impaired cognitive function. Circulation 12:e007197. doi: 10.1161/CIRCEP.119.007197
Kim, D., Yang, P. S., Jang, E., Yu, H. T., Kim, T. H., Uhm, J. S., et al. (2018). 10-year nationwide trends of the incidence, prevalence, and adverse outcomes of non-valvular atrial fibrillation nationwide health insurance data covering the entire Korean population. Am. Heart J. 202, 20–26. doi: 10.1016/j.ahj.2018.04.017
Kim, I.-S., Lim, B., Shim, J., Hwang, M., Yu, H. T., Kim, T.-H., et al. (2019). Clinical usefulness of computational modeling-guided persistent atrial fibrillation ablation: updated outcome of multicenter randomized study. Front. Physiol. 10:1512. doi: 10.3389/fphys.2019.01512
Krueger, M. W., Seemann, G., Rhode, K., Keller, D. U., Schilling, C., Arujuna, A., et al. (2013). Personalization of atrial anatomy and electrophysiology as a basis for clinical modeling of radio-frequency ablation of atrial fibrillation. IEEE Trans. Med. Imaging 32, 73–84. doi: 10.1109/TMI.2012.2201948
Kwon, S. S., Yun, Y. H., Hong, S. B., Pak, H. N., and Shim, E. B. (2013). A patient-specific model of virtual ablation for atrial fibrillation. Conf. Proc. IEEE Eng. Med. Biol. Soc. 2013, 1522–1525. doi: 10.1109/EMBC.2013.6609802
Labarthe, S., Bayer, J., Coudière, Y., Henry, J., Cochet, H., Jaïs, P., et al. (2014). A bilayer model of human atria: mathematical background, construction, and assessment. EP Europace 16, 21–29. doi: 10.1093/europace/euu256
Lee, J.-Y., Kim, T.-H., Yang, P.-S., Lim, H. E., Choi, E.-K., Shim, J., et al. (2017). Korean atrial fibrillation network genome-wide association study for early-onset atrial fibrillation identifies novel susceptibility loci. Eur. Heart J. 38, 2586–2594. doi: 10.1093/eurheartj/ehx213
Lee, Y. S., Hwang, M., Song, J. S., Li, C., Joung, B., Sobie, E. A., et al. (2016). The contribution of ionic currents to rate-dependent action potential duration and pattern of reentry in a mathematical model of human atrial fibrillation. PLoS ONE 11:e0150779. doi: 10.1371/journal.pone.0150779
Lim, B., Kim, J., Hwang, M., Song, J.-S., Lee, J. K., Yu, H.-T., et al. (2020a). In situ procedure for high-efficiency computational modeling of atrial fibrillation reflecting personal anatomy, fiber orientation, fibrosis, and electrophysiology. Sci. Rep. 10:2417. doi: 10.1038/s41598-020-59372-x
Lim, B., Park, J. W., Hwang, M., Ryu, A. J., Kim, I. S., Yu, H. T., et al. (2020b). Electrophysiological significance of the interatrial conduction including cavo-tricuspid isthmus during atrial fibrillation. J. Physiol. 598, 3597–3612. doi: 10.1113/JP279660
Lin, C., Ke, X., Cvetanovic, I., Ranade, V., and Somberg, J. (2007). The effect of high extracellular potassium on IKr inhibition by anti-arrhythmic agents. Cardiology 108, 18–27. doi: 10.1159/000095596
Loewe, A., Lutz, Y., Wilhelms, M., Sinnecker, D., Barthel, P., Scholz, E. P., et al. (2014). In-silico assessment of the dynamic effects of amiodarone and dronedarone on human atrial patho-electrophysiology. EP Europace 16, 30–38. doi: 10.1093/europace/euu230
Lopez-Perez, A., Sebastian, R., and Ferrero, J. M. (2015). Three-dimensional cardiac computational modelling: methods, features and applications. BioMed. Eng. 14:35. doi: 10.1186/s12938-015-0033-5
Low, S. K., Takahashi, A., Ebana, Y., Ozaki, K., Christophersen, I. E., Ellinor, P. T., et al. (2017). Identification of six new genetic loci associated with atrial fibrillation in the Japanese population. Nat. Genet. 49, 953–958. doi: 10.1038/ng.3842
Lubitz, S. A., Yin, X., Fontes, J. D., Magnani, J. W., Rienstra, M., Pai, M., et al. (2010). Association between familial atrial fibrillation and risk of new-onset atrial fibrillation. Jama 304, 2263–2269. doi: 10.1001/jama.2010.1690
Marrouche, N. F., Brachmann, J., Andresen, D., Siebels, J., Boersma, L., Jordaens, L., et al. (2018). Catheter ablation for atrial fibrillation with heart failure. N. Eng. J. Med. 378, 417–427. doi: 10.1056/NEJMoa1707855
Moe, G. K., Rheinboldt, W. C., and Abildskov, J. A. (1964). A computer model of atrial fibrillation. Am. Heart J. 67, 200–220. doi: 10.1016/0002-8703(64)90371-0
Noseworthy, P. A., Gersh, B. J., Kent, D. M., Piccini, J. P., Packer, D. L., Shah, N. D., et al. (2019). Atrial fibrillation ablation in practice: assessing CABANA generalizability. Eur. Heart J. 40, 1257–1264. doi: 10.1093/eurheartj/ehz085
Pak, H.-N., Oh, Y.-S., Liu, Y.-B., Wu, T.-J., Karagueuzian Hrayr, S., Lin, S.-F., et al. (2003). Catheter ablation of ventricular fibrillation in rabbit ventricles treated with β-blockers. Circulation 108, 3149–3156. doi: 10.1161/01.CIR.0000104563.12408.12
Park, J. W., Yang, P. S., Bae, H. J., Yang, S. Y., Yu Hee, T., Kim, T. H., et al. (2019). Five-year change in the renal function after catheter ablation of atrial fibrillation. J. Am. Heart Assoc. 8:e013204. doi: 10.1161/JAHA.119.013204
Parvez, B., Vaglio, J., Rowan, S., Muhammad, R., Kucera, G., Stubblefield, T., et al. (2012). Symptomatic response to antiarrhythmic drug therapy is modulated by a common single nucleotide polymorphism in atrial fibrillation. J. Am. Coll. Cardiol. 60:539. doi: 10.1016/j.jacc.2012.01.070
Patel, C., Yan, G.-X., and Kowey Peter, R. (2009). Dronedarone. Circulation 120, 636–644. doi: 10.1161/CIRCULATIONAHA.109.858027
Paul, A. A., Witchel, H. J., and Hancox, J. C. (2002). Inhibition of the current of heterologously expressed HERG potassium channels by flecainide and comparison with quinidine, propafenone and lignocaine. Br. J. Pharmacol. 136, 717–729. doi: 10.1038/sj.bjp.0704784
Perez Alday, E. A., Whittaker, D. G., Benson, A. P., and Colman, M. A. (2019). Effects of heart rate and ventricular wall thickness on non-invasive mapping: an in silico study. Front. Physiol. 10:308. doi: 10.3389/fphys.2019.00308
Prakosa, A., Arevalo, H. J., Deng, D., Boyle, P. M., Nikolov, P. P., Ashikaga, H., et al. (2018). Personalized virtual-heart technology for guiding the ablation of infarct-related ventricular tachycardia. Nat. Biomed. Eng. 2, 732–740. doi: 10.1038/s41551-018-0282-2
Roden, D. M. (2016). Pharmacogenetics of potassium channel blockers. Cardiac. Electrophysiol. Clin. 8, 385–393. doi: 10.1016/j.ccep.2016.02.003
Roselli, C., Chaffin, M. D., Weng, L.-C., Aeschbacher, S., Ahlberg, G., Albert, C. M., et al. (2018). Multi-ethnic genome-wide association study for atrial fibrillation. Nat. Genet. 50, 1225–1233. doi: 10.1038/s41588-018-0133-9
Saengklub, N., Limprasutr, V., Sawangkoon, S., Buranakarl, C., Hamlin, R. L., and Kijtawornrat, A. (2016). Acute effects of intravenous dronedarone on electrocardiograms, hemodynamics and cardiac functions in anesthetized dogs. J. Vet. Med. Sci. 78, 177–186. doi: 10.1292/jvms.15-0413
Seki, A., Hagiwara, N., and Kasanuki, H. (1999). Effects of propafenone on K currents in human atrial myocytes. Br. J. Pharmacol. 126, 1153–1162. doi: 10.1038/sj.bjp.0702428
Shattock, M. J., Park, K. C., Yang, H.-Y., Lee, A. W. C., Niederer, S., Macleod, K. T., et al. (2017). Restitution slope is principally determined by steady-state action potential duration. Cardiovasc. Res. 113, 817–828. doi: 10.1093/cvr/cvx063
Singh, B. N., Singh, S. N., Reda, D. J., Tang, X. C., Lopez, B., Harris, C. L., et al. (2005). Amiodarone versus sotalol for atrial fibrillation. N. Eng. J. Med. 352, 1861–1872. doi: 10.1056/NEJMoa041705
Song, J.-S., Kim, J., Lim, B., Lee, Y.-S., Hwang, M., Joung, B., et al. (2019). Pro-arrhythmogenic effects of heterogeneous tissue curvature— a suggestion for role of left atrial appendage in atrial fibrillation —. Circ. J. 83, 32–40. doi: 10.1253/circj.CJ-18-0615
Syeda, F., Holmes, A. P., Yu, T. Y., Tull, S., Kuhlmann, S. M., Pavlovic, D., et al. (2016). PITX2 modulates atrial membrane potential and the antiarrhythmic effects of sodium-channel blockers. J. Am. Coll. Cardiol. 68, 1881–1894. doi: 10.1016/j.jacc.2016.07.766
Trayanova, N. A. (2014). Mathematical approaches to understanding and imaging atrial fibrillation: significance for mechanisms and management. Circ. Res. 114, 1516–1531. doi: 10.1161/CIRCRESAHA.114.302240
Ugarte, J. P., Tobón, C., Orozco-Duque, A., Becerra, M. A., and Bustamante, J. (2015). Effect of the electrograms density in detecting and ablating the tip of the rotor during chronic atrial fibrillation: an in silico study. Europace 17, 97–104. doi: 10.1093/europace/euv244
Varela, M., Colman, M. A., Hancox, J. C., and Aslanidi, O. V. (2016). Atrial heterogeneity generates re-entrant substrate during atrial fibrillation and anti-arrhythmic drug action: mechanistic insights from canine atrial models. PLoS Comput. Biol. 12:e1005245. doi: 10.1371/journal.pcbi.1005245
Wang, Z., Fermini, B., and Nattel, S. (1993). Mechanism of flecainide's rate-dependent actions on action potential duration in canine atrial tissue. J. Pharmacol. Exp. Ther. 267, 575–581.
Wegener, F. T., Ehrlich, J. R., and Hohnloser, S. H. (2006). Dronedarone: an emerging agent with rhythm- and rate-controlling effects. J. Cardiovasc. Electrophysiol. 17, 17–20. doi: 10.1111/j.1540-8167.2006.00583.x
Yue, L., Feng, J. L., Wang, Z., and Nattel, S. (2000). Effects of ambasilide, quinidine, flecainide and verapamil on ultra-rapid delayed rectifier potassium currents in canine atrial myocytes. Cardiovasc. Res. 46, 151–161. doi: 10.1016/S0008-6363(99)00430-7
Keywords: atrial fibrillation, modeling, antiarrhythmic drugs, PITX2, gene
Citation: Hwang I, Jin Z, Park J-W, Kwon O-S, Lim B, Hong M, Kim M, Yu H-T, Kim T-H, Uhm J-S, Joung B, Lee M-H and Pak H-N (2021) Computational Modeling for Antiarrhythmic Drugs for Atrial Fibrillation According to Genotype. Front. Physiol. 12:650449. doi: 10.3389/fphys.2021.650449
Received: 08 January 2021; Accepted: 22 March 2021;
Published: 13 May 2021.
Edited by:
Chae Hun Leem, University of Ulsan, South KoreaReviewed by:
Arun V. Holden, University of Leeds, United KingdomKi Moo Lim, Kumoh National Institute of Technology, South Korea
Copyright © 2021 Hwang, Jin, Park, Kwon, Lim, Hong, Kim, Yu, Kim, Uhm, Joung, Lee and Pak. This is an open-access article distributed under the terms of the Creative Commons Attribution License (CC BY). The use, distribution or reproduction in other forums is permitted, provided the original author(s) and the copyright owner(s) are credited and that the original publication in this journal is cited, in accordance with accepted academic practice. No use, distribution or reproduction is permitted which does not comply with these terms.
*Correspondence: Hui-Nam Pak, aG5wYWtAeXVocy5hYw==