
95% of researchers rate our articles as excellent or good
Learn more about the work of our research integrity team to safeguard the quality of each article we publish.
Find out more
ORIGINAL RESEARCH article
Front. Physiol. , 25 June 2021
Sec. Computational Physiology and Medicine
Volume 12 - 2021 | https://doi.org/10.3389/fphys.2021.644149
This article is part of the Research Topic Vascular Disease Multi-Scale Multi-Physics Modeling and Experimental Data View all 9 articles
 Andrew Tamis
 Corina S. Drapaca*
Nitric oxide (NO) is a small gaseous molecule that is involved in some critical biochemical processes in the body such as the regulation of cerebral blood flow and pressure. Infection and inflammatory processes such as those caused by COVID-19 produce a disequilibrium in the NO bioavailability and/or a delay in the interactions of NO with other molecules contributing to the onset and evolution of cardiocerebrovascular diseases. A link between the SARS-CoV-2 virus and NO is introduced. Recent experimental observations of intracellular transport of metabolites in the brain and the NO trapping inside endothelial microparticles (EMPs) suggest the possibility of anomalous diffusion of NO, which may be enhanced by disease processes. A novel space-fractional reaction-diffusion equation to model NO biotransport in the brain is further proposed. The model incorporates the production of NO by synthesis in neurons and by mechanotransduction in the endothelial cells, and the loss of NO due to its reaction with superoxide and interaction with hemoglobin. The anomalous diffusion is modeled using a generalized Fick’s law that involves spatial fractional order derivatives. The predictive ability of the proposed model is investigated through numerical simulations. The implications of the methodology for COVID-19 outlined in the section “Discussion” are purely exploratory.
Nitric oxide (NO) is a small gaseous molecule involved in crucial biochemical processes in the body, especially in the brain. Its relevance to human health can hardly be overestimated. In 1992, Koshland called NO “the molecule of the year” in the editorial of Science (Koshland, 1992), and in 1998, Furchgott, Ignarro, and Murad were awarded the Nobel Prize in Physiology or Medicine for its discovery (The Nobel Prize in Physiology or Medicine, 1998). A recent Google search of NO returned more than 35 million results. As the scientific knowledge of the body’s chemophysical processes expands, and technology advances, new discoveries of the role of NO continue to be made.
The major contribution of NO is to the signaling processes of the cardiovascular and nervous systems. In the brain, NO acts as a neuro-glial-vascular messenger regulating cerebral blood flow and the release of neurotransmitters (Moncada et al., 1991; Huang, 1999; Buerk et al., 2003; Ledo et al., 2005; Hall and Garthwaite, 2006; Barbosa et al., 2008; Attwell et al., 2010; Contestabile et al., 2012; Forstermann and Sessa, 2012; Santos et al., 2012; Garry et al., 2015; Helms et al., 2016; Mishra, 2017). Cerebral NO is produced by synthesis reactions within neurons (Forstermann and Sessa, 2012), by shear-induced mechanotransduction at the blood–endothelium interface (Sriram et al., 2016), in the choroid plexus (Garry et al., 2015), and the red blood cells (Helms et al., 2016). Diffusion and some specialized chemical processes [such as NO inactivation by hemoglobin and NO reaction with superoxide ()] contribute to the removal of NO from the brain (Helms et al., 2016). There are regions in the brain where the neuronal NO dominates, other regions where the neuronal and endothelial NO are produced in the same amount, and also regions (such as the hippocampus) where only endothelial NO is present (Dinerman et al., 1994). Experiments on knockout mice suggest that if the amount of neuronal (endothelial) NO is lower than expected, its functions could be performed by the endothelial (neuronal) NO (Huang, 1999). Although both the neuronal and endothelial NO are involved in vasomotor mechanisms (Metea and Newman, 2006; Attwell et al., 2010; Contestabile et al., 2012; Mishra, 2017), the endothelial NO is better known as a vasodilator throughout the entire cardiovascular system. In addition, endothelial NO inhibits leukocyte adhesion to the vascular walls and platelet aggregation (Huang, 1999).
Of particular interest this year is the involvement of NO in specific biochemical processes that could lead to the worrisome cardiovascular and neurological symptoms seen in some patients with COVID-19. The SARS-CoV-2 virus binds to the ACE2 protein (Sriram et al., 2020) causing a decrease in ACE2 bioavailability in the body. This decrease in ACE2 produces an increase in angiotensin II (Ang II), a multifunctional peptide hormone, which is followed by a cascade of adverse events, such as a decreased shear stress at the blood–endothelium interface and increased productions of endothelial microparticles (EMPs) and superoxide (Yan et al., 2003; Densmore et al., 2006; Chironi et al., 2009; Burger et al., 2013; Foley and Conway, 2016). Furthermore, the low shear stress and increased amount of superoxide also contribute to the formation of EMP. Not only that there will be less endothelial NO produced by the diminished shear stress but also the endothelial NO bioavailability will be reduced even more by the larger concentration of superoxide that rapidly reacts with the NO to form the peroxynitrite anion. The EMPs are very small fragments of the membrane of endothelial cells that are formed by the blebbing of the plasma membrane and discharged into the extracellular space where they can rapidly move to other sites. They entrap the endothelial NO and, thus, further contribute to the depletion of NO (Chironi et al., 2009; Leopold, 2020). These microparticles can also be formed and contribute to pathological and inflammatory processes of the cardiovascular system (Burger et al., 2013). Also, EMPs can increase the arterial stiffness (Chironi et al., 2009). Last, the feedback mechanism between Ang II and endothelial NO continues to increase the amount of Ang II as the concentration of endothelial NO decreases (Yan et al., 2003). A low amount of endothelial NO will lead to endothelial dysfunction and increased inflammation, thrombosis, and vascular damage. Furthermore, in the regions of the brain where neuronal NO and endothelial NO are both present, the neuronal NO may have to also provide the functions of the endothelial NO when not enough endothelial NO is available, which could cause neurological problems (Huang, 1999). Figure 1 shows a schematic of the abovedescribed link between the SARS-CoV-2 virus and the endothelial NO. The work presented in this article is the first step in building a mathematical model for the mechanism presented in Figure 1.
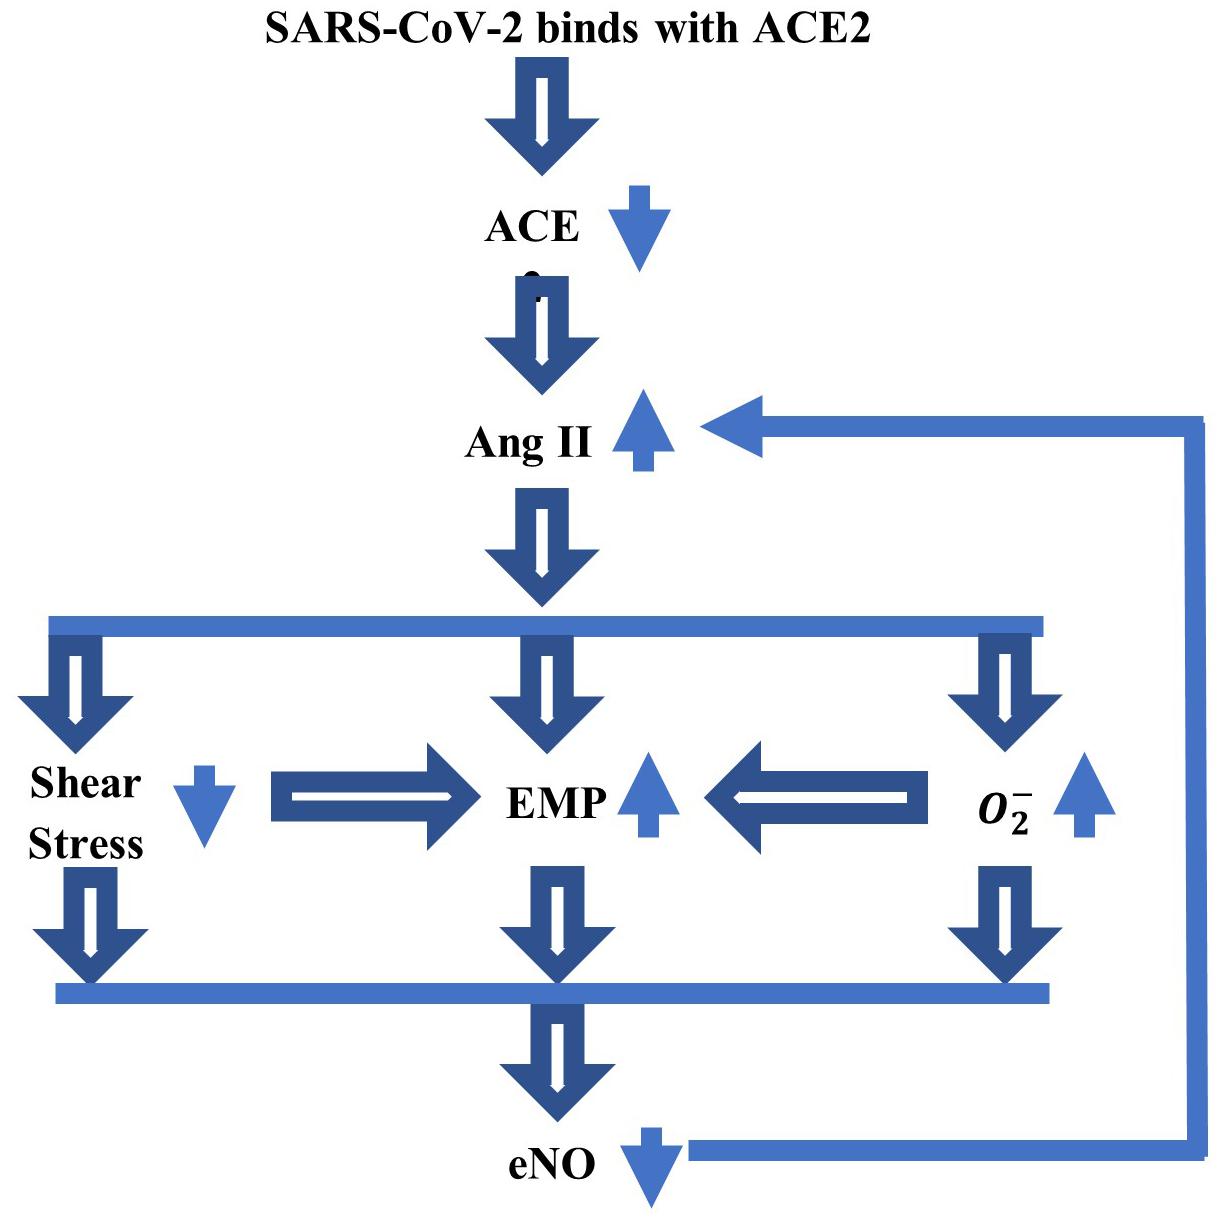
Figure 1. A schematic of the link between SARS-CoV-2 virus and endothelial nitric oxide (NO), which could explain some of the serious cardiovascular and neurological symptoms experienced by a part of patients with COVID-19. The binding between the coronavirus and ACE2 reduces the ACE2 bioavailability, which further increases the amount of Ang II. This increase will lower the shear stress at the blood–endothelium interface and increase the amounts of superoxide () and endothelial microparticles (EMP). The low shear stress and elevated also contribute to the increase in EMP. A decrease in the concentration of endothelial NO (eNO), thus, follows. The feedback mechanism between Ang II and eNO reduces the amount of eNO still further.
Mathematical models of NO spatiotemporal dynamics can provide important insights into the role played by NO in the cardiovascular and brain’s functions (Vaughn et al., 1998a, b; Buerk, 2001; Kavdia et al., 2002; Hall and Garthwaite, 2006; Drapaca and Tamis, 2019; Tamis and Drapaca, 2021). In particular, the reaction–diffusion equation of NO proposed in Drapaca and Tamis (2019) and Tamis and Drapaca (2021) models NO biotransport in the brain and, thus, incorporates terms for the production and decay of both endothelial and neuronal NO. The shear-induced production of endothelial NO is assumed to be proportional to the concentration of endothelial NO with the production rate given by the viscous dissipation at the blood–endothelium interface. The viscous dissipation is calculated from mechanical models of blood flow and vascular wall deformability [for instance, in Drapaca and Tamis (2019), the blood flow is Poiseuille, and the vascular wall is rigid, while in Tamis and Drapaca (2021), the viscoelastic wall is subjected to pulsatile blood flow]. The production of neuronal NO is assumed to be constant, and only the NO decay due to the hemoglobin is considered.
In this article, a novel space-fractional reaction–diffusion equation for the NO biotransport in the brain is proposed. The model assumes anomalous diffusion of NO, which could be enhanced by the presence of pathology. The trapping of NO by EMP mentioned above supports the assumption of anomalous diffusion (subdiffusion) of NO at least in pathological conditions (in normal conditions, the anomalous diffusion of endogenous intracellular metabolites in the brain observed in vivo using medical imaging techniques (Marchadour et al., 2012) could suggest a similar diffusive behavior for the NO, which is known to modulate the transport of some of these metabolites (Raju et al., 2015)). In this model, the presence of EMP will be represented by the anomalous diffusion of NO. Anomalous diffusion in various engineering and biological systems has been successfully modeled using fractional calculus (Metzler and Klafter, 2004; Kim and Kavvas, 2006; Klages et al., 2008; Magin et al., 2008, 2013; Tarasov, 2010; Zhou et al., 2010; Dumitru et al., 2012; West, 2016, 2017; Liang et al., 2017; Drapaca, 2021), and thus, spatial derivatives of a fractional order of 0 < ε < 1 will be used in this mathematical model. The link between anomalous diffusion and fractional-order derivatives is based on the interpretation of anomalous diffusion as a Lévy flight process: the jump length probability density function (PDF) of a Lévy flight is a power law of exponent −(ε + 1) (the classic Gaussian distribution is recovered for ε = 1) and is solution to a space-fractional differential equation [see for instance, theorem 6.14 in Dumitru et al. (2012)]. In this article, left- and right-sided fractional Riemann–Liouville derivatives of order ε model bidirectional diffusion. Two probabilities, p, q ≥ 0 with p + q = 1, for forward and, respectively, backward diffusional directions are introduced to model NO distribution skewness (Kim and Kavvas, 2006). The production of neuronal NO is assumed to be time dependent so that it matches the kinetics of Ca2+-calmodulin binding (Hall and Garthwaite, 2006), while the shear-induced production of endothelial NO is calculated as in Tamis and Drapaca (2021). Thus, the vascular wall is assumed to be a homogeneous, Maxwell linear viscoelastic material subjected to the heart pulsations (Hodis and Zamir, 2008; Tamis and Drapaca, 2021). Last, the model incorporates the NO decay due to hemoglobin and NO reaction with superoxide. The proposed equation is solved numerically using the numerical scheme proposed in Sousa (2009). Numerical simulations show the effects of anomalous diffusion, increased vascular stiffness, and increased amount of superoxide on the spatiotemporal distribution of NO concentration. The results suggest the existence of a narrow range of values of ε near 0.85 where a maximum value of the NO concentration at the endothelium is reached that decreases with an increase in vascular stiffness and/or a rise in the amount of superoxide. Also, the results show an increase in the distribution skewness of the NO at the endothelium for ε in the same range. Thus, the model reveals the existence of a characteristic jump length distribution where the spatial correlation (nonlocality) of NO particles happens due to a critical (possibly elevated) quantity of EMP present such that, when combined with a preferred forward diffusional direction, a significant decrease in the NO concentration at the vascular wall occurs in the presence of an increased vascular stiffness and amount of superoxide. Given the functional interplay and feedback mechanism between Ang II and endothelial NO (Chironi et al., 2009; Leopold, 2020), any untreated disease that produces an increase in the amount of Ang II above a healthy threshold (such as possibly COVID-19, diabetes, and cardiovascular and neurodegenerative diseases) will lead, in time, to an increase in both vascular rigidity and concentration of superoxide, whose combined contribution to the decrease in the NO concentration will ultimately cause endotheliopathy. The proposed model predicts this behavior in the presence of the anomalous diffusion of NO with ε = 0.85. Also, according to Hall and Garthwaite (2006), physiological concentrations of NO are in the low nM (or 10−6 mol/m3) range. The model with classic diffusion (ε = 1) predicts maximum NO concentrations at the vascular wall in the low pM range, while the analogous values for ε < 1 belong to the physiological range. Last, given how small these concentrations are even in a healthy state, it may be difficult to measure/estimate them in human subjects. For ε = 0.85, the model found a maximum NO concentration at the wall corresponding to a vascular wall stiffness and amount of superoxide within normal ranges. This information could be used not only for noninvasively imaging the NO in vivo but also for controlled drug delivery (see section “Discussion”).
The structure of the article is as follows. The mathematical model is presented in the section “Mathematical Model,” while the corresponding numerical scheme is given in the section “Numerical Scheme.” Numerical simulations are shown in the section “Results,” which is followed by a section “Discussion.” The article ends with a section “Conclusion and Future Work.”
The geometric domain is made of concentric horizontal axial symmetric circular cylinders (Figure 2). The lumen occupies a cylinder of radius a. The endothelium is a layer of thickness h, and other vascular structures and the extracellular space fill a region of thickness d. Last, a group of neurons occupies a region of thickness g. The geometric assumptions imply spatial variations of NO in the radial direction only. Cylindrical coordinates are used with x, the axial coordinate along the horizontal direction, and r ∈ [0, a + h + d + g], the radial coordinate along the radial direction (due to axial symmetry, there is no dependency on the angular coordinate, and thus, this coordinate is neglected).
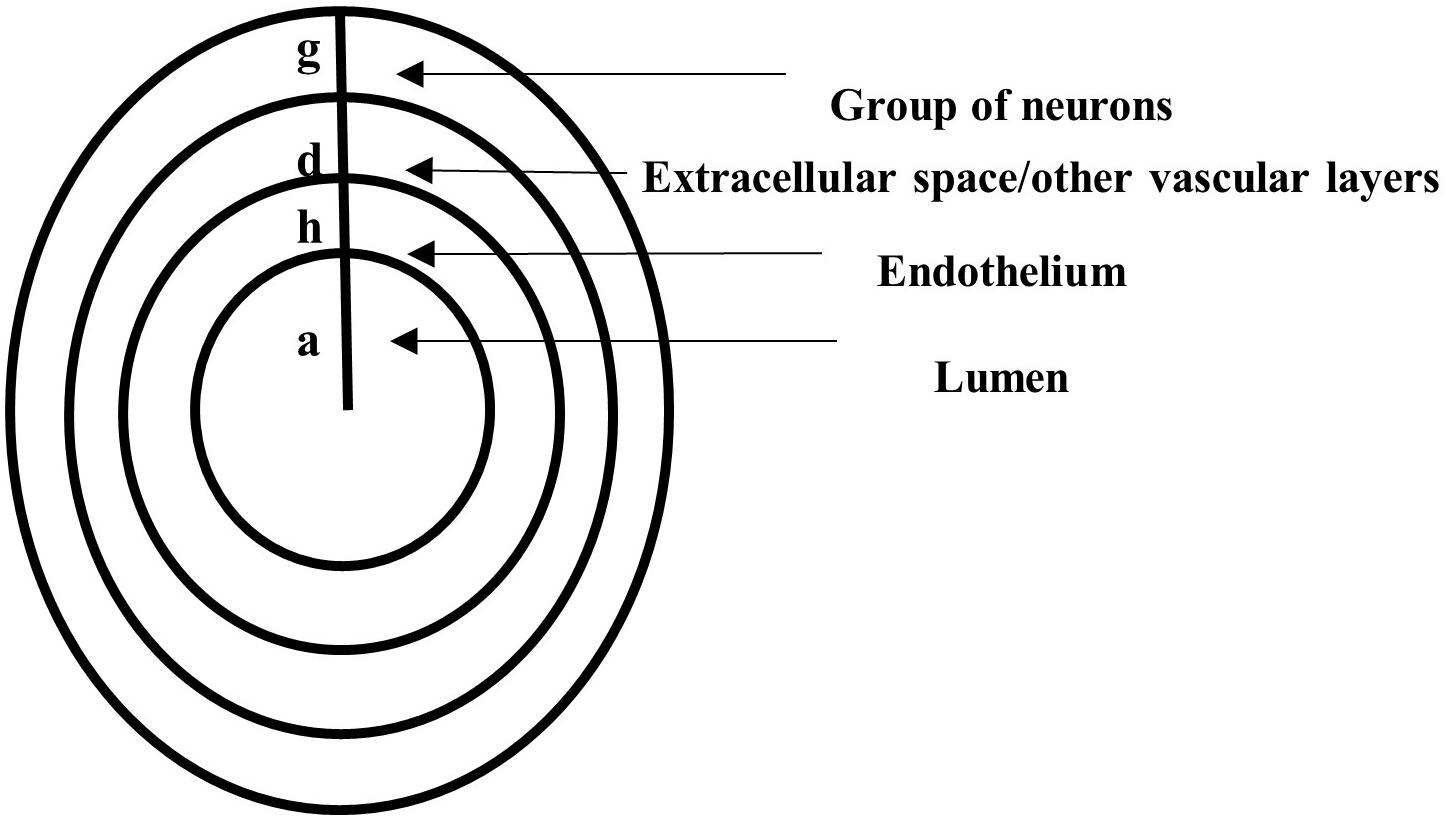
Figure 2. A vertical cross-section through concentric horizontal axial symmetric circular cylinders representing the lumen of radius a, the endothelium of thickness h, a region of thickness d filled with other vascular layers and extracellular space, and a layer of thickness g occupied by neurons.
As in Drapaca and Tamis (2019) and Tamis and Drapaca (2021), it is assumed that the radial diffusion of NO happens in the entire domain r ∈ [0, a + h + d + g]. NO is produced in the region r ∈ [a, a + h]∪[a + h + d, a + h + d + g], and NO decay due to nondiffusional biochemical processes happens in the region r ∈ [0, a]∪[a + h, a + h + d + g]. The mathematical model expresses the balance law of mass for the concentration of NO, CNO:
Above, H denotes the Heaviside function.
Equation (1) is solved numerically (see later) with zero initial conditions and zero Dirichlet boundary conditions:
The right-hand side terms of equation (1) are as follows. The diffusion flux F(r, t) is given by the generalized Fick’s law describing anomalous (or nonlocal) diffusion [see for instance, Kim and Kavvas (2006), for a derivation of this law]:
In formula (3), DNO is a generalized diffusion coefficient, 0 < ε ≤ 1 is a parameter that measures the amount of long-range spatial correlation of NO particles, and p, q ≥ 0 are probabilities of moving in the forward and, respectively, in the backward diffusional direction. Probabilities p, qsatisfy the constraint p + q = 1. By definition, the left- and right-sided Riemann–Liouville fractional derivatives of order ε with 0 < ε ≤ 1 are [see for example, Metzler and Klafter (2004) and references within]:
where, is the gamma function. The following notations are used throughout the article: L = 0, R = a + h + d + g. For ε = 1, the Riemann–Liouville fractional-order derivatives (4) and (5) become the first-order derivative, and in this case, p = q = 1/2, and formula (3) reduces to the classic Fick’s law.
The second term of the right-hand side of equation (1) represents the time-dependent production by synthesis of the neuronal NO for r ∈ [a + h + d, a + h + d + g], which was proposed in Hall and Garthwaite (2006). Parameter v_1 is the maximum production rate, and parameters k_1 and k_2 are chosen to match the kinetics of Ca2+-calmodulin binding.
The third, fifth, and sixth terms of the right-hand side of equation (1) represent the NO decay due to various inactivation processes. The inactivation of NO achieved through processes independent of hemoglobin, and superoxide is characterized by vmax, the maximum rate at saturating concentration in the region r ∈ [a + h, a + h + d + g], and Kmax, the NO concentration at which the reaction rate is in the same region. The decay of NO due to blood’s hemoglobin happens at constant rate λ in the region r ∈ [0, a]. The removal of NO due to its reaction with the superoxide is assumed to happen at constant rate in the region r ∈ [a + h, a + h + d]. The region where the reaction between NO and superoxide takes place was chosen based on experimental observations suggesting that there is very little amount of superoxide inside the cells (less than 100 pM), and thus, this reaction is unlikely to happen intracellularly (Ganesana et al., 2012).
Last, the fourth term of the right-hand side of equation (1) models the production via shear-induced mechanotransduction of the endothelial NO for r ∈ [a, a + h], which was proposed in Tamis and Drapaca (2021). The production rate is assumed to be proportional to the viscous dissipation at the blood–endothelium interface , where σrx and εrx are the shear stress and, respectively, the infinitesimal strain of the endothelium, and τW = σrx(a, t). As in Tamis and Drapaca (2021), the endothelium is assumed to be a homogeneous, Maxwell linear viscoelastic material exposed to the pulsatile blood flow at r = a and tethered at r = a + h. Thus, the constitutive equation of the viscoelastic endothelium is:
where, E is the modulus of elasticity, and μ is the viscosity of the endothelium. The expressions of σrx and εrx are derived from the analytic solution to the following boundary value problem (Hodis and Zamir, 2008):
Where, γ = , ξ(r, t) is the axial displacement of the endothelium, ρ is its mass density, ω, and ξ0 are the angular frequency and, respectively, amplitude of the applied oscillations. Thus (Tamis and Drapaca, 2021):
with:
Replacing formula (3) in the first term of the right-hand side of equation (1), and using the product rule for first-order derivatives and the fact that , give:
Equation (1) combined with expressions (6) (its real part) and (7), together with the initial and boundary conditions (2), is solved numerically using MATLAB (Matlab, 2020).
Numerical discretization schemes of the Riemann–Liouville fractional derivatives in formula (7) are given next. There exist numerous numerical schemes for fractional-order operators and a comprehensive review of them can be found in Cai and Li (2020). The classic finite difference schemes used, for instance, in Sousa (2009) are used here. Let L = r0 < r1 < … < rN−1 < rN = R be an equally spaced discretization of the interval [L, R] of constant step size Δr = (R − L)/N. The spatial fractional derivatives of order 0 < ε ≤ 1 at nodes rk, k = 1,…, N − 1 are approximated using the right and left classic Grünwald–Letnikov formulas:
The right- and left-shifted Grünwald–Letnikov formulas are used to approximate the spatial fractional derivatives of order 1 < ε + 1 ≤ 2 at nodes rk, k = 1,…, N − 1 since these give a stable numerical scheme:
In formulas (8)–(11), the following notations are used:
The Grünwald–Letnikov approximations have an error of order Δr2. Formulas (8)–(11) highlight the nonlocal effect of the fractional-order derivatives: the numerical approximations of these derivatives at the node rk do not involve only the neighborhood nodes rk–1 and rk+1 but also farther away nodes.
Formulas (8)–(11) can be rewritten in matrix form by changing the indexes of the terms in the sums of these formulas. Thus, the numerical discretization of formula (7) at nodes rk, k = 1,…, N − 1 is:
Where:
For ε = 1, the left-hand side of formula (12) becomes the Laplace operator, which admits only three numerical approximations: a forward finite difference scheme for p = 1, q = 0, a backward finite difference scheme for p = 0, q = 1, and a central finite difference scheme for p = q = 1/2.
By writing equation (1) at the nodes rk, k = 1,…, N − 1 and using scheme (12), a system of ordinary differential equations is obtained that is solved numerically using MATLAB’s built-in function ode15s. The system is solved using the non-negative option of ode15s since negative values of CNO are unphysical.
The parameters used in the numerical simulations are given in Table 1. Numerical simulations show the effects of parameters , and γ on the spatiotemporal distribution of NO concentration. According to Hodis and Zamir (2008), a healthy vascular wall is characterized by γ = 0.1 ÷ 0.25 and E = 6 × 10³ N/m. The wall loses its viscoelasticity and becomes more rigid as both mechanical parameters, and E, increase. The endothelium is assumed to be slightly more elastic, and thus, the values γ = 0.75 and E = 6 × 10³ N/m are used in the numerical simulations. The values for a rigid vascular wall proposed in Hodis and Zamir (2008) are E = 6 × 10⁴ N/m and γ = 1.25, and they are used to investigate how the NO concentration at endothelium changes with increased vascular stiffness in the presence of anomalous diffusion. The rate is calculated by the following formula:
where, the reaction rate is (Akaike and Maeda, 2000), and the concentration of superoxide in the extracellular space is in normal conditions and about in ischemic conditions (Ganesana et al., 2012). However, since the superoxide is scavenged by the high concentrations of superoxide dismutase (SOD) (Hall and Garthwaite, 2006), only half of the concentrations of superoxide mentioned above are assumed to react with NO, and the corresponding rates are, thus, calculated (see Table 1). The value is used to investigate how an increased amount of superoxide influences the NO concentration at the endothelium in the presence of anomalous diffusion. The numerical simulations use a space step size Δr = 1.15 × 10⁻⁷ (300 nodes) and a time step size Δt = 0.0251 (400 time points).
Figure 3 shows the results for the case ε = 1, p = q = 0.5 and various values of E, γ, and . The production of neuronal NO is bigger than the one at the endothelium, and this can be seen in Figures 3A,C,E,G. When the concentration of superoxide is increased (larger ), the model predicts a bigger decrease in the NO concentration at the endothelium (Figures 3F,H) than when the amount of superoxide is normal (Figure 3B). However, when the stiffness of the vascular wall increases, the production of the endothelial NO increases, and the model predicts an increase in the concentration of NO at the endothelium (Figures 3C,D). Thus, without accounting for a mechanism for increasing vascular stiffness (such as spatial correlation of NO particles due to the presence of EMP), the model cannot predict the decrease in NO concentration due to elevated vascular stiffness mentioned in the literature (Chironi et al., 2009). Also, in this case, the maximum NO concentrations at the vascular wall are in the low pM range, which are smaller than physiological values that, according to Hall and Garthwaite (2006), are in the low nM range.
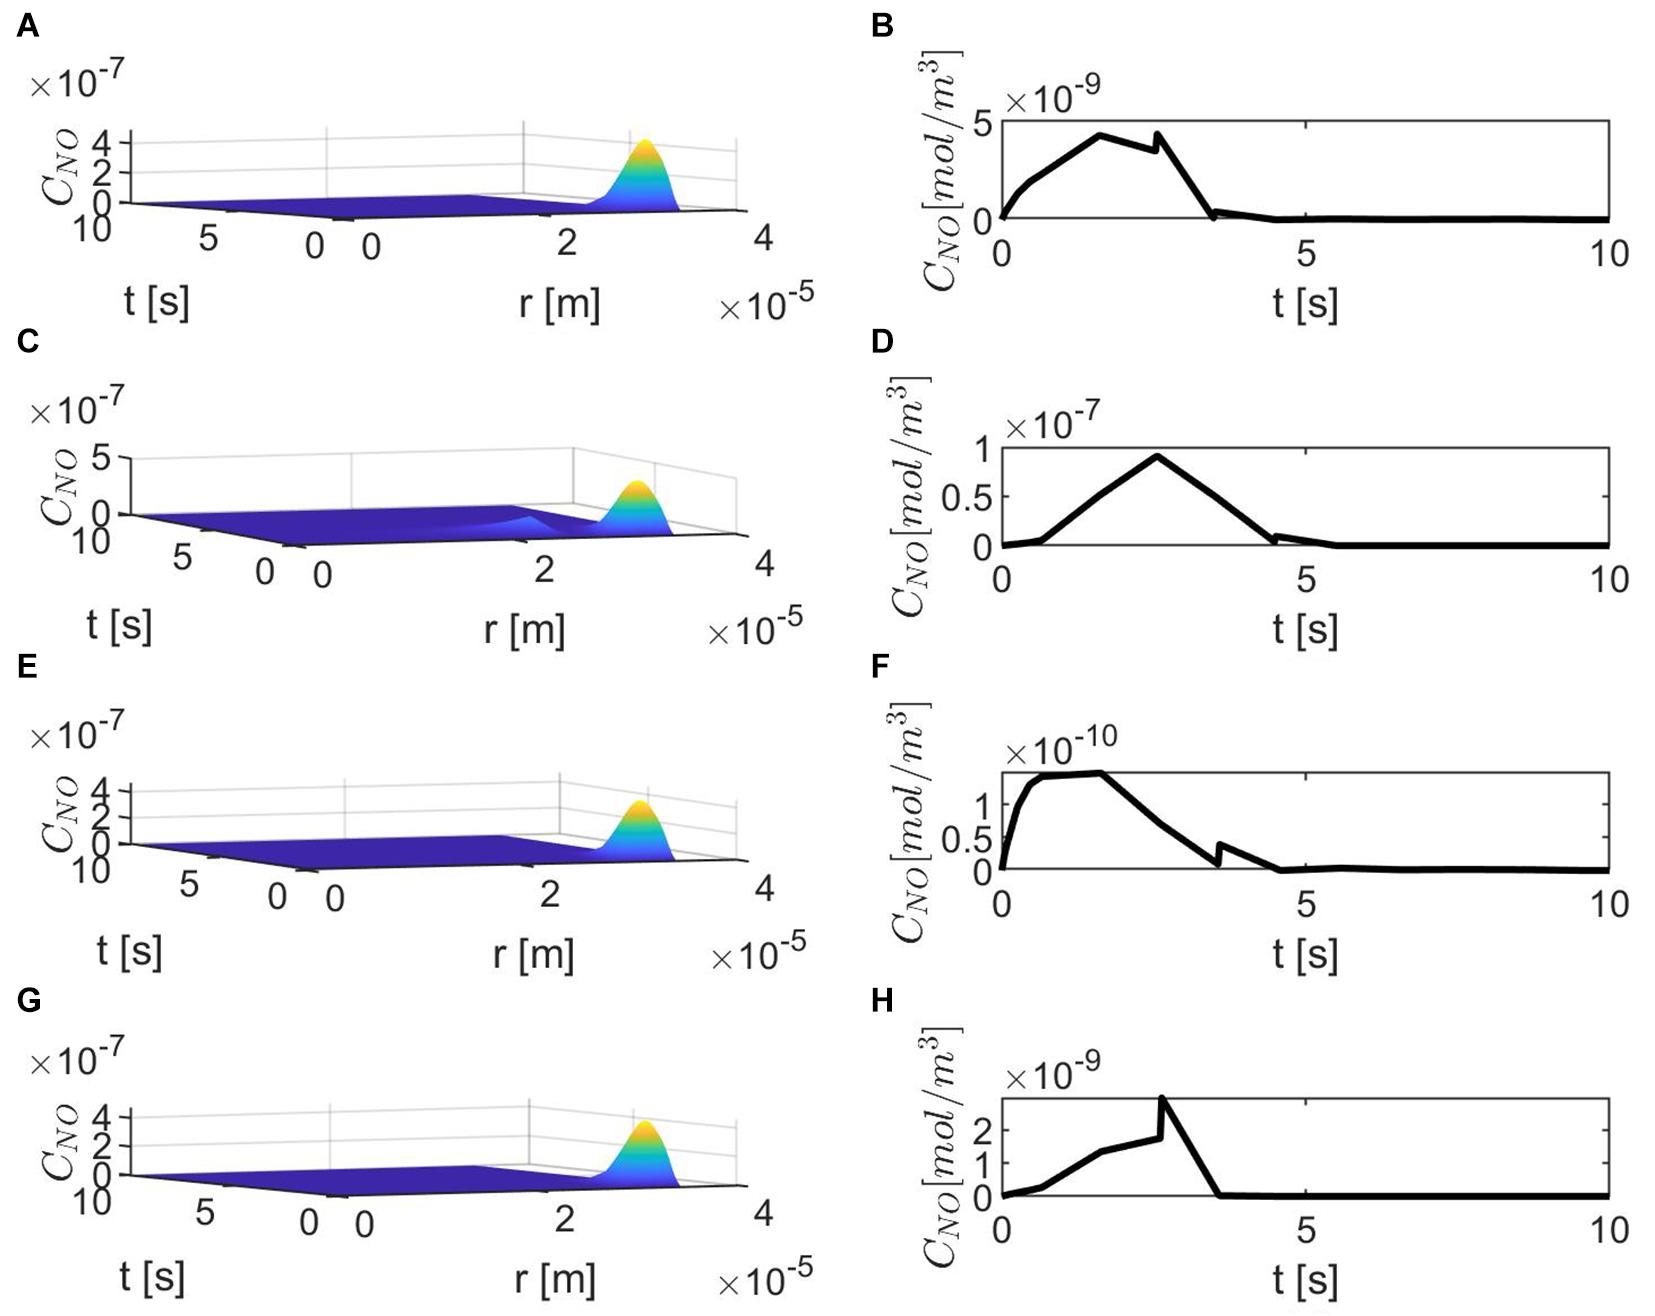
Figure 3. Spatiotemporal variations of CNO (A,C,E,G) and its corresponding temporal profiles at r = a + h, the outer boundary of the endothelium, (B,D,F,H) for ε = 1, p = q = 0.5, (A,B) , (C,D) , (E,F) and (G,H)
Figure 4 shows temporal profiles of the NO concentration for various values of ε, p, q when the values of E, γ, and are kept fixed at their values in normal conditions. As expected, in the case ε = 1, the forward (p = 1, q = 0), backward (p = 0, q = 1), and center (p = q = 0.5) finite differences give the same result (Figure 4A). As ε decreases, an increase in the distribution skewness of the NO at the endothelium is observed (Figures 4B–F). For values of ε away from 0.85, the NO concentration at the endothelium increases as p decreases from 1 to 0 (or q increases from 0 to 1) within the first 4 s (Figures 4B,D–F). For ε close to 0.85, a maximum skewness distribution is observed (Figure 4C). Last, as ε decreases from 1 to 0, the NO concentration at endothelium increases until ε is close to 0.85 and then decreases (Figures 4A–F, 5). Figure 5 also shows that as ε decreases to 0.85, the peak of the NO concentration becomes slightly delayed in time for fixed p and q. These results suggest that for ε near 0.85, there is enough NO present in the endothelium and an adequate amount of EMP available such that changes in the NO concentration due to a stiffer vascular wall and/or larger quantity of superoxide can be observed.
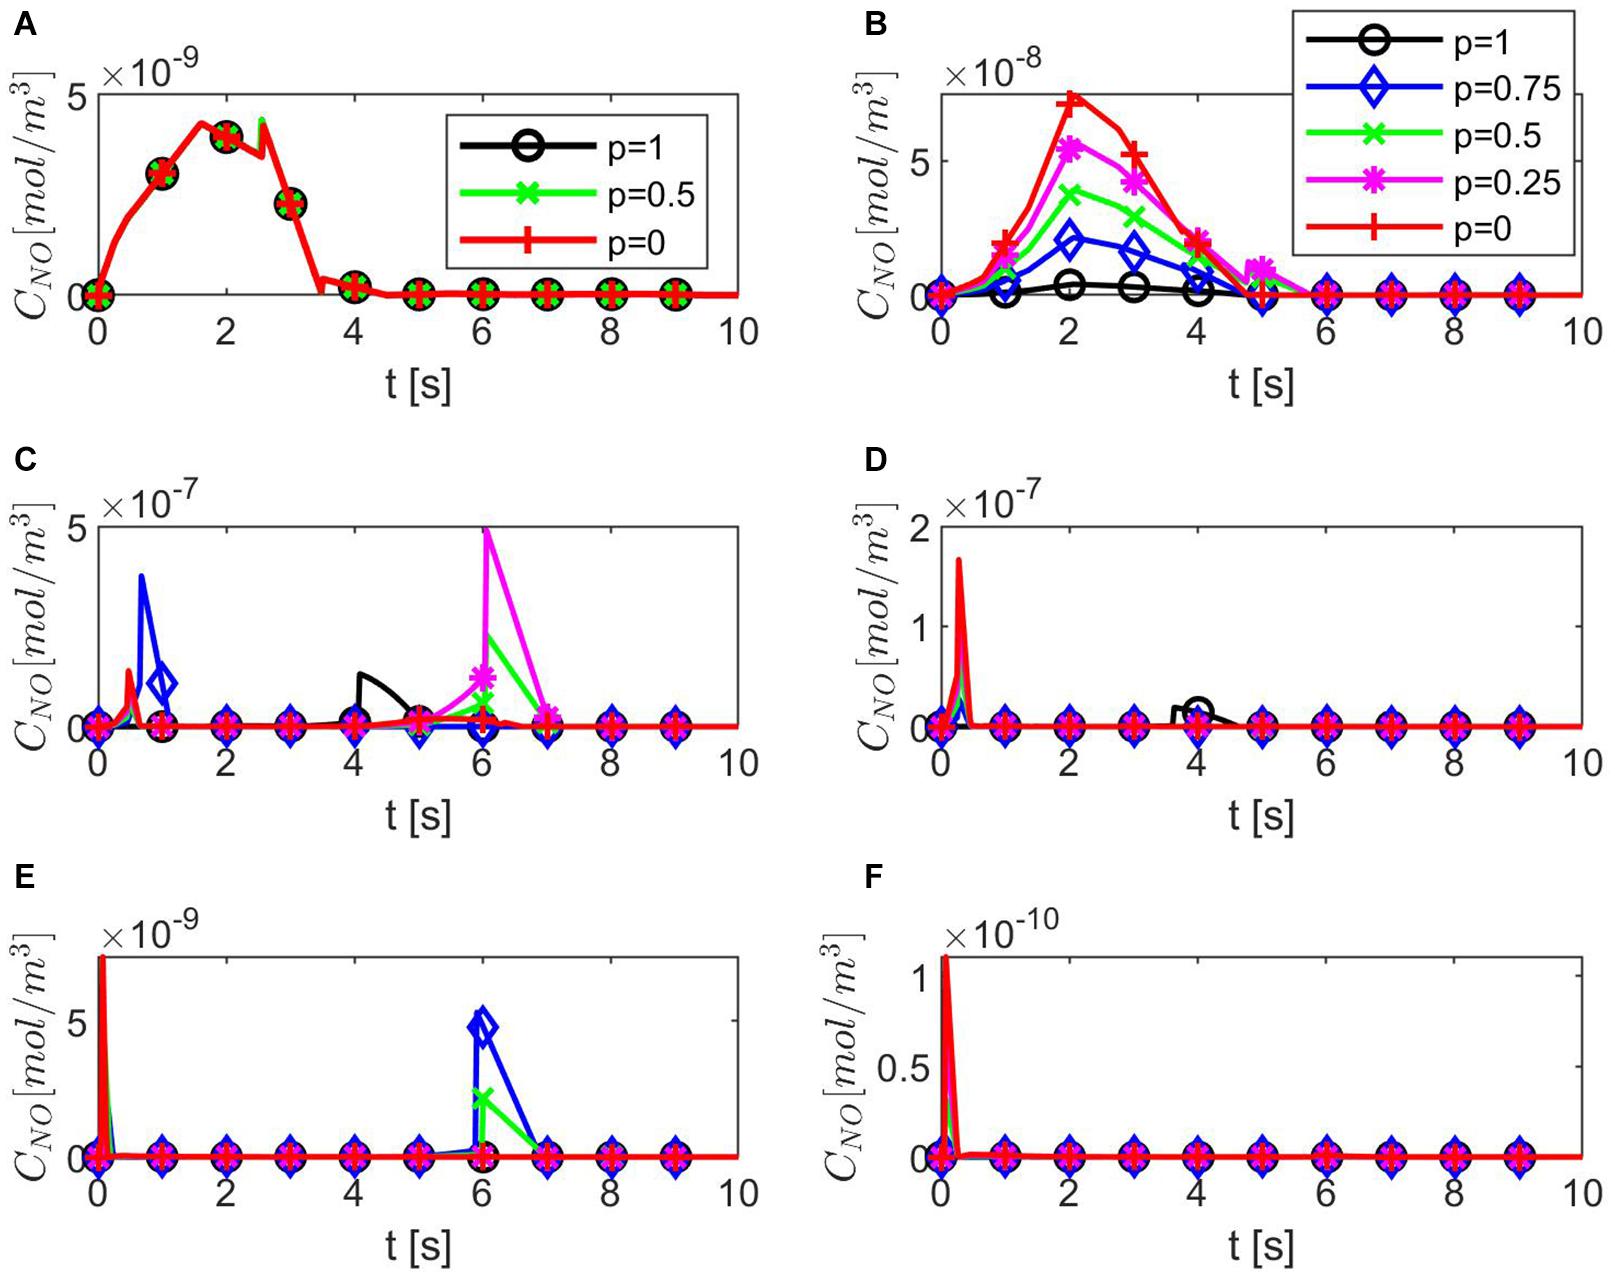
Figure 4. Temporal profiles of CNO at r = a + h, the outer boundary of the endothelium, for (A) ε = 1, (B) ε = 0.95, (C) ε = 0.85, (D) ε = 0.75, (E) ε = 0.5, and (F) ε = 0.25 and various values for p and q = 1 − p (B–F have the same legend shown in B). Here
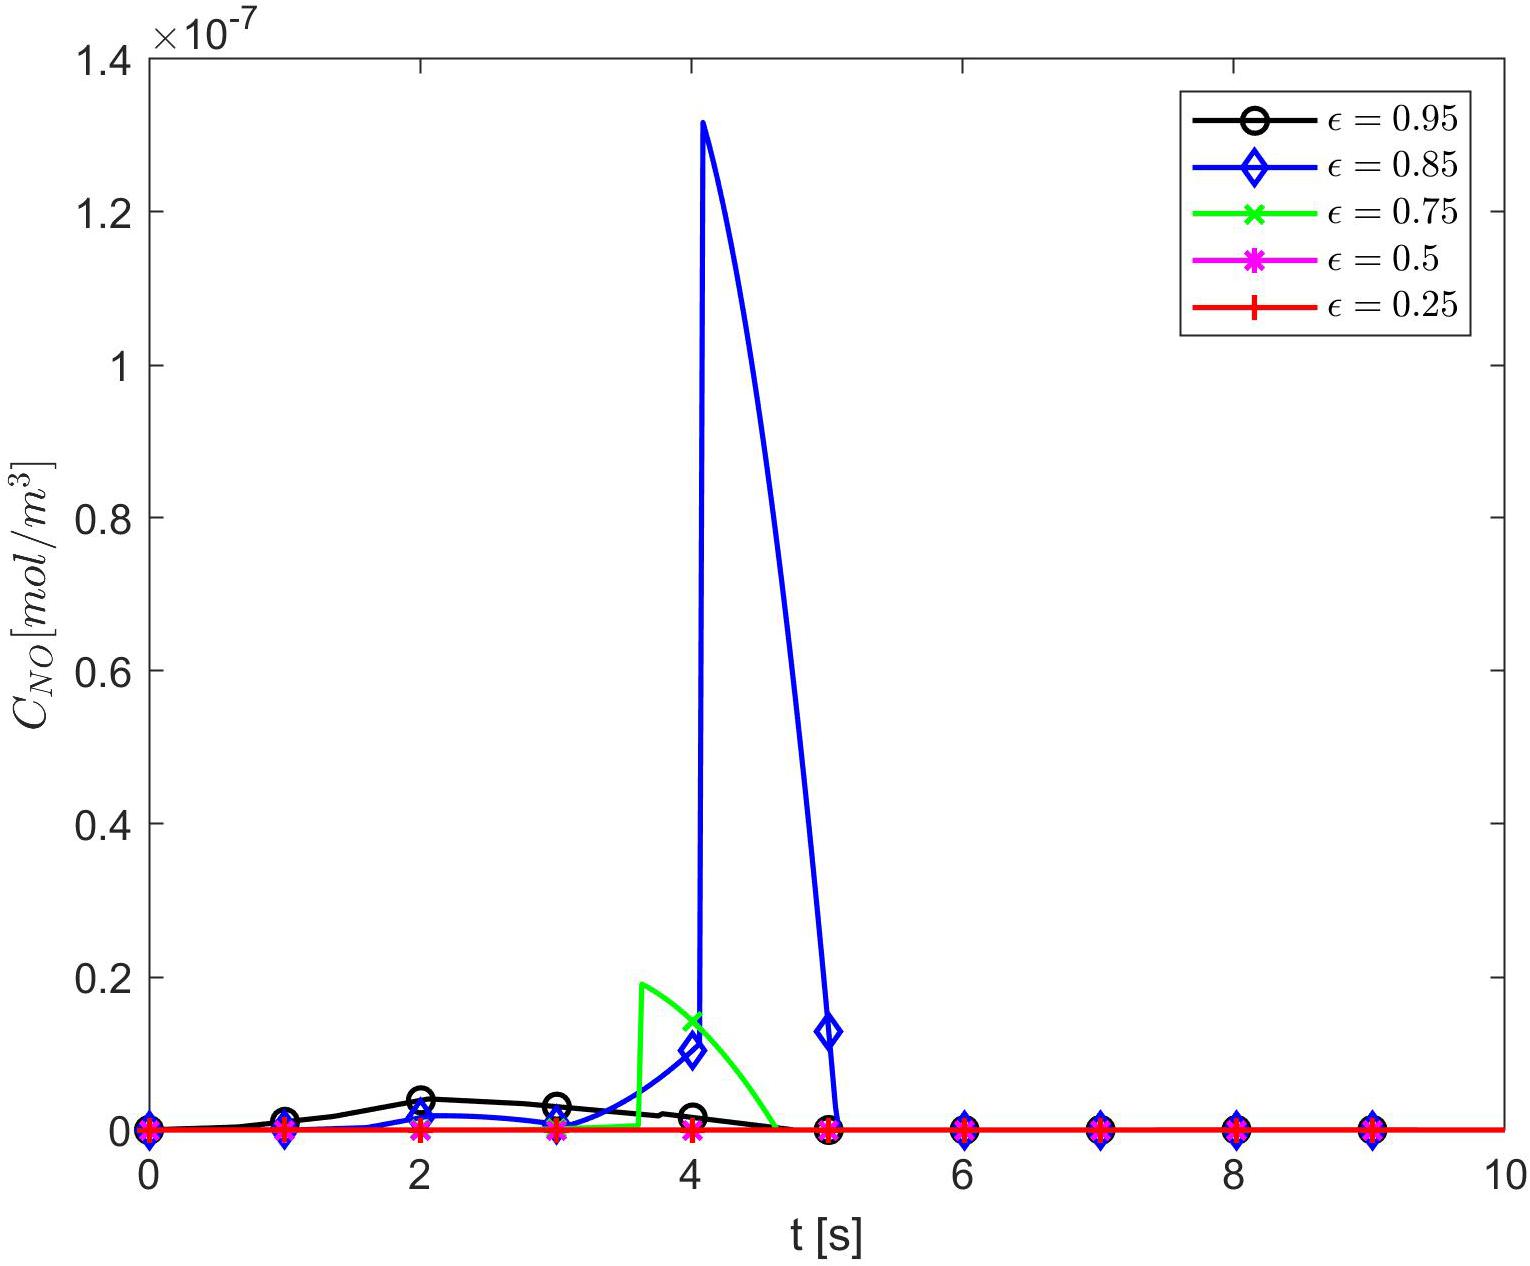
Figure 5. Temporal profiles of CNO at r = a + h, the outer boundary of the endothelium, for p = 1 (q = 0) and various values of ε. Here
Figures 6–8 show the results for ε = 0.85, two values for p (0.75 and 0.25), and various values for E, γ, and . In this case, the spatiotemporal variations of the NO concentration show again the highest production of NO happening at the neuronal site (Figures 7, 8). By comparison, the peaks of the NO concentration at the endothelium happen within the same time interval but have narrower shapes. In the case p = 0.25, q = 0.75, and values for E, γ, and corresponding to normal conditions, the NO concentration at the endothelium has two peaks, with the highest happening later than the peak in the NO concentration at the neuronal site (Figure 8A). For larger values of E, γ (stiffer vascular wall), the maximum values of the NO concentration for the two cases p = 0.25, q = 0.75 and p = 0.75, q = 0.25 decrease (Figures 6–8). Also, in this scenario, the maximum value of the NO concentration for p = 0.25, q = 0.75 is lower than the one for p = 0.75, q = 0.25 (Figures 6, 7B, 8B). Figures 6, 7C, 8C show also lower maximum values of the NO concentration at the endothelium for a larger value of (bigger amount of superoxide). However, in this scenario, the maximum value of the NO concentration, for p = 0.25, q = 0.75, is higher than the one for p = 0.75, q = 0.25 (Figure 6). In the presence of stiffer vascular wall and larger amount of superoxide, the model predicts a decrease in the NO concentration at the endothelium in both cases (p = 0.25, q = 0.75 and p = 0.75, q = 0.25) (Figures 6, 7D, 8D). Interestingly, the delayed, second higher peak in the NO concentration at the endothelium happening in the case p = 0.25, q = 0.75 disappears for larger values of E, γ, and/or . Thus, all the peaks of the NO concentration at the endothelium happen fast within the first 2 s, and only in the case when the diffusion of NO in the backward direction is stronger (the case p = 0.25, q = 0.75) and the values of E, γ, and correspond to normal conditions will a delayed second and higher peak be observed. Last, by comparing Figures 6A,B, it appears that the case p = 0.75, q = 0.25 predicts the lowest NO concentration when both the amount of superoxide and the wall’s stiffness are higher.
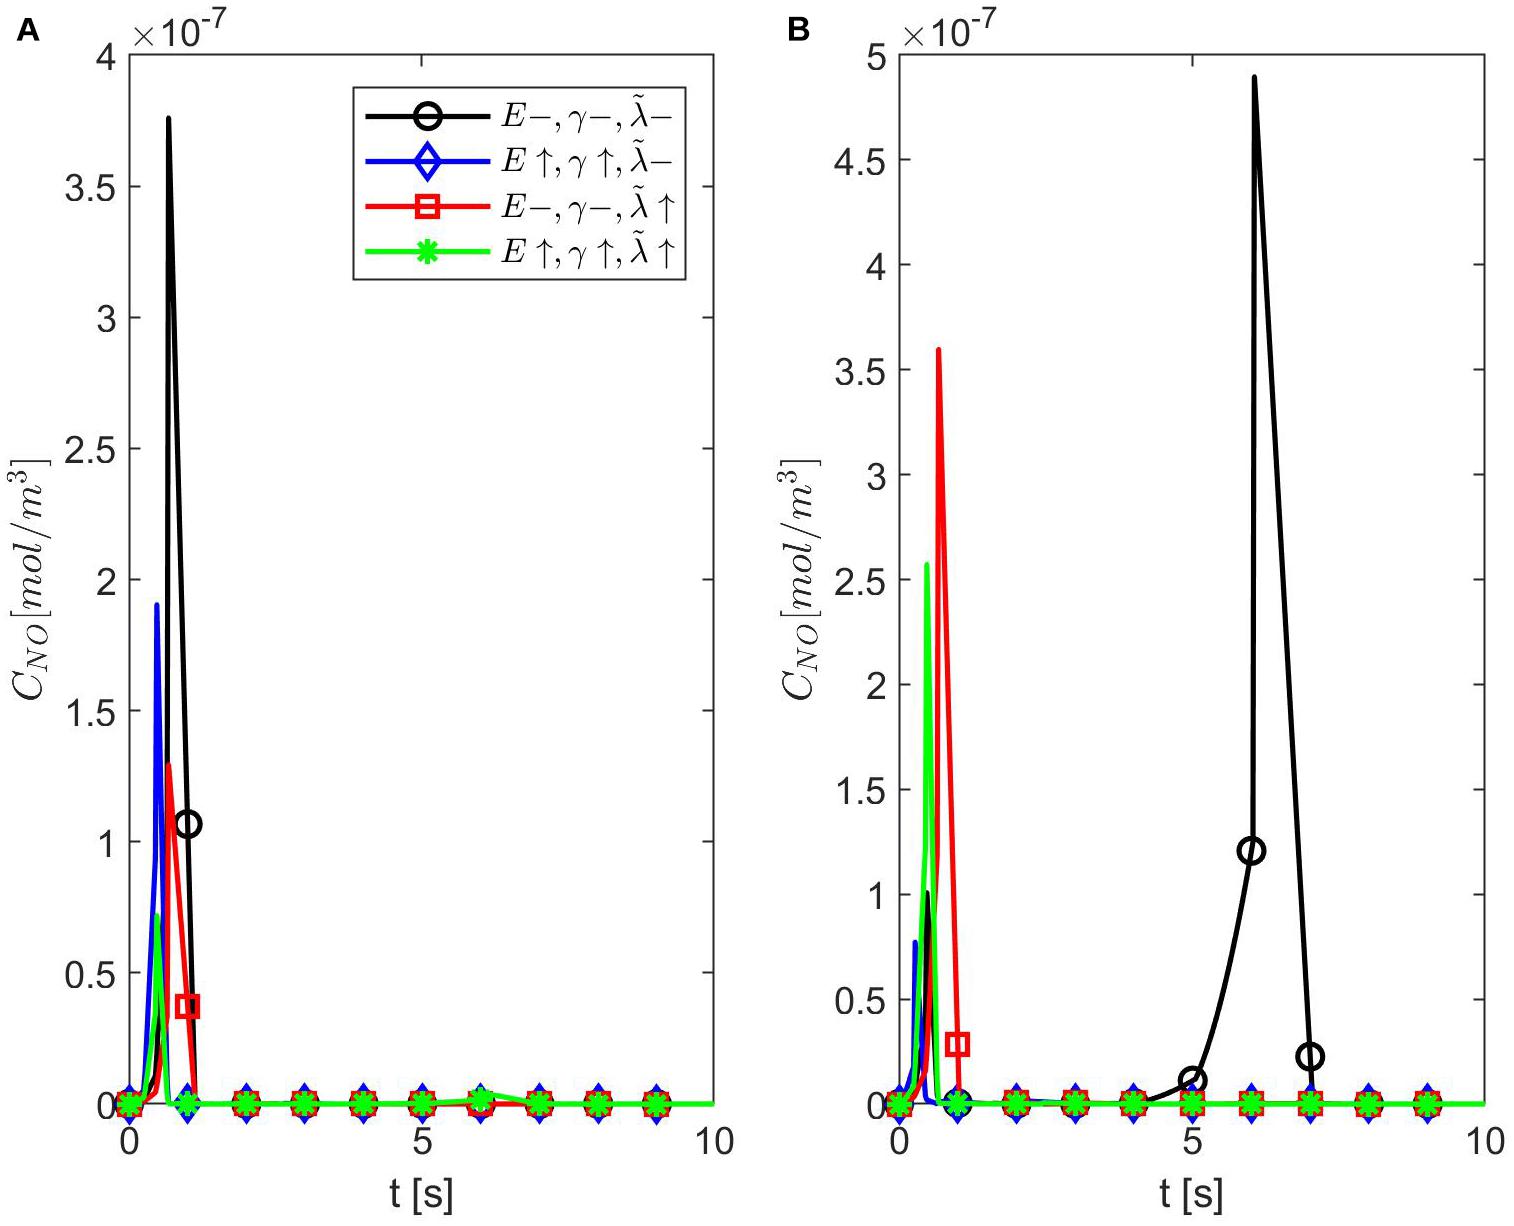
Figure 6. Temporal profiles of CNO at r = a + h, the outer boundary of the endothelium, for ε = 0.85, (A) p = 0.75 (q = 0.25), and (B) p = 0.25 (q = 0.75) (A,B have the same legend shown in A). Here (black circle symbol), (blue diamond symbol), (red square symbol), and (green star symbol).
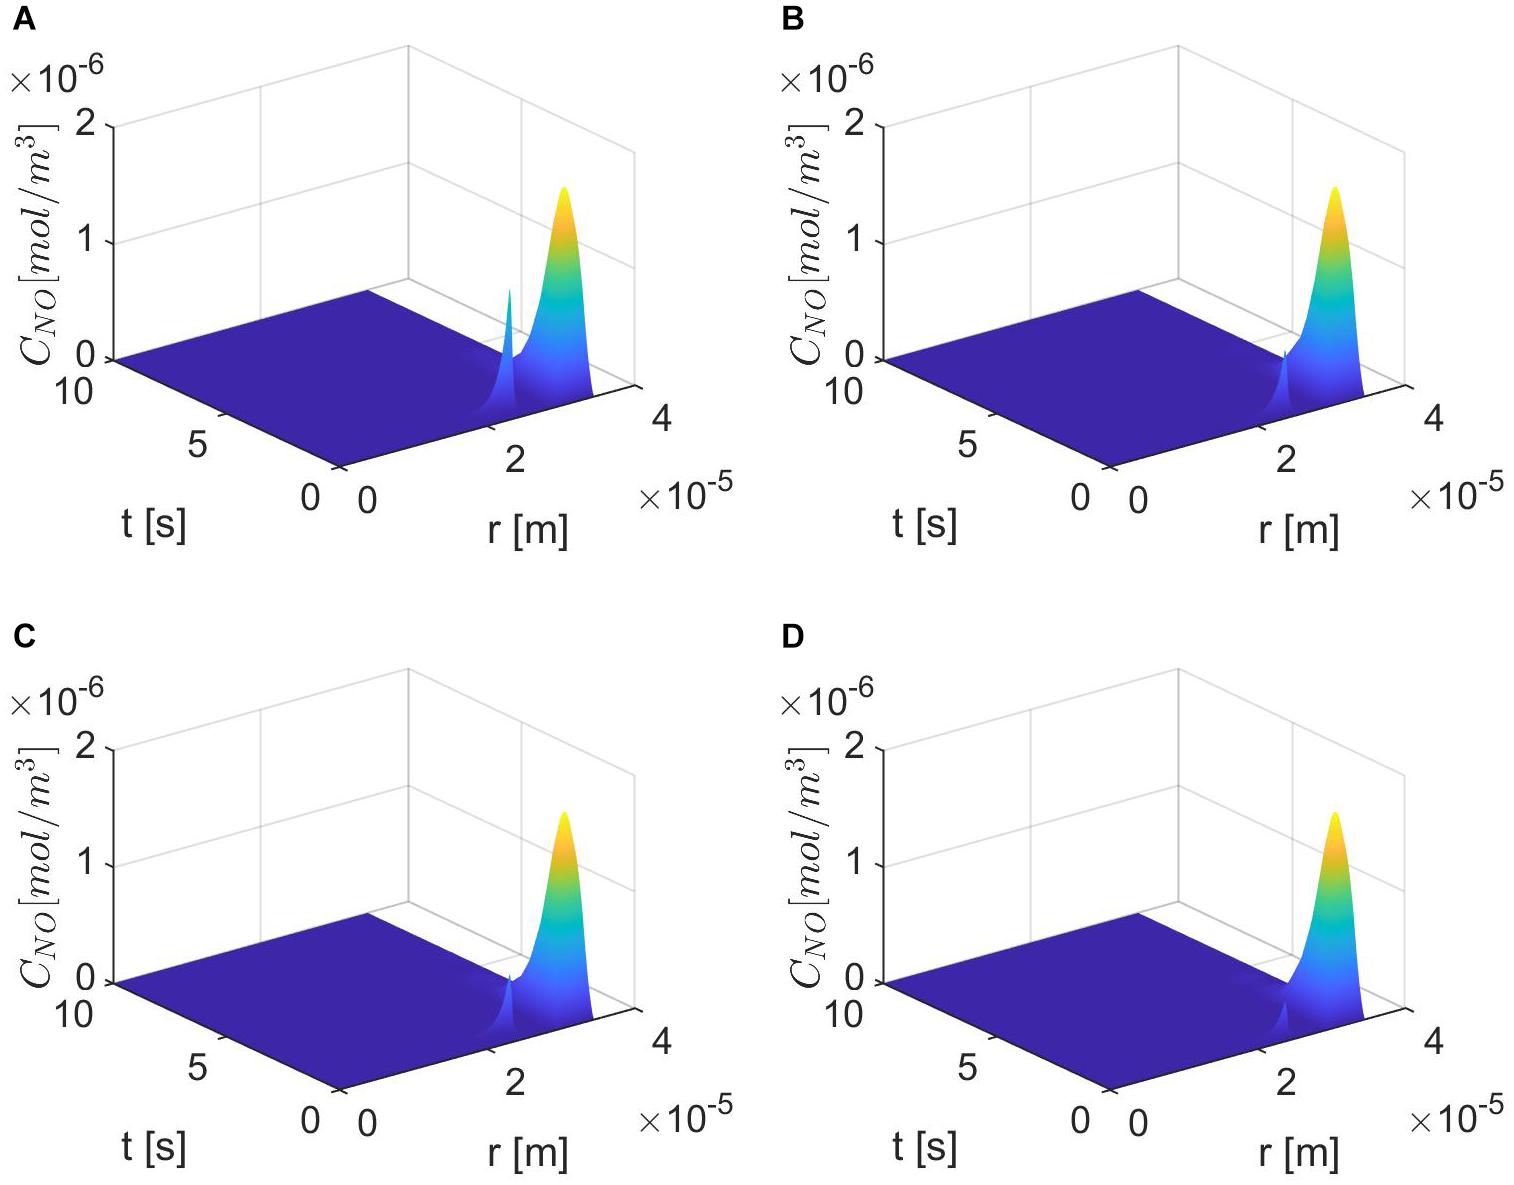
Figure 7. Spatiotemporal variations of CNO for ε = 0.85, p = 0.75 (q = 0.25), (A) , (B) (C) E = 6×10³ N/m, γ = 0.75, , and (D) E = 6×10⁴ N/m, γ = 1.25, .
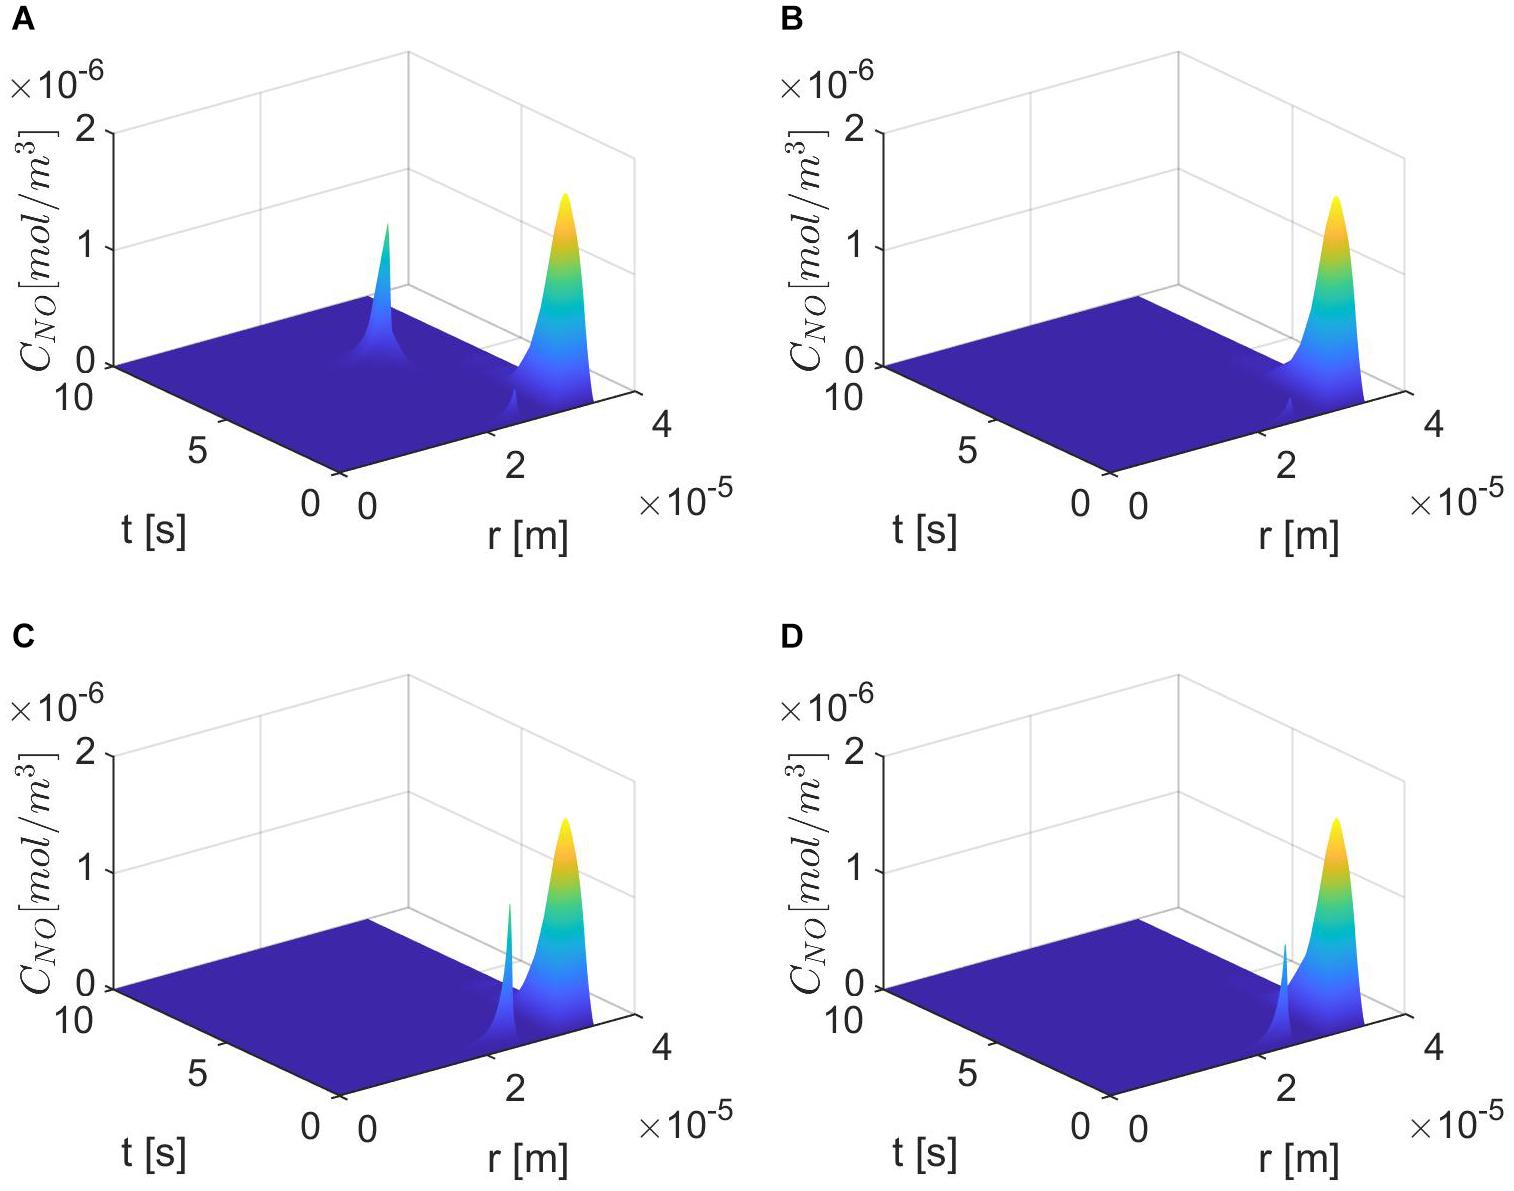
Figure 8. Spatiotemporal variations of CNO for ε = 0.85, p = 0.25 (q = 0.75), (A) , (B) (C) E = 6×10³ N/m, γ=0.75, , and (D) E = 6×10⁴ N/m, γ = 1.25, .
Figures 9, 10 show the temporal profiles of the NO concentration at the endothelium for ε = 0.95 and, respectively, ε = 0.75 in the same scenarios as those shown above for ε = 0.85. Aside from the expected distribution skewness, the behavior of the NO concentration resembles the one for ε = 1: an increase in the NO concentration with increasing vascular stiffness and a decrease in the NO concentration with a larger quantity of superoxide and/or in the presence of stiffer vascular walls. This suggests that there exists a narrow range of values for ε near 0.85 where the combined effects of anomalous diffusion, stiffer vascular wall, and increased quantity of superoxide contribute to the decrease in the NO concentration at the endothelium reported, for instance, in Chironi et al. (2009). Thus, there exists a characteristic jump length distribution for ε = 0.85 when the expected behavior of the NO concentration at the endothelium is observed in the forward diffusional direction. Last, it is worth mentioning that in all studied cases of NO anomalous diffusion (0.75 ≤ ε < 1) the maximum values of the NO concentration at the vascular wall are within the range of physiological values (Hall and Garthwaite, 2006).
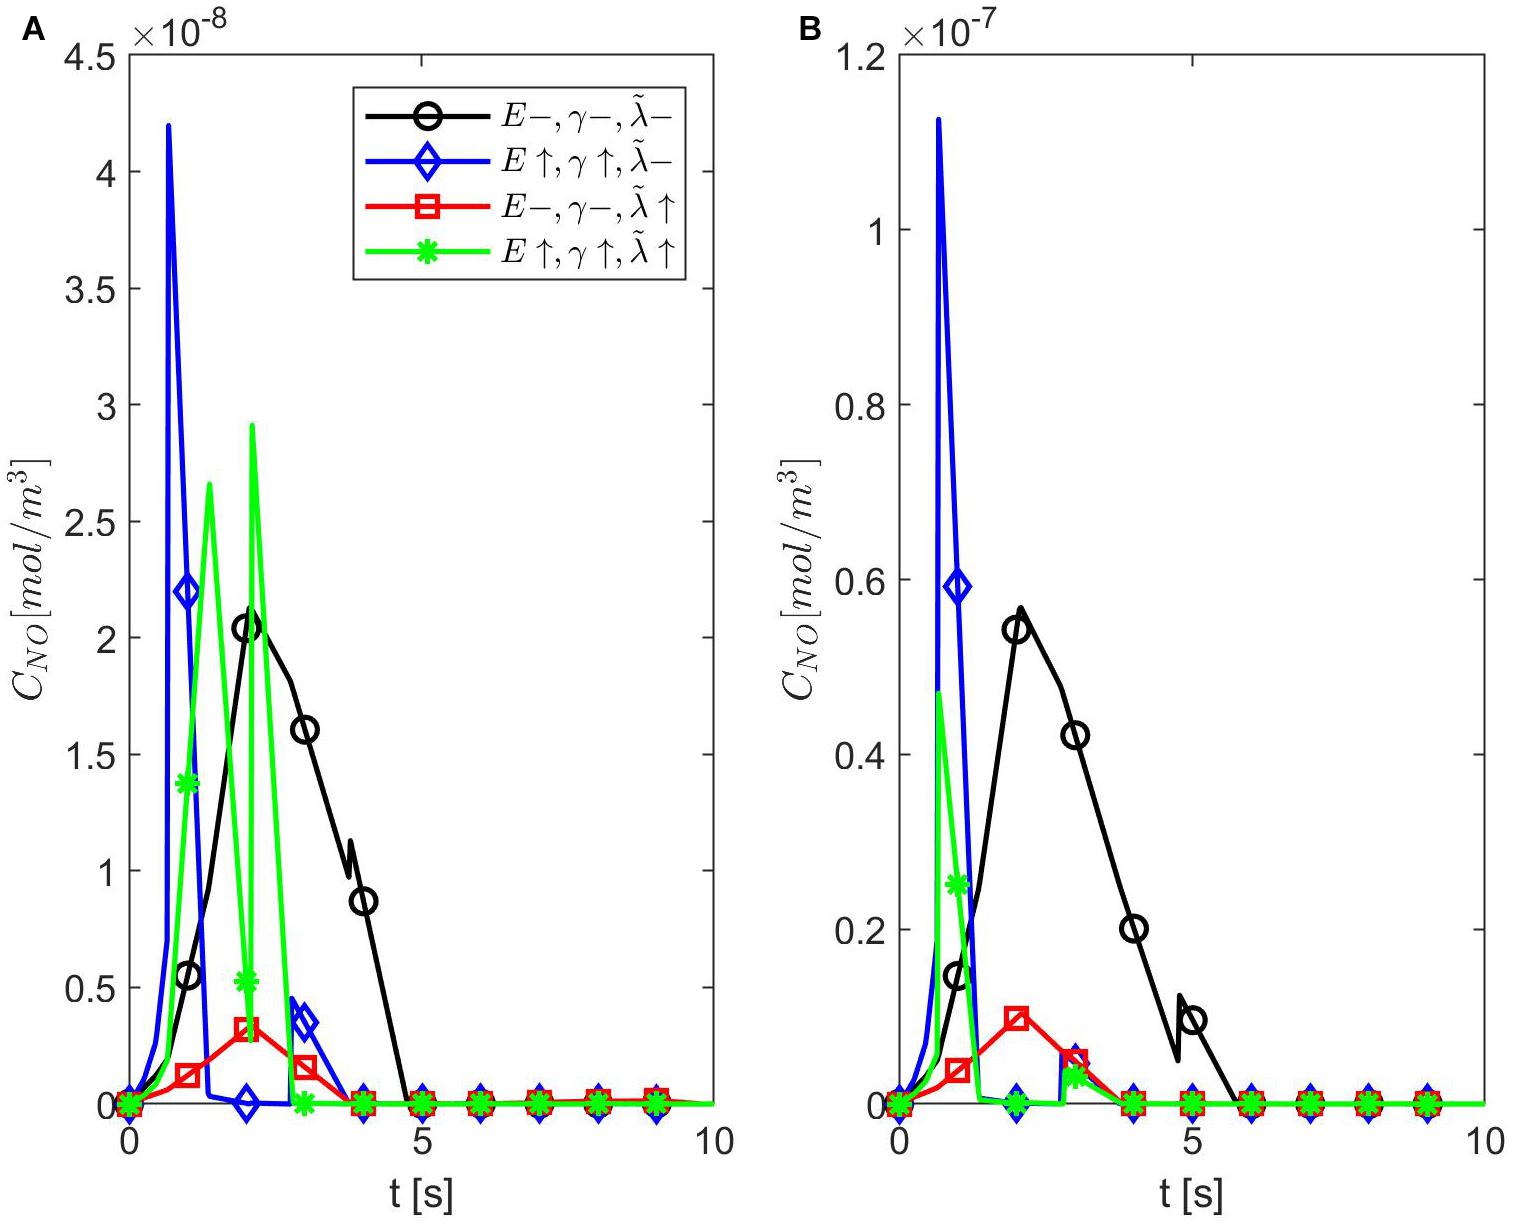
Figure 9. Temporal profiles of CNO at r = a + h, the outer boundary of the endothelium, for ε = 0.95, (A) p = 0.75 (q = 0.25), and (B) p = 0.25 (q = 0.75) (A,B have the same legend shown in A). Here (black circle symbol), (blue diamond symbol), (red square symbol), and (green star symbol).
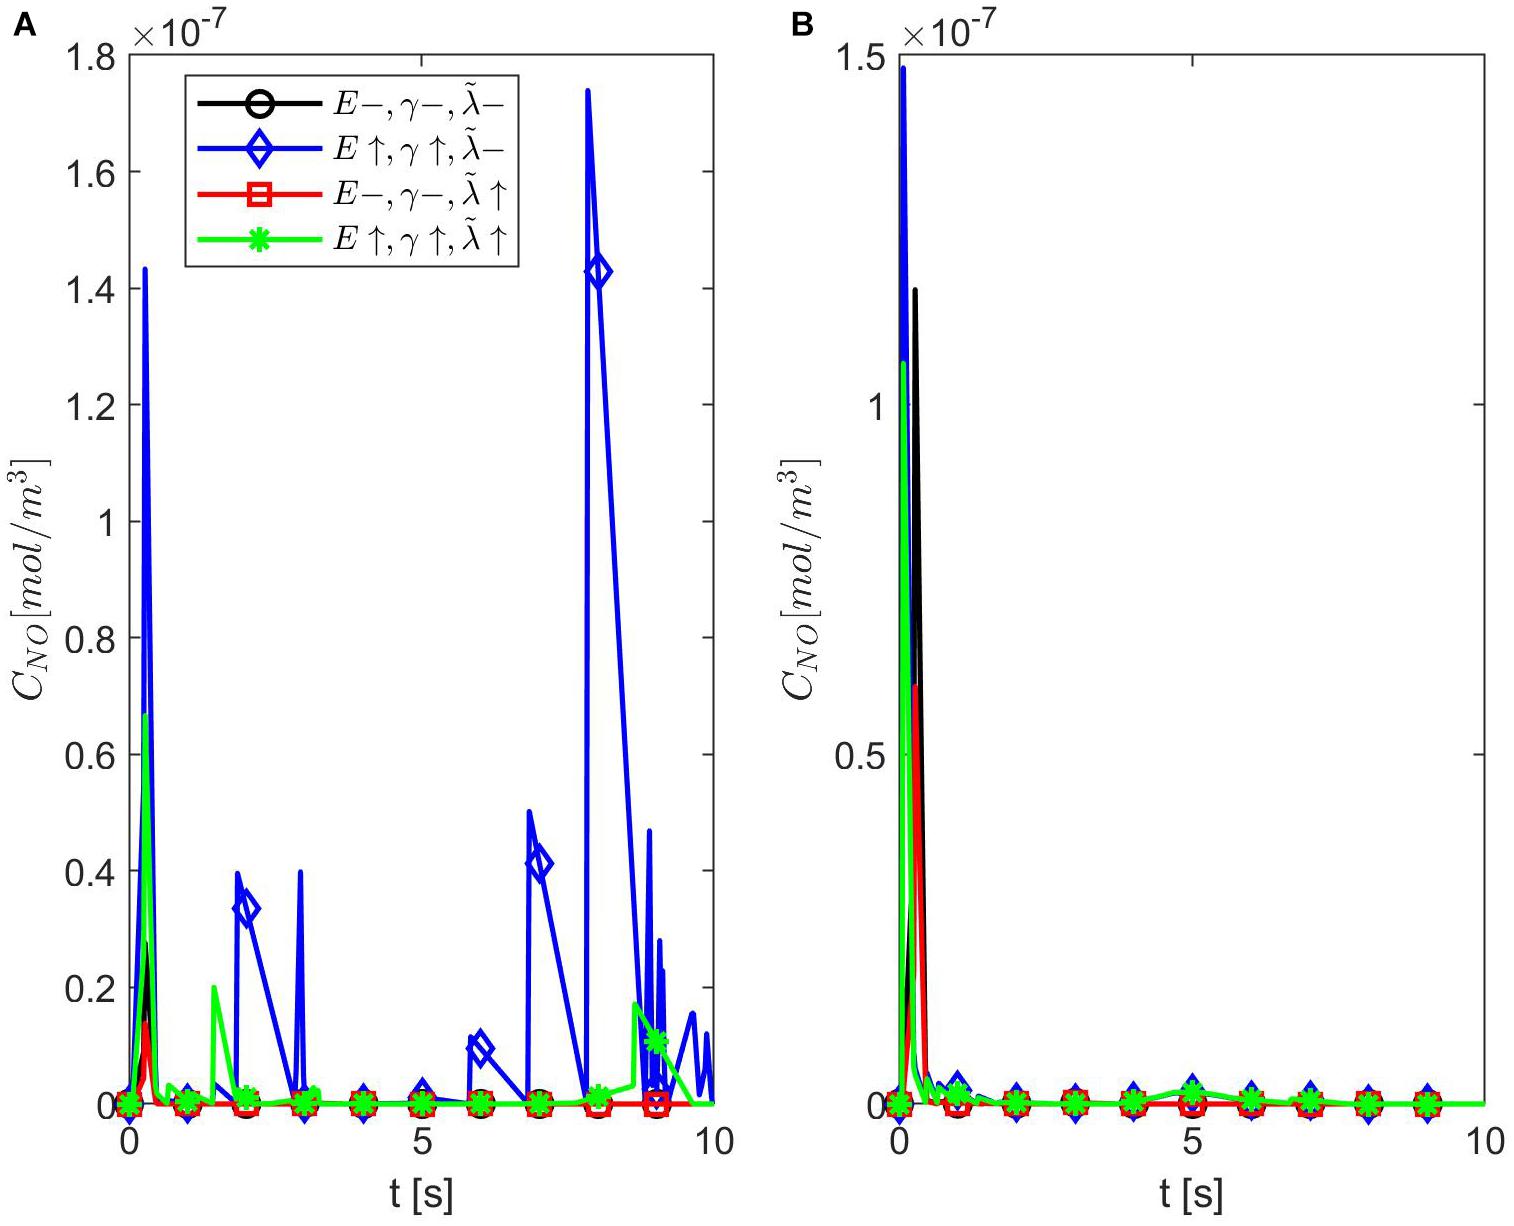
Figure 10. Temporal profiles of CNO at r = a + h, the outer boundary of the endothelium, for ε = 0.75, (A) p = 0.75 (q = 0.25), and (B) p = 0.25 (q = 0.75) (A,B have the same legend shown in A). Here (black circle symbol), (blue diamond symbol), (red square symbol), and (green star symbol).
The main predictions of the proposed model of NO dynamics are that, when the fractional order of the NO anomalous diffusion is ε = 0.85 and the forward diffusional direction dominates, the NO concentration at the vascular wall: (1) is maximum when the stiffness of the wall and the amount of superoxide are within normal ranges (Figure 5) and (2) decreases the most in the presence of a stiffer vascular wall and an increased concentration of superoxide (Figure 6A). According to Yan et al. (2003), Densmore et al. (2006), Chironi et al. (2009), Burger et al. (2013), Foley and Conway (2016), and Leopold (2020), the combination of factors mentioned in item 2 above may be caused by an increased concentration of Ang II, while the subsequent reduced amount of endothelial NO contributes to endothelial dysfunction and endotheliopathy. Although at this stage the model is rather general and does not include specifics of a particular disease, it could potentially be adapted to studies of any disease that causes endotheliopathy according to the mechanism described above. Thus, for now, only a big picture of the usefulness of the proposed model will be provided. The discussion that follows will focus on COVID-19 because of the fast evolution of the disease (compared with other cardiovascular and neurodegenerative diseases, which can take years to develop symptoms and be diagnosed) and the ongoing high interest in its treatment.
As mentioned in the section “Introduction” (see also Figure 1), a higher amount of Ang II is linked to the infection with the SARS-CoV-2 virus. The relationship among the SARS-CoV-2 virus infection, endotheliopathy, and NO was investigated in Akaberi et al. (2020), Bagate et al. (2020) and Goshua et al. (2020). For instance, the blood test results of patients with COVID-19 that are presented in Goshua et al. (2020) provide a biochemical proof of endotheliopathy presence. The analysis of several endothelial markers in the blood highlights the important role played by endotheliopathy in disease severity and the survival of patients with COVID-19. Endothelial cell modification was, thus, suggested as one additional therapy that may improve the outcome of some critically ill patients. The studies in Akaberi et al. (2020) and Bagate et al. (2020) looked at NO delivery as a potential therapy for COVID-19. The in vitro experiments reported in Akaberi et al. (2020) were performed on cultured cells, which were infected with the SARS-CoV-2 virus and then exposed to two pharmacological NO-evolving agents (SNAP and NAP). The results showed that the NO donor SNAP inhibited the replication of the virus. On the other hand, the small clinical study in Bagate et al. (2020) shows that, although the combination of inhaled NO and almitrine, a pulmonary vasoconstrictor, rapidly improved the arterial oxygenation in intubated patients with COVID-19, the benefits of this therapeutical approach were temporary and did not have a positive impact on outcome. Nevertheless, this method of NO administration could be used in some patients with COVID-19 in need of urgent care, while other NO-evolving pharmaceutical agents could be added to the treatment of COVID-19 and possibly become part of a long-term plan of supporting the endothelial function after recovery from COVID-19. More details on various pharmaceutical agents modulating the NO bioavailability that could benefit patients with COVID-19 can be found in Ignarro et al. (2002) and Kraehling and Sessa (2017).
Two challenges that are encountered during the design of a treatment are the diligent selection of patients who will benefit from the treatment and the careful planning of therapeutical delivery that will improve patient outcome. The model proposed in this article might provide some guidance on how to approach these therapeutical challenges for COVID-19. Numerical simulations suggest the existence of a critical state when a stiffer vessel’s wall, increased amount of superoxide, and specific value of the NO anomalous diffusion exponent ε leads to a very low concentration of endothelial NO in the brain. This low concentration might be used as a threshold value in images of NO concentration inside and outside the endothelial cells (as well as other brain cells). For instance, certain fluorescein biosensors can be used as NO probes for real-time visualization of the spatiotemporal distribution of NO in fluoroscopy (Sharma et al., 2014), while manganese-based NO-selective contrast agents can help with magnetic resonance images (MRI) of NO (Barandov et al., 2020). These biosensors are chemical agents that could be delivered to the brain either via the intracerebrospinal fluid or by intravascular injection. Also, methods that reduce the neurotoxicity of these NO probes, so that they are safe to use in human subjects, are emerging (Sudarshana et al., 2019). However, an image showing a low NO concentration alone or in combination with a measurement of stiffer retinal vessels done during an eye exam (Best et al., 1971; Flammer et al., 2013) will just indicate the presence of endotheliopathy in patients with COVID-19, which, as mentioned earlier, can already be found with blood tests.
Imaging anomalous diffusion of NO could help not only with the selection of patients who will benefit from the administration of NO-evolving pharmaceutical agents but also with the design of optimal drug delivery. For instance, the diffusion-weighted magnetic resonance spectroscopy (DW-MRS) method proposed in Marchadour et al. (2012) could be adapted to NO by changing the spectroscopy and diffusion sequences such that the pseudo diffusion coefficient D∗ given in Zhou et al. (2010) [see also Magin et al. (2008) for more details) to model the measured apparent diffusion coefficient (ADC) may be used:
where, δ and Δ are the diffusion gradient pulse width and gradient lobe separation, respectively. Parameters D, μ, and β are introduced in the space-fractional Bloch–Torrey equation of order 2β ∈ (0, 2] for the transverse magnetization and can be found by fitting formula (13) to the measured ADC. Formula (13) was used in Zhou et al. (2010) to show anomalous diffusion in human brain using DW-MRI. If a relationship between the fractional orders β and ε may be established, then the value of β corresponding to ε = 0.85 could be used to select patients with COVID-19 for treatment with NO-evolving pharmaceutical agents. Also, the model predicts that, for ε = 0.85, the NO concentration has a maximum value at the vascular wall when the vascular stiffness and amount of superoxide are within normal ranges, and thus, the NO signal is better in this case. This suggests that a younger, otherwise healthy, subject diagnosed with COVID-19 soon after the onset of symptoms could benefit from a DW-MRS of NO, ideally done shortly after diagnosis, since a value of β corresponding to ε = 0.85 may indicate that the subject is at a higher risk of developing endotheliopathy. Furthermore, this critical value of β may be useful in accurately programming drug delivery so that maximum therapeutical benefits are achieved. For instance, in Ojha et al. (2020), it is shown how some biocompatible materials can be engineered such that immersed nanoparticles follow specific anomalous diffusion patterns. This approach can be used to control the release of pharmaceutical agents by nanoparticle drug carriers. Thus, it is possible that, for example, the optimal delivery of NO-evolving drugs happens when a certain relationship between the anomalous diffusion exponent of the nanoparticle carrier and β (or ε) holds. Last, it is important to mention that the proposed methodology for COVID-19 is purely exploratory since the required technology and critical knowledge about this novel disease are still missing.
The main limitations of the proposed model are as follows. The values of most parameters given in Table 1 were taken from published theoretical studies (Vaughn et al., 1998a; Kavdia et al., 2002; Hall and Garthwaite, 2006; Hodis and Zamir, 2008), which are still to be validated through in vivo experiments. Some other important biochemical processes that are involved in the production and decay of cerebral NO [see for instance, Attwell et al. (2010)], such as O2− modulated synthesis of NO and NO inactivation due to autoxidation, were not incorporated into the model. The mechanical deformation of the vascular wall was studied in a simplified, one-dimensional geometry, and the blood flow was represented as a mere oscillatory boundary condition. None of the mechanical parameters of the vascular wall was assumed to be dependent on the NO concentration. Last, the proposed model of cerebral NO biotransport was one dimensional.
In this article, a space-fractional reaction–diffusion equation for the NO concentration was proposed to model the biotransport of NO in the brain. The model incorporates the NO production by synthesis in the neurons and by shear-induced mechanotransduction at the endothelium–lumen interface. The neuronal NO synthesis is assumed to have the time-dependent profile of the Ca2+-calmodulin binding (Hall and Garthwaite, 2006), while the endothelial NO production is proportional to the viscous dissipation in the endothelium. The endothelium is assumed to be a homogeneous, isotropic Maxwell linear viscoelastic material exposed to the pulsatile blood flow (Hodis and Zamir, 2008). The NO inactivation is caused, among others, by the blood’s hemoglobin in the lumen and by the reaction with superoxide in the extracellular space. The NO diffusion is assumed to be anomalous due to the trapping of the NO particles by the EMP whose concentration increases in pathological conditions. Thus, the presence of EMP is modeled as anomalous diffusion of NO. The left- and right-sided Riemann–Liouville fractional derivatives of order ε ∈ (0, 1) are used to model anomalous diffusion. Numerical simulations show that there exists a characteristic jump length distribution for ε = 0.85 where the NO concentration at the vascular wall decreases in the presence of a stiffer vascular wall and larger amount of superoxide. The biggest distribution skewness of the NO at the wall was also noticed for the same value of ε.
Future work will focus on resolving the limitations of the proposed model mentioned in the previous section. A full sensitivity analysis to parameters’ changes will be performed, and other components shown in Figure 1 as well as biochemical processes specific to the infection with the SARS-CoV-2 virus will be incorporated into the model. As more clinical and experimental data on COVID-19 are becoming available in the literature, the validation of an improved, disease-specific model should, thus, be possible. Last, the model will be generalized to a three-dimensional geometry and will couple the blood flow, the deformations of the vessel’s wall, and the NO dynamics. The mechanical parameters introduced by the constitutive equations of the blood and the wall will be assumed to depend on the NO concentration. In addition, the intriguing idea proposed in Helms and Kim-Shapiro (2013) that the hemoglobin plays a dual role of destroyer and preserver of the NO bioactivity will be explored through updated mathematical representations of the NO production and decay in the three-dimensional expression of equation (1). Such a mathematical model could not only provide a better understanding of the impacts of COVID-19 on the cardiovascular and nervous systems but also contribute to the development of successful NO-based therapies for brain diseases associated with disturbances in NO biotransport and/or signaling.
The original contributions presented in the study are included in the article/supplementary material, further inquiries can be directed to the corresponding author.
AT wrote the MATLAB code, generated the numerical simulations, and contributed to the interpreting the results and writing of the article. CD developed the mathematical model, proposed the linkage between SARS-Cov-2 and NO, and contributed to the interpreting of the results and writing of the article. Both authors contributed to the article and approved the submitted version.
The authors declare that the research was conducted in the absence of any commercial or financial relationships that could be construed as a potential conflict of interest.
Akaberi, D., Krambrich, J., Ling, J., Luni, C., Hedenstierna, G., Järhult, J. D., et al. (2020). Mitigation of the replication of SARS-CoV-2 by nitric oxide in vitro. Redox Biol. 37, 101734. doi: 10.1016/j.redox.2020.101734
Akaike, T., and Maeda, H. (2000). Nitric oxide and virus infection. Immunology 101, 300–308. doi: 10.1046/j.1365-2567.2000.00142.x
Attwell, D., Buchan, A., Charpak, S., Lauritzen, M., MacVicar, B. A., and Newman, E. A. (2010). Glial and neuronal control of brain blood flow. Nature 468, 232–243. doi: 10.1038/nature09613
Bagate, F., Tuffet, S., Masi, P., Perier, F., Razazi, K., de Prost, N., et al. (2020). Rescue therapy with inhaled nitric oxide and almitrine in COVID-19 patients with severe acute respiratory distress syndrome. Ann. Intensive Care 10, 151. doi: 10.1186/s13613-020-00769-2
Barandov, A., Ghosh, S., Li, N., Bartelle, B. B., Daher, J. I., Pegis, M. L., et al. (2020). Molecular magnetic resonance imaging of nitric oxide in biological systems. ACS Sens. 5, 1674–1682.
Barbosa, R. M., Lourenco, C. F., Santos, R. M., Pomerleau, F., Huettl, P., Gehardt, G. A., et al. (2008). In vivo real-time measurement of nitric oxide in anesthetized rat brain. Methods Enzymol. 441, 351–367. doi: 10.1016/S0076-6879(08)01220-2
Best, M., Masket, S., and Rabinovitz, A. Z. (1971). Measurement of vascular rigidity in the living eye. Arch Ophthal 86, 699–705. doi: 10.1001/archopht.1971.01000010701016
Buerk, D. G. (2001). Can we model nitric oxide biotransport? A survey of mathematical models for a simple diatomic molecule with surprisingly complex biological activities. Annu. Rev. Biomed. Eng. 3, 109–143. doi: 10.1146/annurev.bioeng.3.1.109
Buerk, D. G., Ances, B. M., Greenberg, J. H., and Detre, J. A. (2003). Temporal dynamics of brain tissue nitric oxide during functional forepaw stimulation in rats. NeuroImage 18, 1–9. doi: 10.1006/nimg.2002.1314
Burger, D., Schock, S., Thompson, C. S., Montezano, A. C., Hakim, A. M., and Touyz, R. M. (2013). Microparticles: biomarkers and beyond. Clin. Sci. 124, 423–441. doi: 10.1042/cs20120309
Cai, M., and Li, C. (2020). Numerical approaches to fractional integrals and derivatives: a review. Mathematics 8, 43. doi: 10.3390/math8010043
Chironi, G. N., Boulanger, C. M., Simon, A., Dignat-George, F., Freyssinet, J.-M., and Tedgui, A. (2009). Endothelial microparticles in diseases. Cell Tissue Res. 335, 143–151.
Contestabile, A., Monti, B., and Polazzi, E. (2012). Neuronal-glial interactions define the role of nitric oxide in neural functional processes. Curr. Neuropharmacol. 10, 303–310. doi: 10.2174/157015912804143522
Densmore, J. C., Signorino, P. R., Ou, J., Hatoum, O. A., Rowe, J. J., Shi, Y., et al. (2006). Endothelial-derived microparticles induce endothelial dysfunction and acute lung injury. Shock 26, 464–471. doi: 10.1097/01.shk.0000228791.10550.36
Dinerman, J. L., Dawson, T. M., Schell, M. J., Snowman, A., and Snyder, S. H. (1994). Endothelial nitric oxide synthase localized to hippocampal pyramidal cells: Implications or synaptic plasticity. Proc. Natl. Acad. Sci.U.S.A. 91, 4214–4218. doi: 10.1073/pnas.91.10.4214
Drapaca, C. S. (2021). The impact of anomalous diffusion on action potentials in myelinated neurons. Fractal Fract. 5, 4. doi: 10.3390/fractalfract5010004
Drapaca, C. S., and Tamis, A. (2019). “Mathematical modeling of the steady-state behavior of nitric oxide in brain,” in Proceedings of the AMMCS 2019.
Dumitru, B., Diethelm, K., Scalas, E., and Trujillo, J. J. (2012). Fractional Calculus: Models and Numerical Methods. Singapore: World Scientific Publishing Co. Pte. Ltd.
Flammer, J., Konieczka, K., Bruno, R. M., Virdis, A., Flammer, A. J., and Taddei, S. (2013). The eye and the heart. Eur. Heart J. 34, 1270–1278. doi: 10.1093/eurheartj/eht023
Foley, J. H., and Conway, E. M. (2016). Cross talk pathways between coagulation and inflammation. Circ. Res. 118, 1392–1408. doi: 10.1161/circresaha.116.306853
Forstermann, U., and Sessa, W. C. (2012). Nitric oxide synthases: regulation and function. Eur. Heart J. 33, 829–837. doi: 10.1093/eurheartj/ehr304
Ganesana, M., Erlichman, J. S., and Andreescu, S. (2012). Real-time monitoring of superoxide accumulation and antioxidant activity in a brain slice model using an electrochemical cytochrome C biosensor. Free Radical Biol. Med. 53, 2240–2249. doi: 10.1016/j.freeradbiomed.2012.10.540
Garry, P. S., Ezra, M., Rowland, M. J., Westbrook, J., and Pattinson, K. T. S. (2015). The role of the nitric oxide pathway in brain injury and its treatment – from bench to bedside. Exp. Neurol. 263, 235–243. doi: 10.1016/j.expneurol.2014.10.017
Goshua, G., Pine, A. B., Meizlish, M. L., Chang, C.-H., Zhang, H., Bahel, P., et al. (2020). Endotheliopathy in COVID-19-associated coagulopathy: evidence from a single-centre, cross-sectional study. Lancet Haematol. 7, E575–E582. doi: 10.1016/S2352-3026(20)30216-7
Hall, C. N., and Garthwaite, J. (2006). Inactivation of nitric oxide by rat cerebellar slices. J. Physiol. 577, 549–567. doi: 10.1113/jphysiol.2006.118380
Helms, C. C., Liu, X., and Kim-Shapiro, D. B. (2016). Recent insights into nitrite signaling processes in blood. Biol. Chem. 3, 319–329. doi: 10.1515/hsz-2016-0263
Helms, C., and Kim-Shapiro, D. B. (2013). Hemoglobin-mediated nitric oxide signaling. Free Radical Biol. Med. 61, 464–472. doi: 10.1016/j.freeradbiomed.2013.04.028
Hodis, S., and Zamir, M. (2008). Solutions of the Maxwell viscoelastic equations for displacement and stress distributions within the arterial wall. Phys. Rev. E 78, 021914.
Huang, P. I. (1999). Neuronal and endothelial nitric oxide synthase gene knockout mice. Braz. J. Med. Biol. Res. 32, 1353–1359. doi: 10.1590/s0100-879x1999001100005
Ignarro, L. J., Napoli, C., and Loscalzo, J. (2002). Nitric oxide donors and cardiovascular agents modulating the bioactivity of nitric oxide: an overview. Circ. Rese. 90, 21–28. doi: 10.1161/hh0102.102330
Kavdia, M., Tsoukias, N. M., and Popel, A. S. (2002). Model of nitric oxide diffusion in an arteriole: impact of hemoglobin-based blood substitute. Am. J. Physiol. Heart Circ. Physiol. 282, H2245–H2253. doi: 10.1152/ajpheart.00972.2001
Kim, S., and Kavvas, L. (2006). Generalized Fick’s law and fractional ADE for pollution transport in a river: detailed derivation. J. Hydrol. Eng. 11, 80–83. doi: 10.1061/(asce)1084-0699(2006)11:1(80)
Klages, R., Radons, G., and Sokolov, I. M. (2008). Anomalous Transport: Foundations and Applications. Weinheim: WILEY-VCH Verlag GmbH & Co. KGaA.
Koshland, D. E. Jr. (1992). Editorial: The molecule of the year. Science 258, 1861. doi: 10.1126/science.1470903
Kraehling, J. R., and Sessa, W. C. (2017). Contemporary approaches to modulating the nitric oxide-cGMP pathway in cardiovascular disease. Circ. Rese. 120, 1174–1182. doi: 10.1161/CIRCRESAHA.117.303776
Ledo, A., Barbosa, R. M., Gerhardt, G. A., Cadenas, E., and Laranjinha, J. (2005). Concentration dynamics of nitric oxide in rat hippocampal subregions evoked by stimulation of the NMDA glutamate receptor. Proc. Natl. Acad. Sci. USA 102, 17483–17488. doi: 10.1073/pnas.0503624102
Leopold, J. A. (2020). Chapter 2: The endothelium”, in Vascular Medicine: A Companion to Braunwald’s Heart Disease, 3rd Edn. Amsterdam: Elsevier.
Liang, Y., Chen, W., Akpa, B. S., Neuberger, T., Webb, A. G., and Magin, R. L. (2017). Using spectral and cumulative spectral entropy to classify anomalous diffusion in SephadexTM gels. Comput. Math. Appl. 73, 765–774. doi: 10.1016/j.camwa.2016.12.028
Magin, R. L., Abdullah, O., Baleanu, D., and Zhou, X. J. (2008). Anomalous diffusion expressed through fractional order differential equations in the Bloch-Torrey equation. J. Magn. Reson. 190, 255–270. doi: 10.1016/j.jmr.2007.11.007
Magin, R. L., Ingo, C., Colon-Perez, L., Triplett, W., and Mareci, T. H. (2013). Characterization of anomalous diffusion in porous biological tissues using fractional order derivatives and entropy. Microporous Mesoporous Mater. 178, 39–43. doi: 10.1016/j.micromeso.2013.02.054
Marchadour, C., Brouillet, E., Hantraye, P., Lebon, V., and Valette, J. (2012). Anomalous diffusion of brain metabolites evidenced by diffusion-weighted magnetic resonance spectroscopy in vivo. J. Cereb. Blood Flow Metab. 32, 2153–2160. doi: 10.1038/jcbfm.2012.119
Metea, M. R., and Newman, E. A. (2006). Glia cells dilate and constrict blood vessels: a mechanism of neurovascular coupling. J. Neurosci. 26, 2862–2870. doi: 10.1523/jneurosci.4048-05.2006
Metzler, R., and Klafter, J. (2004). The restaurant at the end of the random walk: Recent developments in the description of anomalous transport by fractional dynamics. J. Phys. A: Math. Gen. 37, R161–R208.
Mishra, A. (2017). Binaural blood flow control by astrocytes: listening to synapses and the vasculature. J. Physiol. 595, 1885–1902. doi: 10.1113/JP270979
Moncada, S., Palmer, R. M. J., and Higgs, E. A. (1991). Nitric oxide: physiology, pathophysiology, and pharmacology. Pharmacol. Rev. 43, 109–142.
Ojha, J., Nanda, R., and Dorai, K. (2020). NMR investigation of the thermogelling properties, anomalous diffusion, and structural changes in a Pluronic F127 triblock copolymer in the presence of gold nanoparticles. Colloid Polym. Sci. 298, 1571–1585. doi: 10.1007/s00396-020-04740-2
Raju, K., Doulias, P.-T., Evans, P., Krizman, E. N., Jackson, J. G., Horyn, O., et al. (2015). Regulation of brain glutamate metabolism by nitric oxide and S-nitrosylation. Sci. Signal. 8, ra68. doi: 10.1126/scisignal.aaa4312
Santos, R. M., Lourenco, C. F., Ledo, A., Barbosa, R. M., and Laranjinha, J. (2012). Nitric oxide inactivation mechanisms in the brain: role in bioenergetics and neurodegeneration. Int. J. Cell Biol. 391914, 2012. doi: 10.1155/2012/391914
Sharma, R., Seo, J.-W., and Kwon, S. (2014). In vivo imaging of nitric oxide by magnetic resonance imaging techniques. J. Nanomater. 2014, 523646. doi: 10.1155/2014/523646
Sousa, E. (2009). Finite difference approximations for a fractional advection diffusion problem. J. Computat. Phys. 228, 4038–4054. doi: 10.1016/j.jcp.2009.02.011
Sriram, K., Insel, P., and Loomba, R. (2020). What is the ACE2 receptor, how is it connected to coronavirus and why might it be key to treating COVID-19? The experts explain.” The Conversation, 2020. Available online at: https://theconversation.com/what-is-the-ace2-receptor-how-is-it-connected-to-coronavirus-and-why-might-it-be-key-to-treating-covid-19-the-experts-explain-136928.
Sriram, K., Laughlin, J. G., Rangamani, P., and Tartakovsky, D. M. (2016). Shear-induced nitric oxide production by endothelial cells. Biophys. J. 111, 208–221. doi: 10.1016/j.bpj.2016.05.034
Sudarshana, D. M., Nair, G., Dwyer, J. T., Dewey, B., Steele, S. U., Suto, D. J., et al. (2019). Manganese-enhanced MRI of the brain in healthy volunteers” AJNR. Am. J. Neuroradiol. 40, 1309–1316. doi: 10.3174/ajnr.A6152
Tamis, A., and Drapaca, C. S. (2021). “chapter 6: a mathematical model of nitric oxide mechanotransduction in brain” in Mechanics of Biological Systems and Materials & Micro-and Nanomechanics & Research Applications,” in Proceedings of the Conference Society for Experimental Mechanics Series, Springer Nature Switzerland AG 2021, (Berlin).
Tarasov, V. E. (2010). Fractional Dynamics: Applications of Fractional Calculus to Dynamics of Particles, Fields, and Media. Beijing: Higher Education Press.
The Nobel Prize in Physiology or Medicine. (1998). G.Thambu. Available online at: https://www.nobelprize.org/prizes/medicine/1998/press-release/
Vaughn, M. W., Kuo, L., and Liao, J. C. (1998a). Effective diffusion distance of nitric oxide in the microcirculation. Vascu. Physiol. 274, H1705–H1714. doi: 10.1152/ajpheart.1998.274.5.H1705
Vaughn, M. W., Kuo, L., and Liao, J. C. (1998b). Estimation of nitric oxide production and reaction rates in tissue by use of a mathematical model. Am J Physiol. 274, H2163–H2176. doi: 10.1152/ajpheart.1998.274.6.H2163
West, B. J. (2016). Fractional Calculus View of Complexity: Tomorrow’s Science. Boca Raton, FL: CRC Press Taylor & Francis Group.
Yan, C., Kim, D., Aizawa, T., and Berk, B. C. (2003). Functional interplay between angiotensin II and nitric oxide: Cyclic GMP as a key mediator. Arterioscler. Thromb. Vasc. Biol. 23, 26–36. doi: 10.1161/01.atv.0000046231.17365.9d
Keywords: nitric oxide, anomalous diffusion, fractional calculus, Maxwell viscoelastic model, mechanotransduction
Citation: Tamis A and Drapaca CS (2021) Modeling NO Biotransport in Brain Using a Space-Fractional Reaction-Diffusion Equation. Front. Physiol. 12:644149. doi: 10.3389/fphys.2021.644149
Received: 20 December 2020; Accepted: 24 May 2021;
Published: 25 June 2021.
Edited by:
Sanjay Ram Kharche, Western University, CanadaReviewed by:
Debanjan Mukherjee, University of Colorado Boulder, United StatesCopyright © 2021 Tamis and Drapaca. This is an open-access article distributed under the terms of the Creative Commons Attribution License (CC BY). The use, distribution or reproduction in other forums is permitted, provided the original author(s) and the copyright owner(s) are credited and that the original publication in this journal is cited, in accordance with accepted academic practice. No use, distribution or reproduction is permitted which does not comply with these terms.
*Correspondence: Corina S. Drapaca, Y3NkMTJAcHN1LmVkdQ==
Disclaimer: All claims expressed in this article are solely those of the authors and do not necessarily represent those of their affiliated organizations, or those of the publisher, the editors and the reviewers. Any product that may be evaluated in this article or claim that may be made by its manufacturer is not guaranteed or endorsed by the publisher.
Research integrity at Frontiers

Learn more about the work of our research integrity team to safeguard the quality of each article we publish.