 Herman D. Himel1
 Michael Cupelli
 Mohamed Boutjdir
 Nabil El-Sherif
- 1Veterans Affairs New York Harbor Healthcare System, Brooklyn, NY, United States
- 2Downstate Medical Center, State University of New York, Brooklyn, NY, United States
- 3School of Medicine, New York University, New York, NY, United States
Background: Clinical experience showed that the majority of Torsade de Pointes (TdP) ventricular tachyarrhythmia (VT) in patients with long QT syndrome (LQTS) are self-terminating (ST), but the few that are non-self-terminating (NST) are potentially fatal. A paramount issue in clinical arrhythmology is to understand the electrophysiological mechanism of ST vs. NST TdP VT.
Methods: We investigated the electrophysiological mechanism of ST vs. NST TdP VT in the guinea pig Anthopleurin-A experimental model of LQTS, a close surrogate model of congenital LQT3. We utilized simultaneous optical recordings of membrane voltage (Vm) and intracellular calcium (Cai) and a robust analytical method based on spatiotemporal entropy difference (Ed) to investigate the hypothesis that early Vm/Cai uncoupling during TdP VT can play a primary role in perpetuation of VT episodes.
Results: We analyzed a total of 35 episodes of TdP VT from 14 guinea pig surrogate models of LQTS, including 23 ST and 12 NST VTs. Ed values for NST VT were significantly higher than Ed values for ST VT. Analysis of wave front topology during the early phase of ST VT showed the Cai wave front following closely Vm wave front consistent with a lower degree of Ed. In contrast, NST VT was associated with uncoupling of Vm/Cai wave fronts during the first 2 or 3 cycles of VT associated with early wave break propagation pattern.
Conclusions: Utilizing a robust analytical method we showed that, in comparison to ST TdP VT, NST VT was consistently predated by early uncoupling of Vm/Cai that destabilized wave front propagation and can explain a sustained complex reentrant excitation pattern.
Introduction
Patients with both congenital and acquired long QT syndrome (LQTS) are under the risk of developing ventricular tachyarrhythmia (VT), sometimes referred to as Torsade de Pointes (TdP) VT (El-Sherif and Turitto, 1999). Clinical experience showed that the majority of TdP VT are self-terminating (ST) but the few that are non-self-terminating (NST) are potentially fatal (El-Sherif and Turitto, 1999). A paramount issue in clinical arrhythmology is to understand the electrophysiological mechanism of ST vs. NST TdP. This is complicated, on one hand, by the different experimental models of LQTS that do not completely recapitulate all aspects of electrophysiology of the human syndrome. On the other hand, there are current limitations of available investigative techniques that can provide viable explanation. A case in point, a recent experimental study in a canine model of acquired LQTS that utilized tridimensional mapping techniques suggested that short-lasting ST TdP VT had a focal mechanism while long lasting NST TdP VT were maintained by reentrant excitation (Vandersickel et al., 2017). However, the results were criticized in an accompanying editorial because of the controversial mapping definition of focal vs. reentrant excitation (Nayyar et al., 2017).
The present study is designed to investigate the electrophysiological mechanism of ST vs. NST TdP VT in the guinea pig Anthopleurin-A (AP-A) experimental model of LQTS, a close surrogate model of congenital LQT3 (El-Sherif et al., 1988). We utilized simultaneous optical recordings of membrane voltage (Vm) and intracellular calcium (Cai) and a novel analytical method based on spatiotemporal entropy (Jung et al., 2000; Bub et al., 2005) to quantify differences in Vm/Cai kinetics during ST and NST TdP VT. Our study will show that, in comparison to ST TdP VT, NST TdP VT is consistently predated by early Vm/Cai uncoupling.
Materials and Methods
Experimental Procedure
The experimental model is a Dunkin-Hartley Langendorff-perfused guinea pig heart. The protocol was approved by the institutional animal studies subcommittee, and animals were maintained in accordance with The Guide for the Care and Use of Laboratory Animals (National Research Council (US) Committee for the Update of the Guide for the Care and Use of Laboratory Animals, 2011 revised 2011) and ARRIVE guidelines. Voltage and calcium transients are captured using a protocol and equipment fully described previously (Choi and Salama, 2000; Lakireddy et al., 2005). Experimental design, data collection, and analysis techniques were performed as described previously (Himel et al., 2009). Briefly, hearts are collected from guinea pigs (female, 350–450 g) after intraperitoneal injection of heparin (200 U/kg) followed by anesthesia with sodium pentobarbital (35 mg/kg). Hearts are Langendorff perfused with a modified Tyrode’s solution (130 NaCl, 25 NaHCO3, 1.20 MgSO4, 4.0 KCl, 20 dextrose, 1.25 CaCl2; at pH 7.4, bubbled with 95% O2–5% CO2) with a flow rate of 12–16 mL/min, at 70 mm Hg pressure. Hearts are placed in a custom-made chamber and situated against the imaging surface by positioning a Lexar plunge posterior to the imaged plane. The plunger served to seal the chamber, reduce the curvature of the imaged surface, as well as motion artifacts.
Once the heart is stabilized, atrioventricular block (AVB) is produced by localized injection of 5–10 μL of formaldehyde in the region of the AV node. The heart is paced at a fixed CL of 600–1,000 ms with bipolar Ag-AgCl electrodes placed at the right ventricle outflow tract near the anterior interventricular septum. Ventricular stimulation is applied using constant current pulses of 2.5 ms duration at 1.5× diastolic threshold. The heart is then stained with a voltage-sensitive dye (RH237, Invitrogen, 10–20 μL of a 1 mg/ml solution in dimethyl sulfoxide, DMSO) and intracellular calcium indicator (Rhod-2 AM, Invitrogen, 0.2 mg in 0.2 mL DMSO). The voltage-sensitive dye RH237 is injected as a single bolus over a 1 min period, whereas the calcium indicator is slowly injected in five separate boluses over a 10 min period.
Drug
Each 100 μg of AP-A (Sigma) is dissolved in 1 mL of water and divided in aliquots of 5–10 μg each, then frozen at -20°C. Aliquots were defrosted, as needed, at room temperature on the day of experiment. Because of possible light sensitivity of the neurotoxin, the perfusion bottle is covered in aluminum foil. After control recordings are obtained, AP-A is perfused at a constant rate of 10–20 μL/min and concentration of 4 nM.
Optical Mapping
Voltage and calcium transients are captured using a protocol and equipment fully described previously (Choi and Salama, 2000; Lakireddy et al., 2005). Excitation light from a tungsten-halogen source is filtered (520 ± 50 nm) and focused on the surface of the heart. Emitted fluorescent light is collected with a camera lens (85 mm, f1:1.4, Nikon) and passed through a dichroic mirror (630 nm, Omega Optical, Brattleboro, VT, United States). Fluorescence images of the heart are then focused on two 16 × 16 element photodiode arrays (C4675-103; Hamamatsu Corp., Bridgewater, NJ, United States). Cai is imaged using fluorescent light collected below 630 nm and passing it through a 585 ± 20 nm interference filter, while Vm is imaged by taking fluorescence above 630 nm and filtering with a 715 nm long pass filter. The optical apparatus is adjusted so that voltage and calcium transients are imaged from a 16 × 16 mm square area of the left ventricle. Outputs from the photodiode arrays are amplified up to 1,000 times depending on experimental conditions and digitized at 12-bit resolution prior to offline analysis. Vm and Cai signals are conditioned by first running a 13 ms moving average filter on each trace, followed by normalization of the data from each trace so that fluorescence values fell between 0 and 1. Traces near the edge of the imaging field (outside of a radius of 8 pixels from the center) were discarded to limit effects of noise on subsequent analysis. The data are then mapped to a color scheme by using a false color filter where red maps to high values of fluorescence, green to intermediate values, and blue maps to low values. Activation maps from 16 × 16 pixels are expanded to 256 × 256 pixel images by linear interpolation. A wave break is defined as the point where the activation wave front and the repolarization wave front join together on the map (Himel et al., 2009).
Entropy Calculations
We employ a coherent cluster analysis (Jung et al., 2000; Bub et al., 2005; Himel et al., 2009) to compare the spatiotemporal dynamics of Vm and Cai. Successive frames of two-dimensional maps (x- and y-axis) are stacked along the time axis (z-axis) to create a spacetime cube. Active sites are determined by binary comparison to a threshold, which was set to equal to 65% of the maximum ΔF (fractional change in fluorescence relative to the diastolic level of the fluorescence baseline). Nearby active sites are joined to form spacetime clusters. Small clusters can be caused by detector noise and are filtered. Additionally, clusters are not included in the analysis if they do not persist for a minimum time of 50 ms or were not larger than an area of 5 pixels at any given instant. Clusters which were larger than a maximum area of 10 pixels at time zero were removed in order to exclude clusters which began before the analysis window. For a graphical explanation, refer to Supplementary Material. Spatiotemporal entropy is calculated using the following equation:
where vs is the fraction of the total volume of all clusters for a given cluster size s, as defined by Eq. 2.
where s is the cluster size for a cluster s, ns is the number of clusters of size s, and VTotal is the total volume of all clusters. Simply stated, vs is the fractional volume of all clusters of a given cluster size s relative to the volume of all clusters.
Use of Entropy to Quantify Uncoupling
As previously reported, entropy is calculated separately for Vm and Cai data sets for each VT episode (Himel et al., 2009). We do not treat entropy values obtained separately for Vm and Cai as an accurate measure of the entropy of the underlying system. We obtain an entropy difference value Ed where Ed = | EVm - ECa| (EVm and ECa are the entropy values obtained for Vm and Cai data sets, respectively). We propose that Ed is a measure of the difference in complexity between Vm and Cai dynamics in this system.
VT episodes are located by visual inspection of the data. A 500 ms segment starting at the initiation of each VT episode is isolated for analysis. This interval was carefully chosen after analysis of our preliminary data of the average cycle length (CL) of the overall cardiac excitation rate in the composite electrogram of all short and long VTs during the first 500 ms. The average CL was approximately 160 ± 37 ms, which would include no less than the first 2 and no more than the first 3 beats of the VT episode. The starting point of the 500 ms window is chosen to coincide with the site of the earliest activation wave front in the optical field at the initiation of the VT episode (i.e., the earliest premature beat in the mapping field). Continuous E values are calculated every 160 ms, where each E value represents the E over the 500 ms segment.
Non-sustained VT episodes are classified as self-terminating (ST) and sustained VT episodes as non-self-terminating (NST). NST/VT represented the end of the experiment and no cardioversion of the NST/VT was attempted.
Statistical Analysis
Values are stated as mean ± standard deviation. A 1-way ANOVA is used to determine whether differences existed among groups. The two-tailed, unpaired Student’s t-test with Bonferroni correction was used post-hoc to determine differences between groups. The test does not assume equal variance. A corrected critical value of 0.0125 corresponded to an alpha value of 0.05, and is considered to be significant. The Lilliefors test for normality was used to verify that each of the groups tested were normally distributed.
Results
We analyzed 35 episodes of VT from 14 different hearts (23 ST/VTs, and 12 NST/VTs). In 3 hearts NST/VT only occurred (Figure 1). In 3 hearts, one or more ST/VT was only observed, while in 8 hearts one or more ST/VT occurred before the onset of NST/VT (Figure 2). The average duration of ST/VTs (1–10 s) was 2.32 ± 0.81 s (Figure 2). The Vm/Cai uncoupling during the first 500 ms of VT episodes was analyzed. We then analyzed the average CLs of ST/VT and NST/VTs separately. While NST/VTs have slightly shorter CLs of 149 ± 49 ms compared to 161 ± 38 ms for ST/VTs, the difference was not statistically significant.
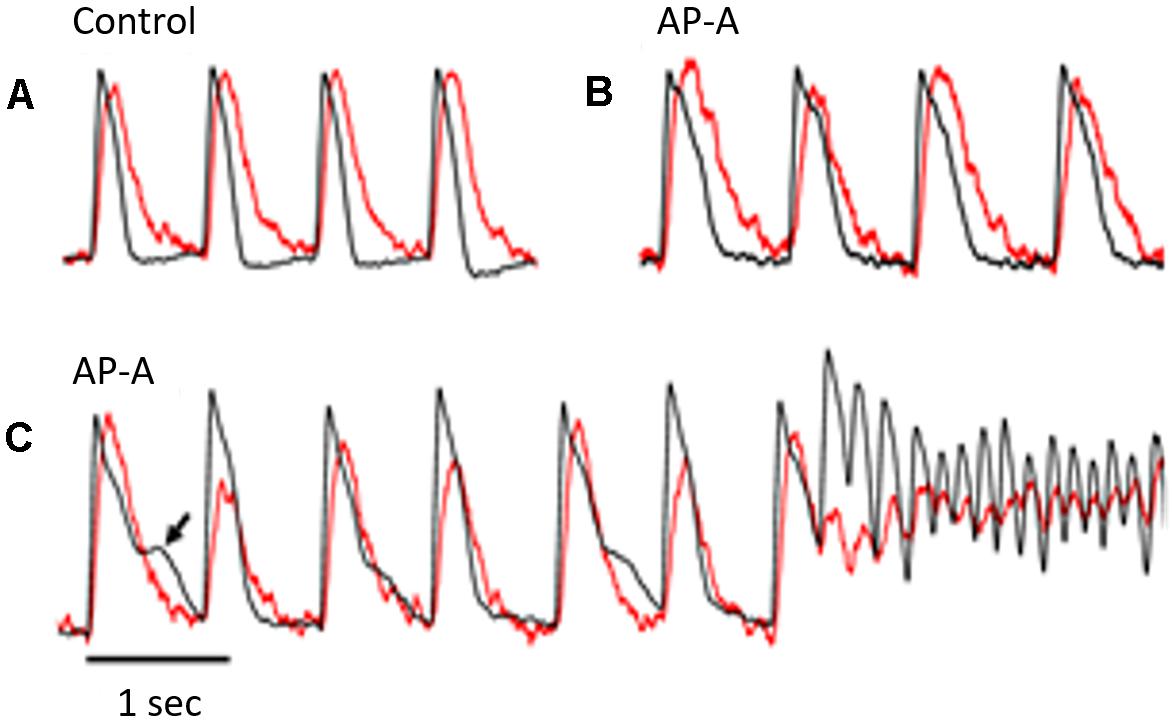
Figure 1. The figure illustrates simultaneous Vm (in black) and Cai (in red) signals from the same pixel during control (A) and following AP-A perfusion (B,C). The heart was paced at a CL of 750 ms. The Cai transient followed the Vm by approximately 10–15 ms. (B) Was obtained 3 min following AP-A perfusion and shows that both Vm and Cai durations increased by approximately 40–50%. It also shows the development of a moderate degree of alternans of both amplitude and duration of the Cai transient but no detectable change in the Vm duration. (C) Was obtained following 10 min of AP-A perfusion and illustrates the development of significant alternans of the amplitude and duration of the Cai transient. The Cai transient alternans was associated with significant alternans of Vm duration at plateau level (arrow). A premature beat seemed to arise from the plateau level and initiated a non-self-terminating VT.
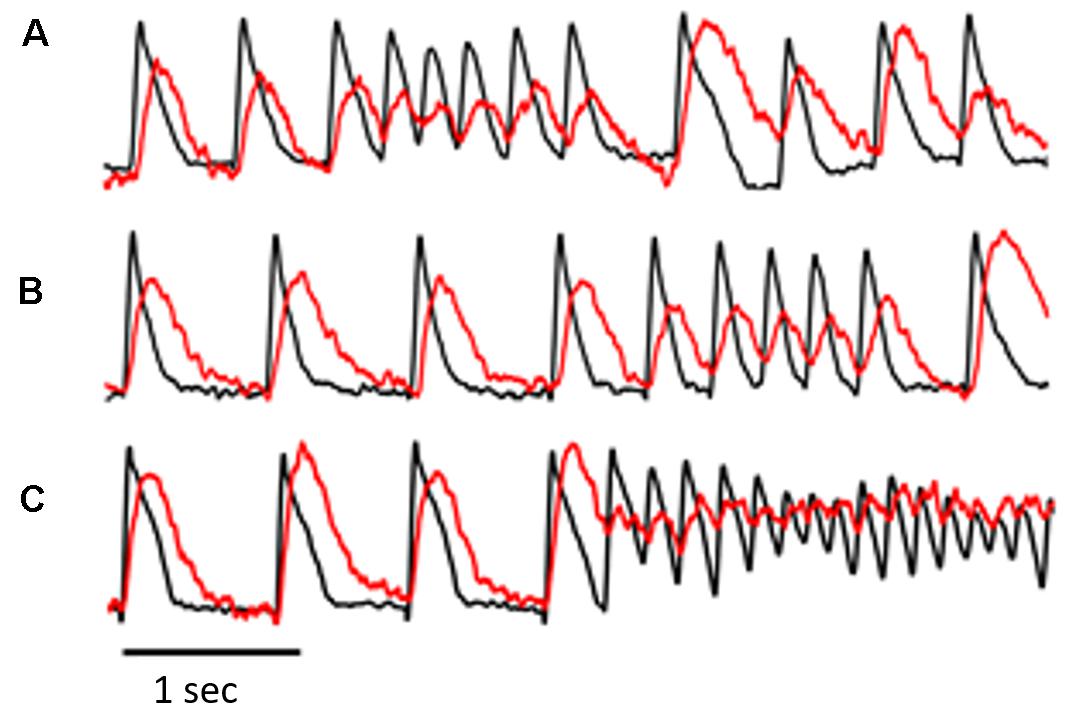
Figure 2. The figure was obtained from a different experiment and illustrates simultaneous Vm and Cai transient recordings from selected pixels in the epicardial optical window. The recordings in (A–C) are consecutive with a few minutes apart. The recordings illustrate a common observation in the AP-A guinea pig surrogate model of LQT3, i.e., the frequent development of ST/VT episodes of variable duration (A,B) before the development of NST/VT (C). An interesting observation in this model shown clearly in (A) is that the first beat following the end of a ST/VT shows significant prolongation of Vm duration and a large increase in both amplitude and duration of the Cai transient. Because of the marked prolongation of the Cai transient, the transient of the next paced beat arose before return to baseline of the preceding Cai transient and initiated Cai transient alternans associated with moderate alternation of Vm duration.
We calculated E values separately for Vm and Cai, and the difference in E values between them (Ed) was considered a measure of the difference in complexity between Vm and Cai dynamics. A continuous E measure increased during ST/VT but the E values for Vm and Cai remained closely coupled (Figure 3A). A continuous measure of E during NST/VT also increased but E values of Vm and Cai diverged from each other (Figure 4A).
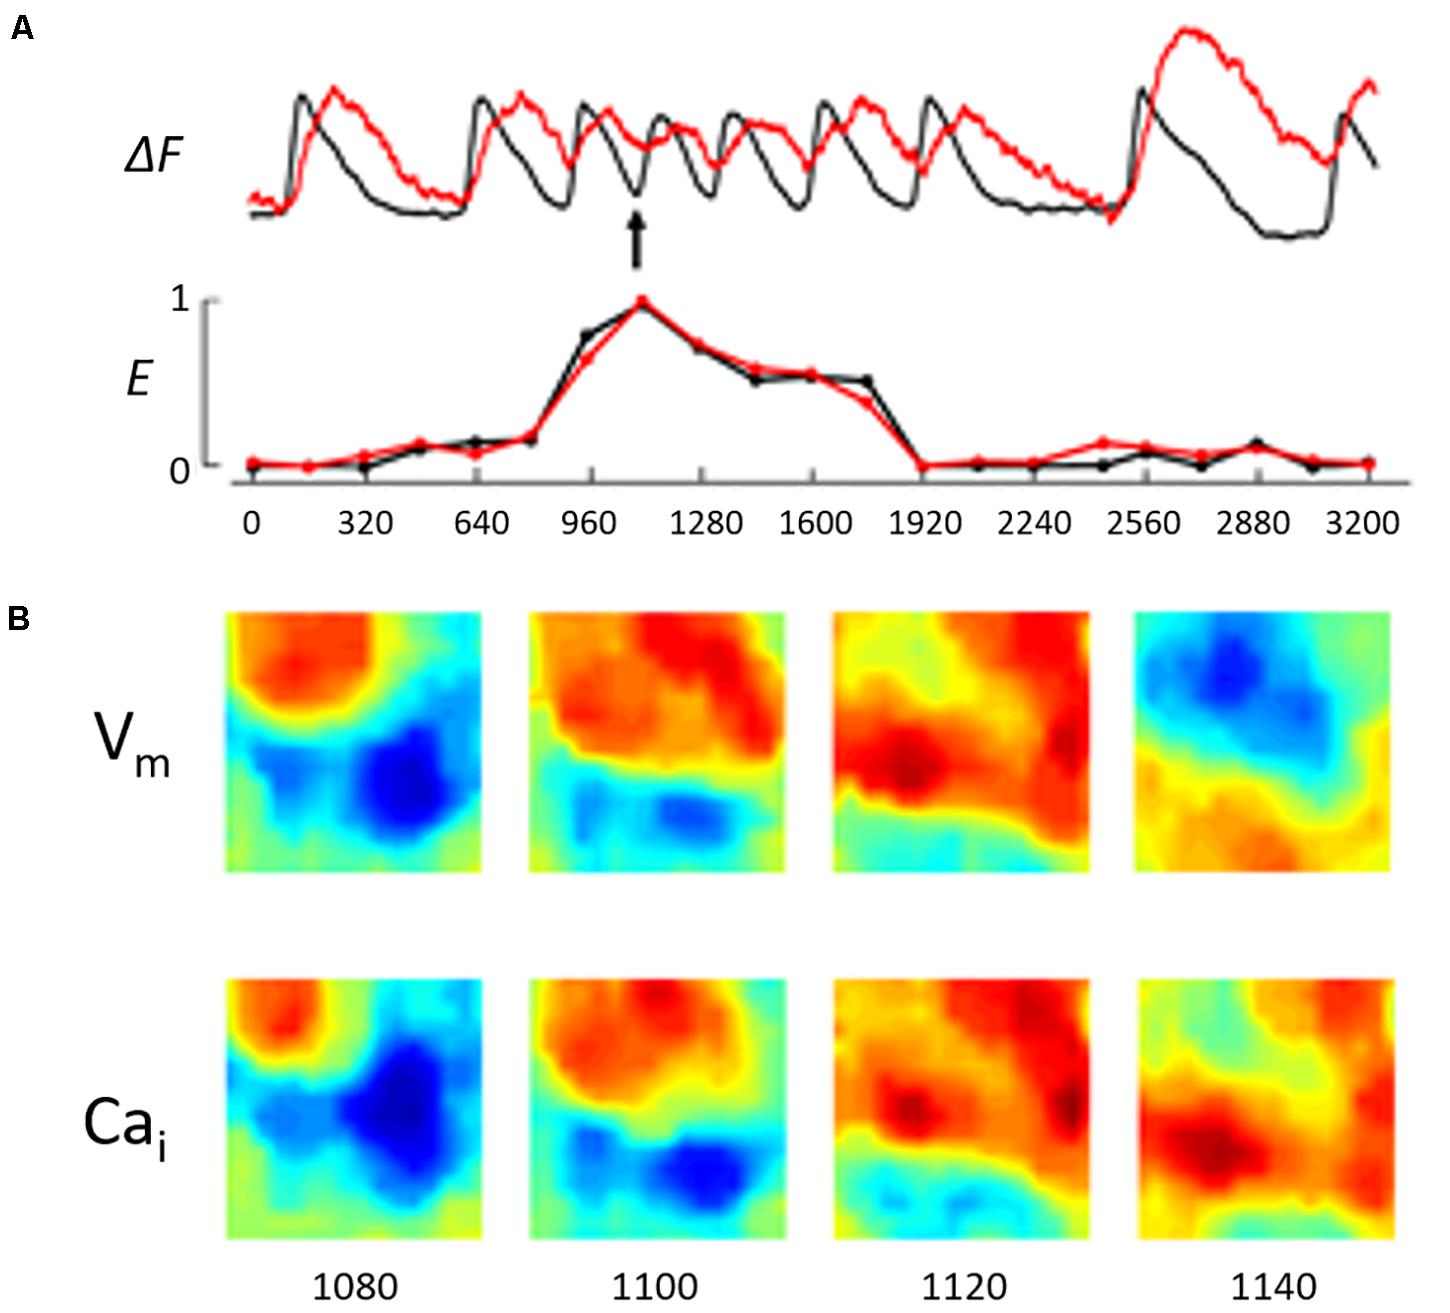
Figure 3. (A) Illustrates a running entropy measure during the ST/VT shown in Figure 2B. This was constructed by calculating the entropy value of Vm and Cai separately at 160 ms intervals. The recording shows the entropy value was close to zero during the basic stimulated beats (first 2 beats and last 2 beats in the recording). During the VT episode the entropy value of both Vm and Cai increased but remained closely coupled reflecting a low degree of entropy difference. We utilized the difference in entropy values, Ed, as measure of the difference in complexity between Vm and Cai dynamics in this system. (B) Illustrates the wave front topology during the early phase of the ST/VT by showing Vm and Cai maps in 4 consecutive frames at 20 ms intervals starting 220 ms from the onset of VT (see arrow). The Vm and Cai activation maps are concordant with the Cai activation wave front closely following the Vm wave front.
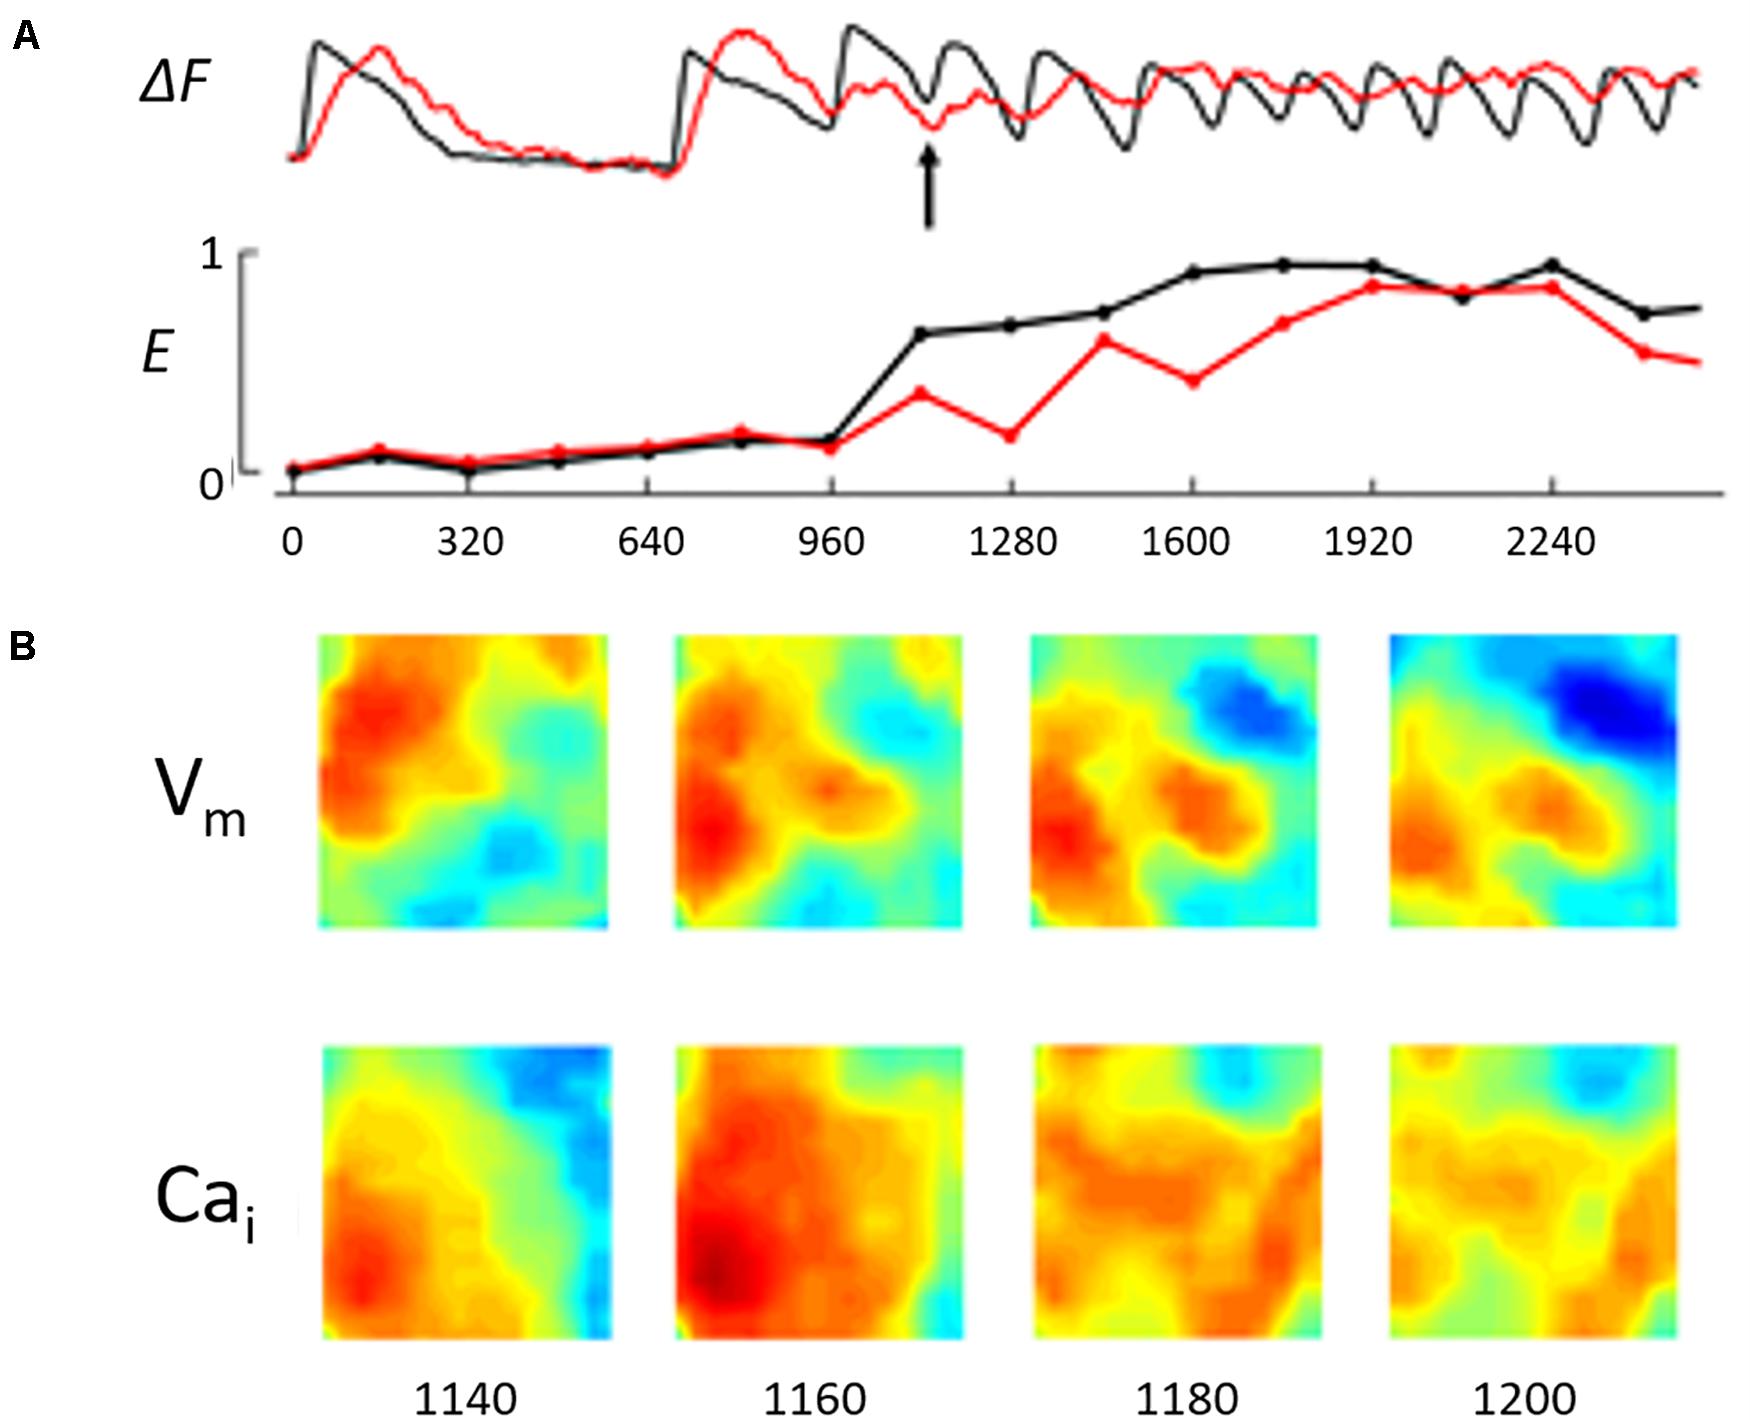
Figure 4. The figure illustrates the Vm/Cai kinetics during the early phase of the NST/VT shown in Figure 1C. (A) Illustrates the running entropy during the NST/VT. The entropy values of both Vm and Cai increased. However, in contrast to the ST/VT, the two entropy values diverged from each other, reflecting a high degree of discordant entropy. (B) Illustrates the Vm and Cai maps in 4 consecutive frames at 20 ms intervals starting at 200 ms from the time of onset of VT (approximately the same as the time frame selected for the ST/VT in Figure 3, see arrow). The Vm and Cai activation maps show discordant wave front topology with evidence of wave break in both the Vm and Cai maps.
We analyzed the wave front topology during the early phase of ST/VTs and NST/VTs. ST/VTs showed the Cai activation wave front in the optical field following closely the Vm activation wave front with no evidence of early wave break, consistent with a lower degree of Ed (Figure 3B). On the other hand, NST/VTs were associated with frequent wave break of both Vm and Cai wave fronts during the early phase of the VT episode illustrating a higher degree of Ed (Figure 4B).
In one experiment a 560 ms episode of fast polymorphic VT at an average CL of 130 ms changed into a monomorphic VT at a CL of 200 ms that lasted for 10 s before it spontaneously terminated. Figure 5 shows simultaneous Vm and Ca wave fronts from the optical field at 50 ms intervals during the first 400 ms of the polymorphic episode. There was no correlation between the Vm and Cai with frequent wave break of both activation wave fronts reflecting a high degree of Ed. The wave break started immediately after the initiating premature beat in the Vm recording.
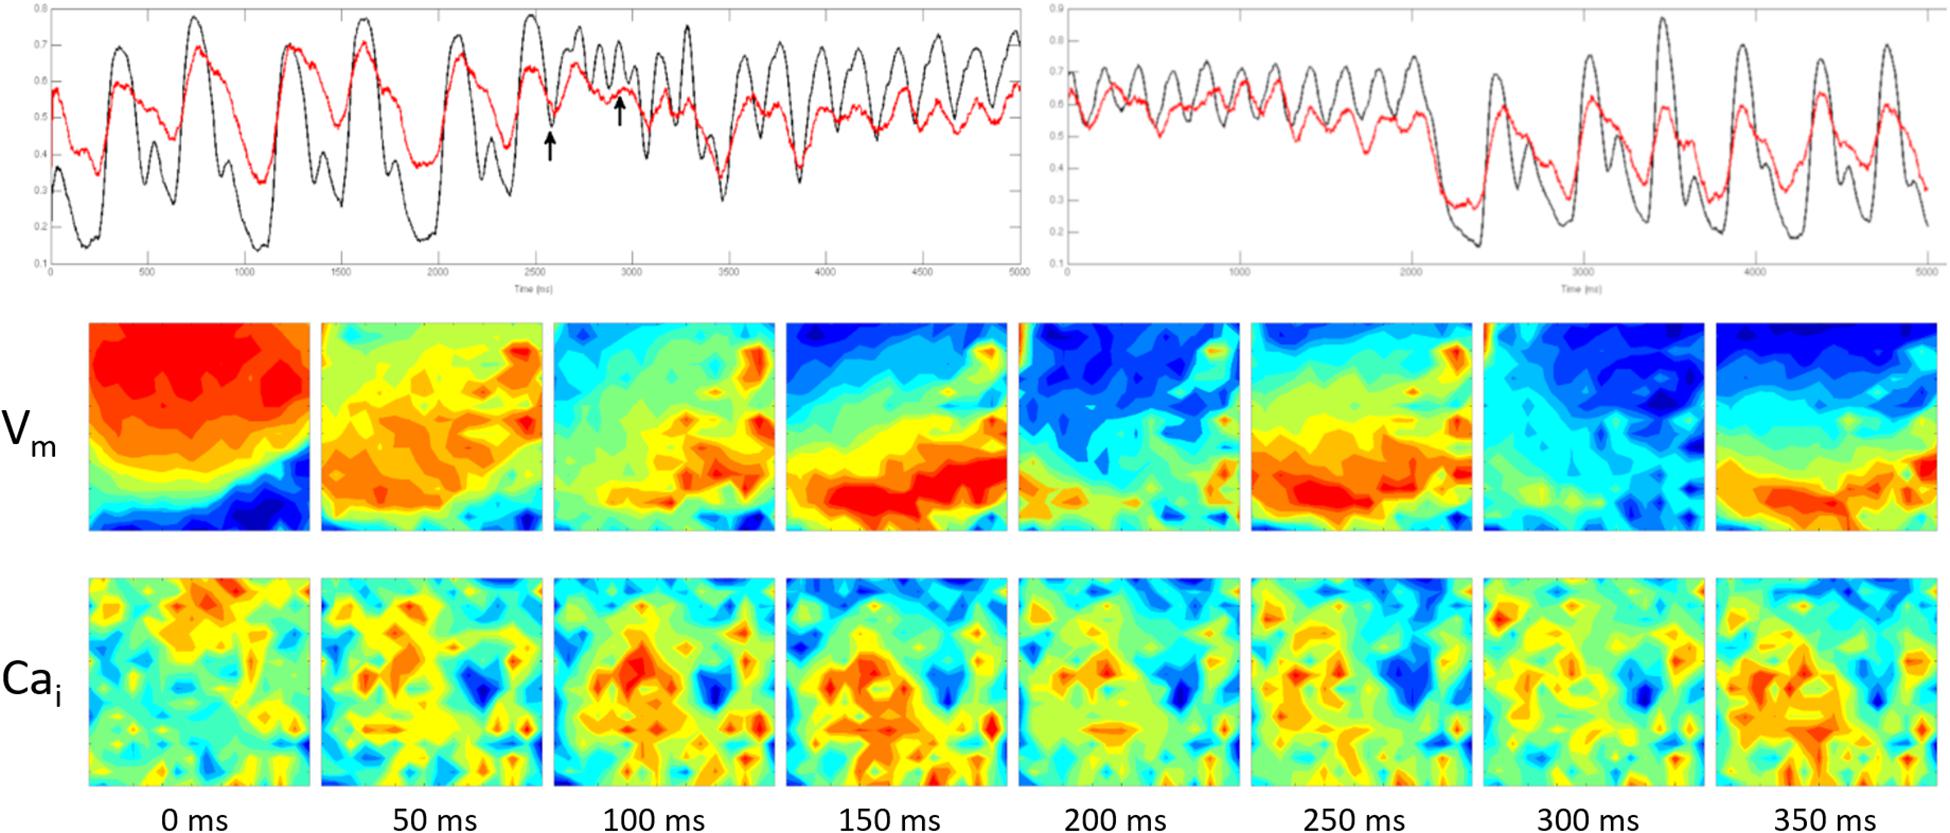
Figure 5. The figure was obtained from a different experiment. Top panel shows simultaneous Vm (black) and Cai (red) recording of spontaneous ventricular rhythm followed by an early premature beat (first arrow) that initiated a 560 ms episode of fast polymorphic VT at an average CL of 130 ms. The polymorphic VT changed into a monomorphic VT at a CL of 200 ms that lasted for 10 s before it spontaneously terminated. The lower two panels show simultaneous Vm and Cai wave fronts from the optical field at 50 ms intervals during the first 400 ms of the polymorphic episode (marked by the two arrows). There was no correlation between the Vm and Cai with frequent wave break of both activation wave fronts reflecting a high degree of Ed. The wave break started immediately after the initiating premature beat in the Vm recording.
Figure 6 shows simultaneous Vm and Cai wave fronts from the optical field covering 400 ms of the monomorphic VT at 50 ms intervals. It shows that the Cai activation wave front regularly followed the Vm wave front with no evidence of wave break reflecting a lower degree of Ed.
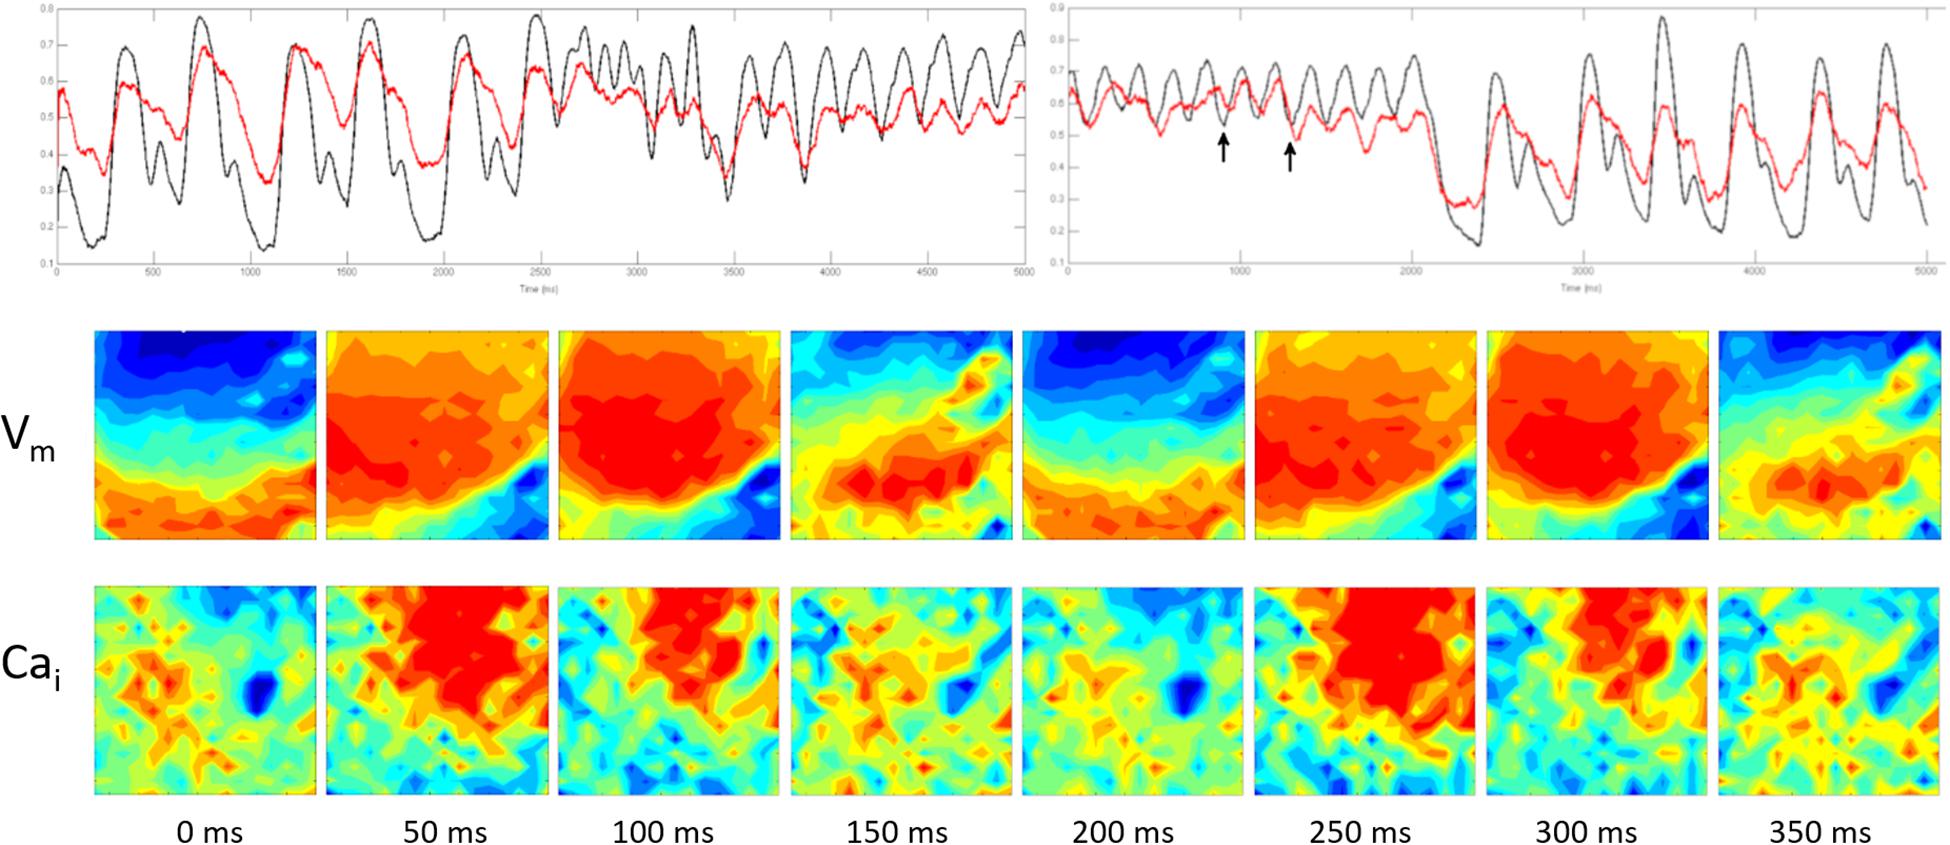
Figure 6. It was obtained from the same experiment shown in Figure 5. The top panel is similar to the top panel shown in Figure 5. The two lower panels show simultaneous Vm and Cai wave fronts from the optical field covering 400 ms of the monomorphic VT at 50 ms intervals (the section marked by the two arrows). It shows that the Cai activation wave front regularly followed the Vm wave front with no evidence of wave break reflecting a lower degree of Ed.
Figure 7 shows that the average Ed values during the basic rhythm preceding the onset of VT were consistently close to zero (0.08). The Ed values for NST/VTs (0.89 ± 0.21) were significantly higher than the Ed values for ST/VTs (0.33 ± 0.18) (p < 0.001).
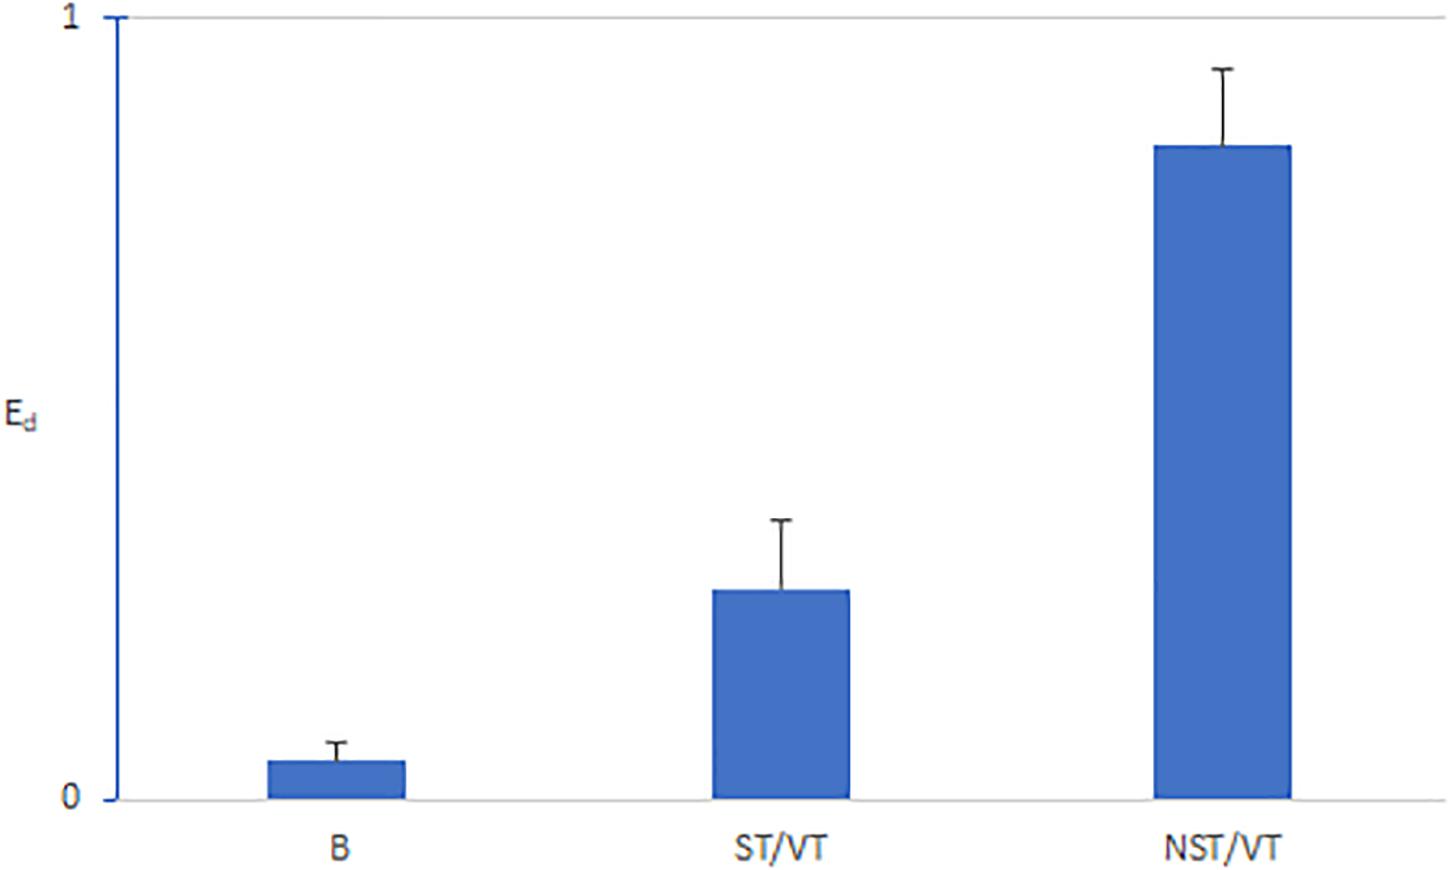
Figure 7. Bar graphs of means and standard deviations of Ed for the basic rhythm preceding VT episodes (B), ST VTs (S), and NSTVT (NST). The Ed values during the basic rhythm were consistently close to zero (0.08). The Ed values for NST/VTs (0.89 ± 0.21) were significantly higher than the Ed values for ST/VTs (0.33 ± 0.18); (p < 0.001).
Discussion
Our study has shown that, in comparison to ST TdP VT, NST TdP VT is consistently predated by early Vm/Cai uncoupling. In a previous study we utilized spatiotemporal entropy to quantify differences in Vm/Cai kinetics during ST/VT and NST/VT in a Langendorff-perfused guinea pig heart subjected to acute ischemia-reperfusion (Himel et al., 2009). By utilizing simultaneous Vm/Cai optical recordings we showed that early Vm/Cai uncoupling predestinates the duration of VT.
Experimental Models of LQTS
Both drug-induced and genetically modified animal models of various species have been generated and utilized to investigate the electrophysiological mechanisms of arrhythmogenesis in LQTS. However, species differences, particularly in repolarization currents, prevent these models from recapitulating all aspects of the electrophysiology of the human disease. Genetically modified animal models such as mice and rabbits are commonly used to investigate the arrhythmogenicity of LQTS (Lang et al., 2016).
On the other hand, two dog models of LQTS and TdP have been extensively investigated. One model is the dog with induced complete AVB. Within a few weeks, complete AVB results in hypertrophy and remodeling of the left ventricle associated with prolongation of the QT interval, action potential duration (APD), as well as spatial dispersion of repolarization (DR) (Vos et al., 1998; Kozhevnikov et al., 2002).
The other dog model (El-Sherif et al., 1988) is created by the neurotoxin Anthopleurin-A (AP-A) that accurately reproduces the molecular changes associated with clinical mutations of the Na channel in patients with LQT3. It is worth mentioning that the model was introduced several years before the first description of the clinical LQT3 syndrome (Wang et al., 1995) and has since showed remarkable similarity to the electrophysiological features of the syndrome. In fact, the ionic alterations of delayed Na channel activation by ATX-II (the equivalent of AP-A) by El-Sherif et al. (1992) are almost identical to those reported in the clinical LQT3 patient (Bennett et al., 1995). Later studies have shown that AP-A can also increase overall Na entry via enhanced Na activity (Wasserstrom et al., 1993; Hanck and Sheets, 1995).
In the canine AP-A model of LQTS, analysis of tridimensional activation patterns showed that the initial beat of polymorphic VT consistently arose as focal activity from a subendocardial site, whereas subsequent beats were due to successive subendocardial focal activity, reentrant excitation, or a combination of both mechanisms (El-Sherif et al., 1996, 1997).
Electrophysiological Mechanisms of the Trigger and Perpetuation of TdP VT in the LQTS
In a previous report by El-Sherif et al. (2019) it was argued that: “Contrary to the established mechanism of the trigger of TdP,” the perpetuation of TdP remains controversial and could be attributed to focal activity, reentrant excitation, or a combination of both mechanisms (Vandersickel et al., 2016, 2017). Both reentrant and focal activity are assumed to be non-stationary. For reentrant excitation, this could be due to a heterogeneity-induced drift of a reentrant circuit (Gray et al., 1995) or a meandering reentrant spiral wave (Winfree, 1995). Alternatively, ectopic beats originating from different locations may explain the perpetuation of TdP.”
It remains an open question why and how ectopic beats emerge and what their relationship to observed EAD activity is. A study by Sato et al. (2009) that combined computational simulation and experimental observations in isolated myocytes showed, “In electrically homogeneous tissue models, chaotic EADs synchronize globally when the tissue is smaller than a critical size. However, when the tissue exceeds the critical size, electronic coupling can no longer globally synchronize EADs, resulting in regions of partial synchronization that shift in time and space. These regional partially synchronized EADs then form premature ventricular complexes that propagate into recovered tissue without EADs thus creating ‘shifting’ foci that resemble polymorphic TdP VT.”
Measurements of Vm/Cai Uncoupling by Spatiotemporal Entropy vs. Conventional APD Dispersion
Spatiotemporal entropy is a measure that has been applied to quantify wave front fractionation in excitable tissues (Jung et al., 2000). E characterizes wave fronts over a spatiotemporal volume, as opposed to comparing time series on a trace-by-trace basis. E does not reflect APD dispersion; instead, it quantifies multiple fractionated wave fronts in the observational window at a particular point in time. E demonstrates the presence and extent of Vm/Cai wave fractionation, which can only be implied but not demonstrated by previous studies of LQTS that use APD dispersion.
Cai Transient/Vm Duration Alternans and TdP
T-wave alternans (TWA) occurs in patients with congenital and acquired forms of LQTS and may precede the onset of TdP (El-Sherif and Turitto, 1999). Although overt TWA in the electrocardiogram is not common, in recent years, digital processing techniques have made it possible to observe more subtle degrees of TWA that were previously undetectable (Verrier et al., 2011). In a previous study, we analyzed the electrophysiological mechanism of the arrhythmogenicity of alternans in the canine AP-A surrogate model of LQTS. We showed that alternans is associated with an increased degree of DR. The present study clearly demonstrates the frequent occurrence of Cai transient alternans and associated Vm duration alternans. It also demonstrates, for the first time, that alternans preceded the onset of NST/VT.
ST Monomorphic VT in LQTS
It is commonly forgotten that a minority of NST/VT in patients with LQTS are monomorphic (in simultaneous ECG leads) rather than polymorphic (some, but not all, can qualify as TdP VT) (El-Sherif and Turitto, 1999). In the present study, 2 of 24 episodes of ST/VTs were monomorphic. Similar observations were reported in the canine AP-A surrogate model on LQTS (El-Sherif, 2001). In a classic review of cardiac arrhythmias by Hoffman and Rosen (1981), the authors showed transmembrane action potential (AP) from a canine Purkinje fiber superfused with cesium chloride (a surrogate experimental model of LQT2). The recording illustrates the classic bradycardia-dependent prolongation of APD associated with membrane oscillations on late phase 2/early phase 3 characteristic of EADs. It also showed that complete repolarization of the AP was followed by a subthreshold delayed after depolarization (DAD). The DAD was explained on the basis of increased intracellular Ca2+ associated with prolonged APD triggering a transient inward current. This may suggest that some rare monomorphic VTs in LQTS could be secondary to DADs.
Study Limitations
Our measurements are obtained from a small two-dimensional window of a considerably larger cardiac tissue volume. Therefore, it is impossible to fully track the origin and fate of most wave fronts propagating through the tissue. This limitation also applies to entropy calculations.
Conclusion
We have shown, for the first time, that differences in wave front topology of Vm and Cai during the first 2 or 3 cycles of TdP VT, which reflects a higher degree of spatiotemporal entropy difference, is associated with an NST/VT episodes as compared to ST/VT. We have also demonstrated the rare, but clinically relevant, phenomenon of monomorphic NST/VT, which suggest an important role of DAD activity in VT episodes.
Data Availability Statement
The raw data supporting the conclusions of this article will be made available by the authors, without undue reservation.
Ethics Statement
The animal study was reviewed and approved by VA New York Harbor Healthcare System IACUC.
Author Contributions
NE-S and MB designed the experiment. HH collected the data. HH and MC analyzed the data and performed the computation and generated figures. NE-S provided the clinical interpretation and expertise and drafted the manuscript. NE-S and MC revised the manuscript. All authors provided input on final manuscript.
Funding
This research was supported in part by the Narrows Institute for Biomedical Research and Education, MERIT award grant#I01-BX007080 and Research Enhancement Award Program (REAP 2000-2005) both sponsored by the Biomedical Laboratory Research and Development Service of the Veterans Affairs.
Conflict of Interest
The authors declare that the research was conducted in the absence of any commercial or financial relationships that could be construed as a potential conflict of interest.
Supplementary Material
The Supplementary Material for this article can be found online at: https://www.frontiersin.org/articles/10.3389/fphys.2021.617847/full#supplementary-material
Abbreviations
AP, action potential; AP-A, Anthopleurin-A; APD, action potential duration; AV, atrioventricular; AVB, atrioventricular block; Cai, intracellular calcium; CL, cycle length; DAD, delayed after depolarization; DR, dispersion of repolarization; E, spatiotemporal entropy; EAD, early after depolarization; Ed, magnitude of difference of spatiotemporal entropy between Vm/Cai; LQTS, long QT syndrome; NST, non-self-terminating; ST, self-terminating; TdP, Torsade de Pointes; TWA, T-wave alternans; Vm, transmembrane voltage; VT, ventricular tachyarrhythmia.
References
Bennett, P. B., Yazawa, K., Makita, N., and George, A. L. Jr. (1995). Molecular mechanism for an inherited cardiac arrhythmia. Nature 376, 683–685. doi: 10.1038/376683a0
Bub, G., Shrier, A., and Glass, L. (2005). Global organization of dynamics in oscillatory heterogeneous excitable media. Phys. Rev. Lett. 94:028105.
Choi, B. R., and Salama, G. (2000). Simultaneous maps of optical action potentials and calcium transients in guinea-pig hearts: mechanisms underlying concordant alternans. J. Physiol. 529(Pt 1), 171–188. doi: 10.1111/j.1469-7793.2000.00171.x
El-Sherif, N. (2001). Mechanism of ventricular arrhythmias in the long QT syndrome: on hermeneutics. J. Cardiovasc. Electrophysiol. 12, 973–976. doi: 10.1046/j.1540-8167.2001.00973.x
El-Sherif, N., Caref, E. B., Yin, H., and Restivo, M. (1996). The electrophysiological mechanism of ventricular arrhythmias in the long QT syndrome. Tridimensional mapping of activation and recovery patterns. Circ Res. 79, 474–492. doi: 10.1161/01.res.79.3.474
El-Sherif, N., Chinushi, M., Caref, E. B., and Restivo, M. (1997). Electrophysiological mechanism of the characteristic electrocardiographic morphology of torsade de pointes tachyarrhythmias in the long-QT syndrome: detailed analysis of ventricular tridimensional activation patterns. Circulation 96, 4392–4399. doi: 10.1161/01.cir.96.12.4392
El-Sherif, N., Fozzard, H. A., and Hanck, D. A. (1992). Dose-dependent modulation of the cardiac sodium channel by sea anemone toxin ATXII. Circ. Res. 70, 285–301. doi: 10.1161/01.res.70.2.285
El-Sherif, N., and Turitto, G. (1999). The long QT syndrome and torsade de pointes. Pacing Clin. Electrophysiol. 22, 91–110.
El-Sherif, N., Turitto, G., and Boutjdir, M. (2019). Acquired long QT syndrome and electrophysiology of torsade de pointes. Arrhythm. Electrophysiol. Rev. 8, 122–130. doi: 10.15420/aer.2019.8.3
El-Sherif, N., Zeiler, R. H., Craelius, W., Gough, W. B., and Henkin, R. (1988). QTU prolongation and polymorphic ventricular tachyarrhythmias due to bradycardia-dependent early afterdepolarizations. Afterdepolarizations and ventricular arrhythmias. Circ. Res. 63, 286–305. doi: 10.1161/01.res.63.2.286
Gray, R. A., Jalife, J., Panfilov, A., Baxter, W. T., Cabo, C., Davidenko, J. M., et al. (1995). Nonstationary vortexlike reentrant activity as a mechanism of polymorphic ventricular tachycardia in the isolated rabbit heart. Circulation 91, 2454–2469. doi: 10.1161/01.cir.91.9.2454
Hanck, D. A., and Sheets, M. F. (1995). Modification of inactivation in cardiac sodium channels: ionic current studies with Anthopleurin-A toxin. J. Gen. Physiol. 106, 601–616. doi: 10.1085/jgp.106.4.601
Himel, H. D., Bub, G., Yue, Y., and El-Sherif, N. (2009). Early voltage/calcium uncoupling predestinates the duration of ventricular tachyarrhythmias during ischemia/reperfusion. Heart Rhythm. 6, 1359–1365. doi: 10.1016/j.hrthm.2009.06.032
Hoffman, B. F., and Rosen, M. R. (1981). Cellular mechanisms for cardiac arrhythmias. Circ. Res. 49, 1–15.
Jung, P., Wang, J., Wackerbauer, R., and Showalter, K. (2000). Coherent structure analysis of spatiotemporal chaos. Phys. Rev. E Stat. Phys. Plasmas Fluids Relat. Interdiscip. Topics 61, 2095–2098. doi: 10.1103/physreve.61.2095
Kozhevnikov, D. O., Yamamoto, K., Robotis, D., Restivo, M., and El-Sherif, N. (2002). Electrophysiological mechanism of enhanced susceptibility of hypertrophied heart to acquired torsade de pointes arrhythmias: tridimensional mapping of activation and recovery patterns. Circulation 105, 1128–1134. doi: 10.1161/hc0902.104711
Lakireddy, V., Baweja, P., Syed, A., Bub, G., Boutjdir, M., and El-Sherif, N. (2005). Contrasting effects of ischemia on the kinetics of membrane voltage and intracellular calcium transient underlie electrical alternans. Am. J. Physiol. Heart Circ. Physiol. 288, H400–H407.
Lang, C. N., Menza, M., Jochem, S., Franke, G., Perez Feliz, S., Brunner, M., et al. (2016). Electro-mechanical dysfunction in long QT syndrome: role for arrhythmogenic risk prediction and modulation by sex and sex hormones. Prog. Biophys. Mol. Biol. 120, 255–269. doi: 10.1016/j.pbiomolbio.2015.12.010
National Research Council (US) Committee for the Update of the Guide for the Care and Use of Laboratory Animals (2011). Guide for the Care and Use of Laboratory Animals, 8th Edn. Washington, DC: National Academies Press.
Nayyar, S., Porta-Sanchez, A., and Nanthakumar, K. (2017). Twisting and turning to find an explanation for torsades de pointes. JACC Clin. Electrophysiol. 3, 1577–1579. doi: 10.1016/j.jacep.2017.09.174
Sato, D., Xie, L. H., Sovari, A. A., Tran, D. X., Morita, N., Xie, F., et al. (2009). Synchronization of chaotic early afterdepolarizations in the genesis of cardiac arrhythmias. Proc. Natl. Acad. Sci. U.S.A. 106, 2983–2988. doi: 10.1073/pnas.0809148106
Vandersickel, N., Bossu, A., De Neve, J., Dunnink, A., Meijborg, V. M. F., van der Heyden, M. A. G., et al. (2017). Short-lasting episodes of torsade de pointes in the chronic atrioventricular block dog model have a focal mechanism, while longer-lasting episodes are maintained by re-entry. JACC Clin. Electrophysiol. 3, 1565–1576. doi: 10.1016/j.jacep.2017.06.016
Vandersickel, N., de Boer, T. P., Vos, M. A., and Panfilov, A. V. (2016). Perpetuation of torsade de pointes in heterogeneous hearts: competing foci or re-entry? J. Physiol. 594, 6865–6878. doi: 10.1113/jp271728
Verrier, R. L., Klingenheben, T., Malik, M., El-Sherif, N., Exner, D. V., Hohnloser, S. H., et al. (2011). Microvolt T-wave alternans physiological basis, methods of measurement, and clinical utility–consensus guideline by International Society for Holter and Noninvasive Electrocardiology. J. Am. Coll. Cardiol. 58, 1309–1324.
Vos, M. A., de Groot, S. H., Verduyn, S. C., van der Zande, J., Leunissen, H. D., Cleutjens, J. P., et al. (1998). Enhanced susceptibility for acquired torsade de pointes arrhythmias in the dog with chronic, complete AV block is related to cardiac hypertrophy and electrical remodeling. Circulation 98, 1125–1135. doi: 10.1161/01.cir.98.11.1125
Wang, Q., Shen, J., Splawski, I., Atkinson, D., Li, Z., Robinson, J. L., et al. (1995). SCN5A mutations associated with an inherited cardiac arrhythmia, long QT syndrome. Cell 80, 805–811. doi: 10.1016/0092-8674(95)90359-3
Wasserstrom, J. A., Kelly, J. E., and Liberty, K. N. (1993). Modification of cardiac Na+ channels by anthopleurin-A: effects on gating and kinetics. Pflugers Arch. 424, 15–24. doi: 10.1007/bf00375097
Keywords: long QT syndrome, Torsade de Pointes tachyarrhythmias, optical mapping, spatiotemporal entropy, voltage/intracellular calcium uncoupling
Citation: Himel HD, Cupelli M, Boutjdir M and El-Sherif N (2021) Voltage/Calcium Uncoupling Underlies Sustained Torsade de Pointes Ventricular Tachyarrhythmia in an Experimental Model of Long QT Syndrome. Front. Physiol. 12:617847. doi: 10.3389/fphys.2021.617847
Received: 17 November 2020; Accepted: 12 January 2021;
Published: 28 January 2021.
Edited by:
Jiashin Wu, University of South Florida, United StatesReviewed by:
Robert Kass, Columbia University, United StatesCandido Cabo, The City University of New York, United States
Copyright © 2021 Himel, Cupelli, Boutjdir and El-Sherif. This is an open-access article distributed under the terms of the Creative Commons Attribution License (CC BY). The use, distribution or reproduction in other forums is permitted, provided the original author(s) and the copyright owner(s) are credited and that the original publication in this journal is cited, in accordance with accepted academic practice. No use, distribution or reproduction is permitted which does not comply with these terms.
*Correspondence: Nabil El-Sherif, bmVsc2hlcmlmQGFvbC5jb20=