- 1Centre for Research on Environmental Ecology and Fish Nutrition of the Ministry of Agriculture, Shanghai Ocean University, Shanghai, China
- 2Key Laboratory of Freshwater Aquatic Genetic Resources, Ministry of Agriculture, Shanghai Ocean University, Shanghai, China
- 3Graduate School of Human Development and Environment, Kobe University, Kobe, Japan
The Qingtian paddy field carp (Cyprinus carpio var qingtianensis) is a local carp cultivated in the rice field of Qingtian county, Zhejiang province, China. Its high tolerance to hypoxia makes it an ideal organism for studying the molecular regulation mechanism during hypoxia process as well as reoxygenation following hypoxia in fish. In this study, we counted the differentially expressed genes (DEGs) altered during hypoxic exposure and reoxygenation process. The results indicated that 2236 genes (1506 up-regulated genes and 730 down-regulated genes) were differentially expressed between the control and hypoxic groups. The results from Kyoto Encyclopedia of Genes and Genomes (KEGG) enrichment analysis indicated that 1152 of 2236 genes were enriched, and those genes participated in energy metabolism, reactive oxygen species (ROS) elimination, acceleration of cell apoptosis, inhibition of growth, and other processes. We found activation of the pentose phosphate pathway in hypoxia treatment, suggesting that carbohydrates not only provide energy for metabolism but also provide NADPH for protecting the body from oxidative damage and ribosomes for promoting RNA synthesis. During reoxygenation, 4509 genes (1865 up-regulated genes and 2644 down-regulated genes) were differentially expressed. The results of KEGG enrichment analysis indicated that 2392 of 4509 genes were enriched, and participated in pyruvate and lactic acid metabolism, synthesis of amino acids and lipids, inhibition of cell apoptosis, regulation of cell growth and differentiation, and other processes. These differentially expressed genes effectively alleviate the body acidosis and promote the normal growth and development of the body. Through the analysis of KEGG pathway enrichment, we observed that the physiological regulation of Qingtian paddy field carp during the processes of hypoxia and reoxygenation is not a simple and reversible process. This work first reported the adaptive mechanism of hypoxia and the recovery mechanism of reoxygenation after hypoxia in common carp, and also provided new insights for the physiological regulation of fish under hypoxia treatment.
Introduction
Fish are prone to stress in response to low dissolved oxygen (DO) levels, which is extremely common in aquatic ecosystems due to natural causes such as diurnal oscillations in algal respiration, seasonal flooding, stratification, and isolation of densely vegetated water bodies, as well as to more recent anthropogenic causes (e.g., eutrophication) (Hughes, 1973; Herbert and Steffensen, 2005; Gooday et al., 2009). It is even more common for fish to encounter hypoxic stress in aquaculture systems where fish are often cultured with high densities or are limited by the environmental conditions and farming modes such as in the shallow rice fields (e.g., rice-fish co-culture). In response to long-term hypoxic stress, fish might solve these problems by avoidance, or by adaptive evolution (e.g., specialized respiratory organs and increased blood vessels in skin) (Mandic et al., 2008; Shields and Knight, 2011; Zaccone et al., 2018). Stress response to acute hypoxia can be easily induced in fish. Moreover, fish are especially vulnerable to oxidative damage from rapid reoxygenation following hypoxic stress (Hermes-Lima and Zenteno-Savin, 2002). They reduce damage caused by hypoxia and acute reoxygenation through their physiological metabolism regulation by increasing antioxidant enzyme activities, O2 affinity of blood, and by reducing energy available for biosynthesis (e.g., synthesis of glycogen and lipid) (Hughes, 1973; Ishimatsu and Itazawa, 1983; Cooper et al., 2002; Wu, 2009; Wang and Richards, 2011). The damage of hypoxia to fish includes reduced growth and reproduction and death in severe cases (Pérès et al., 1973; Wu, 2009; Shields and Knight, 2011). Fish can adapt to hypoxia to reduce the possible damage by decreasing basal metabolism and increasing energy metabolism (Muusze et al., 1998). When fish are subjected to hypoxia in aquaculture, people usually resort to increase dissolved oxygen in the water to alleviate the hypoxic conditions. However, due to the lack of systematic studies, it is yet unknown whether the reoxygenation of fish following hypoxia is a simple reversible physiological process.
To understand the physiological responses in the reoxygenation of fish after hypoxia, previous studies primarily analyzed the changes of antioxidant enzyme activity, energy metabolism, and other phenotypic physiological changes (Hughes, 1973; Thomas et al., 1988; Muusze et al., 1998). In addition, some researchers have studied the regulatory mechanism of hypoxic adaptability in aquatic animals through transcriptome, proteome, metabolome, and other molecular biological techniques. However, no efforts have been made to explore the whole physiological response and regulatory mechanism of reoxygenation following hypoxia. In this study, the Qingtian paddy field carp (PF-carp), also known as the Oujiang color carp (Wang et al., 2006; Xie et al., 2011) (Cyprinus carpio var. color) was chosen as a typical model. These fish have been co-cultured with rice in paddy fields for more than 1200 years as they showed strong tolerance to hypoxia (Ren et al., 2018). At present, the research on PF-carp mainly focused on the symbiotic relationship between rice and fish, body color, et.al (Wang et al., 2006; Xie et al., 2011; Ren et al., 2018). The dissolved oxygen concentration in this rice-fishery symbiotic system has been reported to be higher than 6 mg/L, and there is a significant diurnal variation in dissolved oxygen (Guo et al., 2020). PF-carp was used in this study because this species had already become well adapted to shallow rice fields during the long history of co-culturing of rice and fish and they may have evolved the capability of strong tolerance to hypoxia. However, the mechanism of hypoxia adaptation has not been clarified yet, thus it is essential to explore its physiological response and molecular regulatory mechanisms to hypoxia and reoxygenation.
RNA-seq had been successfully applied to the study of environmental toxicology, nutritional intervention and growth and development of fish (Wang et al., 2016; Caballero-Solares et al., 2018; Qi et al., 2018). RNA-seq analysis is an appropriate analysis for this study, because it can effectively differentiate differentially expressed genes (DEGs) between different test groups. We also used RNA-seq to screen DEGs between the control and the hypoxic and reoxygenated groups as well as Kyoto Encyclopedia of Genes and Genomes (KEGG) pathway enrichment analysis to understand high-level functions and utilities of the hepatopancreas in response to hypoxia and reoxygenation. Our main objectives were to determine the acting genes that are involved in physiological response to hypoxia and the molecular mechanisms for this carp to reoxygenation following acute hypoxia.
Materials and Methods
Experimental Fish, Acute Hypoxia and Reoxygenation Exposure Experiment
Healthy juvenile PF-carps were transferred from the Yugong ecological agriculture technology Co, Ltd (Qingtian, Zhejiang, China) to the fisheries ecology laboratory at Shanghai Ocean University. Three polyethylene tanks (250-L) were prepared and 9 PF-carps were randomly kept in each tank for 2 weeks prior to the acute hypoxic and reoxygenation experiments. Their individual specifications are 56.64 ± 10.74 g in weight, 15.36 ± 1.29 cm in length, and 102 days old. The fish were fed with artificial feed (1% of the weight of fish: 30% crude protein content and 3% crude fat content; Techbank, China) at 8:00 and water was changed (50% of the volume of in the tank) at 18:00 once a day for two weeks before the experiments. Water temperature was maintained at 25.17 ± 0.41°C and DO was controlled at 6.56 ± 0.20 mg/L. Feeding was stopped and all of the water was replaced one day before the experiment was conducted; multifunctional dissolved oxygen instrument (YSIPro20, United States) was used to detect water temperature and dissolved oxygen every 10 min. In order to reduce the stress resulted from changing water on fish, the juvenile carps were allowed to acclimated for 6 h before the experiment.
At the beginning of the experiment, 3 juvenile PF-carps were picked from each of the three tanks and euthanized with a concentration of 0.3 mg/L MS-222. Their hepatopancreases were excised and immediately frozen in liquid nitrogen. The samples were transferred to a −80°C freezer. Total RNA was subsequently extracted from mixtures of samples from each group of three fish. The DO during this process was 6.53 ± 0.41 mg/L (hereafter, control group as CH). Next, we quickly flushed the water of the three tanks with N2 to reduce the level of dissolved oxygen until the DO was at about 0.5 mg/L, when the juvenile carps swam to surface because of hypoxia. The hypoxia treatment was regulated by flows of N2 and O2 to maintain DO concentration of 0.5 mg/L with water temperature of 25°C. The hypoxic stress experiment lasted for 6 h, during which DO was averaged at 0.53 ± 0.07 mg/L and temperature averaged 25.37 ± 0.45°C. Samples were collected at 6 h in the same way as the samples taken from the CH group (hereafter, hypoxic stress group as HH). The RNA-seq results were defined as HH. At the end of the hypoxic stress experiment, injection of N2 into the water was stopped and O2 was rapidly injected to raise the level of dissolved oxygen in the water of the three tanks until they reached about 7 mg/L. Then the injection of O2 was regulated to maintain a constant high level. The reoxygenation process lasted for 6 h and the DO was averaged 6.64 ± 0.18 mg/L and temperatures averaged 25.21 ± 0.37°C (hereafter, reoxygenation group as RH). Samples were collected after 6 h of reoxygenation in the same way as samples from the CH group. The results of RNA-seq were defined as RH.
RNA Extraction, Library Preparation, and Sequencing
Total RNAs of hepatopancreas (n = 3 per group) was isolated using the TRIzol (Invitrogen, Carlsbad, CA, United States) reagent following the manufacturer’s instructions, and genomic DNA was removed with DNase I (Takara, Shanghai, China). Then, RNA quality was determined by Bioanalyzer 2100 (Agilent Technologies, United States) and quantified using the ND-2000 (NanoDrop Technologies, United States). Only high-quality RNA samples (OD 260/280 ≥ 1.9, OD 260/230 ≥ 1.5, RIN ≥ 8.0) were used to construct a sequencing library.
After quality control, these RNAs were reversed into cDNAs for sequencing as 150 bp paired-end reads on Illumina NovaSeq 6000 (Illumina, United States) by Major Bioinformatics Technology Co., Ltd (Shanghai, China).
Quality Control and Sequence Alignment
The image signals of sequences were output by Illumina Novaseq 6000 sequencing system, and converted into text data after CASAVA base calling and stored in FASTQ format as raw data (raw reads). After quality control, clean reads were obtained by using SeqPrep and Sickle software (Hirsch et al., 2014) to remove the splice and N (N: modular base) sequences from raw reads and to filter the low quality sequences (quality value < 20). After quality control, the error rate, Q20, Q30, and GC contents of clean reads were calculated to evaluate the sequencing quality.
Based on the improved BWT (Burrows - Wheeler transform) algorithm, clean reads were compared with the common carp genome (Cyprinus carpio, GCF_000951615.1, https://www.ncbi.nlm.nih.gov/assembly/GCF_000951615.1/) (Xu et al., 2014) using HISAT v.2 2.1.0 software (Kim et al., 2019) to obtain mapped reads for subsequent analysis.
All data sets of transcriptome had been submitted to the National Center for Biotechnology Information (NCBI) Sequence Read Archive (SRA) database (accession number SRX7829257).
Transcriptome Assembly and Annotation
With the genome information of carp as reference, the mapped reads were spliced and finally assembled into transcripts using Cufflinks v. 2.2.1 software (Trapnell et al., 2012). Then GffCompare was used to compare the assembled transcript with the known transcript, and unknown genes and new transcripts were identified. The transcriptomes assembled were annotated using BLAST + v.2.9.0 against the NCBI non-redundant protein database (Nr represent as follow), the Swiss-Port database (Swiss-Port), the Clusters of Orthologous Groups of protein database (COG), the GO Ontology database (GO), the Kyoto Encyclopedia of Genes and Genomes database (KEGG) and the Pfam protein families database (Pfam) and annotation information was procured.
Differential Expression Analysis of Genes and Enrichment Analysis
Gene expression values were calculated using the TPM (transcripts per million reads) value in RESM v.1.3.1 software. For libraries of three experimental groups, the read counts were adjusted by DEGseq2 v. 1.24.0 (Robinson et al., 2010) through one scaling normalized factor. Wilcoxon rank sun test was used to correct P-values to obtain adjusted P-value (P-adjust) during the statistical calculation of differential expressions. And then P-adjusted < 0.05 and | log2(foldchange)| ≥ 1 were set as the threshold for significantly differences to screen for the differentially expressed genes (DEGs).
The Goatools v. 0.6.5 software (Klopfenstein et al., 2018) was used for GO enrichment analysis of the DEGs, so as to obtain the main GO functions of DEGs. The DEGs were analyzed by KOBAS v.2.1 (Mao et al., 2005)and the result of the KEGG enrichment obtained. When P-adjusted < 0.05, GO functions and KEGG pathways were considered to be significantly enriched. In order to understand the changes of physiological metabolism of PF-carp in the process of hypoxia and reoxygenation, KEGG pathway classifications of Metabolism, Cellular Processes, Environmental Information, Organismal Systems and Genetic Information Processing were screened for subsequent analysis.
Real-Time Quantitative PCR Validation
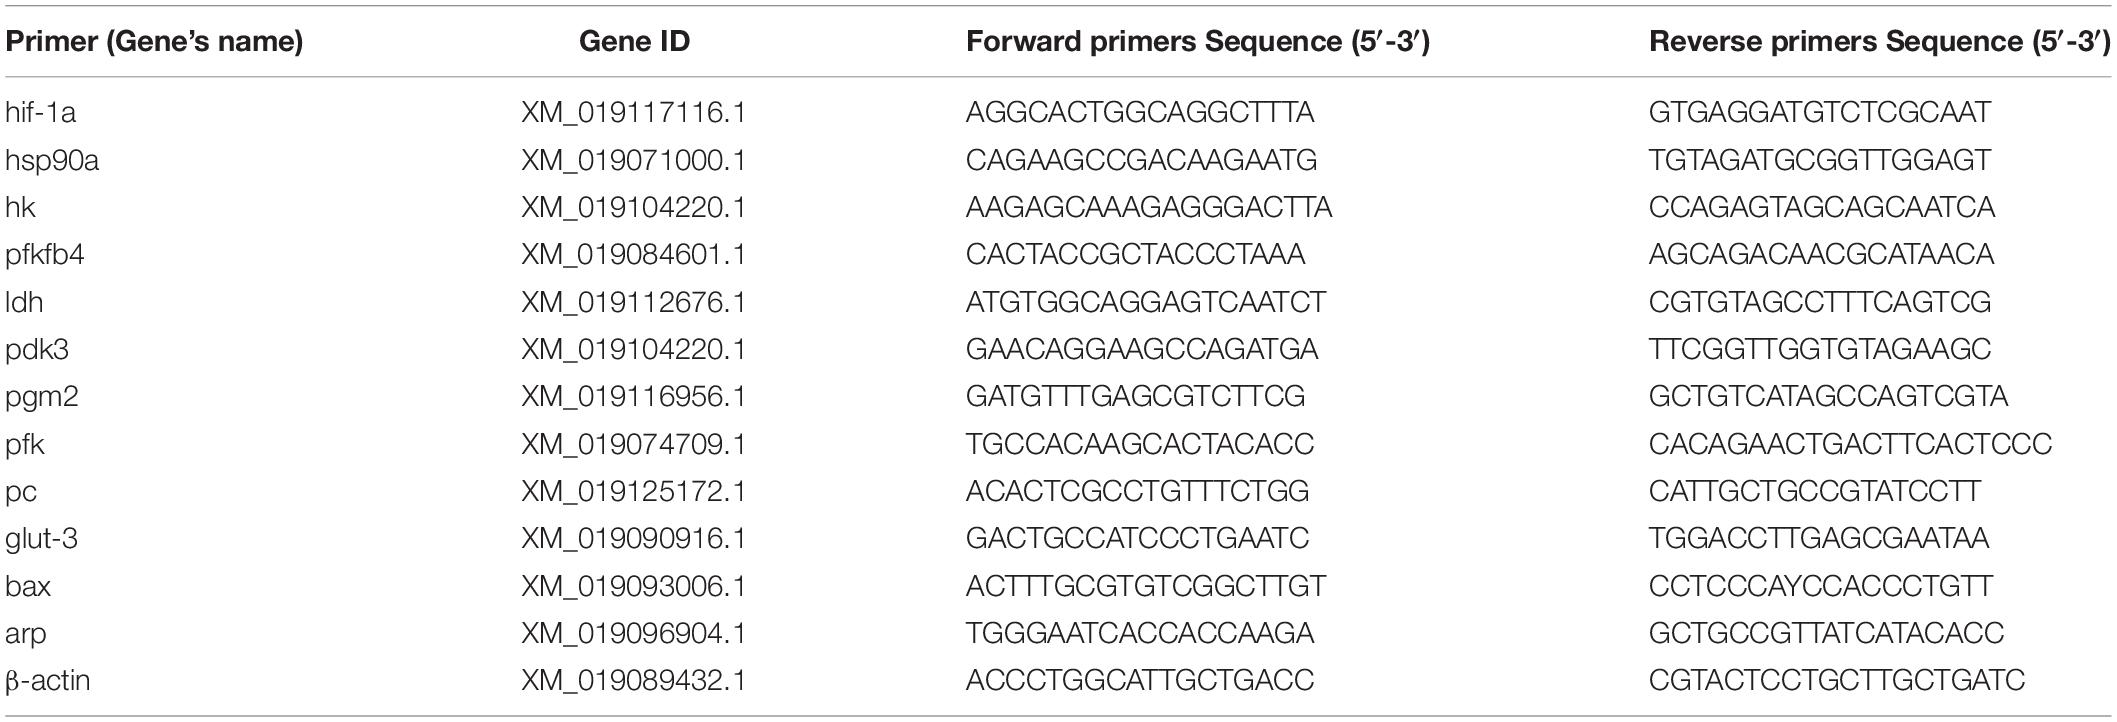
In order to evaluate the accuracy of transcriptome sequencing results, eleven DEGs that differentially expressed more than 2 times were randomly selected from the CH, HH and RH groups for RT-qPCR verification. Primers for DEGs were designed in Primer Premier v.6.0 for RT-qPCRs based on mRNA sequences of the common carp. To standardize the gene expression levels of the DEGs in different groups, apr (acidic ribosomal phosphoprotein P0) and β-actin (beta-actin) were selected as internal reference genes. According to the experimental requirements of the real-time fluorescence quantitative PCR instrument (ABI 7500, United States), 20 μL of a solution [16.5 μL ChamQ SYBR Color qPCR Master Mix(2x), 0.8 μL of each primer (5 μM), and 2 μL template (cDNA)] was used. The PCR reaction conditions were as follows: 95°C for 5 min, followed by 40 cycles of 95°C for 5 s, 50 or 55°C for 30 s and 72°C for 40 s. By comparing CT(ΔΔCT) values, the relative expression was estimated between different groups. Three biological replicates and three technical replicates were performed on the RT-qPCR experiment of DEGs.
GraphPad Prism 7.0 software was used to analyze the results of gene differential expression in RT-qPCR and RNA-seq, and the results were displayed with graphs.
Results
Quality Assessment of Transcriptome Sequencing Data
9 separate cDNA libraries from three groups were sequenced by Illumina Novaseq 6000 paired-end sequencing system to produce 66.86 Gb of raw bases. We obtained 440,641,918 raw reads (66.86 Gb), of which 437,430,924 passed the quality control processes. The data size of clean reads per library ranged from 6.54 Gb∼7.73 Gb. At the same time, the clean reads were compared with the reference genome. Parameter statistics of clean reads among the control, hypoxia and reoxygenated groups were Q20: 98.33∼98.89%; Q30: 94.63∼96.35%; GC content: 48.15∼49.12%; error rate: 0.023∼0.024%. Clean reads of each library performed sequence alignment with the reference genome information of common carp to obtain mapped reads, and total ratio of each sample was 79.29%∼80.91% (Table 1).
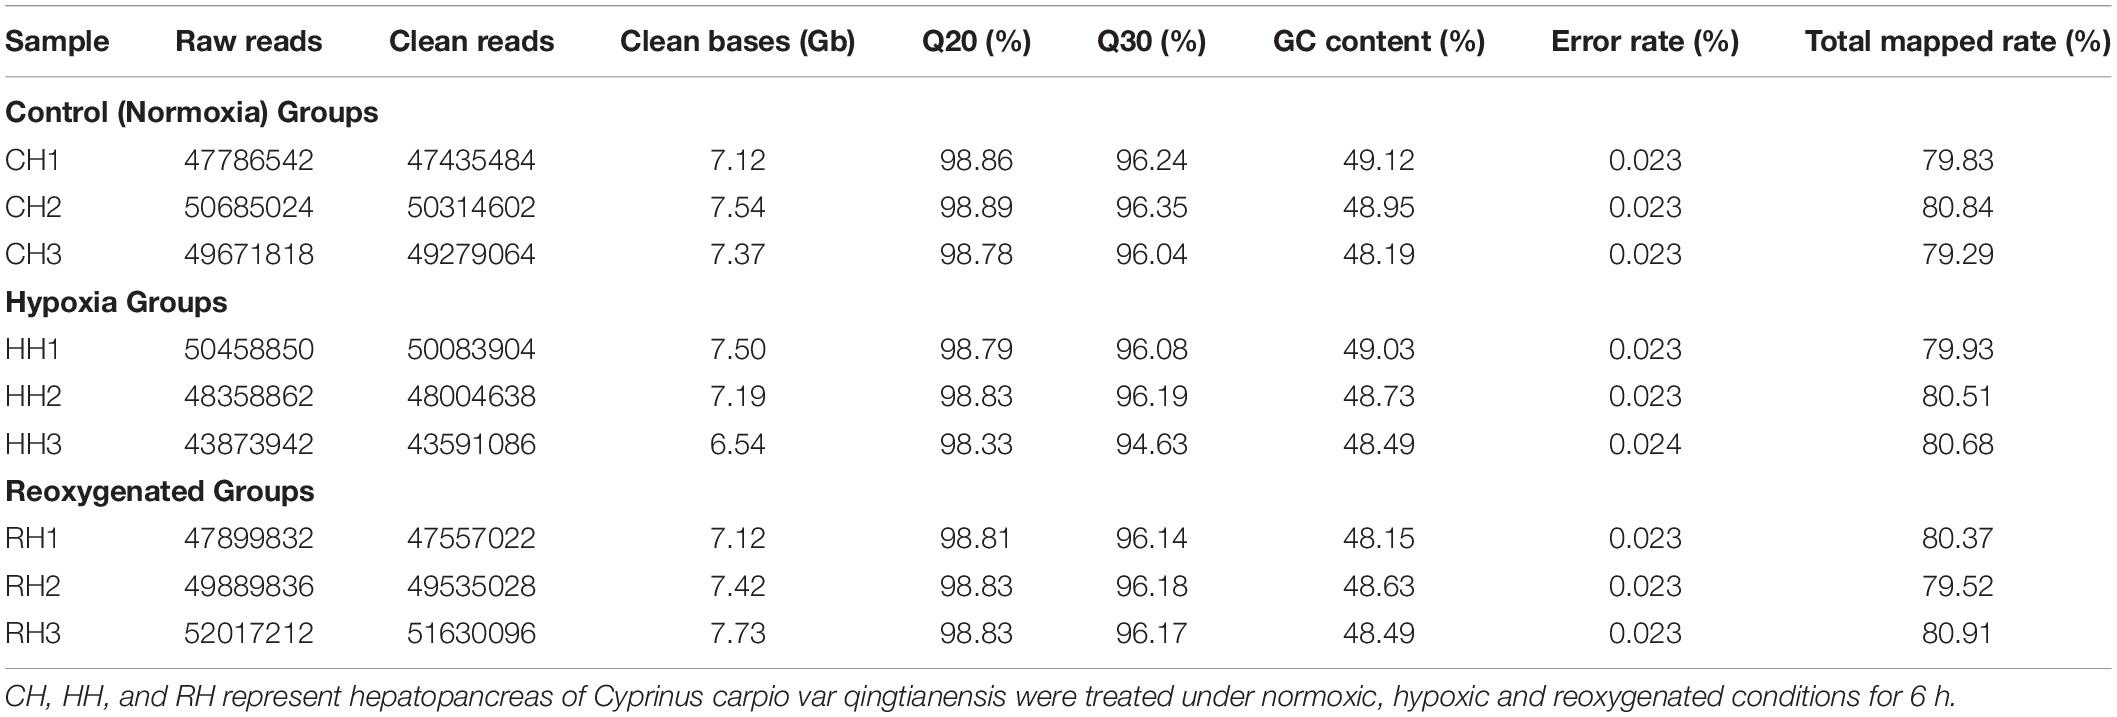
Table 1. Statistical of the raw and clean sequencing of the RNA-seq library of Cyprinus carpio var qingtianensis.
Transcriptome Assembly and Annotation
According to the information of mapped reads, a total of 86,524 transcripts were assembled by Cufflinks (Figure 1). The assembled transcripts were annotated against six public databases (NR, Swiss-Prot, COG, GO, KEGG, Pfam) with 81,408, 72,157, 77,905, 36,715,52,093, and 5,5959 transcripts, respectively, and 81,534 transcripts can be annotated effectively in six databases (Figure 2).
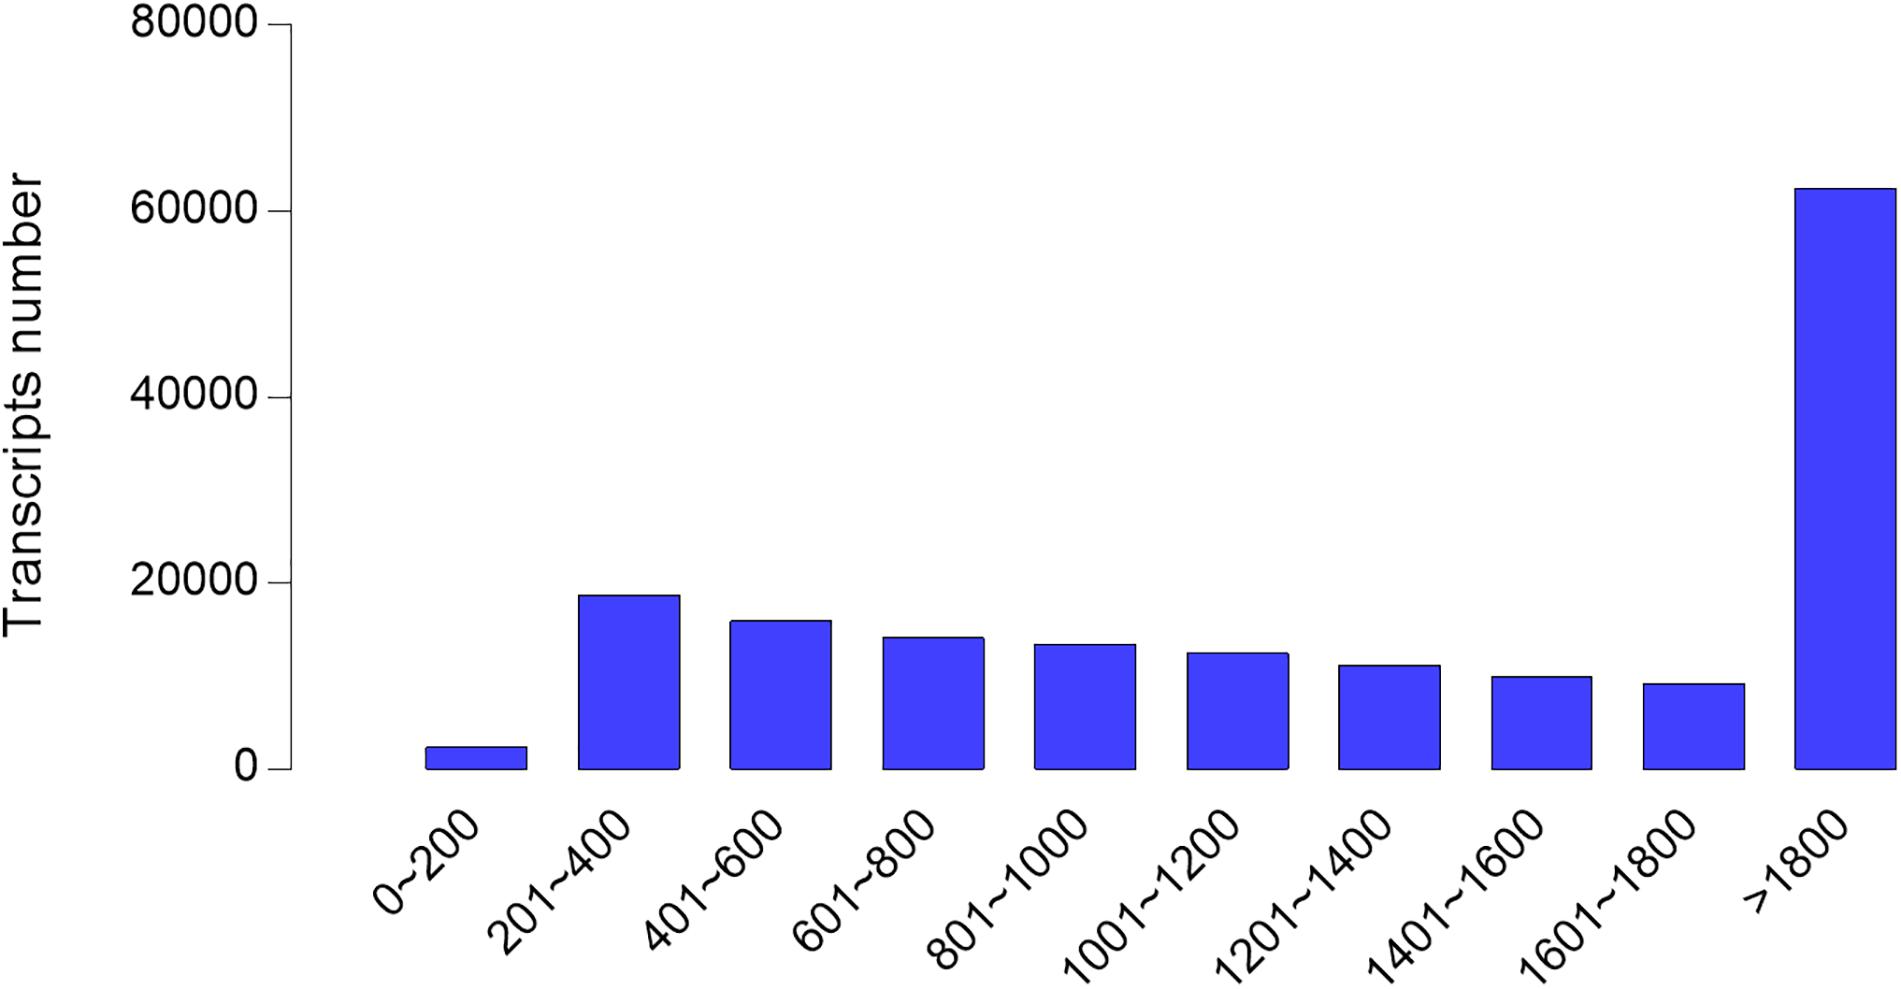
Figure 1. Transcript length distribution after assembled in hepatopancreases of Cyprinus carpio var qingtianensis. Most of the assembled transcripts are long transcripts, indicating that the quality of the assembled transcripts is good.
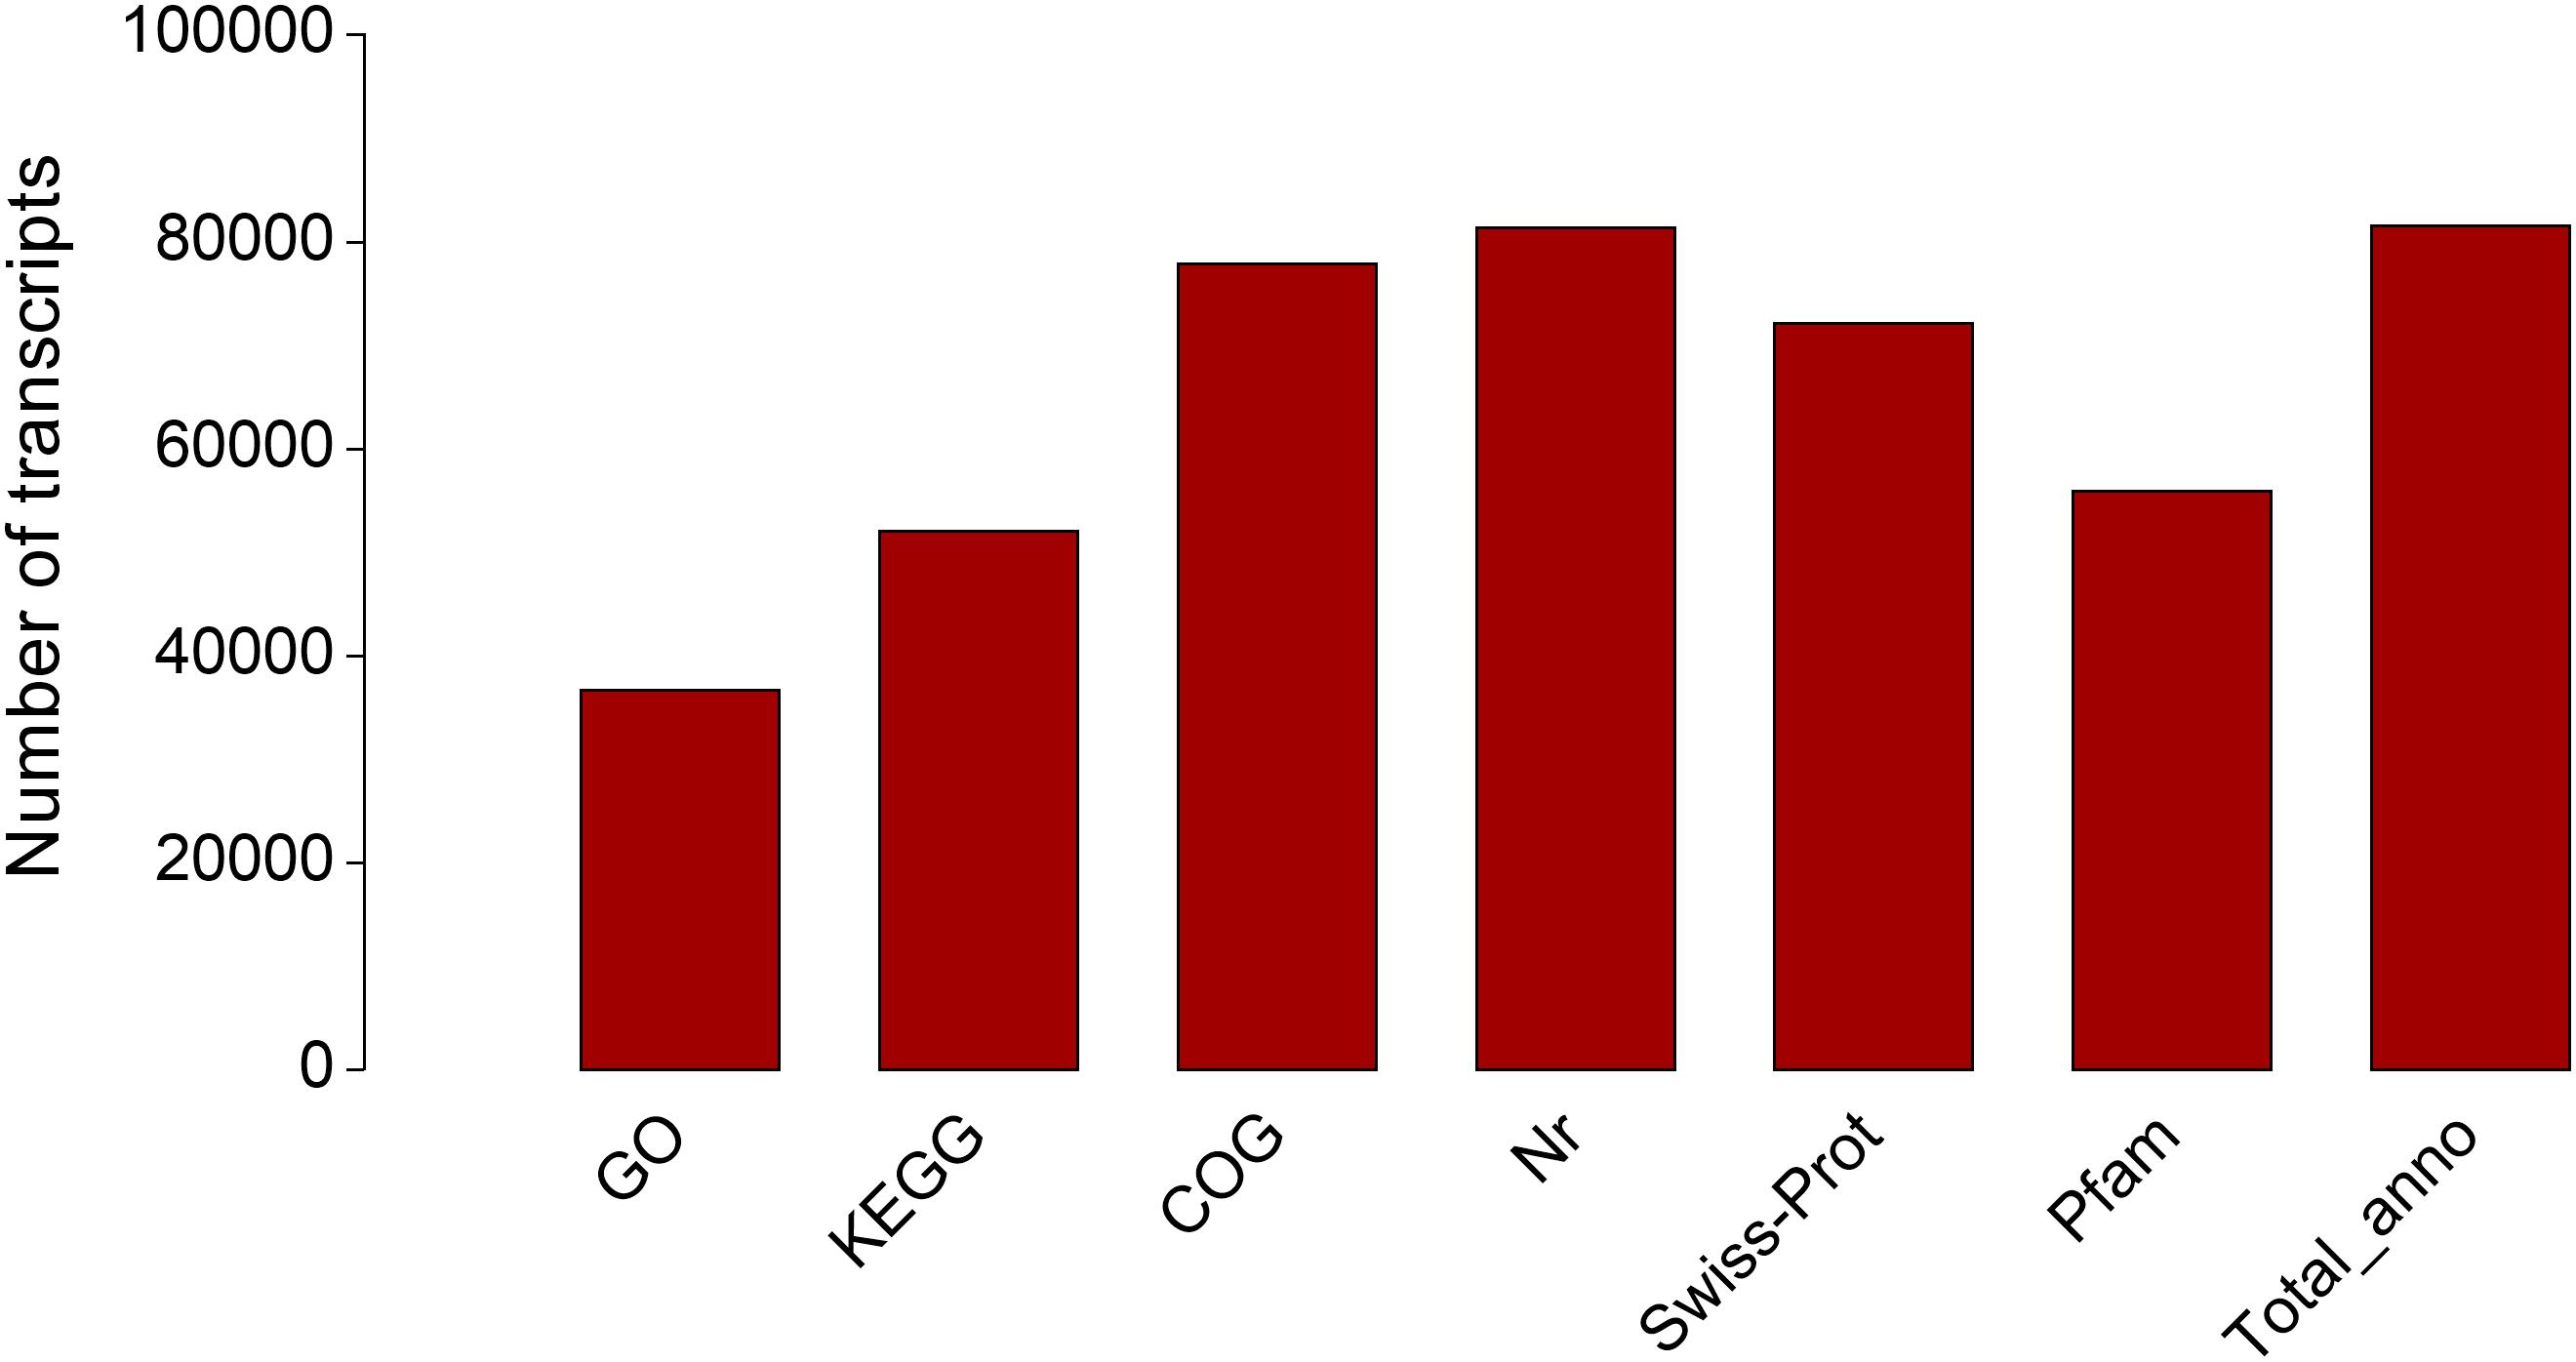
Figure 2. Transcript annotation information in hepatopancreases of Cyprinus carpio var qingtianensis.
Differential Genes Expression Analysis
In this study, P-adjust < 0.05 and| log2(foldchange)| ≥ 1 were used to identify significant DEGs. The results showed that a total of 4988 DEGs among CH, HH, and RH (Figure 3A), including 2236 DEGs (1506 up-regulated and 730 down-regulated) between the HH and CH (Figure 3B), 4509 DEGs (1865 up-regulated and 2644 down-regulated) between the RH and HH (Figure 3C), 313 DEGs (151 up-regulated and 162 down-regulated) between the RH and CH (Figure 3D).
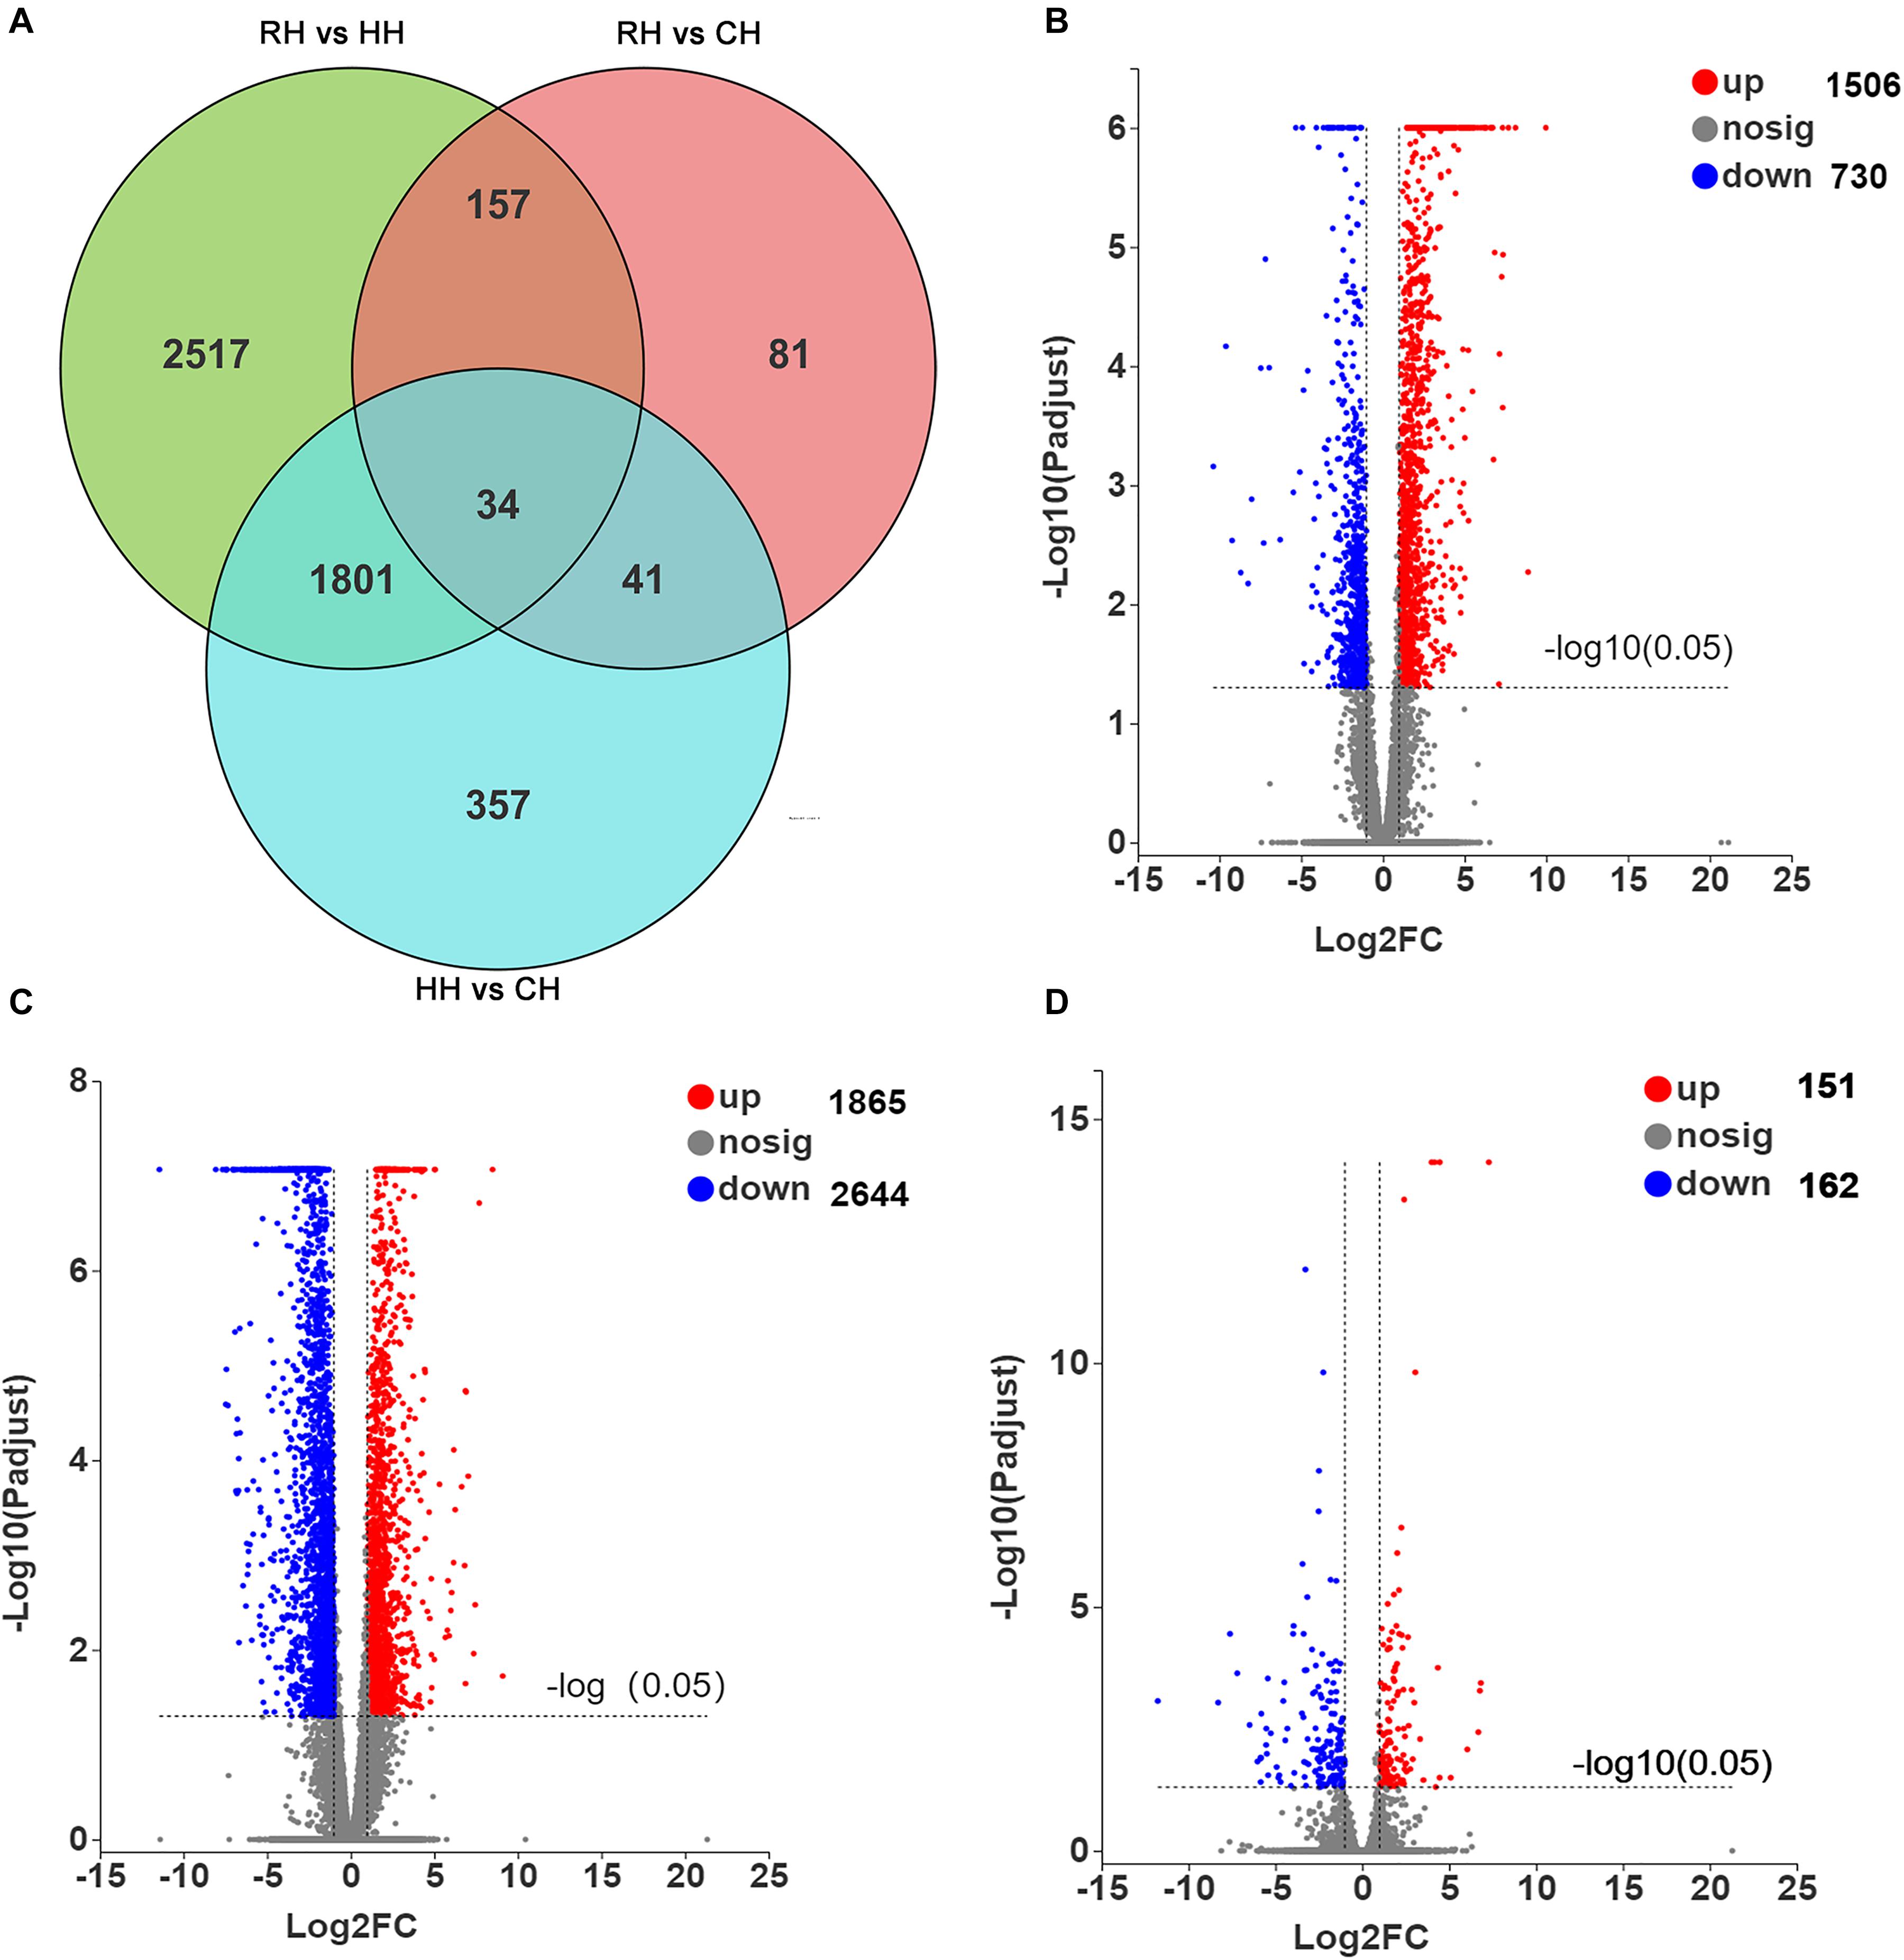
Figure 3. Statistics of DEGs in HH vs. CH, RH vs. HH, and RH vs. CH groups, (A) Venn diagram of DEGs in HH vs. CH, RH vs. HH, and RH vs. CH groups, (B) Volcano plot of DEGs in HH vs. CH group, (C) Volcano plot of DEGs in RH vs. HH group, and (D) Volcano plot of DEGs in RH vs. CH group.
The expression patterns of the DEGs (4907) in between HH versus CH and RH versus HH groups were divided into 8 groups (Figure 4A): (1) up-regulated in HH versus CH but down-regulated in RH versus HH (1298), (2) down-regulated in RH versus HH but up-regulated in HH versus CH (539), (3) both up-regulated in HH versus CH and RH versus HH (0), (4) both down-regulated in HH versus CH and RH versus HH(0), (5) up-regulated in HH versus CH only (208), (6) down-regulated in HH versus CH only (191), (7) up-regulated in RH versus HH only(1326), and (8) down-regulated in RH versus HH only (1345) (Figure 4B).
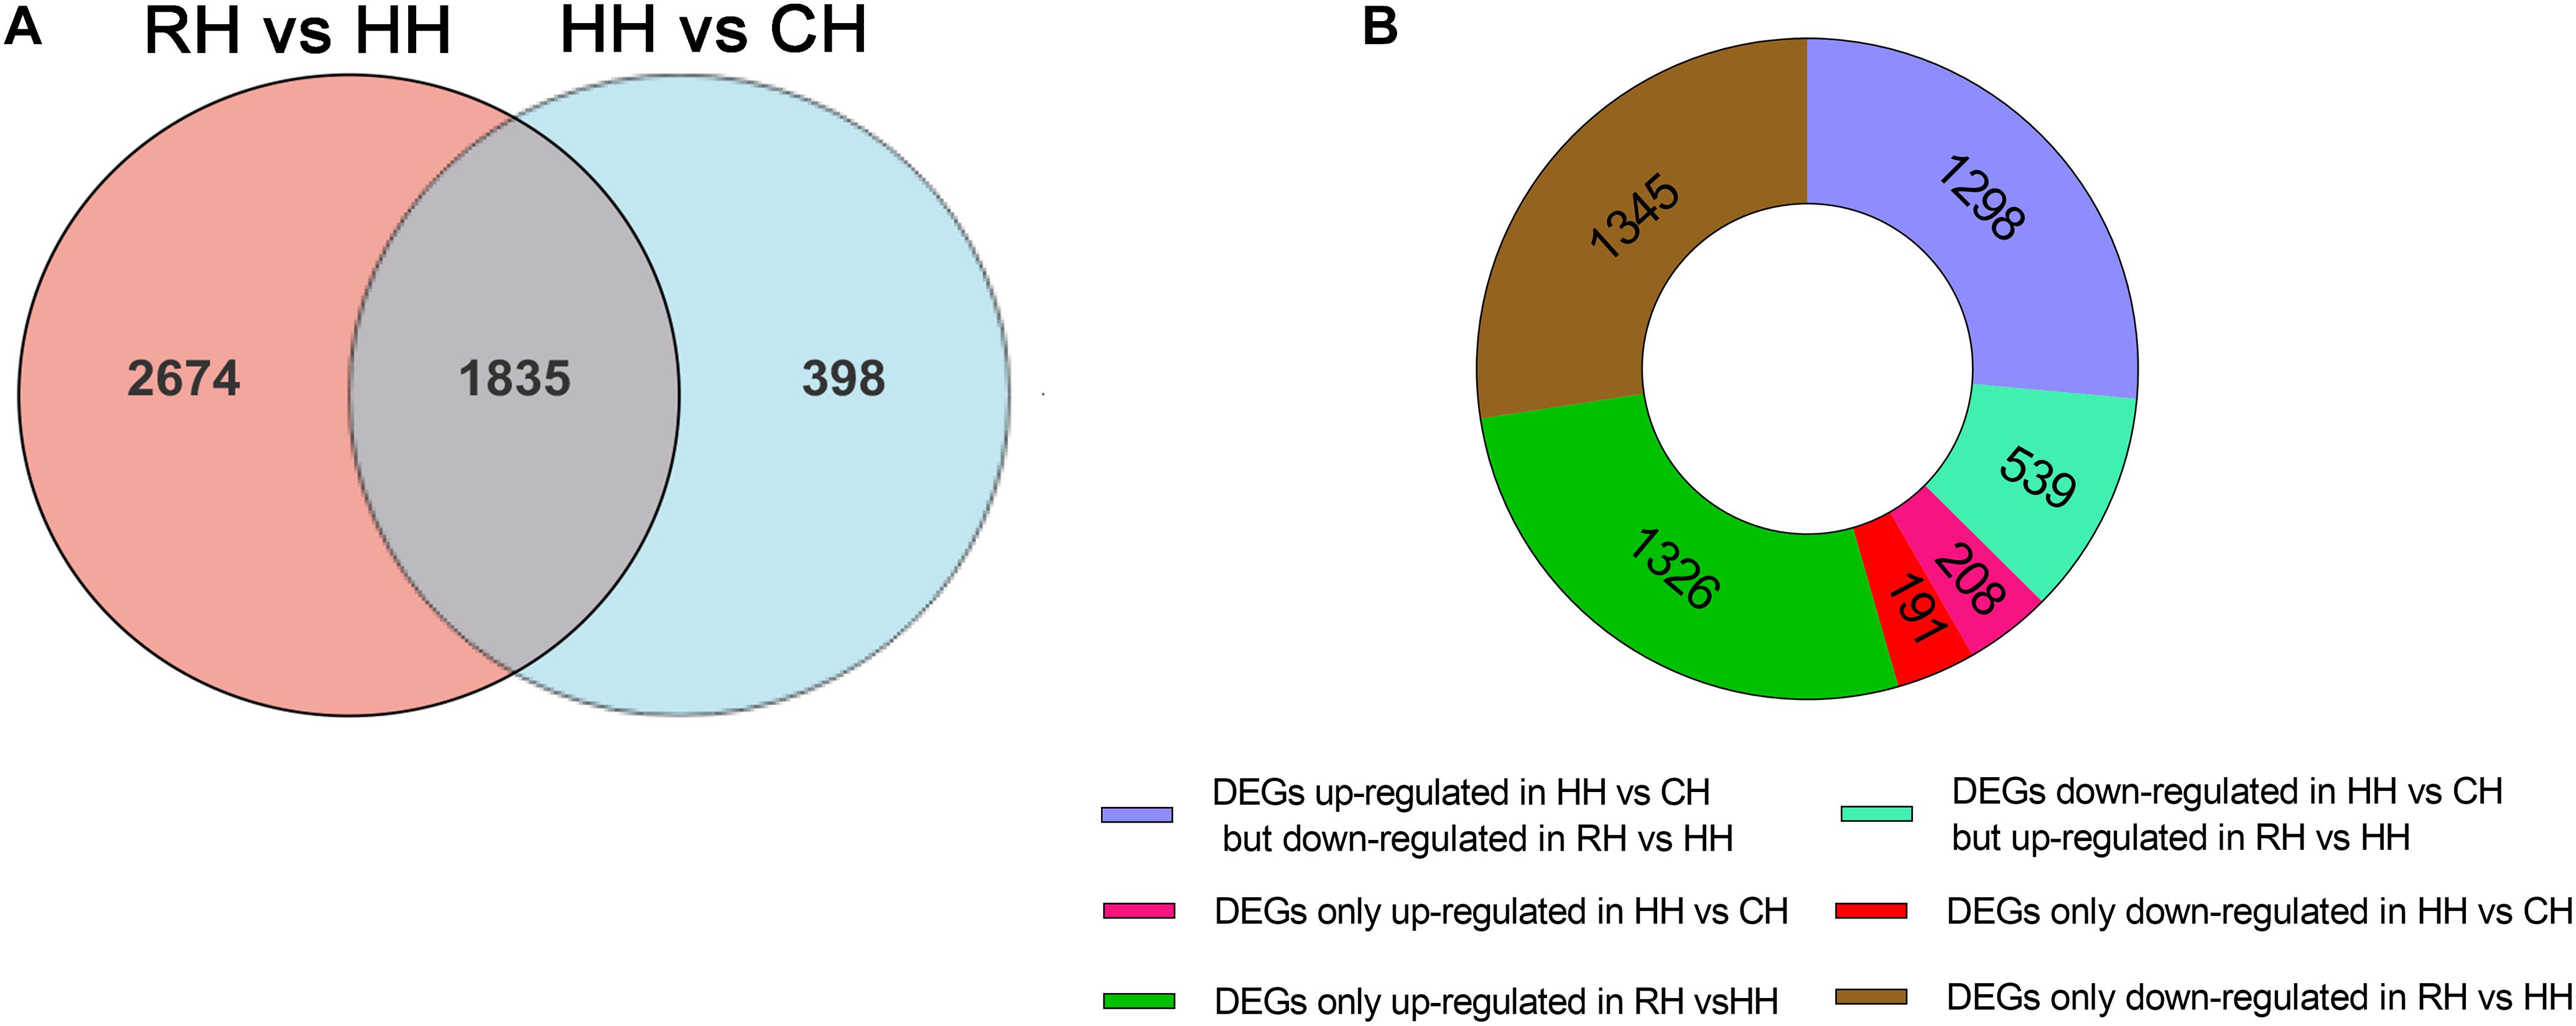
Figure 4. Statistics of differentially expressed genes in RH vs. HH and HH vs. CH groups; (A) Venn figure of DEGs; (B) Ring chart of expression patterns of DEGs.
At the same time, in order to evaluate the reoxygenation recovery status of PF-carps, the comparison of DEGs in RH vs. CH groups revealed that there were only 313 DEGs, suggesting that the physiological state of PF-carps basically recovered after 6 h of reoxygenation following hypoxia. However, in order to better explain the physiological regulation mechanism of PF-carp after reoxygenation, the DEGs (4631) of RH versus HH and RH versus CH groups were compared and divided into 8 groups (Figure 5A): (1) up-regulated in RH versus HH but down-regulated in RH versus CH groups (0), (2) down-regulated in RH versus HH groups but up-regulated in RH versus CH groups (5), (3) both up-regulated in RH versus HH groups and RH versus CH (90), (4) both down-regulated in RH versus HH groups and RH versus CH(95), (5) up-regulated in RH versus HH groups only (1774), (6) down-regulated in RH versus HH groups only (2544), (7) up-regulated in RH versus CH only (57), and (8) down-regulated in RH versus CH only (66) (Figure 5B).
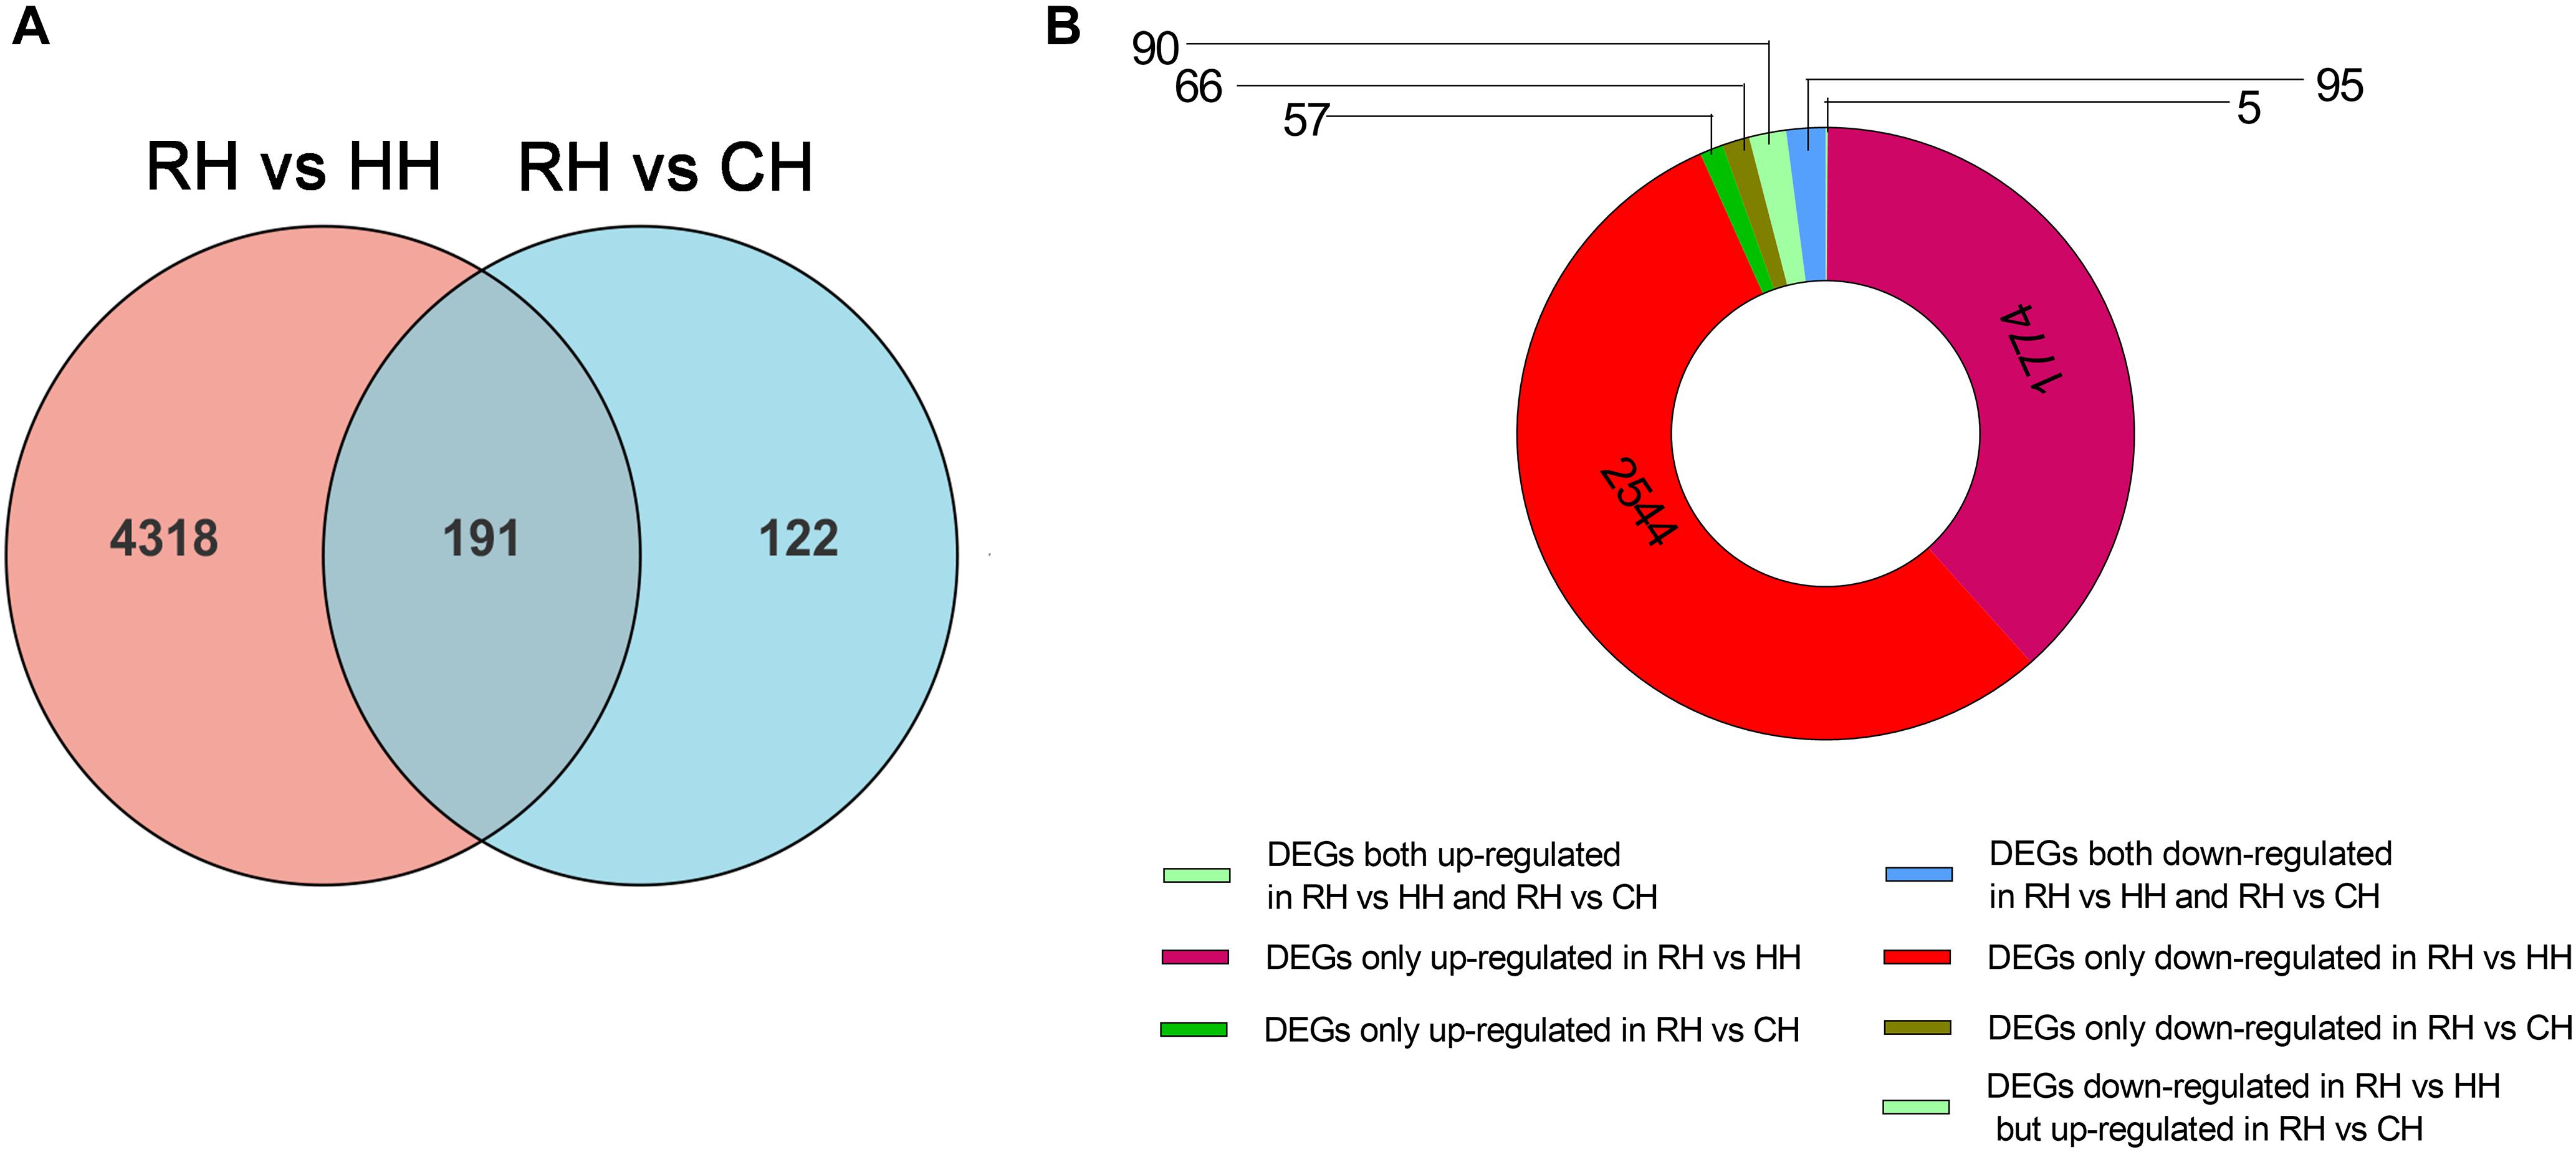
Figure 5. Statistics of differentially expressed genes in RH vs. HH and RH vs. CH groups, (A) Venn figure of DEGs, (B) Ring chart of expression patterns of DEGs.
GO Function Enrichment Analysis of DEGs
The all DEGs in each treatment and comparison group were screened for GO functional enrichment analysis and classified into biological process (BP), cellular component (CC) and molecular function (MF). Compared to normoxic (control) group, 785 of 1506 up-regulated DEGs of hypoxic group were significantly enriched in 222 GO terms, including 159 biological process, 10 cellular component, 53 molecular function and 367 of 730 down-regulated DEGs of hypoxia group were significantly enriched in 56 GO terms, including 40 biological process, 6 cellular component, 10 molecular function, the GO terms mainly involved oxidation-reduction, nucleotide metabolic process and glucose metabolic process (Figure 6A for the top 20 most enriched term). 1044 of 11865 up-regulated DEGs of RH versus HH group were significantly enriched in 118 GO terms, including 73 biological process, 17 cellular component, 28 molecular function and 1348 of 2644 down-regulated DEGs of RH versus HH group were significantly enriched in 319 GO terms, including 218 biological process, 13 cellular component, 87 molecular function, the GO terms mainly involved steroid metabolic process, monosaccharide biosynthetic process and carbohydrate biosynthetic process (Figure 6B for the top 20 most enriched term). 95 of 151 up-regulated DEGs were significantly enriched to 10 GO terms in the reoxygenated group. Compared with that in the normoxic (control) group, including 8 biological process, 2 cellular component and 77 of 162 down-regulated DEGs were significantly enriched to only one cellular component, the GO terms mainly involved monocarboxylic acid metabolic process, fatty acid metabolic process and circadian regulation of gene expression (Figure 6C).
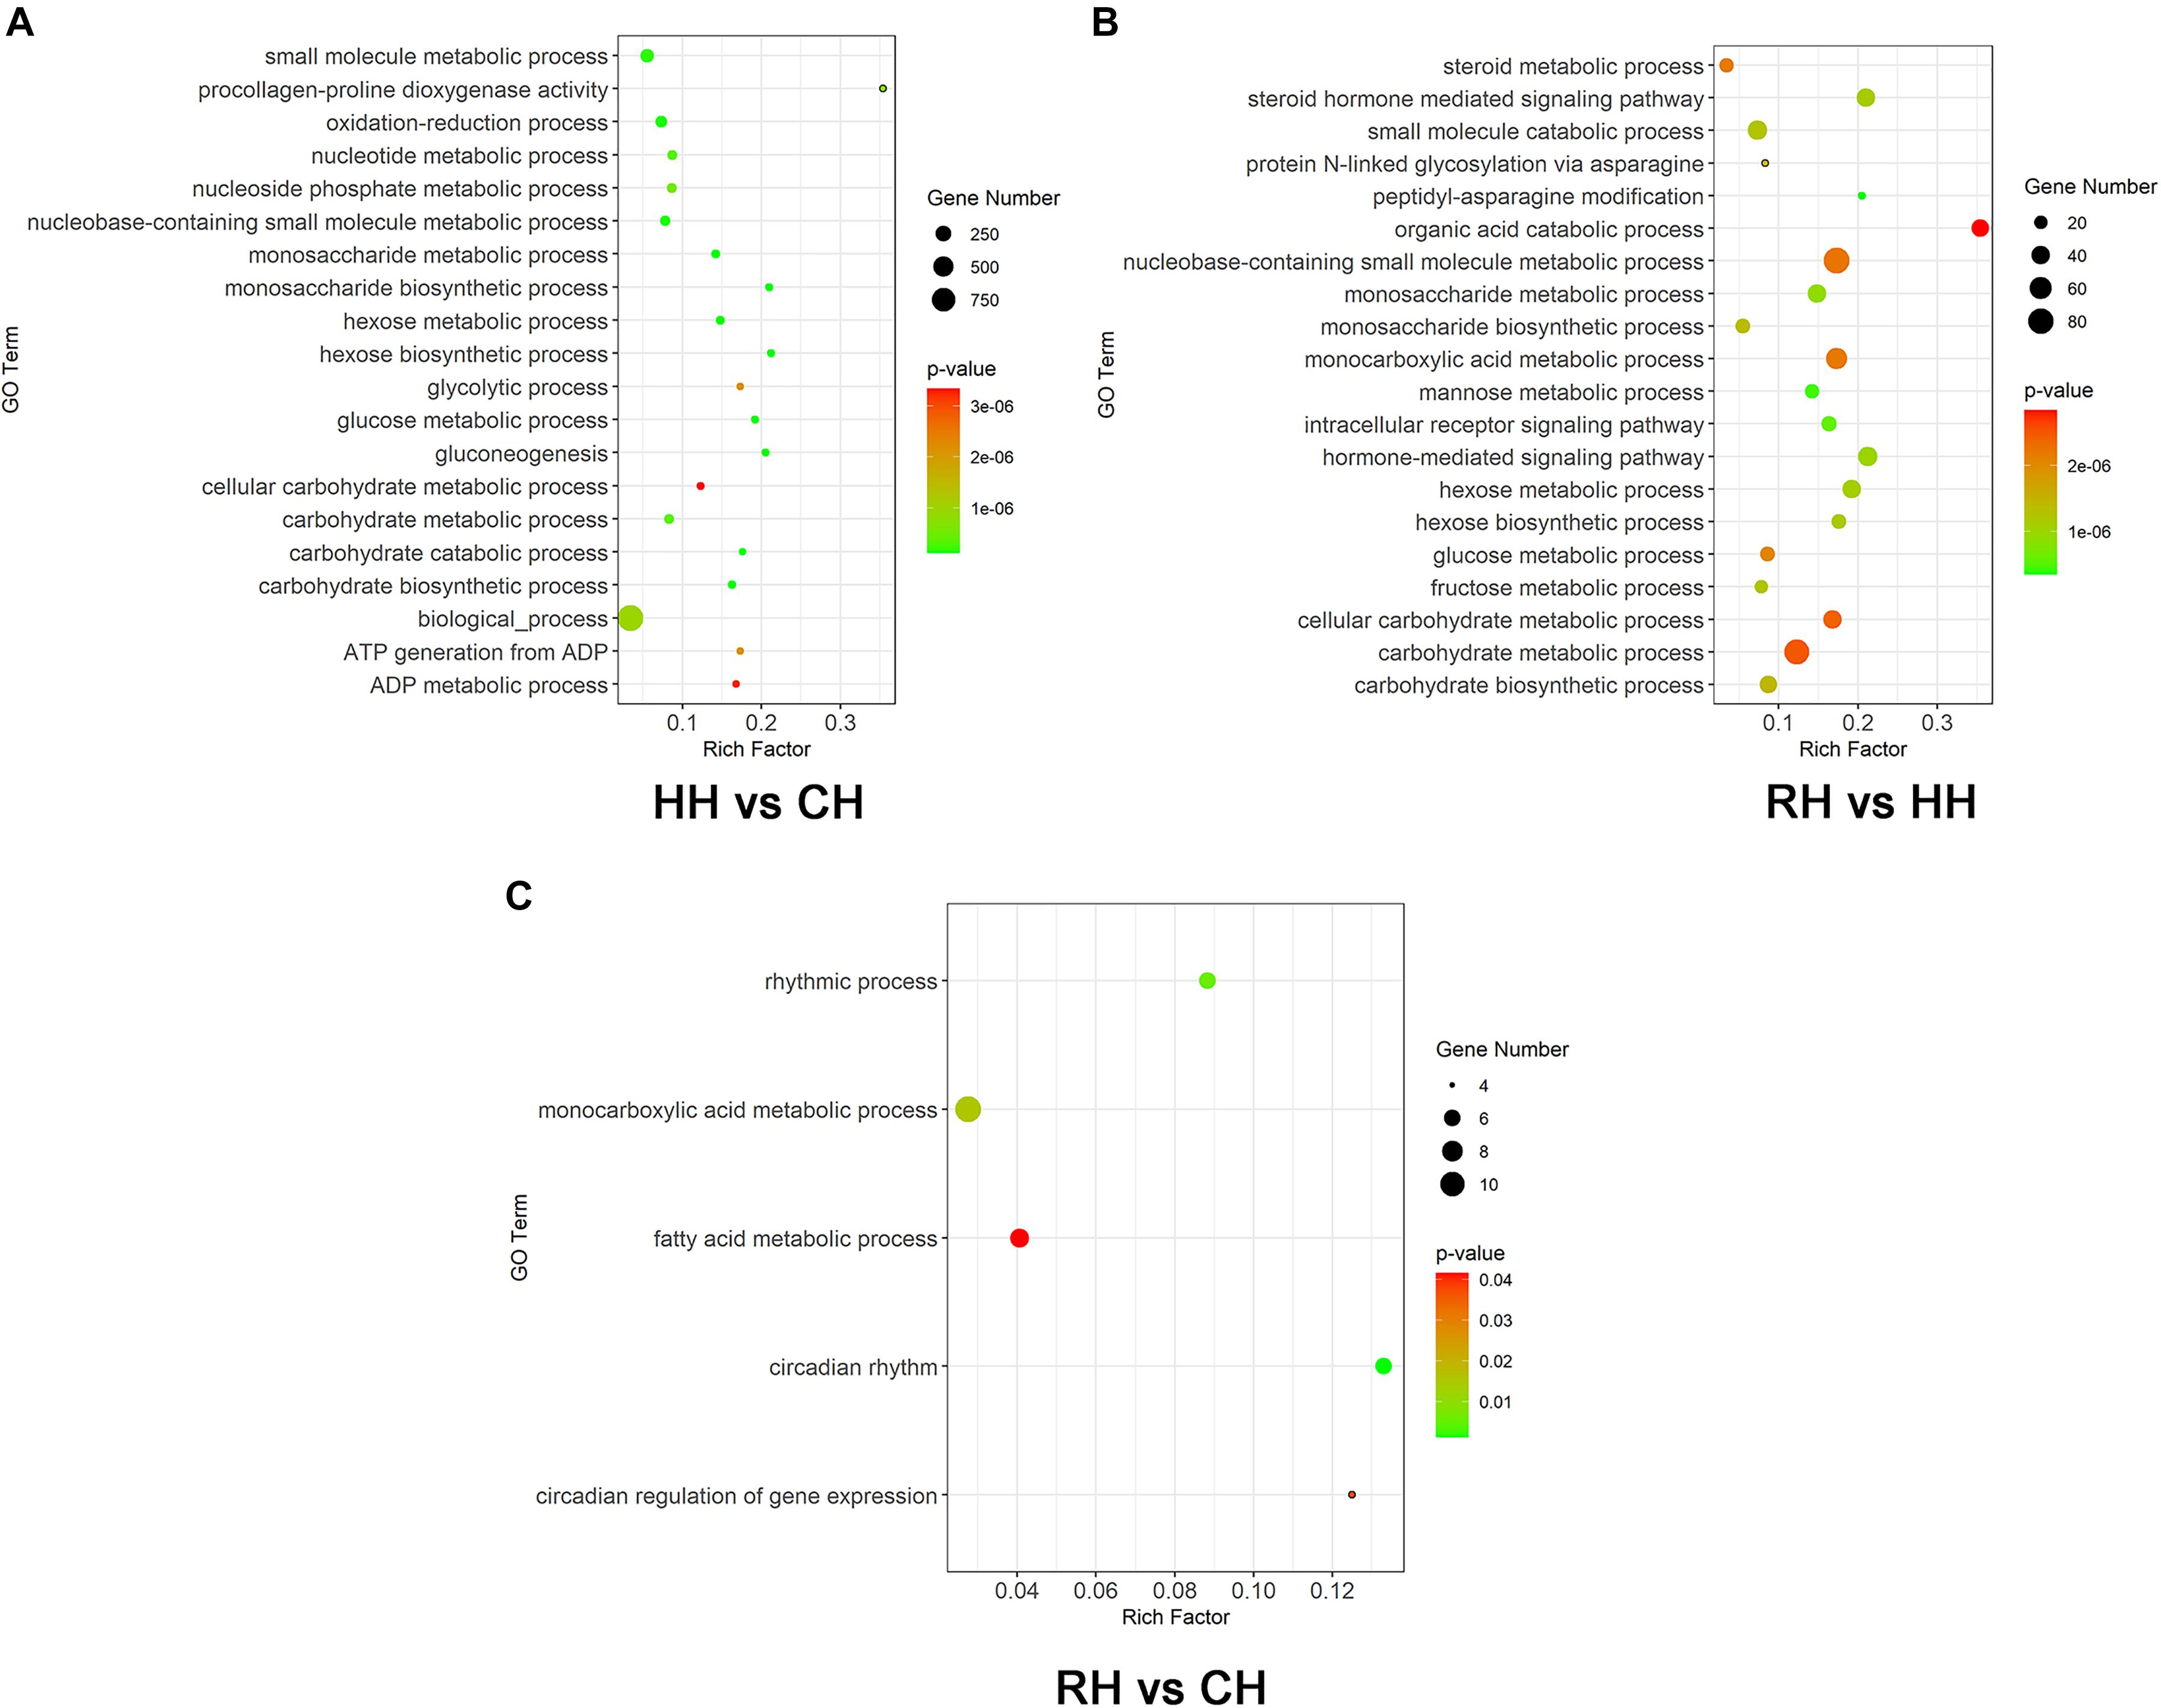
Figure 6. GO function enrichment analysis of DEGs, (A) HH vs. CH group (the top 20 most enriched term), (B) RH vs. HH group (the top 20 most enriched term), and (C) RH vs. CH. The color of each dot indicated the corrected P-adjust for the corresponding terms.
KEGG Pathway Enrichment Analysis of DEGs
The results showed 1580 DEGs of the KEGG pathway were significantly enriched in the HH versus CH comparison, 3222 DEGs were significantly enriched in the RH versus HH comparison and 224 DEGs were significantly enriched in the RH versus CH comparison.
There were total of 35 KEGG pathways enriched by DEGs in the HH versus CH group, and the pathways with a relatively large number of enriched genes were HIF-1 signaling pathway (56 genes), glycolysis/gluconeogenesis (27 genes), pentose phosphate pathway (11 genes). Among the 48 KEGG pathways enriched by the DEGs in the RH versus HH group, the DEGs were mainly enriched in HIF-1 signaling pathway (71 genes), pentose and glucuronate interconversions (21 genes), steroid hormone biosynthesis (25 genes). However, the DEGs in the RH versus CH group enriched to 11 signaling pathways, mainly protein processing in endoplasmic reticulum (12 genes), fatty acid biosynthesis (4 genes), pyruvate metabolism (4 genes) (Figure 7).
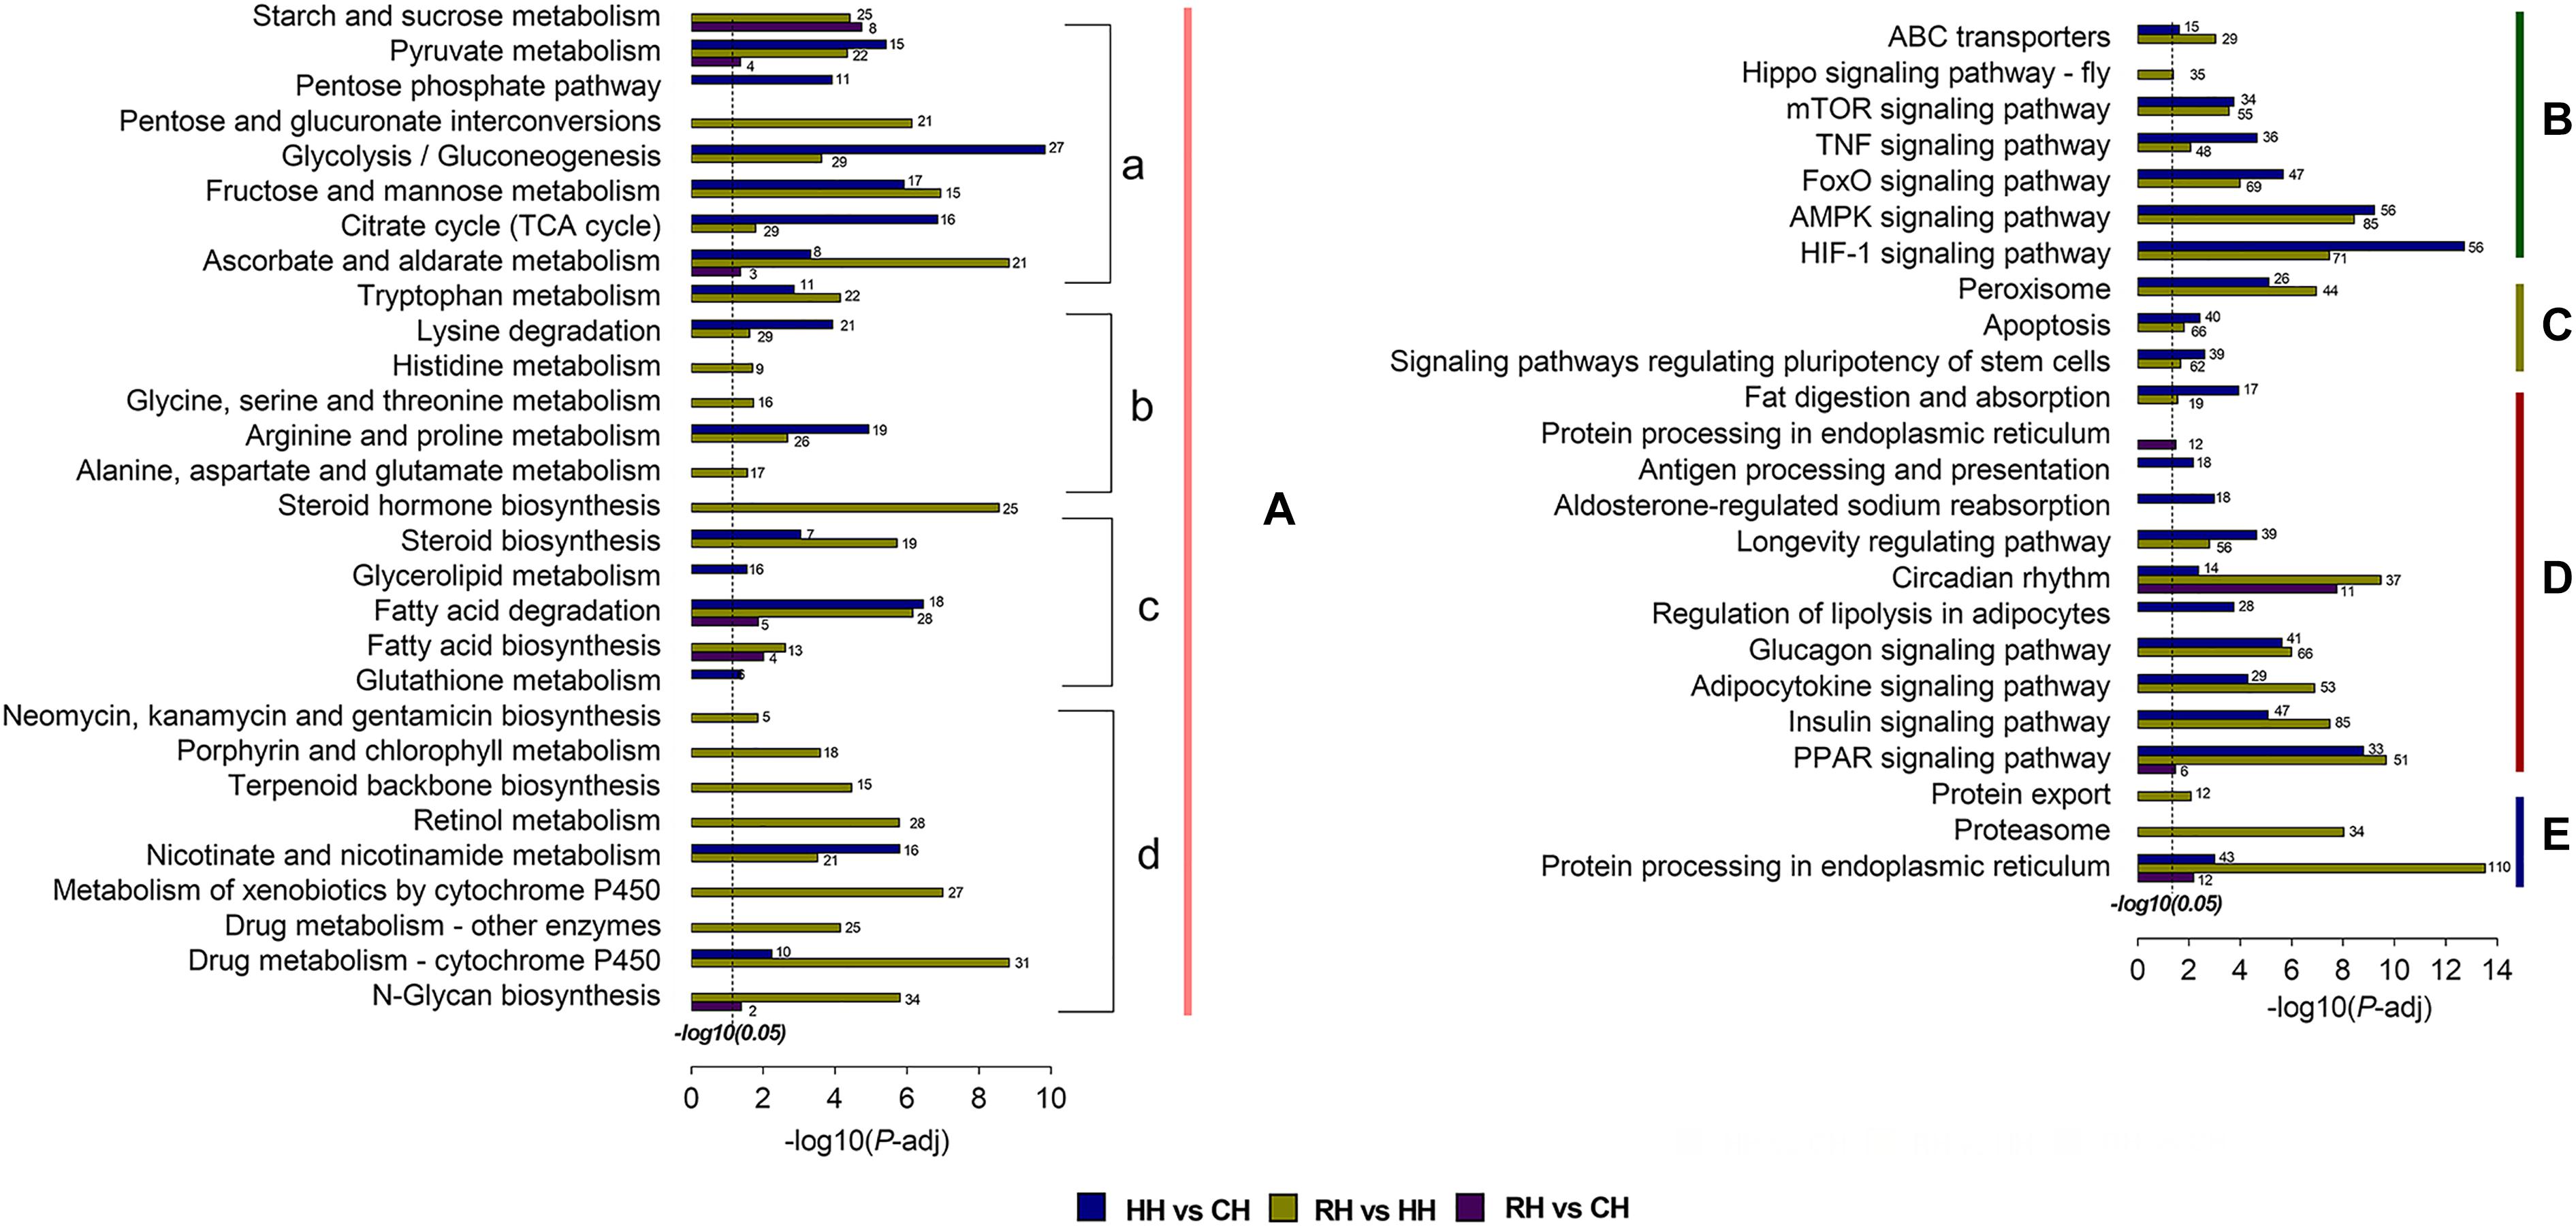
Figure 7. KEGG pathway enrichment analysis of DEGs in HH vs. CH, RH vs. HH, and RH vs. CH. (A) Metabolism: (a) Carbohydrate metabolism, (b) Amino acid metabolism, (c) Lipid metabolism, and (d) Others metabolism; (B) Environmental information processing; (C) Cellular processes; (D) Organismal systems; (E) Genetic information processing. The length of each column indicated the -log10(P-adjust) of the corresponding pathway. The annotation number indicated the number of DEGs were enriched in the corresponding pathways.
The Verification of RNA-seq by RT-qPCR
The RT-qPCR was performed with designed primers to obtain the expression results of DEGs (Table 2). The results showed that RT-qPCR of 11 DEGs were consistent with RNA-seq in HH versus CH group. In the RH versus HH group, the relative expression levels of hif-1a, hsp90a, ldh, pgm2, pfk, and glut-3 genes in RT-qPCR were different from that of RNA-seq, but their up-down expression trends were consistent. The accuracy of RNA-seq was verified (Figure 8).
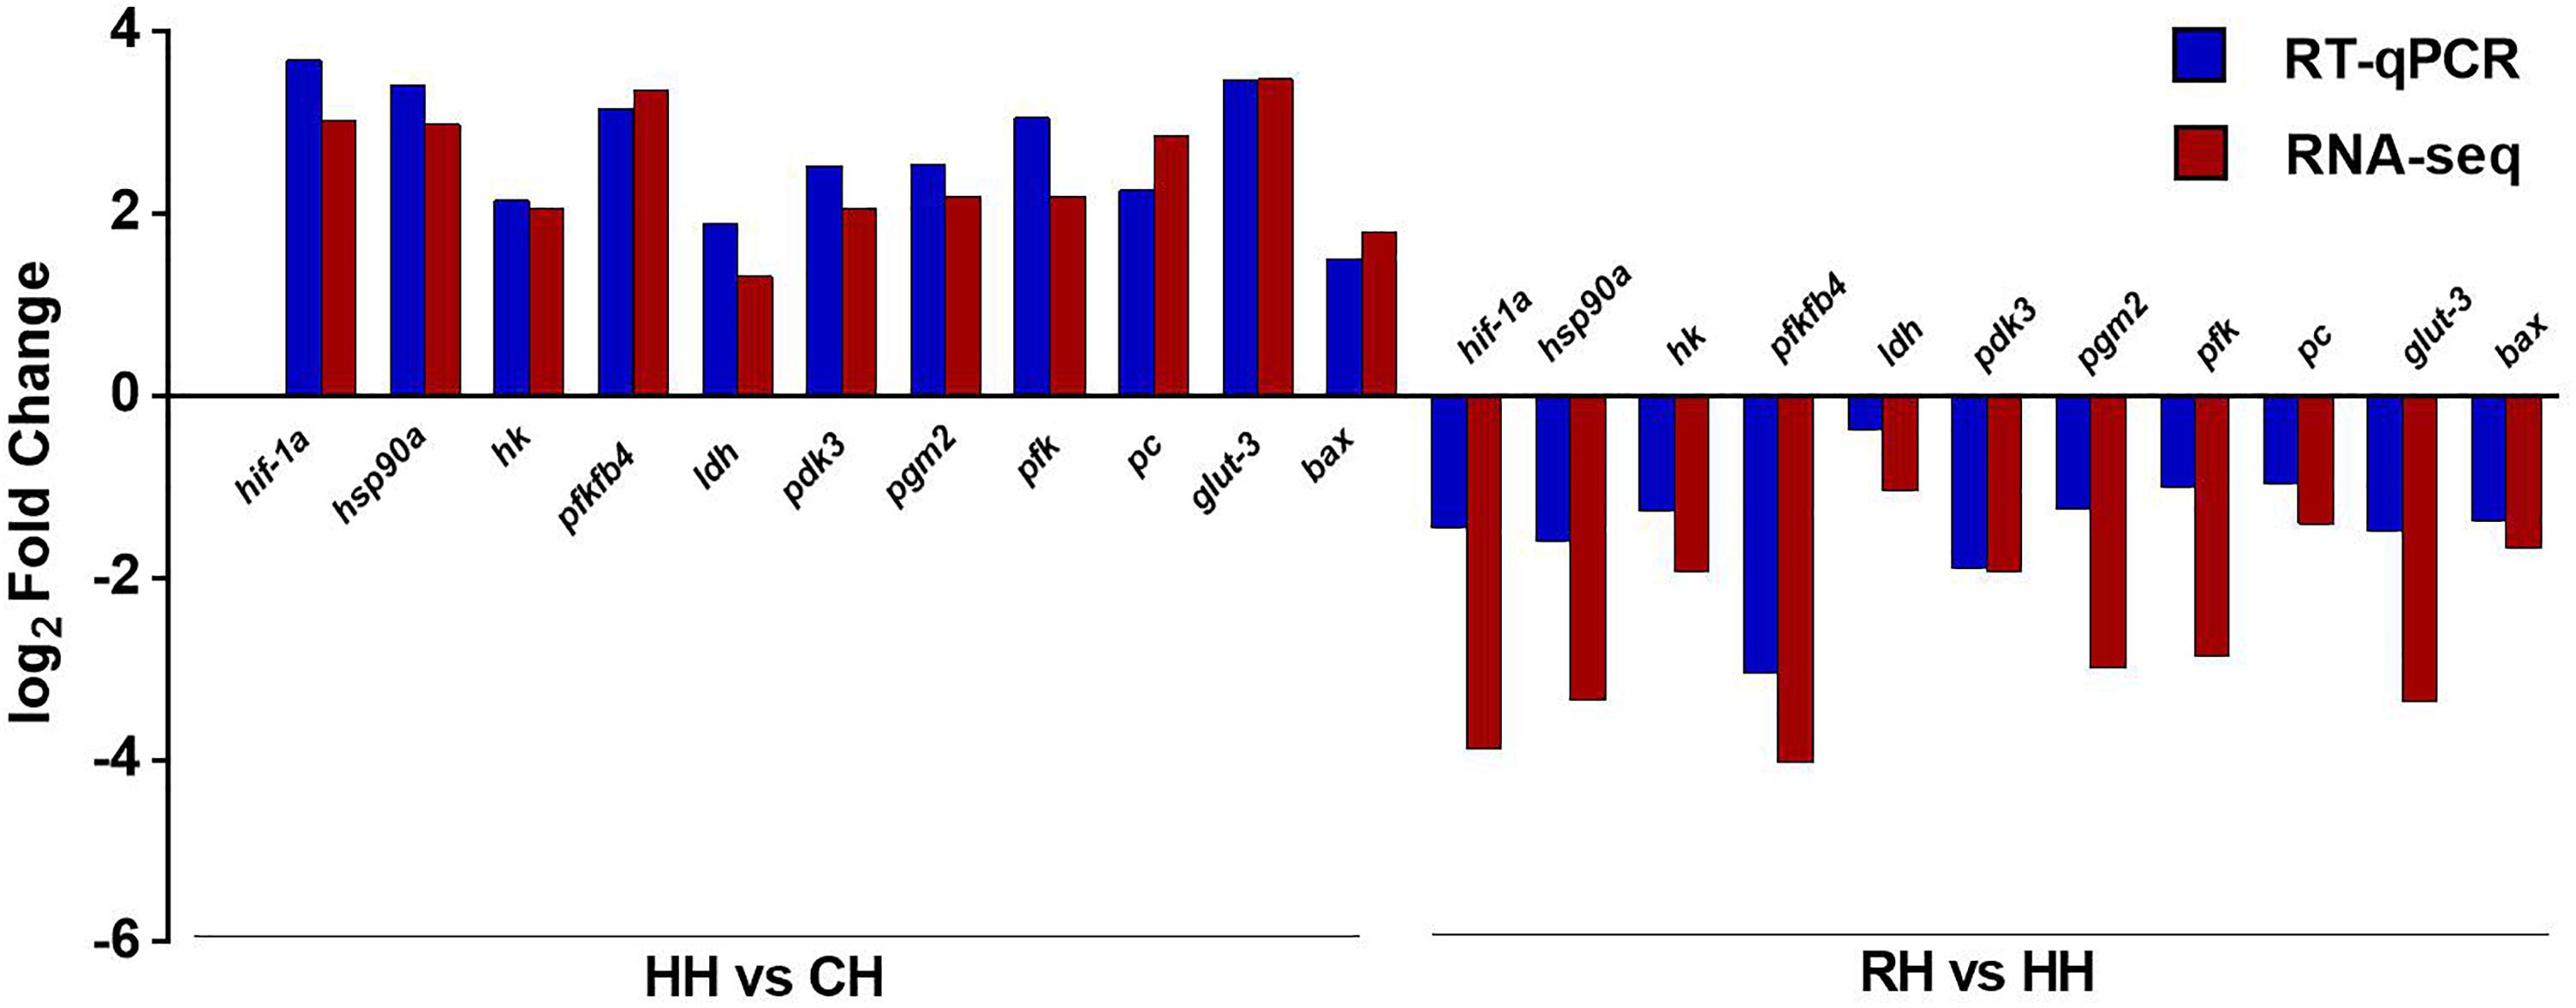
Figure 8. Comparison of gene expression between RT-qPCR and RNA-seq. The X-axis represents the gene name, and the Y-axis represents the log2 value of the relative gene expression between the two groups. The length of the blue column represents the average of log2 value of the relative gene expression between the two groups by RT-qPCR, the length of the red column represents the average of log2 value of the relative gene expression between the two groups by RNA-seq.
Discussion
Dissolved oxygen is one of the important environmental factors that limit fish survival (Abdel-Tawwab et al., 2019). In fish, the liver (for PF-carp is hepatopancreas) is the central organ of metabolism and important defensive organ (Guilherme et al., 2012). Changes in dissolved oxygen can affect the physiological function of the liver and cause damage, such as energy metabolism, antioxidant stress and anabolism of other substances (Muusze et al., 1998; Wang and Richards, 2011; Jung et al., 2014). At the same time, how the liver (hepatopancreas) will adapt to the reoxygenation following hypoxia and its molecular regulatory mechanism is not clear. Therefore, it is significance to use RNA-seq to analyze the response mechanism of the liver during hypoxia and reoxygenation.
In this study, we used RNA-seq to screen and compare the DEGs in hepatopancreas of PF-carp during hypoxia and reoxygenation. The results showed that the number of up-regulated DEGs exceeded the number of down-regulated DEGs during hypoxia, which is consistent with the results reported for the hypoxic transcriptome analysis of Pelteobagrus vachell (Zhang et al., 2016). In contrast, the number of down-regulated DEGs exceeded the number of up-regulated DEGs during reoxygenation, which suggested that PF-carp had enhanced physiological metabolism against stress during the hypoxic process, while the metabolism was mainly reduced in the reoxygenation process (e.g., cell apoptosis and glycolysis) (Sun et al., 2017). Activation and inhibition of the corresponding metabolic pathways appear to be a reversible physiological regulation, but activation of some metabolic pathways counters this hypothesis. Take carbohydrate metabolism for example, the pentose phosphate pathway was activated only during hypoxia and pentose and glucuronate interconversions was activated only during reoxygenation.
HIF-1a is an important homeostasis regulatory protein in organisms (Baptista et al., 2016). In this study, the hif-1a gene was up-regulated during hypoxia and down-regulated following reoxygenation (Figure 7), suggesting that a molecular regulatory pathway with HIF-1 signal pathway as the core occurred in PF-carp during the hypoxic and reoxygenation processes (Zhang et al., 2017b), thereby triggering a series of metabolic changes that includes energy metabolism (Goda and Kanai, 2012), cell proliferation and apoptosis (Carmeliet et al., 1998), immune response (Cramer et al., 2005) and other metabolic pathway (Semenza, 1999).
We observed that DEGs in HH versus CH and RH versus HH groups were significantly enriched for glycolysis/gluconeogenesis, fructose and mannose metabolism, pyruvate metabolism, and TCA cycle. This is similar to previous studies of fish energy metabolism based on carbohydrate during hypoxia and reoxygenation (Li et al., 2018). The expression of pfk, hk, and ldh genes were up-regulated to enhance the glycolysis and lactic acid metabolism pathway and acly genes was down-regulated and to inhibit the TCA cycle, which resulted in the transformation of hepatopancreatic cells from aerobic respiration to anaerobic respiration during hypoxia (Ding et al., 2020). In the process of reoxygenation, pfk, hk, and ldh genes were down-regulated and the glycolysis pathway was inhibited, while the acly genes was up-regulated and TCA cycle was activated, suggesting that the aerobic respiration of the body was restored, and the substrate for energy metabolism was lactic acid accumulated during hypoxia. This result was verified by using P-NMR to study the changes of muscle energy during hypoxia and reoxygenation (Wright et al., 1989; van Ginneken et al., 1995). At the same time, the catabolism of lactic acid can effectively reduce acidosis in hepatopancreas (Fiévet et al., 1987). Interestingly, we found that the DEGs were significantly enriched in the pentose phosphate pathway during hypoxia. The pentose phosphate pathway is activated during hypoxia because the pentose phosphate pathway, on the one hand, provides the metabolic substrate for carbohydrate metabolism, and on the other hand, most of the NADPH and ribose in the body are produced through the pentose phosphate pathway (Hu et al., 2012). NADPH is a reducing agent in the body, which effectively protects glutathione activity and removes reactive oxygen species (ROS) from the body (Mailloux et al., 2013; Jin et al., 2018). Ribose provides more raw materials for the synthesis of RNA, ensuring that up-regulated gene transcribed into RNA (Cleaves and Miller, 2001). With regards to amino acid and lipid metabolism, on the one hand, amino acid and lipid metabolism are activated to provide adequate substrate for energy metabolism (Wright et al., 1989) and reduced synthesis of amino acids and lipids under hypoxia (Zhang et al., 2017a). On the other hand, the energy metabolism of substrates for lactic acid and pyruvic acid are reduced during reoxygenation. Moreover, high carbohydrate levels result in synthesis of amino acids and lipids (Li and Zhang, 2016). g6pd and gshB genes expressions were up-regulated in the process of reoxygenation, which accelerated glutathione biosynthesis to reduce oxidative damage of hepatopancreas cells (Lu, 2013). agl5 gene is the key gene to regulate the synthesis of N-glycan, and its expression is continuously up-regulated after reoxygenation, which will promote the synthesis of N-glycan. This may be related to the promotion of glycosylation of membrane proteins and repair of damaged cell membranes (Sprovieri and Martino, 2018).
When fish are under hypoxia stress, extracellular signaling factors bind specifically to intracellular or cell membrane receptors to induce intracellular signaling, triggering a cascade reaction thereby affecting cell function. The signal transduction in the cell is a variety of interrelated signal transduction patterns (Pugh and Ratcliffe, 2017). For example, the HIF-1 signaling pathway and the Toll signaling pathway coordinate through the activation travel of TLR4 (toll-like receptor) and NF-kB (nuclear factor), inducing the generation of inflammation (Rius et al., 2008; Wu et al., 2018). Zebrafish embryos regulate the maturation and differentiation of intestinal goblet cells through the expression of the agr2 gene mediated by HIF-1a and Foxa2 (Lai et al., 2016). By regulating AMPK (AMP activated protein kinase) activity during hypoxia, goldfish complete the distribution and recombination of intracellular energy metabolism (Lau and Richards, 2011). In this study, we observed that during the processes of hypoxia and reoxygenation, signal transduction pathways of PF-carp were regulated by the changes of dissolved oxygen (activation/inhibition of HIF-1 signaling pathway), and HIF-1 signaling was regulated by the coordination of Toll, AMPK, FoxO, and TNF pathways to complete cell proliferation, differentiation, immune response, and energy distribution (Lau and Richards, 2011; Lai et al., 2016; Wang et al., 2018; Wu et al., 2018). In this study, PF-carp hepatopancreatic DEGs significantly activated and inhibited the HIF-1 signaling pathway during the processes of hypoxia and reoxygenation, and then coordinated the Toll, AMPK, FoxO, and TNF signaling pathways to complete cell differentiation and maturation, energy redistribution, and metabolic regulation induced by inflammation.
During hypoxia, a large number of ROS were produced in the hepatopancreas of PF-carp. up-regulated expressions of acox1 and sod1 activated the peroxidase pathway to remove ROS from the body (Welker et al., 2012). Meanwhile, ROS cause the oxidation of membrane proteins and unsaturated fatty acids and damage DNA. Hepatopancreas cells could enhance the apoptosis pathway and clean up the damaged cells by up-regulating the expression of bax, caspase8, and hsps, which effectively protect the function of hepatopancreas (Poon et al., 2007). The difference is that the apoptosis pathway is inhibited by down-regulated expression of key genes (i.e., bcl-2 and mcl1) and the peroxisome pathway is continuously activated through up-regulated expression of key genes (i.e., pex1, sod1, and acox1) during reoxygenation. Sustained activation of the peroxisome pathway is due to a new round of oxidative stress by reoxygenation, which is similar to the changes in the oxygen supply of goldfish (Hermes-Lima and Zenteno-Savin, 2002).
Conclusion
In this study, RNA-seq analysis was used to compare the changes of expression of genes in hepatopancreas in PF-carp during hypoxia and reoxygenation. Compared the number of up-regulated and down-regulated genes between each different treatment group, we found that the adaptive regulation of PF-carp was achieved by activating the metabolic processes during hypoxia and inhibiting metabolism during reoxygenation. At the same time, through the analysis of KEGG pathways enriched by DEGs during hypoxia and reoxygenation, this regulation is not a simple reversible physiological regulation. After 6-h period of reoxygenation following 6 h of hypoxia, PF-carp continued to be up-regulated some genes regulating metabolic pathways, which are very important for cell repair, and the expression of other genes basically returned to the initial level. It is significance to understand the adaptability of PF-carp to the changing environment of dissolved oxygen in rice field. At the same time, gene expression does not mean the execution of functions, which requires us to further improve the study on the adaptability of PF-carp to changes in acute dissolved oxygen through other research methods.
Data Availability Statement
The datasets presented in this study can be found in online repositories. The names of the repository/repositories and accession number(s) can be found below: https://www.ncbi.nlm.nih.gov/, SRX7829257.
Ethics Statement
This study was approved by the Institutional Animal Care and Use Committee (IACUS) of Shanghai Ocean University (Shanghai, China).
Author Contributions
MQ, MH, and QL designed the study and wrote the manuscript. TL, YM, and YH conducted the experiment and collected the materials. MQ, QW, and MH performed the experiments and analyzed the data. All authors have read and approved the final manuscript.
Funding
This work was supported by grants from the Shanghai Ocean University Aquatic Animal Breeding Center (ZF-1206).
Conflict of Interest
The authors declare that the research was conducted in the absence of any commercial or financial relationships that could be construed as a potential conflict of interest.
Acknowledgments
We thank Professor Gharrett for its linguistic assistance during the preparation of this manuscript.
References
Abdel-Tawwab, M., Monier, M. N., Hoseinifar, S. H., and Faggio, C. (2019). Fish response to hypoxia stress: growth, physiological, and immunological biomarkers. Fish Physiol. Biochem. 45, 997–1013. doi: 10.1007/s10695-019-00614-9
Baptista, R. B., Souza-Castro, N., and Almeida-Val, V. M. (2016). Acute hypoxia up-regulates HIF-1α and VEGF mRNA levels in Amazon hypoxia-tolerant Oscar (Astronotus ocellatus). Fish Physiol. Biochem. 42, 1307–1318. doi: 10.1007/s10695-016-0219-1
Caballero-Solares, A., Xue, X., Parrish, C. C., Foroutani, M. B., Taylor, R. G., and Rise, M. L. (2018). Changes in the liver transcriptome of farmed Atlantic salmon (Salmo salar) fed experimental diets based on terrestrial alternatives to fish meal and fish oil. BMC Genomics 19:796. doi: 10.1186/s12864-018-5188-6
Carmeliet, P., Dor, Y., Herbert, J.-M., Fukumura, D., Brusselmans, K., Dewerchin, M., et al. (1998). correction: role of HIF-1 in hypoxia-mediated apoptosis, cell proliferation and tumour angiogenesis. Nature 394, 485–490. doi: 10.1038/28867
Cleaves, H. J., and Miller, S. L. (2001). The nicotinamide biosynthetic pathway is a by-product of the RNA world. J. Mol. Evol. 52, 73–77. doi: 10.1007/s002390010135
Cooper, R. U., Clough, L. M., Farwell, M. A., and West, T. L. (2002). Hypoxia-induced metabolic and antioxidant enzymatic activities in the estuarine fish Leiostomus xanthurus. J. Exp. Mar. Biol. Ecol. 279, 1–20. doi: 10.1016/S0022-0981(02)00329-5
Cramer, T., Wiedenmann, B., and Höcker, M. (2005). HIF–1alpha regulates the bactericidal capacity of phagocytes. Z. Gastroenterol. 43:122.
Ding, J., Liu, C., Luo, S., Zhang, Y., Gao, X., Wu, X., et al. (2020). Transcriptome and physiology analysis identify key metabolic changes in the liver of the large yellow croaker (Larimichthys crocea) in response to acute hypoxia. Ecotoxicol. Environ. Saf. 189:109957. doi: 10.1016/j.ecoenv.2019.109957
Fiévet, B., Motais, R., and Thomas, S. (1987). Role of adrenergic-dependent H+ release from red cells in acidosis induced hypoxia in trout. Am. J. Physiol. 252, R269–R275. doi: 10.1152/ajpregu.1987.252.2.R269
Goda, N., and Kanai, M. (2012). Hypoxia-inducible factors and their roles in energy metabolism. Int. J. Hematol. 95, 457–463. doi: 10.1007/s12185-012-1069-y
Gooday, A. J., Jorissen, F., Levin, L. A., Middelburg, J. J., Naqvi, S. W. A., Rabalais, N. N., et al. (2009). Historical records of coastal eutrophication-induced hypoxia. Biogeosci. Discuss. 6, 1707–1745. doi: 10.5194/bg-6-1707-2009
Guilherme, S., Gaivão, I., Santos, M. A., and Pacheco, M. (2012). DNA damage in fish (Anguilla anguilla) exposed to a glyphosate-based herbicide - Elucidation of organ-specificity and the role of oxidative stress. Mutat. Res. 743, 1–9. doi: 10.1016/j.mrgentox.2011.10.017
Guo, H. S., Qi, M., Hu, Z., and Liu, Q. G. (2020). Optimization of the rice-fish coculture in Qingtian, China: 1. effects of rice spacing on the growth of the paddy fish and the chemical composition of both rice and fish. Aquaculture 522, 1–8. doi: 10.1016/j.aquaculture.2020.735106
Herbert, N. A., and Steffensen, J. F. (2005). The response of Atlantic cod, Gadus morhua, to progressive hypoxia: fish swimming speed and physiological stress. Mar. Biol. 147, 1403–1412. doi: 10.1007/s00227-005-0003-8
Hermes-Lima, M., and Zenteno-Savin, T. (2002). Animal response to drastic changes in oxygen availability and physiological oxidative stress. Comp. Biochem. Physiol. C Toxicol. Pharmacol. 133, 537–556. doi: 10.1016/s1532-0456(02)00080-7
Hirsch, C. N., Foerster, J. M., Johnson, J. M., Sekhon, R. S., Muttoni, G., Vaillancourt, B., et al. (2014). Insights into the maize pan-genome and pan-transcriptome. Plant Cell 26, 121–135. doi: 10.1105/tpc.113.119982
Hu, W., Zhi, L., Zhuo, M. Q., Zhu, Q., Zheng, J. L., Chen, Q. L., et al. (2012). Purification and characterization of glucose 6-phosphate dehydrogenase (G6PD) from grass carp (Ctenopharyngodon idella) and inhibition effects of several metal ions on G6PD activity in vitro. Fish Physiol. Biochem. 39, 637–647. doi: 10.1007/s10695-012-9726-x
Hughes, G. (1973). Respiratory responses to hypoxia in fish. Am. Zool. 13, 475–489. doi: 10.1093/icb/13.2.475
Ishimatsu, A., and Itazawa, Y. (1983). Blood oxygen levels and acid-base status following air exposure in an air-breathing fish, Channa argus: the role of air ventilation. Comp. Biochem. Physiol. A Comp. Physiol. 74, 787–793. doi: 10.1016/0300-9629(83)90348-1
Jin, E. S., Lee, M. H., Murphy, R. E., and Malloy, C. R. (2018). Pentose phosphate pathway activity parallels lipogenesis but not antioxidant processes in rat liver. Am. J. Physiol. Endocrinol. Metab. 314, e543–e551.
Jung, J. H., Kim, H. N., Chae, Y. S., and Shim, W. J. (2014). Biochemical responses of juvenile rockfish (Sebastes schlegeli) to low levels of dissolved oxygen in Gamak Bay. Ocean Sci. J. 49, 241–247. doi: 10.1007/s12601-014-0024-7
Kim, D., Paggi, J. M., Park, C., Bennett, C., and Salzberg, S. L. (2019). Graph-based genome alignment and genotyping with HISAT2 and HISAT-genotype Nat. Biotechnol. 37, 907–915. doi: 10.1038/s41587-019-0201-4
Klopfenstein, D. V., Zhang, L., Pedersen, B. S., Ramírez, F., Warwick Vesztrocy, A., Naldi, A., et al. (2018). GOATOOLS: a python library for gene ontology analyses. Sci. Rep. 8:10872. doi: 10.1038/s41598-018-28948-z
Lai, Y. R., Lu, Y. F., Lien, H. W., Huang, C. J., and Hwang, S. P. (2016). Foxa2 and Hif1ab regulate maturation of intestinal goblet cells by modulating agr2 expression in zebrafish embryos. Biochem. J. 473:2205. doi: 10.1042/bcj20160392
Lau, G., and Richards, J. (2011). AMP-activated protein kinase plays a role in initiating metabolic rate suppression in goldfish hepatocytes. J. Comp. Physiol. B 181, 927–939. doi: 10.1007/s00360-011-0575-1
Li, M., Wang, X., Qi, C., Li, E. C., Du, Z., Qin, J., et al. (2018). Metabolic response of Nile tilapia (Oreochromis niloticus) to acute and chronic hypoxia stress. Aquaculture 495, 187–195. doi: 10.1016/j.aquaculture.2018.05.031
Li, Z., and Zhang, H. (2016). Reprogramming of glucose, fatty acid and amino acid metabolism for cancer progression. Cell. Mol. Life Sci. 73, 377–392. doi: 10.1007/s00018-015-2070-4
Lu, S. C. (2013). Glutathione synthesis. Biochim. Biophys. Acta 1830, 3143–3153. doi: 10.1016/j.bbagen.2012.09.008
Mailloux, R., McBride, S., and Harper, M. E. (2013). Unearthing the secrets of mitochondrial ROS and glutathione in bioenergetics. Trends Biochem. Sci. 38, 592–602. doi: 10.1016/j.tibs.2013.09.001
Mandic, M., Todgham, A., and Richards, J. (2008). Mechanisms and evolution of hypoxia tolerance in fish. Biol. Sci. 276, 735–744. doi: 10.1098/rspb.2008.1235
Mao, X., Cai, T., Olyarchuk, J. G., and Wei, L. (2005). Automated genome annotation and pathway identification using the KEGG Orthology (KO) as a controlled vocabulary. Bioinformatics 21, 3787–3793. doi: 10.1093/bioinformatics/bti430
Muusze, B., Marcon, J., Thillart, G., and Almeida-Val, V. (1998). Hypoxia tolerance of Amazon fish: respirometry and energy metabolism of the cichlid Astronotus Ocellatus. Comp. Biochem. Physiol. A Comp. Physiol. 120, 151–156.
Pérès, G., Bogé, G., and Rigal, A. (1973). Can hypoxia of the central nervous system be the principal cause of death of fish submitted to a relatively high ambient temperature? C R Séances Soc. Biol. Fil. 167, 494–498. doi: 10.1111/izy.12026
Poon, W. L., Hung, C. Y., Nakano, K., and Randall, D. (2007). An in vivo study of common carp (Cyprinus carpio L.) liver during prolonged hypoxia. Comp. Biochem. Physiol. D Genomics Proteomics 2, 295–302. doi: 10.1016/j.cbd.2007.05.002
Pugh, C. W., and Ratcliffe, P. J. (2017). New horizons in hypoxia signaling pathways. Exp. Cell Res. 356, 116–121. doi: 10.1016/j.yexcr.2017.03.008
Qi, D., Chao, Y., Wu, R., Xia, M., Chen, Q., and Zheng, Z. (2018). Transcriptome analysis provides insights into the adaptive responses to hypoxia of a schizothoracine fish (Gymnocypris eckloni). Front. Physiol. 9:1326. doi: 10.3389/fphys.2018.01326
Ren, W., Hu, L., Guo, L., Zhang, J., Tang, L., Chen, X., et al. (2018). Preservation of the genetic diversity of a local common carp in the agricultural heritage rice–fish system. Proc. Natl. Acad. Sci. U.S.A. 115, E546–E554. doi: 10.1073/pnas.1709582115
Rius, J., Guma, M., Schachtrup, C., Akassoglou, K., Zinkernagel, A., Nizet, V., et al. (2008). NF-kB links innate immunity to the hypoxic response through transcriptional regulation of HIF-1. Nature 453, 807–811. doi: 10.1038/nature06905
Robinson, M. D., McCarthy, D. J., and Smyth, G. K. (2010). edgeR: a Bioconductor package for differential expression analysis of digital gene expression data. Bioinformatics 26, 139–140. doi: 10.1093/bioinformatics/btp616
Semenza, G. L. (1999). Regulation of mammalian O2 homeostasis by hypoxia-inducible factor 1. Annu. Rev. Cell Dev. Biol. 15, 551–578.
Shields, F., and Knight, S. (2011). Significance of riverine hypoxia for fish: the case of the big sunflower river, mississippi1. J. Am. Water Resour. 48, 170–186. doi: 10.1111/j.1752-1688.2011.00606.x
Sprovieri, P., and Martino, G. (2018). The role of the carbohydrates in plasmatic membrane. Physiol. Res. 67, 1–11. doi: 10.33549/physiolres.933593
Sun, S., Xuan, F., Ge, X. P., Zhu, J., and Zhang, W. (2017). Dynamic mRNA and miRNA expression analysis in response to hypoxia and reoxygenation in the blunt snout bream (Megalobrama amblycephala). Sci. Rep. 7:12846.
Thomas, S., Fiévet, B., Claireaux, G., and Motais, R. (1988). Adaptive respiratory responses of trout to acute hypoxia. I. Effects of water ionic composition on blood acid-base status response and gill morphology. Resp. Physiol. 74, 77–89. doi: 10.1016/0034-5687(88)90142-9
Trapnell, C., Roberts, A., Goff, L., Pertea, G., Kim, D., Kelley, D. R., et al. (2012). Differential gene and transcript expression analysis of RNA-seq experiments with TopHat and Cufflinks. Nat. Protoc. 7, 562–578. doi: 10.1038/nprot.2012.016
van Ginneken, V., Thillart, G., Addink, A., and Erkelens, C. (1995). Fish muscle energy metabolism measured during hypoxia and recovery: an in vivo 31P-NMR study. Am. J. Physiol. 268(5 Pt. 2), R1178–R1187.
Wang, C. H., Li, S. F., Xiang, S. P., Wang, J., Liu, Z. G., Pang, Z. Y., et al. (2006). Genetic parameter estimates for growth-related traits in Oujiang color common carp (Cyprinus carpio var. color). Aquaculture 259, 103–107. doi: 10.1016/j.aquaculture.2006.05.031
Wang, J., Lu, D. Q., Jiang, B., Luo, H. L., Lu, G. L., and Li, A. X. (2018). The effect of intermittent hypoxia under different temperature on the immunomodulation in Streptococcus agalactiae vaccinated Nile tilapia (Oreochromis niloticus). Fish Shellfish Immunol. 79, 181–192. doi: 10.1016/j.fsi.2018.04.040
Wang, S. Y., Lau, K., Lai, K. P., Zhang, J. W., Tse, A. C., Li, J. W., et al. (2016). Hypoxia causes transgenerational impairments in reproduction of fish. Nat. Commun. 7:12114. doi: 10.1038/ncomms12114
Wang, Y., and Richards, J. G. (2011). Hypoxia | Anaerobic metabolism in fish. Encycl. Fish Physiol. 3, 1757–1763. doi: 10.1016/B978-0-12-374553-8.00154-4
Welker, A., Campos, E., Cardoso, L., and Hermes-Lima, M. (2012). Role of catalase on the hypoxia/reoxygenation stress in the hypoxia-tolerant Nile tilapia. Am. J. Physiol. Reg1. 302, R1111–R1118. doi: 10.1152/ajpregu.00243.2011
Wright, P. A. A., Perry, S. F., and Moon, T. (1989). Regulation of hepatic gluconeogenesis and glycogenolysis by catecholamines in rainbow trout during environmental hypoxia. J. Exp. Biol. 147, 169–188. doi: 10.1007/s12160-013-9573-8
Wu, G., Xu, G., Chen, D. W., Gao, W. X., Xiong, J. Q., Shen, H. Y., et al. (2018). Hypoxia exacerbates inflammatory acute lung injury via the toll-like receptor 4 signaling pathway. Front. Immunol. 9:1667. doi: 10.3389/fimmu.2018.01667
Wu, R. S. S. (2009). Chapter 3 effects of hypoxia on fish reproduction and development. Fish Physiol. 27, 79–141. doi: 10.1016/s1546-5098(08)00003-4
Xie, J., Hu, L., Tang, J., Wu, X., Li, N., Chen, X., et al. (2011). Ecological mechanisms underlying the sustainability of the agricultural heritage rice-fish coculture system. Proc. Natl. Acad. Sci. U.S.A. 108, E1381–E1387. doi: 10.1073/pnas.1111043108
Xu, P., Zhang, X., Wang, X., Li, J., Liu, G., Sun, X., et al. (2014). Genome sequence and genetic diversity of the common carp. Cyprinus Carpio. Nat. Genet. 46, 1212–1219. doi: 10.1038/ng.3098
Zaccone, G., Lauriano, E., Capillo, G., and Kuciel, M. (2018). Air- breathing in fish: air- breathing organs and control of respiration. Acta Histochem. 120, 630–641. doi: 10.1016/j.acthis.2018.08.009
Zhang, G. S., Yin, S. W., Mao, J. Q., Liang, F. F., Zhao, C., Tang, Z. L., et al. (2016). Integrated analysis of mRNA-seq and miRNA-seq in the liver of Pelteobagrus vachelli in response to hypoxia. Sci. Rep. 6:22907. doi: 10.1038/srep22907
Zhang, G. S., Zhang, J. J., Wen, X., Zhao, C., Zhang, H. Y., Li, X. R., et al. (2017a). Comparative iTRAQ-based quantitative proteomic analysis of Pelteobagrus vachelli iver under acute hypoxia: implications in metabolic responses. Proteomics 17:1700140. doi: 10.1002/pmic.201700140
Zhang, G. S., Zhao, C., Wang, Q. T., Gu, Y. C., Li, Z. C., and Yin, S. (2017b). Identification of HIF-1 signaling pathway in Pelteobagrus vachelli using RNA-Seq: effects of acute hypoxia and reoxygenation on oxygen sensors, respiratory metabolism, and hematology indices. J. Comp. Physiol. B 187, 921–943. doi: 10.1007/s00360-017-1083-8
Keywords: Cyprinus carpio var qingtianensis, transcriptome, hepatopancreas, hypoxia, reoxygenation
Citation: Qi M, Wu Q, Liu T, Hou Y, Miao Y, Hu M and Liu Q (2020) Hepatopancreas Transcriptome Profiling Analysis Reveals Physiological Responses to Acute Hypoxia and Reoxygenation in Juvenile Qingtian Paddy Field Carp Cyprinus carpio var qingtianensis. Front. Physiol. 11:1110. doi: 10.3389/fphys.2020.01110
Received: 21 June 2020; Accepted: 11 August 2020;
Published: 11 September 2020.
Edited by:
Jianmin Zhao, Yantai Institute of Coastal Zone Research (CAS), ChinaReviewed by:
Jun Qiang, Freshwater Fisheries Research Center (CAFS), ChinaLi Li, Institute of Oceanology (CAS), China
Copyright © 2020 Qi, Wu, Liu, Hou, Miao, Hu and Liu. This is an open-access article distributed under the terms of the Creative Commons Attribution License (CC BY). The use, distribution or reproduction in other forums is permitted, provided the original author(s) and the copyright owner(s) are credited and that the original publication in this journal is cited, in accordance with accepted academic practice. No use, distribution or reproduction is permitted which does not comply with these terms.
*Correspondence: Menghong Hu, bWhodUBzaG91LmVkdS5jbg==; Qigen Liu, cWdsaXVAc2hvdS5lZHUuY24=
†These authors have contributed equally to this work
 Ming Qi
 Qianqian Wu3†
 Menghong Hu