
94% of researchers rate our articles as excellent or good
Learn more about the work of our research integrity team to safeguard the quality of each article we publish.
Find out more
ORIGINAL RESEARCH article
Front. Physiol., 24 January 2020
Sec. Exercise Physiology
Volume 10 - 2019 | https://doi.org/10.3389/fphys.2019.01639
This article is part of the Research TopicExploration of the Physiological Effects of Exercise in Cardiovascular DiseasesView all 10 articles
 Marie Fanget1
 Jérémy Rossi2
 Pierre Samozino3
 Jean-Benoît Morin4
 Rodolphe Testa2
 Frédéric Roche1,5
 Thierry Busso2
 Jari Antero Laukkanen6,7,8
 David Hupin1,5*
Background: The force-velocity-power (FVP) profile is used to describe dynamic force production capacities, which is of great interest in training high performance athletes. However, FVP may serve a new additional tool for cardiac rehabilitation (CR) of coronary artery disease (CAD) patients. The aim of this study was to compare the FVP profile between two populations: CAD patients vs. healthy participants (HP).
Methods: Twenty-four CAD patients (55.8 ± 7.1 y) and 24 HP (52.4 ± 14.8 y) performed two sprints of 8 s on a Monark cycle ergometer with a resistance corresponding to 0.4 N/kg × body mass for men and 0.3 N/kg × body mass for women. The theoretical maximal force (F0) and velocity (V0), the slope of the force-velocity relationship (Sfv) and the maximal mechanical power output (Pmax) were determined.
Results: The Pmax (CAD: 6.86 ± 2.26 W.kg–1 vs. HP: 9.78 ± 4.08 W.kg–1, p = 0.003), V0 (CAD: 5.10 ± 0.82 m.s–1 vs. HP: 5.79 ± 0.97 m.s–1, p = 0.010), and F0 (CAD: 1.35 ± 0.38 N.kg–1 vs. HP: 1.65 ± 0.51 N.kg–1, p = 0.039) were significantly higher in HP than in CAD. No significant difference appeared in Sfv (CAD: −0.27 ± 0.07 N.kg–1.m.s–1 vs. HS: −0.28 ± 0.07 N.kg–1.m.s–1, p = 0.541).
Conclusion: The lower maximal power in CAD patients was related to both a lower V0 and F0. Physical inactivity, sedentary time and high cardiovascular disease (CVD) risk may explain this difference of force production at both high and low velocities between the two groups.
After an acute coronary syndrome, a cardiac rehabilitation (CR) program is essential to restore or increase physical capacities and reduces cardiovascular disease (CVD) risk (Pavy et al., 2012; Iliou et al., 2015; Price et al., 2016). The objective for active subjects is to regain their place in society and for older persons is to maintain their independence (Pavy et al., 2012; Iliou et al., 2015). It is necessary to adapt the content of CR sessions to optimize aerobic and anaerobic performance along with quality of life (Price et al., 2016).
Specifically, the improvement of maximum power output of the neuromuscular system is one of the objectives sought in CR. Muscle power (P), which is the product of force (F), and velocity (V), is essential to enhance anaerobic performance (Cronin and Sleivert, 2005; Morin and Samozino, 2016). Maximal power capacities depend on force production abilities over the entire spectrum of contraction velocities, which can be well described by the force-velocity (FV) relationship (Morin and Samozino, 2016). The orientation of this FV relationship toward rather maximal force at low velocities (i.e., force capacity) or force at high velocities (i.e., velocity capacity) is well characterized by its slope, which refers to the FV profile (Giroux et al., 2016).
Several studies have been carried out on the force-velocity-power (FVP) relationship and sport performance in top athletes (Samozino et al., 2014a, b; Giroux et al., 2016; Morin and Samozino, 2016). This FVP profile can be evaluated on ballistic push-offs and sprint movements (on treadmill or cycle ergometer) (Seck et al., 1995; Morin et al., 2010). Different profiles may be determined according to the type of physical activity and sometimes even the athlete’s position (e.g., toward force capacity for forward players and toward velocity for back players in rugby) (Morin and Samozino, 2016). The analysis of the FVP profile highlights the weaknesses in force production capacity of each athlete. A specific training oriented in force or in velocity should be adapted according to whether the athlete wants to maintain his/her specificity or tip the balance of the FV profile that presents a deleterious imbalance for his/her future performances (i.e., change the slope of the right of the FV profile toward an optimal slope) (Jiménez-Reyes et al., 2016; Morin and Samozino, 2016).
Optimizing the exercise training program is constantly sought in rehabilitation among patients always younger with coronary artery disease (CAD) (Price et al., 2016). Indeed, the CAD prevalence rose from an estimated 290 cases per 100,000 for those 40–44 years of age to 11,203 cases per 100,000 at 1990–2015 (Roth et al., 2017). Therefore, it might be interesting to talk about performance even in patients and to use the FVP relationship to more precisely identify this loss of muscle force production capacity in patients suffering from cardiovascular impairment as well a loss of functional capacities of their neuromuscular system. Usual rehabilitation sessions are based on the results of functional explorations performed in aerobic (cardiorespiratory exercise test) and resistance (static and dynamic quadriceps test) at the beginning of the rehabilitation cycle. Instead of using the results of a muscle test, we could rely on the results of the initial FVP. So far, the measurement of muscle strength production capacities has been determined by isometric and dynamic leg extension test. The FVP profile would allow, through a simple and rapid assessment, to target the weakest qualities in patients in order to individualize the training for each person.
The aim of the present study was to analyze and compare the force production capacities through the mechanical variables of the FVP relationship obtained during pedaling between CAD patients and healthy participants (HP). We hypothesized that CAD patients present lower maximal power than HP, with notably a lower maximal force production at low velocity; but without previous studies, we had no evidence to suggest the impact of FV profile (i.e., whether one would be more affected than the other).
Coronary artery disease patients volunteered to participate in this study at the beginning of the CR. The inclusion criteria were the following: (a) over 18 years of age; (b) received medical treatment and percutaneous coronary intervention (angioplasty with stent implantation) or surgical revascularisation (coronary artery bypass grafting); and (c) maximal aerobic power superior to 60 W for women and 80 W for men (Borjesson et al., 2011). They received a measurement of their maximal oxygen uptake (O2max) during an ergocycle stress test before and after a CR program. The study protocol conformed to the ethical guidelines of the 1975 Declaration of Helsinki and was approved by the institution’s human research committee. The study was registered in the National Institutes of Health ClinicalTrials.gov database.
HP were 18 years old as patients, they were free from any kind of CVD, performing regular physical exercise and were volunteers to participate. The ethics committee (IRBN372016/CHUSTE) and the national commission for informatics and liberties (CNIL165853) approved the cohort study for pedaling testing.
History of sport was assessed by only two questions: (1) did you do sports (CAD patients) or (2) do you practice sports (HP)? If yes, which sport? Sport was quantified in weekly metabolic equivalent of task (MET) and expressed in h/week (i.e., intensity in MET × duration × frequency), using the compendium of sports, and ranged from 6 (vigorous intensity = sport) to 18 MET (running at 17 km/h) (Ainsworth et al., 2000).
At the beginning of each experiment, saddle height was adjusted and toe clips were well fastened to avoid losing the pedals. After a 5-min warm-up, participants performed two maximal 8-s duration sprints, separated by a 2-min rest period, against friction loads of 0.4 and 0.3 N.kg–1 body mass for men and women, respectively (Figure 1). We performed pre-tests to determine these appropriate loads. They had to remain seated during the test. For each trial, the participants had to pedal as fast as possible during all the sprint. For this, the experimenter (MF) encouraged vigorously each participant throughout the sprint. We retained the data of the best sprint (i.e., the one with the highest maximal power).
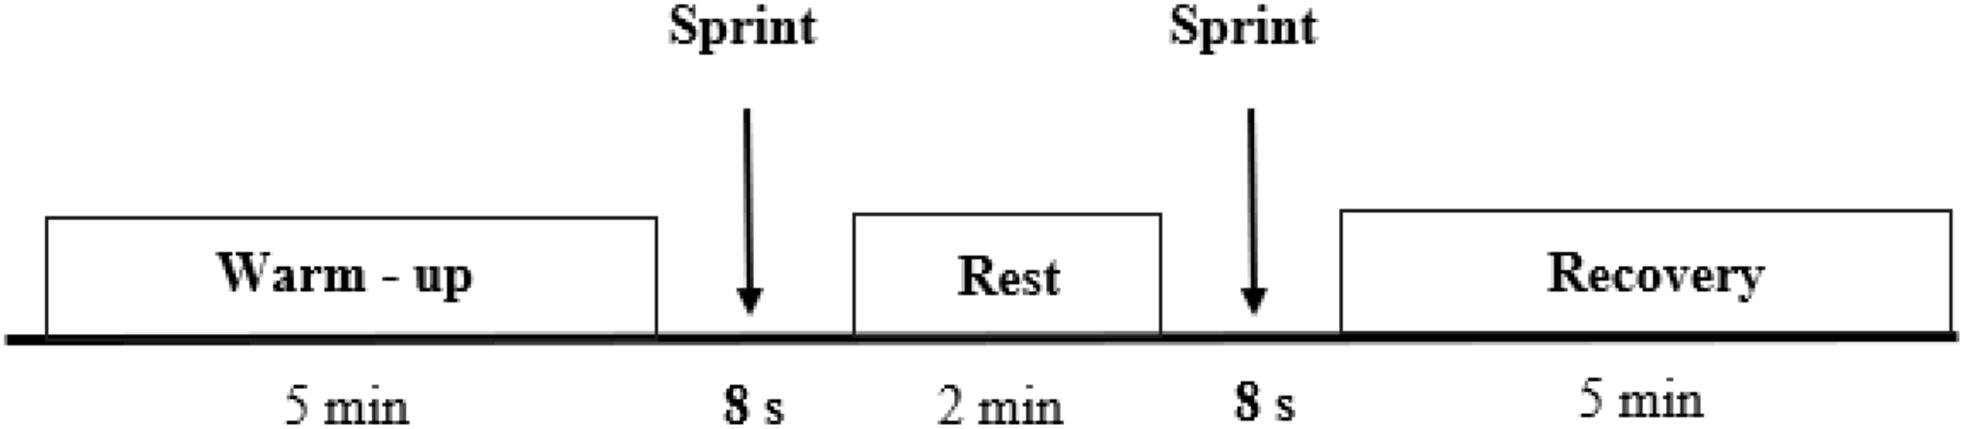
Figure 1. Protocol diagram.
A friction-loaded cycle ergometer (Monark, Vansbro, Sweden) was used (Figure 2). All features of the ergometer were detailed in previous studies (Arsac et al., 1996; Morin and Belli, 2004). The apparatus was instrumented with a strain gauge (FGP Instrumentation, FN 3030 type, Les Cloyes Sous Bois, France) to measure the friction force applied by the tension of the belt and an optical encoder (Hengstler type RI 32.0, 100 pts/turn, Aldingen, Germany) to measure the flywheel displacement. The inertia was determined from the linear relationship obtained by free deceleration of the flywheel. Data were sampled at 200 Hz and recorded in LabVIEW software. Data were filtered with a 4th order low pass Butterworth filter at 30 Hz. Angular velocity and pedaling frequency were calculated from filtered displacement.
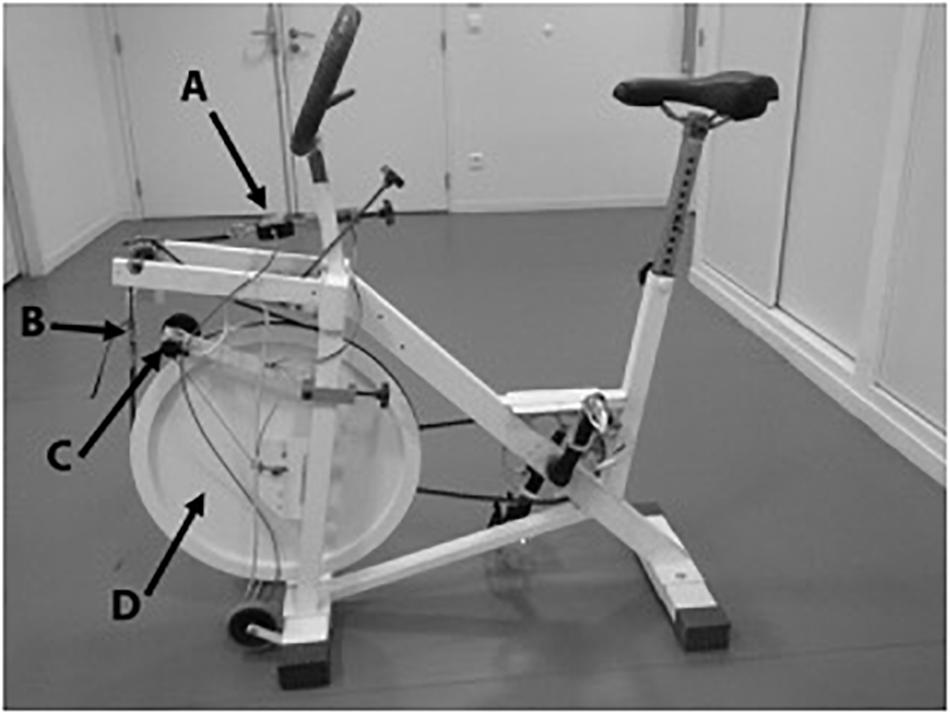
Figure 2. Friction loaded Monark cycle ergometer. A, Strain gauge; B, Belt; C, Optical encoder; D, flywheel.
The power output (P in watts) produced at each instant during the sprint was computed as follows (Morin and Belli, 2004):
where Ffrict was the friction force, Finert the inertial force (computed from the flywheel inertia and acceleration) and V the flywheel linear velocity. Instantaneous flywheel linear velocity was calculated from the flywheel displacement. The force (F = Ffrict + Finert), power (P) and velocity (V) variables corresponded to mechanical outputs at the flywheel (Jiménez-Reyes et al., 2016).
The F, V, and P values were averaged for each pedal downstroke, which were defined between two successive minimal values of instantaneous power (Samozino et al., 2007). The lower limb force production capacities can be described by the negative linear relationship (F-V) and the second order polynomial relationship (P-V). From these two relationships, a few parameters, which reflected the mechanical limits of the neuromuscular system, can be determined (Figure 3; Driss et al., 2002; Morin and Samozino, 2016): the theoretical maximum force (F0) which could be developed at zero velocity (intercept value on the y-axis); the theoretical maximum velocity (V0) until which force could be produced (intercept value on the x-axis); and the maximum power output (Pmax), corresponding to the maximum power that an individual is able to develop and the slope of F-V relationship (Sfv) which can be computed as follows:
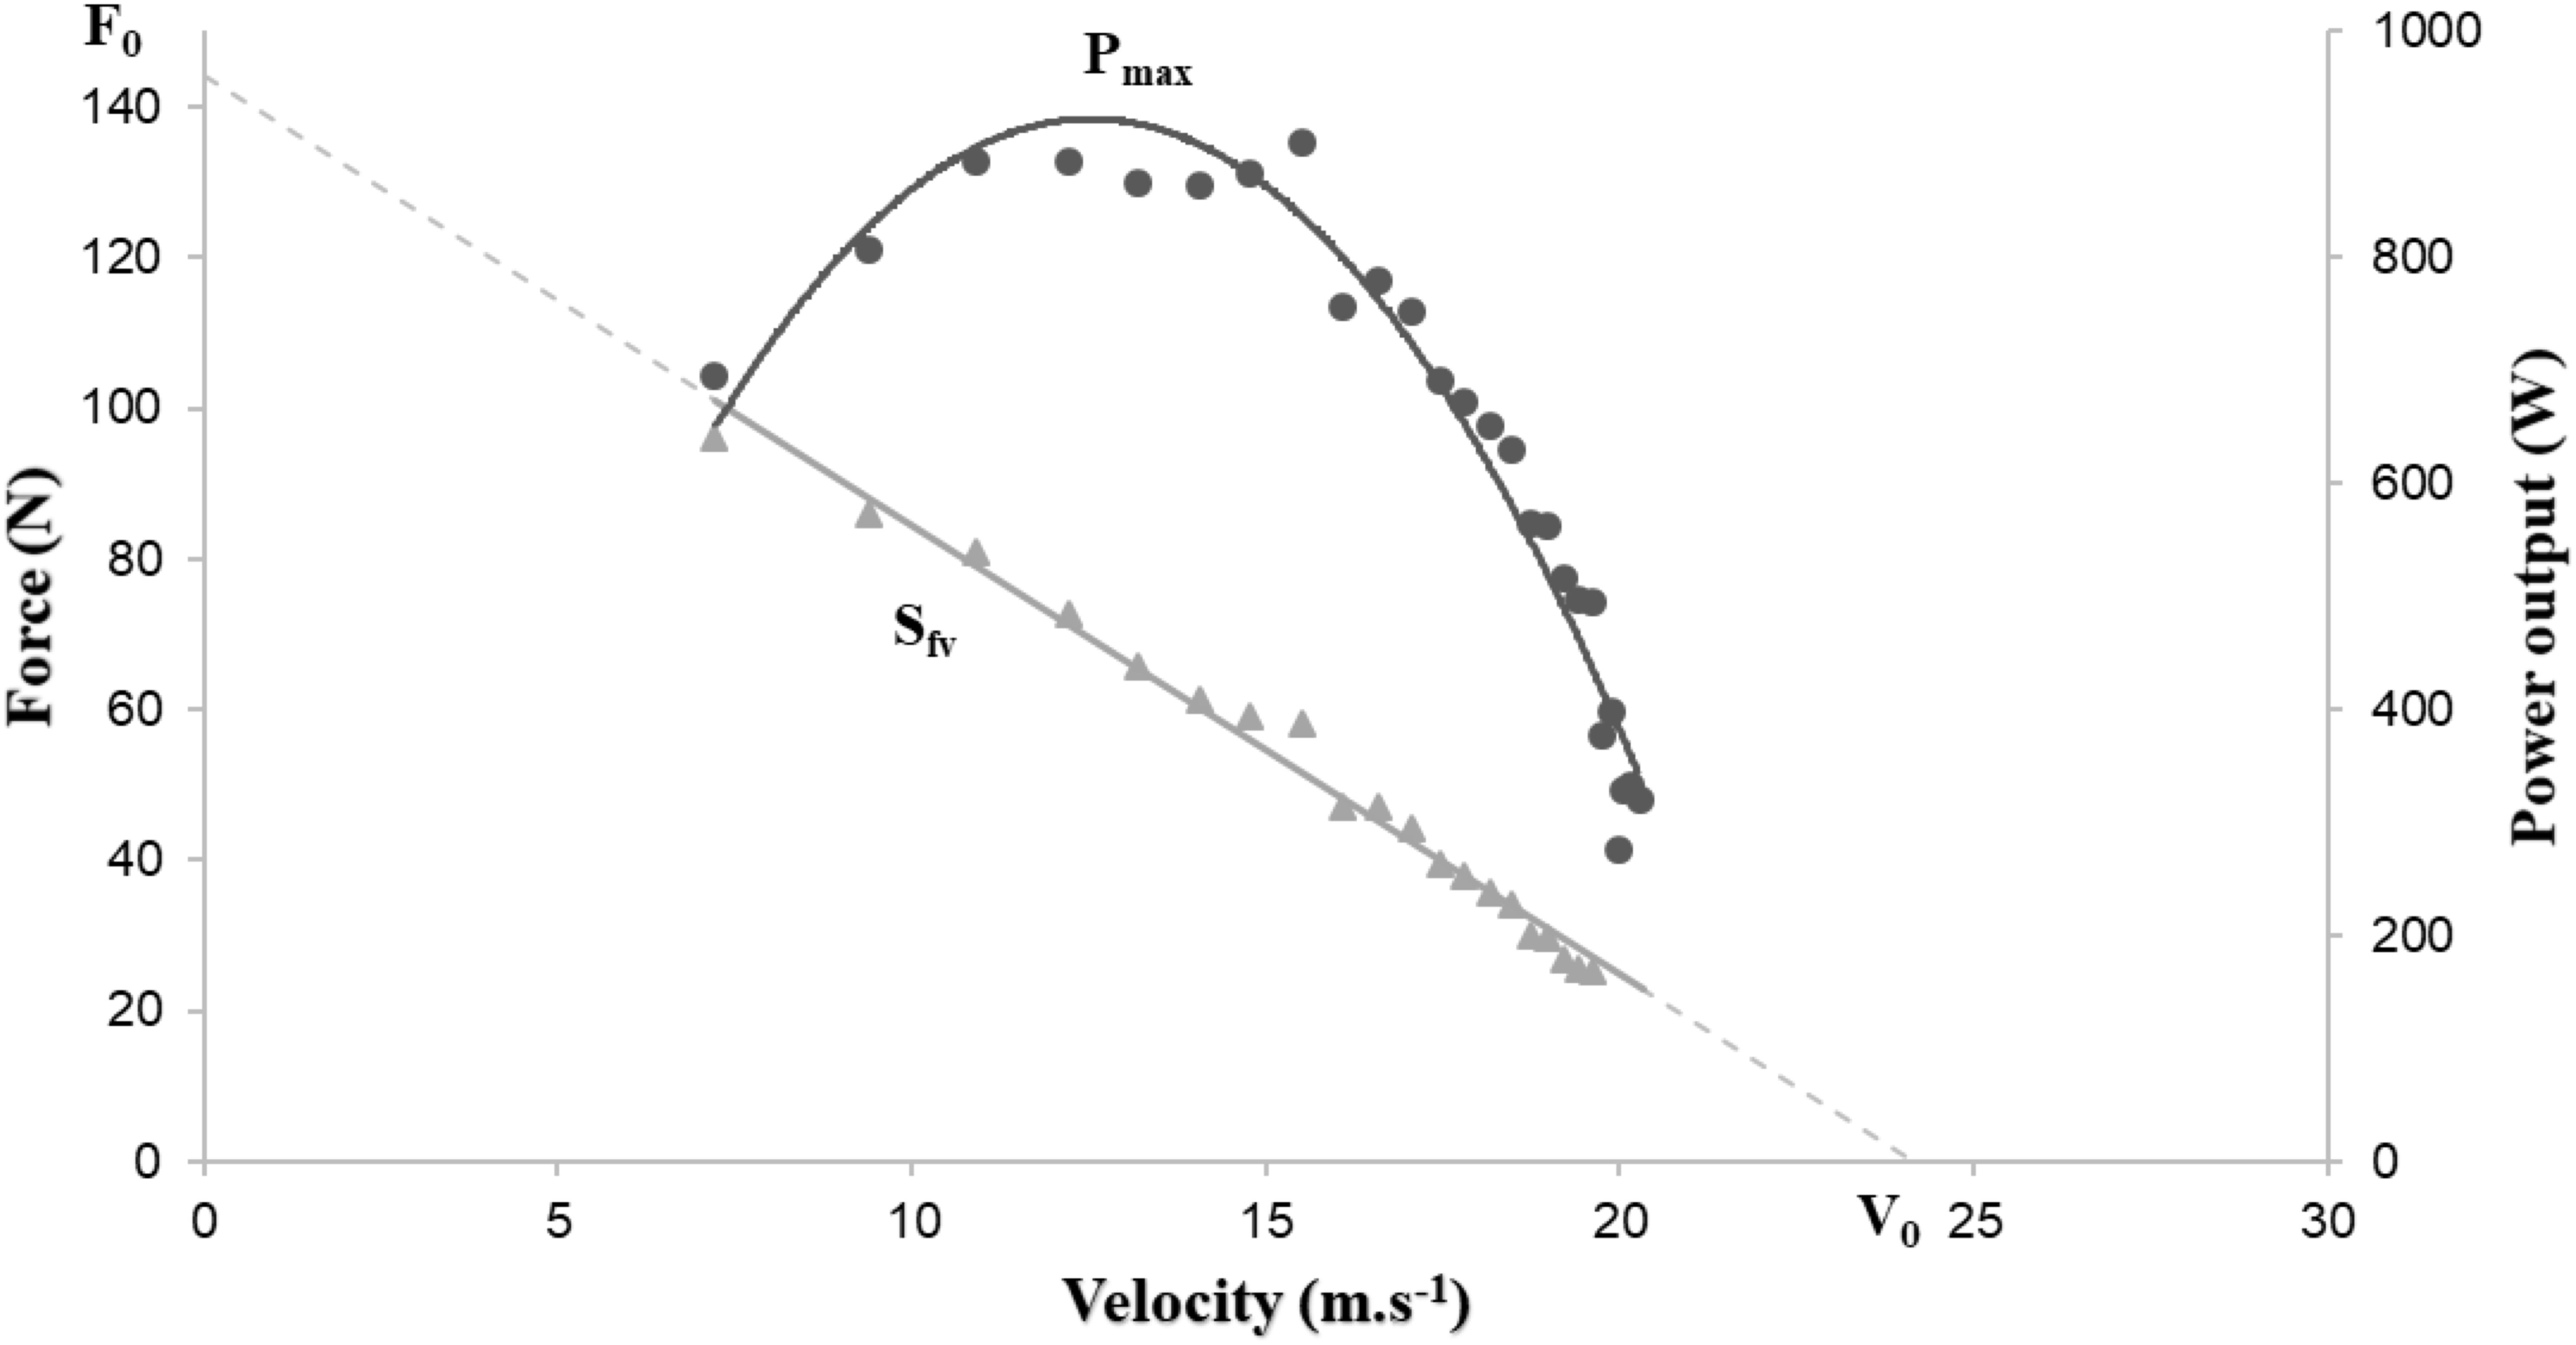
Figure 3. Graphical representation of power-force-velocity relationship.
All data were expressed as mean ± standard deviation (SD). After checking distribution of normality with the Shapiro–Wilk test, Student’s t-tests for independent groups were used to detect differences in F0, V0, Sfv, and Pmax between the two populations. For all analyses, statistical significance was defined as p < 0.05. Cohen’s d was also computed to indicate the effect size, which corresponded to the difference between two means divided by the pooled SD. We interpreted the data obtained in this way: <0.2 was trivial, 0.2–0.5 a weak effect, 0.5–0.8 a medium effect, and >0.8 a strong effect (Parker and Hagan-Burke, 2007).
Twenty-four CAD patients and 24 HP aged 55.8 (± 7.1) y and 52.4 (± 14.8) y, respectively, participated in this investigation. Overweight (mean BMI > 25 kg/m2) concerned 54% of the CAD patients and they had significantly higher BMI than HP (27.5 ± 5.4 vs. 24.4 ± 3.4 kg/m2, p < 0.05). In addition, these patients were physically inactive (5.3 ± 6.8 vs. 39.7 ± 42.0 MET-h/week, p < 0.001). Descriptive characteristics of participants are presented in Table 1.
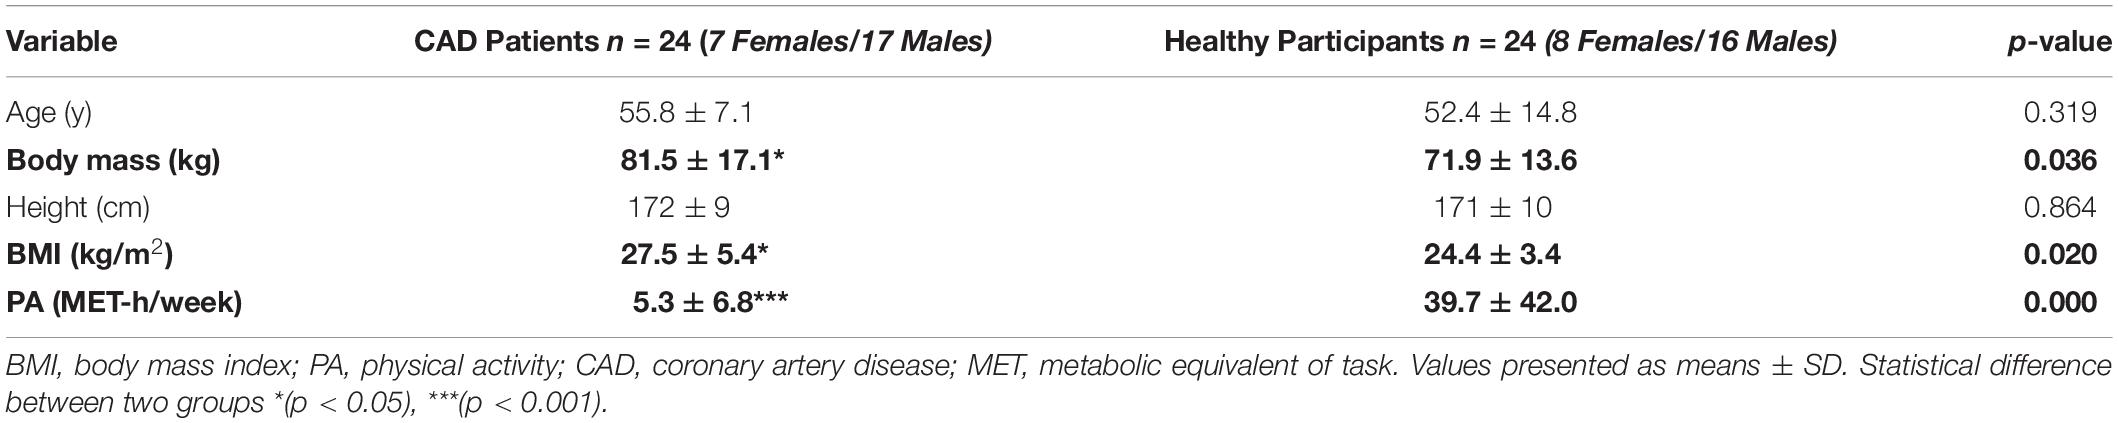
Table 1. Morphological characteristics of participants.
The average of mechanical parameters of the FVP for each group are reported in Table 2. We noted a significant difference for Pmax, V0, and F0. A smaller in Pmax (−29.8%, p = 0.003), V0 (−11.9%, p = 0.010), and F0 (−18.2%, p = 0.039) were observed in CAD patients compared to HP. However, no statistical difference was observed between the two populations for Sfv (p = 0.557) of FVP (Figure 4).
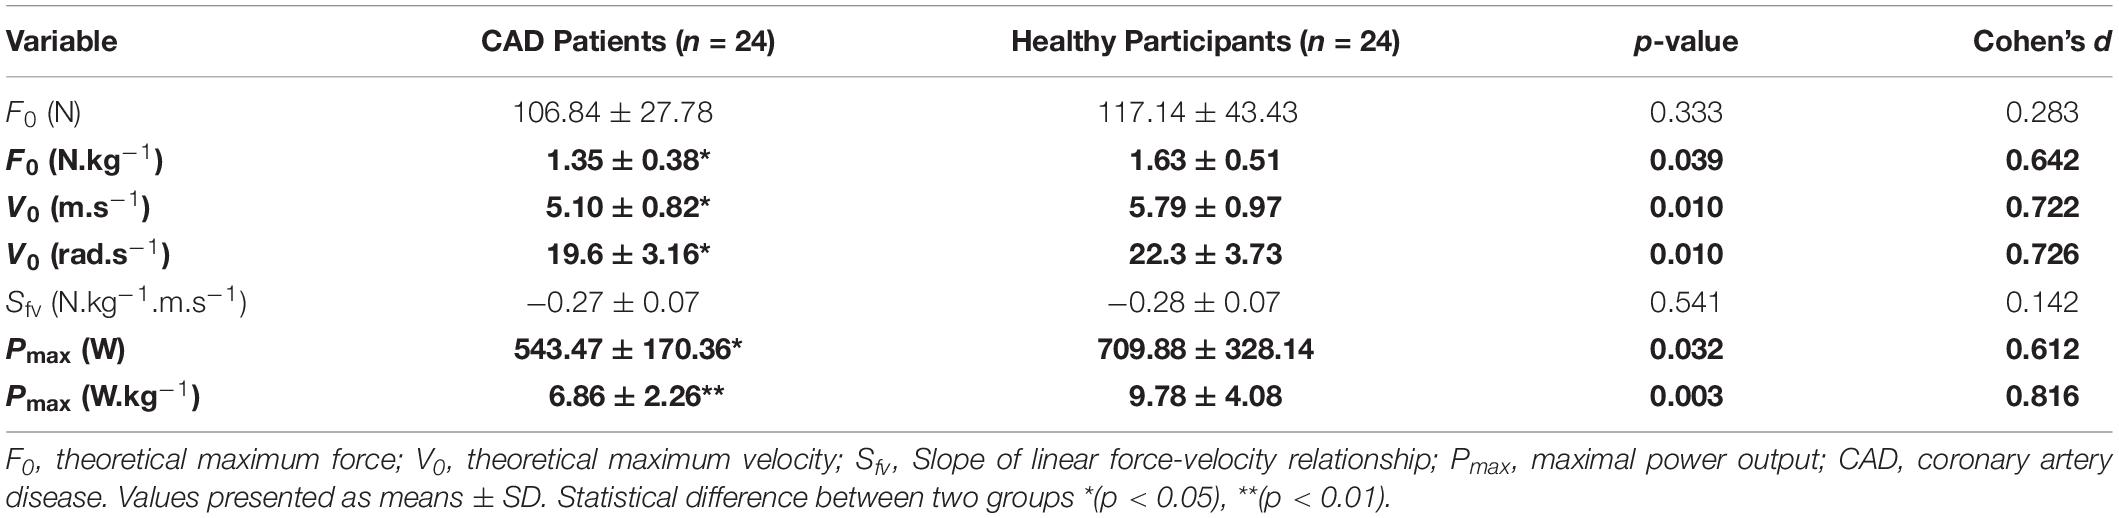
Table 2. Mechanical performance sprint variables.
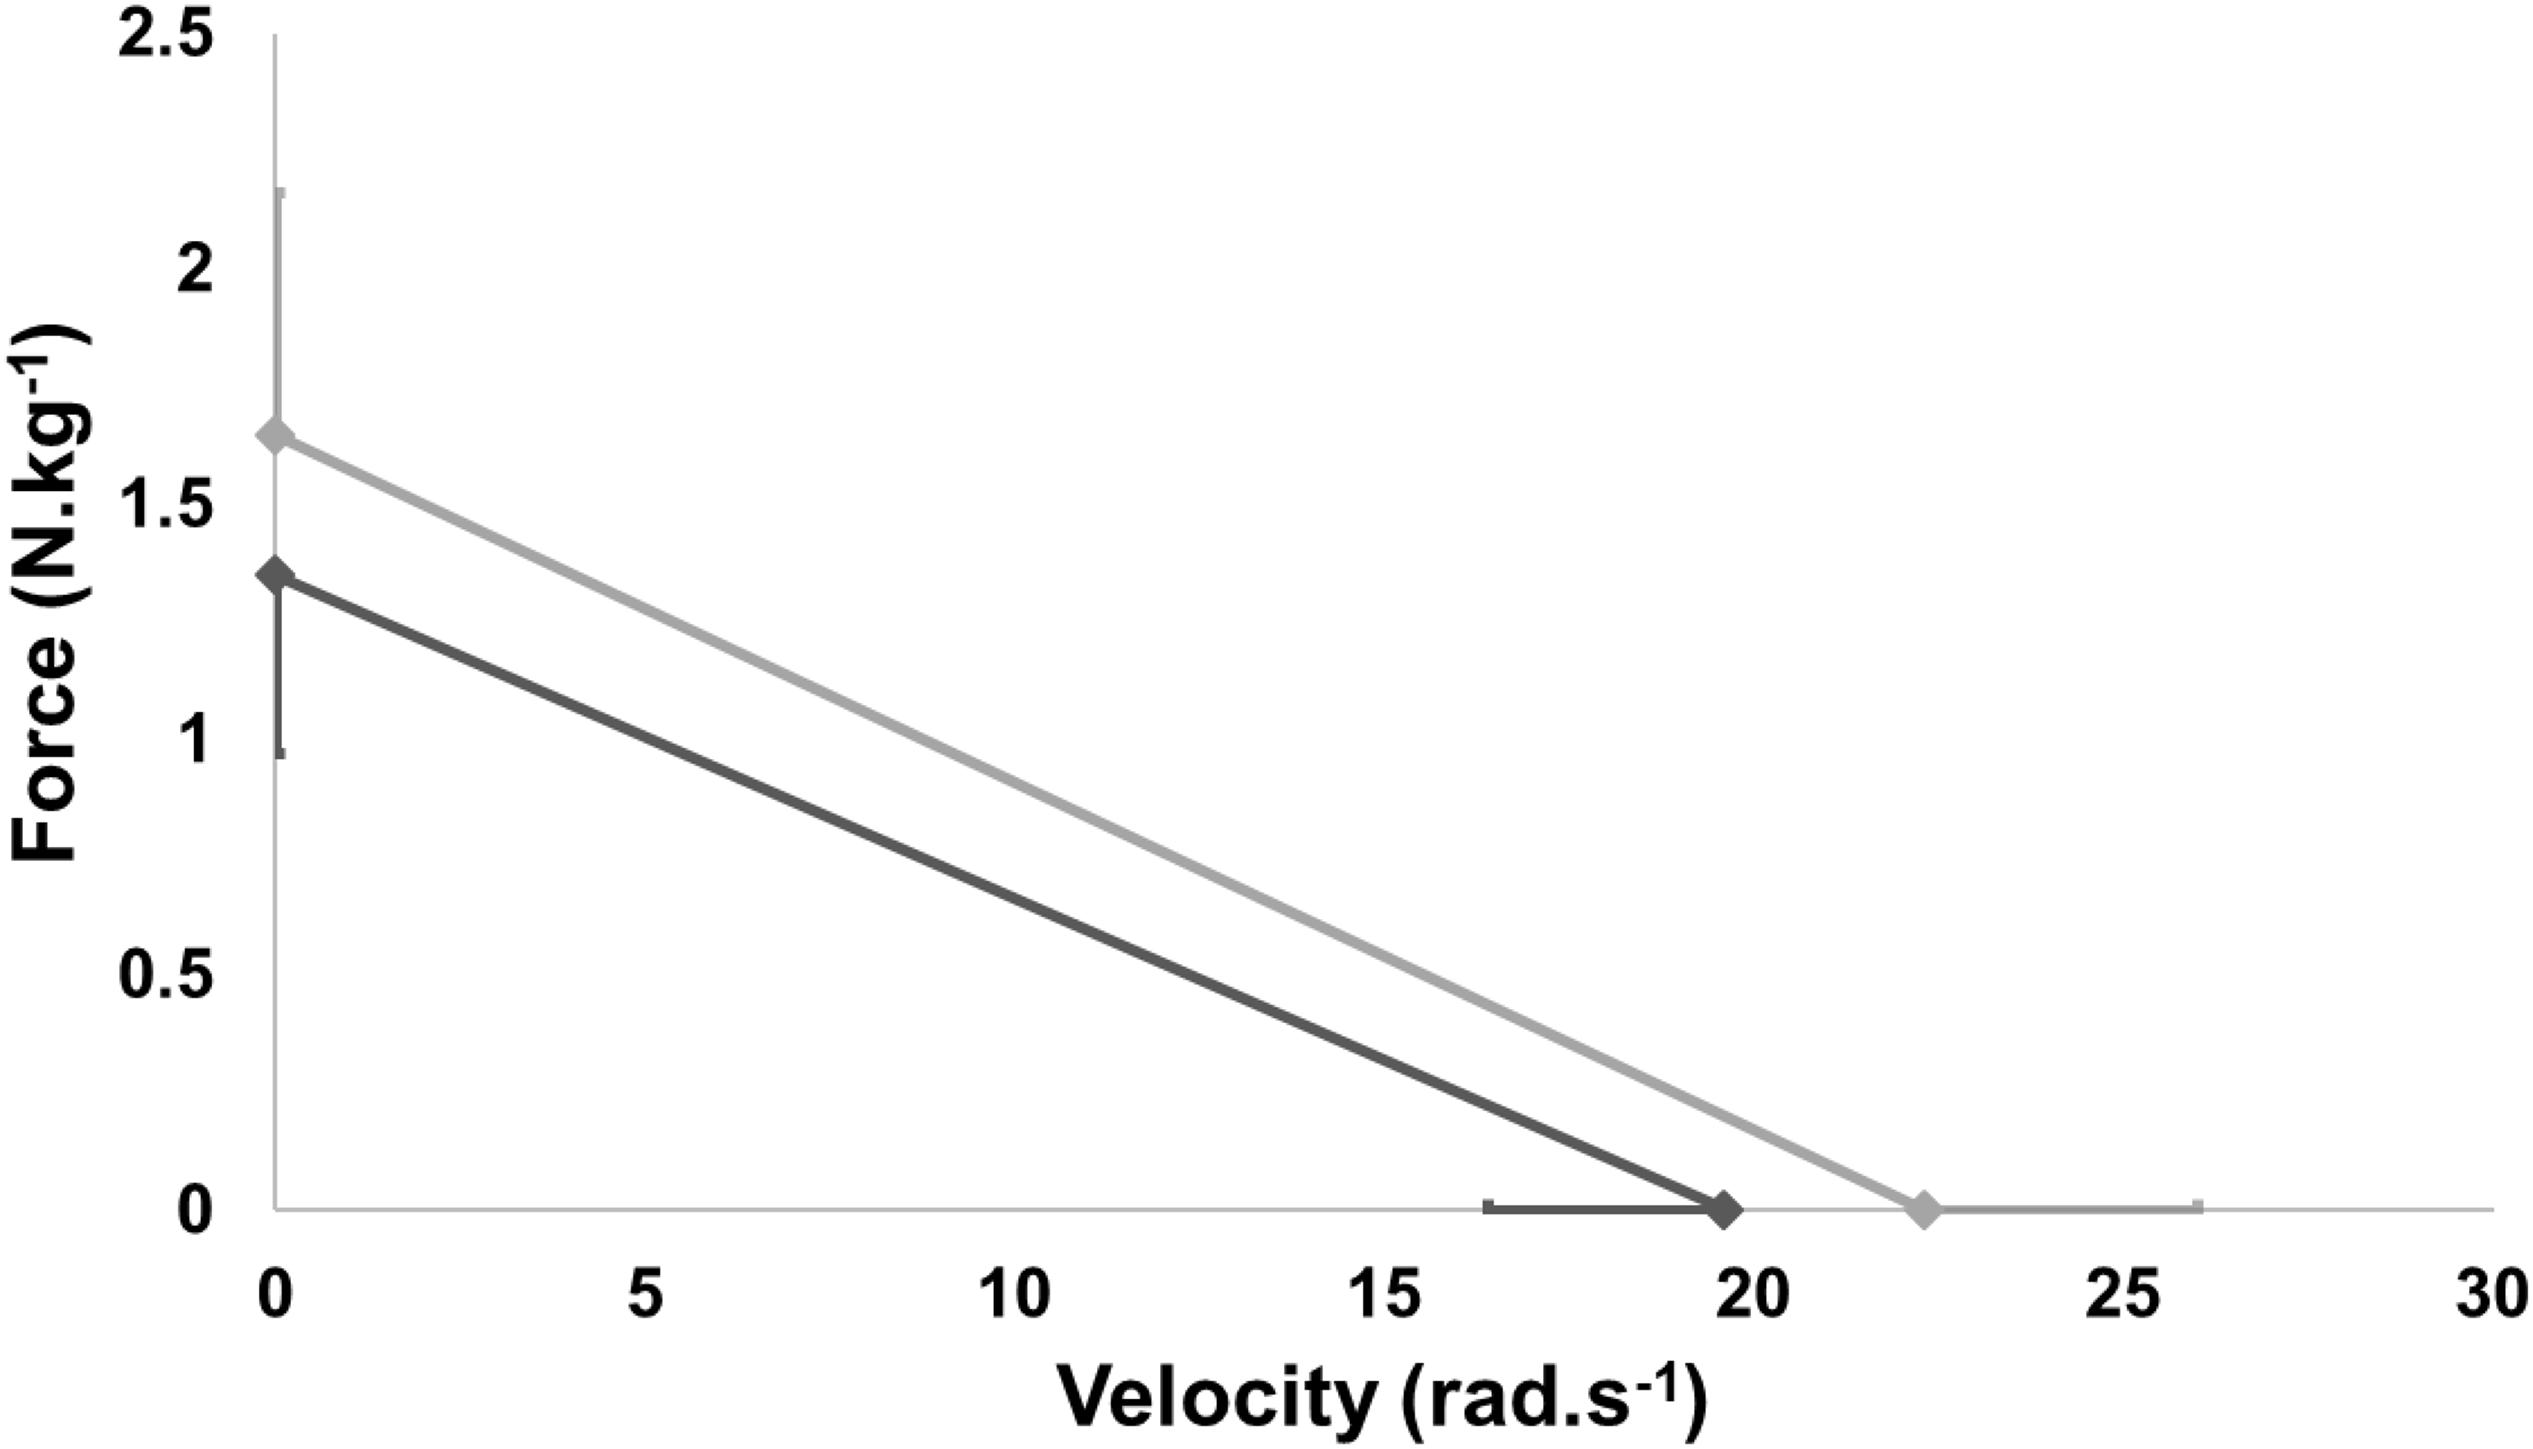
Figure 4. Mean force-velocity profile of healthy subjects and coronary patients.
This study was the first to examine the mechanical parameters of FVP in CAD patients. The main findings of this research were that (i) Pmax, V0, and F0 were significantly lower in CAD patients than in HP, while (ii) Sfv was similar for these two populations.
Considering power output as the product of force and velocity (eq.1), the decline of maximum power was induced by a reduction of both force production capacities at high (V0) and low (F0) velocities. The values presented in the literature are mostly based on high performance athletes, which leads to higher results than those reported in our study (Vandewalle et al., 1987; Dorel et al., 2005). Dorel et al. (2005) and Vandewalle et al. (1987) measured peak power (Pmax) of elite cyclists who performed short maximal sprints (about 5–6 s) on a Monark cycle ergometer. The findings of these two studies were, respectively 19.3 ± 1.3 and 16.8 ± 1.23 W.kg–1, i.e., it was almost two and three times the maximum power developed, respectively, by HP and CAD patients.
This difference in force and velocity between the two groups can be explained by different factors. First, CAD patients were significantly fatter than HP and therefore had a higher BMI. In addition, we have no significant difference between the BMI in CAD patients before and after CR (Before CR: 27.6 ± 5.5 kg/m2 and after CR: 26.6 ± 5.0 kg/m2, p = 0.44). Secondly, prior to their acute coronary syndrome, patients were physically inactive. They spent on average 5 MET-h/week, which was very low knowing that 1 MET represented the metabolism at rest (3.5 ml O2/kg/min) (Jetté et al., 1990). Besides, it was recommended to walk on average 10,000 steps/d and to practice at least 150 min of physical activity weekly (Le Masurier et al., 2003) which represents an average dose of 7.5 MET-h/week (Hupin et al., 2015). We noted a significant difference on O2max in CAD patients before and at the end of CR (before CR: 22.70 ± 5.20 ml/min/kg and after CR: 25.82 ± 5.78 ml/min/kg, p = 0.0018). Thanks to CR, CAD patients improved their O2max by 15%. Compared to the reference values for people of the same age [i.e., 38.4 ml/min/kg (Wilmore et al., 2008)] this confirms that CAD patients are deconditioned before the CR program. Thirdly, patients often had more sedentary behavior before cardiovascular event. These risk behavioral factors, combined with CVD risk factors such as smoking and poor diet, significantly increase cardiovascular morbidity and mortality (Gbd 2013 Risk Factors Collaborators, 2015). We can suppose that high CVD risk and an excess fat mass prevented them from contracting at high velocities.
This difference of V0 might be due to a remodeling of the motor units toward a slower typology (Power et al., 2014). Other physiological factors could be involved, such as an increase internal resistance produced by connective tissue (Valour et al., 2003) an increase in percentage of type I fibres (Thom et al., 2007) and selective atrophy of type II fibers (Häkkinen et al., 1996). This last assumption was in accordance with (Hautier et al., 1998), who showed an important relationship between maximal power and the relative area of fast twitch fibers. Indeed, most HP practiced explosive sports such as football and tennis, which requested fast twitch fibers and anaerobic metabolism.
The variation in F0 might be caused by sarcopenia, the loss of muscle mass in patients (Häkkinen et al., 1996). In addition, most of the patients had sedentary behavior (i.e., overweight and physically inactive), which led to higher a percentage of fat tissue compared to HP. Thirdly, they might also have a neuromuscular activation deficit or the decrease in the effectiveness of the transmission of the voluntary command to the muscle could explain the decrease in force (Morse et al., 2004).
In addition, all CAD patients (except one) were receiving beta-blocker medical treatment (none among HP). These medications have the effect of decreasing heart rate and blood pressure (Goldberger et al., 2015). Beta-blockers would change neuromuscular recruitment strategy, which would explain the impaired maximal sprint performance (Hunter et al., 2002; Fisher et al., 2010). Moreover, statin therapy demonstrated a benefit in CAD patients to reduce CVD risk (Shepherd et al., 1995); however, they had deleterious effects on skeletal muscle, ranging from muscle complaints (which explained the withdrawal of statin in 2 CAD patients) to myositis (Mikus et al., 2013). Finally, the treatment of CAD patients (statin, beta-blockers), the disease and low physical activity had negative effects on muscle function.
No significant difference was observed for the Sfv variable between the two groups. The Pmax impacted both force production at high and low velocities. The current results differed with previous studies which indicate higher F0 values (Driss et al., 1998; Giroux et al., 2016). Indeed, Driss et al. (1998) assessed mechanical properties of FVP in male volleyball players during short maximal sprint (about 6 s) on a Monark cycle ergometer and they reported a F0 value almost two times higher than ours.
As physical activity was evaluated solely through a few questions, which is an approximate measure of the quantity of physical exercise, the main limitation of this study regards the objectivity of physical activity assessment. For future studies, more precise tools such as actimeters should be used.
This study could be continued by a randomized study with a larger number of participants to assess the impact of training in force or velocity production force capacities according to the initial FVP of the patients. Indeed, evidence may be emerging that high-intensity strength training is more effective to increase acutely myofibrillar protein synthesis, cause neural adaptations and, in the long term, increase muscle strength, when compared to low-intensity strength training (Hansen et al., 2019). Also, studies report that cardiovascular demand is lower in high-intensity than low-intensity resistance exercises, thus potentially pointing toward sufficient medical safety of a simple sprint on cycle ergometer for the cardiovascular system (Bjarnason-Wehrens, 2019). The F-V (deficit in force or velocity) imbalance initially observed from an evaluation of the FVP (sprint on cycle ergometer) would be optimized thanks to an adapted training program. We hypothesize that F-V profile could be used in CR in CAD patients, as an additional and novel tool, to induce a F-V balance adapted through personalized sessions (Supplementary Material).
The lower maximal power in CAD patients was related to both a lower V0 and F0. Physical inactivity, sedentary time and high CVD risk may explain this difference of force production at both high and low velocities between the two groups.
All datasets generated for this study are included in the article/Supplementary Material.
The studies involving human participants were reviewed and approved by the French Ethics Committee. The patients/participants provided their written informed consent to participate in this study.
MF and DH contributed to the conception and design of the work. JR, PS, and TB contributed to the analysis and interpretation of the data. MF drafted the manuscript. JR, PS, J-BM, RT, FR, JL, and DH critically revised the manuscript. All authors gave final approval and agreed to be accountable for all aspects of work ensuring integrity and accuracy.
The authors declare that the research was conducted in the absence of any commercial or financial relationships that could be construed as a potential conflict of interest.
We are grateful to Maxence Usson, Manon Bayle, and Pierre Labeix for their involvement and their precious help in the protocol.
The Supplementary Material for this article can be found online at: https://www.frontiersin.org/articles/10.3389/fphys.2019.01639/full#supplementary-material
Ainsworth, B. E., Haskell, W. L., Whitt, M. C., Irwin, M. L., Swartz, A. M., Strath, S. J., et al. (2000). Compendium of physical activities: an update of activity codes and MET intensities. Med. Sci. Sports Exerc. 32(9 Suppl.), S498–S504.
Arsac, L. M., Belli, A., and Lacour, J. R. (1996). Muscle function during brief maximal exercise: accurate measurements on a friction-loaded cycle ergometer. Eur. J. Appl. Physiol. 74, 100–106. doi: 10.1007/bf00376501
Bjarnason-Wehrens, B. (2019). Recommendations for resistance exercise in cardiac rehabilitation: do they need reconsideration? Eur. J. Prev. Cardiol. 26, 1479–1482. doi: 10.1177/2047487319856124
Borjesson, M., Urhausen, A., Kouidi, E., Dugmore, D., Sharma, S., Halle, M., et al. (2011). Cardiovascular evaluation of middle-aged/senior individuals engaged in leisure-time sport activities: position stand from the sections of exercise physiology and sports cardiology of the European Association of Cardiovascular Prevention and Rehabilitation. Eur. J. Cardiovasc. Prev. Rehabil. 18, 446–458. doi: 10.1097/HJR.0b013e32833bo969
Cronin, J., and Sleivert, G. (2005). Challenges in understanding the influence of maximal power training on improving athletic performance. Sports Med. 35, 213–234. doi: 10.2165/00007256-200535030-00003
Dorel, S., Hautier, C. A., Rambaud, O., Rouffet, D., Van Praagh, E., Lacour, J. R., et al. (2005). Torque and power-velocity relationships in cycling: relevance to track sprint performance in world-class cyclists. Int. J. Sports Med. 26, 739–746. doi: 10.1055/s-2004-830493
Driss, T., Vandewalle, H., Le Chevalier, J. M., and Monod, H. (2002). Force-velocity relationship on a cycle ergometer and knee-extensor strength indices. Can. J. Appl. Physiol. 27, 250–262. doi: 10.1139/h02-015
Driss, T., Vandewalle, H., and Monod, H. (1998). Maximal power and force-velocity relationships during cycling and cranking exercises in volleyball players. Correlation with the vertical jump test. J. Sports Med. Phys. Fitness 38, 286–293.
Fisher, J. P., Seifert, T., Hartwich, D., Young, C. N., Secher, N. H., and Fadel, P. J. (2010). Autonomic control of heart rate by metabolically sensitive skeletal muscle afferents in humans. J. Physiol. 588, 1117–1127. doi: 10.1113/jphysiol.2009.185470
Gbd 2013 Risk Factors Collaborators (2015). Global, regional, and national comparative risk assessment of 79 behavioural, environmental and occupational, and metabolic risks or clusters of risks in 188 countries, 1990–2013: a systematic analysis for the Global Burden of Disease Study 2013. Lancet 386, 2287–2323. doi: 10.1016/S0140-6736(15)00128-2
Giroux, C., Rabita, G., Chollet, D., and Guilhem, G. (2016). Optimal balance between force and velocity differs among world-class athletes. J. Appl. Biomech. 32, 59–68. doi: 10.1123/jab.2015-0070
Goldberger, J. J., Bonow, R. O., Cuffe, M., Liu, L., Rosenberg, Y., Shah, P. K., et al. (2015). Effect of beta-blocker dose on survival after acute myocardial infarction. J. Am. Coll. Cardiol. 66, 1431–1441. doi: 10.1016/j.jacc.2015.07.047
Häkkinen, K., Kraemer, W. J., Kallinen, M., Linnamo, V., Pastinen, U. M., Newton, R. U., et al. (1996). Bilateral and unilateral neuromuscular function and muscle cross-sectional area in middle-aged and elderly men and women. J. Gerontol. A Biol. Sci. Med. Sci. 51, B21–B29.
Hansen, D., Abreu, A., Doherty, P., and Völler, H. (2019). Dynamic strength training intensity in cardiovascular rehabilitation: is it time to reconsider clinical practice? A systematic review. Eur. J. Prev. Cardiol. 26, 1483–1492. doi: 10.1177/2047487319847003
Hautier, C. A., Belli, A., and Lacour, J. R. (1998). A method for assessing muscle fatigue during sprint exercise in humans using a friction-loaded cycle ergometer. Eur. J. Appl. Physiol. Occup. Physiol. 78, 231–235. doi: 10.1007/s004210050412
Hunter, A. M., St Clair Gibson, A., Derman, W. E., Lambert, M., Dennis, S. C., and Noakes, T. D. (2002). The effect of selective beta1-blockade on EMG signal characteristics during progressive endurance exercise. Eur. J. Appl. Physiol. 88, 275–281. doi: 10.1007/s00421-002-0710-5
Hupin, D., Roche, F., Gremeaux, V., Chatard, J. C., Oriol, M., Gaspoz, J. M., et al. (2015). Even a low-dose of moderate-to-vigorous physical activity reduces mortality by 22% in adults aged = 60 years: a systematic review and meta-analysis. Br. J. Sports Med. 19, 1262–1267. doi: 10.1136/bjsports-2014-094306
Iliou, M. C., Pavy, B., Martinez, J., Corone, S., Meurin, P., Tuppin, P., et al. (2015). Exercise training is safe after coronary stenting: a prospective multicentre study. Eur. J. Prev. Cardiol. 22, 27–34. doi: 10.1177/2047487313505819
Jetté, M., Sidney, K., and Blümchen, G. (1990). Metabolic equivalents (METS) in exercise testing, exercise prescription, and evaluation of functional capacity. Clin. Cardiol. 13, 555–565. doi: 10.1002/clc.4960130809
Jiménez-Reyes, P., Samozino, P., Brughelli, M., and Morin, J. B. (2016). Effectiveness of an individualized training based on force-velocity profiling during jumping. Front. Physiol. 7:677. doi: 10.3389/fphys.2016.00677
Le Masurier, G. C., Sidman, C. L., and Corbin, C. B. (2003). Accumulating 10,000 steps: does this meet current physical activity guidelines? Res. Q. Exerc. Sport 74, 389–394. doi: 10.1080/02701367.2003.10609109
Mikus, C. R., Boyle, L. J., Borengasser, S. J., Oberlin, D. J., Naples, S. P., Fletcher, J., et al. (2013). Simvastatin impairs exercise training adaptations. J. Am. Coll. Cardiol. 62, 709–714. doi: 10.1016/j.jacc.2013.02.074
Morin, J. B., and Belli, A. (2004). A simple method for measurement of maximal downstroke power on friction-loaded cycle ergometer. J. Biomech. 37, 141–145. doi: 10.1016/s0021-9290(03)00253-7
Morin, J. B., and Samozino, P. (2016). Interpreting power-force-velocity profiles for individualized and specific training. Int. J. Sports Physiol. Perform. 11, 267–272. doi: 10.1123/ijspp.2015-0638
Morin, J. B., Samozino, P., Bonnefoy, R., Edouard, P., and Belli, A. (2010). Direct measurement of power during one single sprint on treadmill. J. Biomech. 43, 1970–1975. doi: 10.1016/j.jbiomech.2010.03.012
Morse, C. I., Thom, J. M., Davis, M. G., Fox, K. R., Birch, K. M., Narici, M. V., et al. (2004). Reduced plantarflexor specific torque in the elderly is associated with a lower activation capacity. Eur. J. Appl. Physiol. 92, 219–226. doi: 10.1007/s00421-004-1056-y
Parker, R. I., and Hagan-Burke, S. (2007). Useful effect size interpretations for single case research. Behav. Ther. 38, 95–105. doi: 10.1016/j.beth.2006.05.002
Pavy, B., Iliou, M. C., Vergès-Patois, B., Brion, R., Monpère, C., Carré, F., et al. (2012). French society of cardiology guidelines for cardiac rehabilitation in adults. Arch. Cardiovasc. Dis. 105, 309–328. doi: 10.1016/j.acvd.2012.01.010
Power, G. A., Allen, M. D., Booth, W. J., Thompson, R. T., Marsh, G. D., and Rice, C. L. (2014). The influence on sarcopenia of muscle quality and quantity derived from magnetic resonance imaging and neuromuscular properties. Age 36: 9642.
Price, K. J., Gordon, B. A., Bird, S. R., and Benson, A. C. (2016). A review of guidelines for cardiac rehabilitation exercise programmes: is there an international consensus? Eur. J. Prev. Cardiol. 23, 1715–1733. doi: 10.1177/2047487316657669
Roth, G., Johnson, C., Abajobir, A., Abd-Allah, F., Abera, S. F., Abyu, G., et al. (2017). Global, regional, and national burden of cardiovascular diseases for 10 causes, 1990 to 2015. J. Am. Coll. Cardiol. 70, 1–25. doi: 10.1016/j.jacc.2017.04.052
Samozino, P., Edouard, P., Sangnier, S., Brughelli, M., Gimenez, P., and Morin, J. B. (2014a). Force-velocity profile: imbalance determination and effect on lower limb ballistic performance. Int. J. Sports Med. 35, 505–510. doi: 10.1055/s-0033-1354382
Samozino, P., Horvais, N., and Hintzy, F. (2007). Why does power output decrease at high pedalling rates during sprint cycling? Med. Sci. Sports Exerc. 39, 680–687. doi: 10.1249/mss.0b013e3180315246
Samozino, P., Rejc, E., Di Prampero, P. E., Belli, A., and Morin, J. B. (2014b). Force-velocity properties’ contribution to bilateral deficit during ballistic push-off. Med. Sci. Sports Exerc. 46, 107–114. doi: 10.1249/MSS.0b013e3182a124fb
Seck, D., Vandewalle, H., Decrops, N., and Monod, H. (1995). Maximal power and torque-velocity relationship on a cycle ergometer during the acceleration phase of a single all-out exercise. Eur. J. Appl. Physiol. Occup. Physiol. 70, 161–168. doi: 10.1007/bf00361544
Shepherd, J., Cobbe, S. M., Ford, I., Isles, C. G., Lorimer, A. R., MacFarlane, P. W., et al. (1995). Prevention of coronary heart disease with pravastatin in men with hypercholesterolemia. West of Scotland coronary prevention study group. N. Engl. J. Med. 333, 1301–1307.
Thom, J. M., Morse, C. I., Birch, K. M., and Narici, M. V. (2007). Influence of muscle architecture on the torque and power-velocity characteristics of young and elderly men. Eur. J. Appl. Physiol. 100, 613–619. doi: 10.1007/s00421-007-0481-0
Valour, D., Ochala, J., Ballay, Y., and Pousson, M. (2003). The influence of ageing on the force-velocity-power characteristics of human elbow flexor muscles. Exp. Gerontol. 38, 387–395. doi: 10.1016/s0531-5565(02)00265-6
Vandewalle, H., Peres, G., Heller, J., Panel, J., and Monod, H. (1987). Force-velocity relationship and maximal power on a cycle ergometer. Correlation with the height of a vertical jump. Eur. J. Appl. Physiol. Occup. Physiol. 56, 650–666.
Keywords: force-velocity-power relationship, cardiac rehabilitation, physical activity, acute coronary syndrome, cycle sprint, exercise physiology, health
Citation: Fanget M, Rossi J, Samozino P, Morin J-B, Testa R, Roche F, Busso T, Laukkanen JA and Hupin D (2020) Dynamic Force Production Capacities Between Coronary Artery Disease Patients vs. Healthy Participants on a Cycle Ergometer. Front. Physiol. 10:1639. doi: 10.3389/fphys.2019.01639
Received: 27 September 2019; Accepted: 31 December 2019;
Published: 24 January 2020.
Edited by:
Helena Lenasi, University of Ljubljana, SloveniaReviewed by:
Vedran Hadzic, University of Ljubljana, SloveniaCopyright © 2020 Fanget, Rossi, Samozino, Morin, Testa, Roche, Busso, Laukkanen and Hupin. This is an open-access article distributed under the terms of the Creative Commons Attribution License (CC BY). The use, distribution or reproduction in other forums is permitted, provided the original author(s) and the copyright owner(s) are credited and that the original publication in this journal is cited, in accordance with accepted academic practice. No use, distribution or reproduction is permitted which does not comply with these terms.
*Correspondence: David Hupin, ZC5odXBpbkB1bml2LXN0LWV0aWVubmUuZnI=
Disclaimer: All claims expressed in this article are solely those of the authors and do not necessarily represent those of their affiliated organizations, or those of the publisher, the editors and the reviewers. Any product that may be evaluated in this article or claim that may be made by its manufacturer is not guaranteed or endorsed by the publisher.
Research integrity at Frontiers
Learn more about the work of our research integrity team to safeguard the quality of each article we publish.