 Chuangye Yang
 Ruijuan Hao1†
 Yuewen Deng
94% of researchers rate our articles as excellent or good
Learn more about the work of our research integrity team to safeguard the quality of each article we publish.
Find out more
ORIGINAL RESEARCH article
Front. Physiol., 19 July 2018
Sec. Aquatic Physiology
Volume 9 - 2018 | https://doi.org/10.3389/fphys.2018.00944
This article is part of the Research TopicMolecular Physiology in MolluscsView all 20 articles
Natural disasters and environmental pollution are the main problems in traditional offshore cultivation. While culturing pearl oysters through industrial farming can avoid these problems, food availability in this case is limited. This study compares the metabolomics responses of pearl oysters, Pinctada fucata martensii, fed a formulated diet indoors with those of oysters cultured with natural diet outdoors by using a gas chromatography time-of-flight mass spectrometry (GC-TOF/MS)-based metabolomics approach. The animals were divided into two groups as follows: the experimental group (EG) was fed a formulated diet indoors and the control group (CG) was cultured with natural diet outdoors. After 45 days of feeding, the survival rate of EG was significantly higher than that of CG. The absolute growth rate (AGR) of the total weight of EG did not significantly differ from that of CG, but the AGRs of the shell length, shell height, and shell width of CG were significantly higher than those of EG. EG showed significantly higher amylase activities than CG, and the hexokinase and glucose-6-phosphate isomerase concentrations of the former were significantly lower than those of the latter. Metabolomics revealed 125 metabolites via mass spectrum matching with a spectral similarity value > 700 in the hepatopancreas, and 48 metabolites were considered to be significantly different between groups (VIP > 1 and P < 0.05). Pathway analysis results indicated that these significantly different metabolites were involved in 34 pathways. Further integrated key metabolic pathway analysis showed that, compared with CG, EG had lower capabilities for cysteine and methionine metabolism, sulfur metabolism, and starch and sucrose metabolism. This study demonstrated that the formulated diet could be an excellent substitute for natural diet; however, its nutrients were insufficient. Effective strategies should be developed to enhance the utilization of formulated diets.
Pinctada fucata martensii is the main pearl oyster species cultured for marine pearl production in China and Japan. In Southern China, production of this organism peaked in the 1990s with an annual yield of 20 tons (Yang et al., 2017a). However, pearl yield has steadily declined because of the slow growth and mass mortality of the cultured stock and environmental deterioration (Qiu et al., 2014). Thus, various methods, including new strain development (Deng et al., 2009; Deng Y.W et al., 2010), pearl culturing techniques (Deng C.M et al., 2010), and culture modes (Wang et al., 2016), have been applied to restore pearl yields. Traditional raft-culture models depend on natural microalgae and are highly susceptible to natural disasters and environmental pollution. These disadvantages can be avoided through industrial farming, where, unfortunately, the food demand is high and the available formulated diets for bivalves are limited.
Diet quality greatly affects an animal's performance. When animals are fed diets of different quality, alterations in key metabolic pathways are difficult to characterize by using traditional nutritional methods. Metabolomics is an effective omic technique to detect the overall complexity of and determine essential changes in diverse biological systems (Liu et al., 2016; Cappello et al., 2017, 2018). Low-molecular-weight metabolites, including lipids, sugars, and amino acids, can be quantified in biological samples by utilizing metabolomics approaches, such as 1H-nuclear magnetic resonance (NMR), gas chromatography–mass spectrometry (GC–MS), and liquid chromatography–mass spectrometry (LC–MS) (Ye et al., 2016; Maherizo et al., 2017; Venter et al., 2018). The identification and integrative analysis of these metabolites may enable the comprehensive characterization of metabolic mechanisms at the molecular and cellular levels under internal or external stimulating conditions. Among the metabolomics technologies currently available, gas chromatography time-of-flight mass spectrometry (GC–TOF/MS) is the most widely used because of its high resolution, high detection sensitivity, and numerous open-access spectral libraries (Sun et al., 2015; Collette et al., 2016; Hao et al., 2018). Thus, it can effectively assess the effects of food shortage (Tuffnail et al., 2009; Kullgren et al., 2010; Baumgarner and Cooper, 2012; Cipriano et al., 2015; Sheedy et al., 2016), nutrient supplementation (Andersen et al., 2014, 2015; Wagner et al., 2014), differences in nutrient levels (Jin et al., 2015), and dietary protein or lipid substitution (Abro et al., 2014; Cheng et al., 2016; Ma et al., 2017; Wei et al., 2017; Yang et al., 2018) in aquatic animals via metabolomics approaches.
The present study compares the metabolomics responses of pearl oysters P. f. martensii fed a formulated diet indoors with those of oysters cultured with natural diet outdoors by using a GC–TOF/MS-based metabolomics approach. The results can help enhance our understanding of the different mechanisms of P. f. martensii fed different diets and assist in the development of optimized nutritional requirements and feeding regimes.
The experimental diet was formulated according to the recommendations of previous research (Yang et al., 2017b, 2018); this diet had a typical proximate composition of 35% crude protein and 10% crude lipid and was stored at −20°C until use. Lipids were obtained from fish oils, while proteins were obtained from yeast powder and fish meal. The formulation and approximate composition of this diet were described by Yang et al. (2018). Pearl oysters [44.79 ± 1.25 mm in mean shell length (SL)] were assigned to the experimental group (EG) or control group (CG) randomly, and three replicates were prepared for both groups. Each replicate had 210 animals. The animals in EG were fed the formulated diet indoors, and the volume of water was 1,000 L. Diet doses for EG were specified according to a previous work (Wang et al., 2016), and the pearl oysters were fed every 6 h. Water was replaced daily at a volume of 300 L. CG was cultured with a natural diet outdoors. The experimental period lasted 45 days, and the following parameters were maintained: dissolved oxygen in water at 5.00 mg/L, water temperature at 20.5–22.5°C, and salinity at 30%. P. f. martensii is a lower invertebrate, and therefore, the study was not subject to ethical approval.
At the beginning and end of the experiment, the total number and growth performance of pearl oysters in each replicate were determined. SL, shell height (SH), and shell width (SW) were measured with a digital caliper (0.02 mm accuracy). Total weight (TW) was obtained with an electronic balance (0.01 g accuracy), and survival rates and absolute growth rates (AGRs) were calculated in accordance with the methods described by Yang et al. (2017b).
At the end of the experiment, hepatopancreatic tissues from each animal were dissected, immediately kept in liquid nitrogen, and then stored at −80°C until analysis.
Eight hepatopancreatic tissues were collected from each replicate for biochemical measurements. Tissues were homogenized, and homogenates were centrifuged (10,000 × g for 20 min at 4°C) using a high-speed refrigerated centrifuge. The supernatant was transferred to new 2.0 mL tubes, and amylase activity was determined using commercial kits (Nanjing Jiancheng Bioengineering Research Institute, Nanjing, China) according to the manufacturer's instructions. Hexokinase (HK) and glucose-6-phosphate isomerase (G6PI) concentrations were also determined using commercial kits (Beijing Dongge Weiye Technology Co., Ltd., Beijing, China) according to the manufacturer's instructions. All assays were conducted within 24 h after extraction.
Each replicate included 8 samples, and 24 samples were collected from each group for GC–MS analysis. Frozen hepatopancreas samples of approximately 100 mg were obtained from four individuals, transferred into 2 mL microcentrifuge tubes, and mixed with 0.5 mL of methanol extraction liquid (Vmethanol:Vchloroform = 3:1) and 20 μL of L-2-chlorophenylalanine (1 mg/mL stock in dH2O) as an internal standard. The samples were vortexed for 30 s, homogenized in a ball mill for 4 min at 45 Hz, subjected to ultrasound for 5 min, incubated in ice water, and centrifuged for 15 min at 12,000 rpm and 4 °C. The supernatant (0.45 mL) was transferred into fresh 2 mL GC–MS glass vials, dried in a vacuum concentrator without heating, added with 80 μL of methoxylamine hydrochloride (20 mg/mL in pyridine), and incubated for 30 min at 80°C. Approximately 100 μL of bis-(trimethylsilyl)-trifluoroacetamide reagent (1% trimethylchlorosilane, v/v) was added to the samples, which were then incubated for 2 h at 70°C.
GC–TOF/MS analysis was performed using an Agilent 7890 gas chromatograph system coupled to a Pegasus HT TOF/MS instrument. The system was equipped with a DB-5MS capillary column coated with 5% diphenyl cross-linked with 95% dimethylpolysiloxane (30 m × 250 μm inner diameter, 0.25 μm film thickness; J&W Scientific, Folsom, CA, USA). A 1 μL aliquot of the analyte was injected in split-less mode, and helium was used as the carrier gas. The front inlet purge flow was 3 mL min−1, and the gas flow rate through the column was 1 mL min−1. The initial temperature was maintained at 50°C for 1 min, raised to 310°C at a rate of 10°C min−1, and then maintained at 310°C for 8 min. The injection, transfer line, and ion source temperatures were 280, 270, and 220°C, respectively, and the energy was set to −70 eV in electron impact mode. Mass spectrometry data were acquired in full-scan mode over the m/z range of 50–500 at a rate of 20 spectra per second after a solvent delay of 6 min.
Chroma TOF 4.3X software (LECO Corporation) and the LECO-Fiehn Rtx5 database were used for raw peak exaction, data baseline filtering and calibration, peak alignment, deconvolution analysis, peak identification, and peak area integration (Kind et al., 2009). The retention index (RI) was utilized to identify peaks, and an RI tolerance of 5,000 was set. The three-dimensional data obtained, including the peak number, sample name, and normalized peak area, were inputted into SIMCA14.1 (V14.1, MKS Data Analytics Solutions, Umea, Sweden) for principal component analysis (PCA) and orthogonal projections to latent structure–discriminate analysis (OPLS–DA). PCA showed the distribution of the original data. Supervised OPLS–DA was applied to obtain high-level group separation and enhance our understanding of the variables responsible for classification. The OPLS–DA model was employed with the first principal component of variable importance in the projection (VIP) values (VIP > 1) combined with Student's t-test (P < 0.05) to determine significantly different metabolites (SDMs) between the two groups. The fold change (FC) of each metabolite was calculated by comparing the mean values of the peak areas obtained from EG and CG. Commercial databases, including KEGG (http://www.genome.jp/kegg/), were utilized to search for the pathways of metabolites. MetaboAnalyst, a free Web-based tool that uses high-quality KEGG metabolic pathways as the backend knowledge base, was used for pathway analysis (http://www.metaboanalyst.ca).
The results of the growth and biochemical data were expressed as mean ± SEM, and significant differences (P < 0.05) among each variable were detected using t-test. All analyses were conducted using IBM SPSS Statistics 19 (IBM, USA).
At the end of the experiment, the survival rates of pearl oysters in both groups ranged from 94.31 to 99.31%. The survival rate of CG was significantly lower than that of EG (P < 0.05, Figure 1), and the growth performance of the latter differed from that of the former (Table 1). Although the AGRs of the SL, SW, and SH of CG were significantly higher than those of EG (P < 0.05), the AGR of TW between EG and CG was not significantly different (P > 0.05). Pearl oysters in EG showed significantly higher amylase activity than those in CG (P < 0.05, Figure 1). By contrast, HK and G6PI concentrations in the hepatopancreas of the former were significantly lower than those of the latter (P < 0.05 Figure 1).
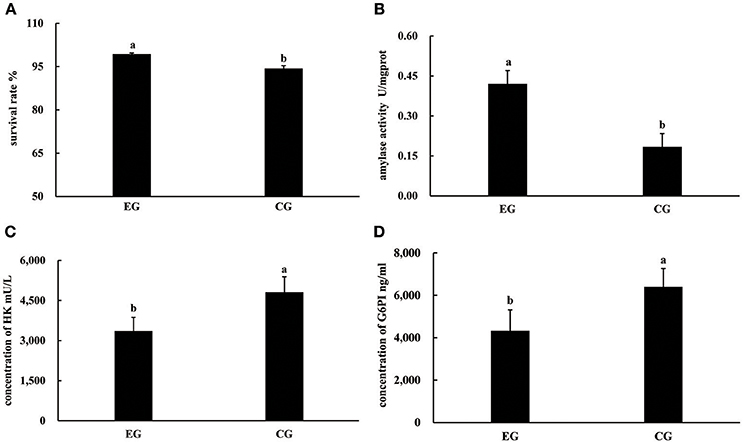
Figure 1. Survival rates, activities of amylase, concentrations of HK and G6PI in the hepatopancreas of P. f. martensii fed formulated diet indoors (EG) and cultured with a natural diet outdoors (CG). Means with the same letters are not significantly different (P > 0.05). (A) survival rates; (B) activities of amylase; (C) concentrations of HK; (D) concentrations of G6PI.
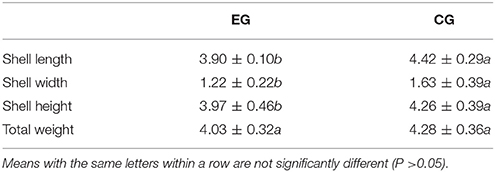
Table 1. Growth performance of pearl oyster (P. f. martensii) fed a formulated diet indoors (EG) and cultured with natural diet outdoors (CG).
Typical GC-TOF/MS TICs of P. f. martensii hepatopancreas samples from the two groups are shown in Figure 2. The standard deviation of the internal standard (L-2-chlorophenylalanine) retention time was 0.00255. The shape and number of peaks differed between EG and CG, and a total of 1,059 valid peaks were identified in the hepatopancreas. No drift was observed in any of the peaks that displayed a stable retention time. Thus, the TICs obtained by GC–TOF/MS could directly reflect differences in the metabolite profiles of EG and CG.
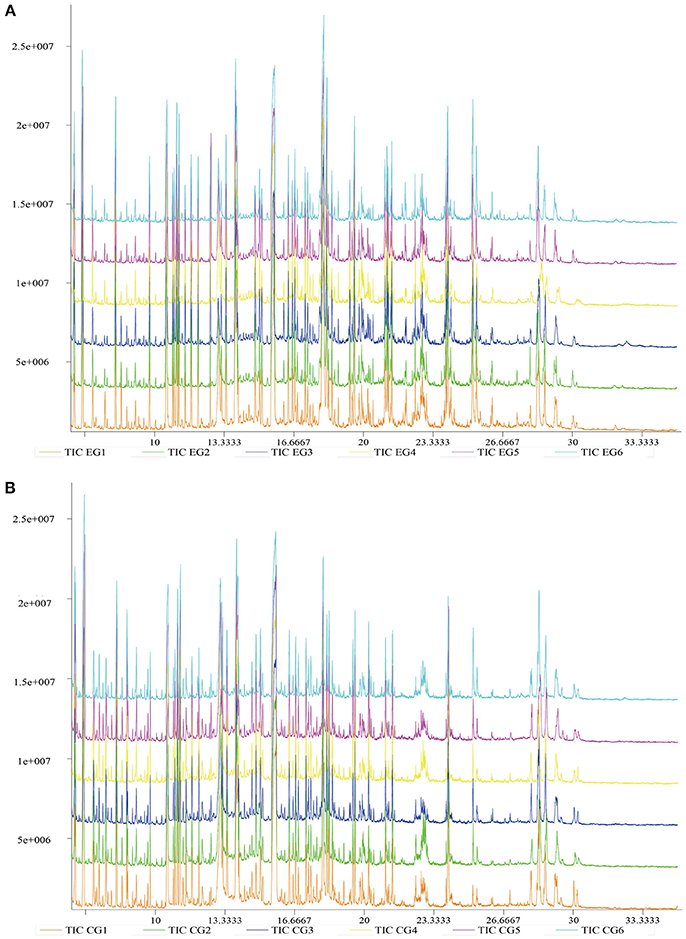
Figure 2. Typical GC–TOF/MS TICs of P. f. martensii hepatopancreas samples of EG and CG. The ordinate shows the relative mass abundance, and the abscissa shows the retention time. (A) Typical GC-TOF/MS TICs of EG; (B) Typical GC-TOF/MS TICs of CG.
Gross changes in metabolic physiology are easily detectable by using the PCA of the entire set of measured analytes. The GC–TOF/MS metabolic profiles of the hepatopancreas between EG and CG showed markedly separated clusters in each score scatter plot of the PCA model (Figure 3A). Compared with that of CG, the R2X value of the PCA model representing the explained variance in the hepatopancreas of EG was 0.516. All of the samples in the score plots were within the 95% Hotelling's T-squared ellipse, thereby indicating no outlier present among the analyzed samples.
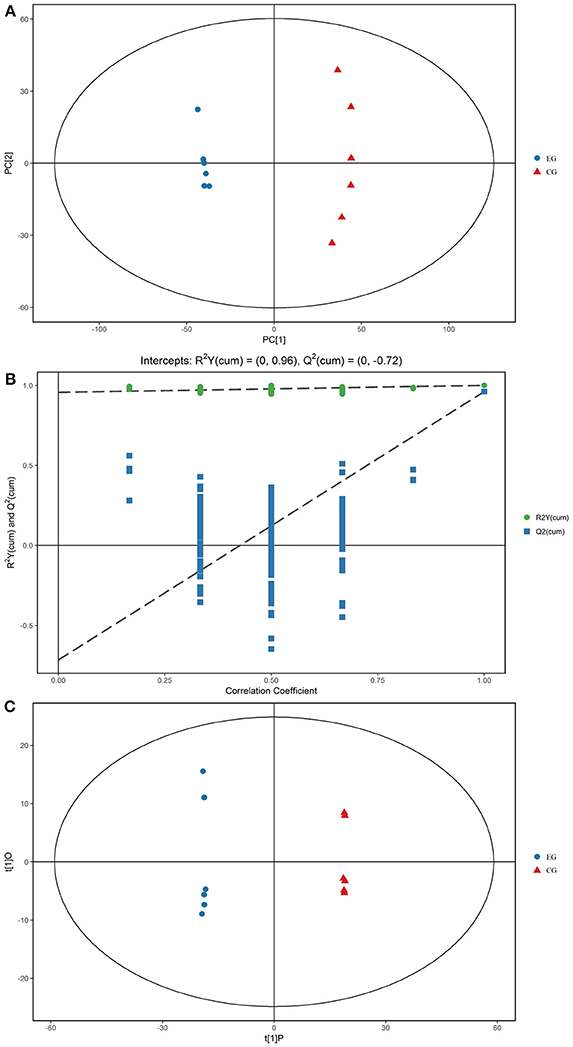
Figure 3. PCA score plots, OPLS-DA corresponding validation plots, and OPLS-DA score plots derived from the GC–TOF/MS metabolite profiles of the hepatopancreas of P. f. martensii. (A) PCA score plots; (B) OPLS-DA corresponding validation plots; (C) OPLS-DA score plots.
OPLS-DA was conducted to enhance our understanding of different metabolic patterns. The parameters used to assess the quality of the OPLS-DA model in the hepatopancreas of EG could be represented by validation plots (Figure 3B). The parameters considered for classification from the software were R2X = 0.455, R2Y = 1, and Q2 = 0.961, all of which are stable and effective for fitness and prediction. The R2 and Q2 intercept values determined after 200 permutations were 0.96 and−0.72, respectively. The low values of the Q2 intercept indicate that the robustness of the models presents low risk of overfitting and reliability. Figure 3C displays the score scatter plots of the OPLS-DA model comparing EG and CG. All of the samples in the score plots were within the 95% Hotelling's T-squared ellipse, and clear separation and discrimination were found between the pair-wise groups. These findings indicate that the OPLS-DA model could be utilized to identify differences between the pair-wise groups.
A total of 1,015 peaks remained after filtering and denoising. The LECO/Fiehn Rtx5 Metabolomics Library suggested that most of the peaks detected were endogenous metabolites, although some may be by-product derivatives. A total of 562 metabolites were quantified, including 206 analytes (similarity value of > 0), and a total of 125 metabolites were identified by mass spectrum matching, with a spectral similarity value of > 700 (Supplemental Table 1). FC values were utilized to indicate specific variable quantities between EG and CG. Metabolite distribution could be visually divided into upregulated and downregulated metabolites. Among the 125 metabolites detected, 75 were downregulated in EG compared with CG (Supplemental Table 1). On the other hand, among 562 metabolites, 150 SDMs (VIP > 1 and P < 0.05) were determined in the hepatopancreas between EG and CG (Figure 4 and Supplemental Table 2). Among these 150 SDMs, 48 yielded a similarity value of > 700. These SDMs include 15 metabolites belonging to amino acids, peptides, and analogs, such as sarcosine, valine, alanine, and glutamic acid; 7 carbohydrate metabolites, including maltose, glucose, and mannose; 10 organic acids and derivatives, such as pyruvic acid and succinic acid; 11 lipid metabolites; and 5 other metabolites (Table 2). Among the 150 SDMs in the hepatopancreas, 54 yielded higher concentrations in EG than in CG (Figure 4 and Supplemental Table 2). By contrast, 96 metabolites in EG were significantly downregulated compared with those in CG.
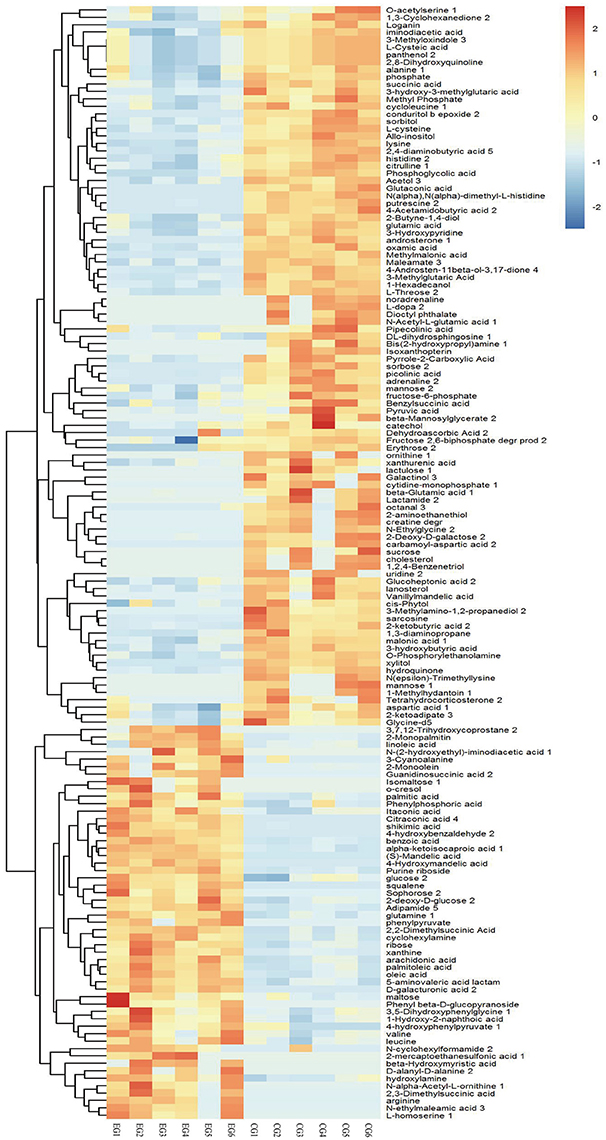
Figure 4. Hierarchical clustering analysis for SDMs. The relative metabolite level is depicted according to the color scale. Red indicates upregulation, while blue indicates downregulation.
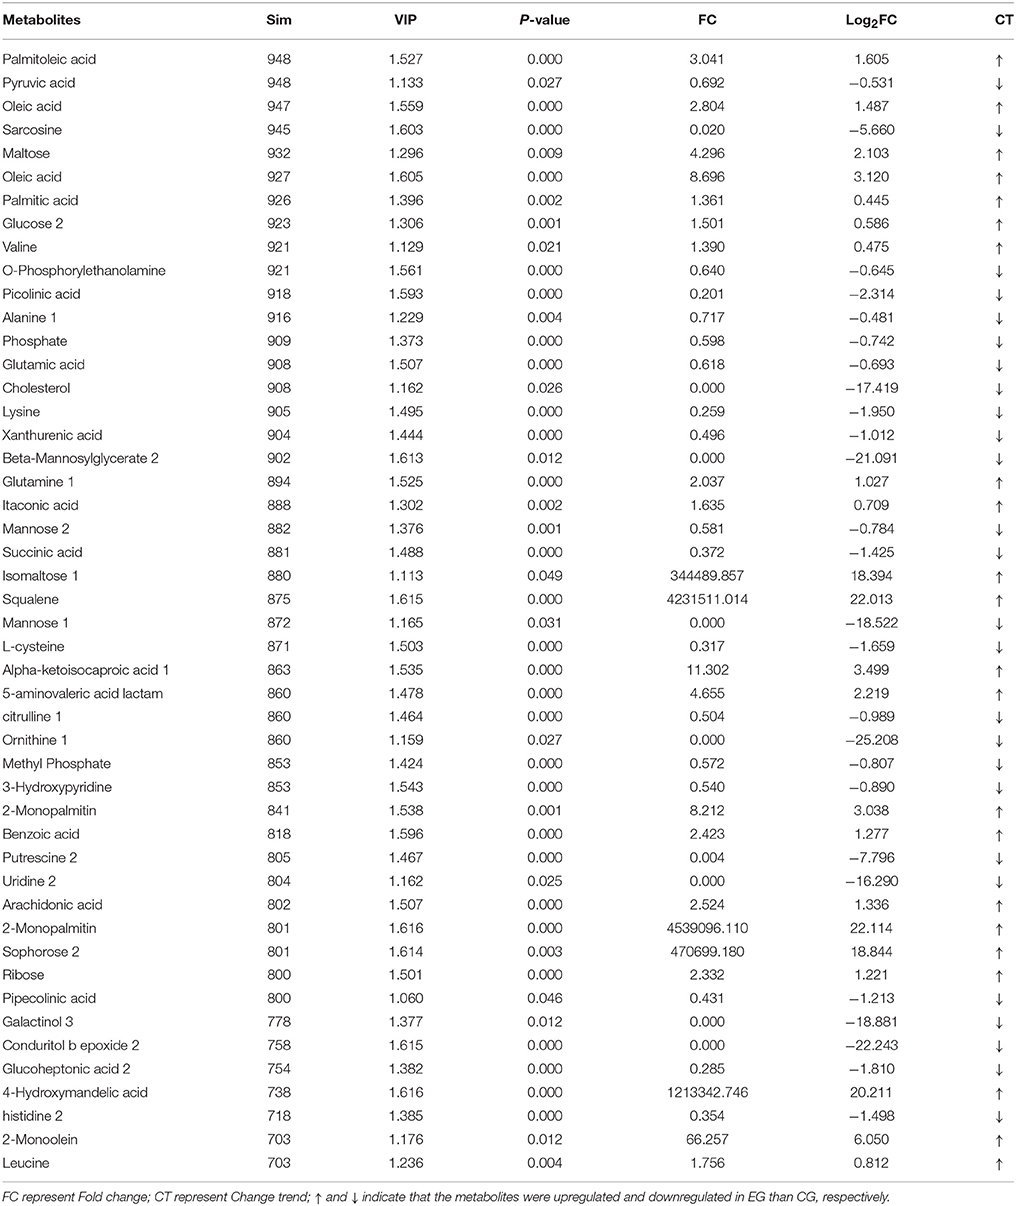
Table 2. Identification of SDMs with similarity (Sim) > 700 in hepatopancreas between EG and CG groups.
KEGG pathway analysis of SDMs was conducted by using MetaboAnalyst 3.0. Thirty-four pathways were found when the SDMs between EG and CG were imported into KEGG (Supplemental Table 3). However, only five of these pathways yielded an impact value of > 0.1, which is the relevance cut-off value, after the identified pathways were subjected to enrichment and pathway topology analyses (Supplemental Table 3). The impact values of sulfur metabolism, phenylalanine metabolism, pyruvate metabolism, cysteine and methionine metabolism, and starch and sucrose metabolism were 0.333, 0.308, 0.177, 0.161, and 0.161, respectively. Cysteine and methionine metabolism, sulfur metabolism, and starch and sucrose metabolism were characterized as relevant pathways based on P and impact values (Figure 5). In Table 3, the pyruvic acid, L-cysteine, L-cysteate, and O-acetyl-L-serine contents of EG were lower than those of CG, whereas the L-homoserine content was upregulated in cysteine and methionine metabolism. Similarly, the succinate, L-cysteine, and O-acetyl-L-serine contents of EG were lower than those of CG, whereas the L-homoserine content was upregulated in sulfur metabolism. The pyruvic acid, D-fructose-6-phosphate, and sucrose contents of EG were lower than those of CG, whereas the content of D-glucose, maltose, and isomaltose were upregulated in starch and sucrose metabolism.
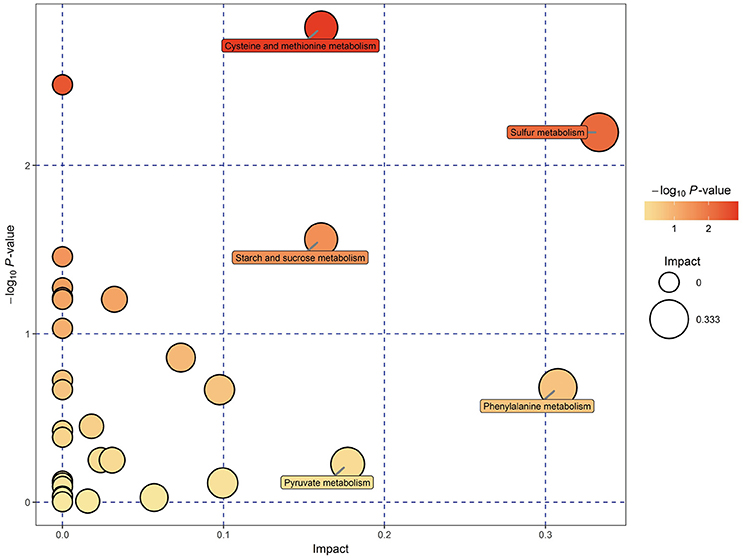
Figure 5. Metabolomic view map of significant metabolic pathways characterized in the hepatopancreas of P. f. martensii in EG and CG. This figure illustrates significantly changed pathways based on enrichment and topology analysis. The x-axis represents pathway enrichment, and the y-axis represents pathway impact. Large sizes and dark colors represent great pathway enrichment and high pathway impact values, respectively.
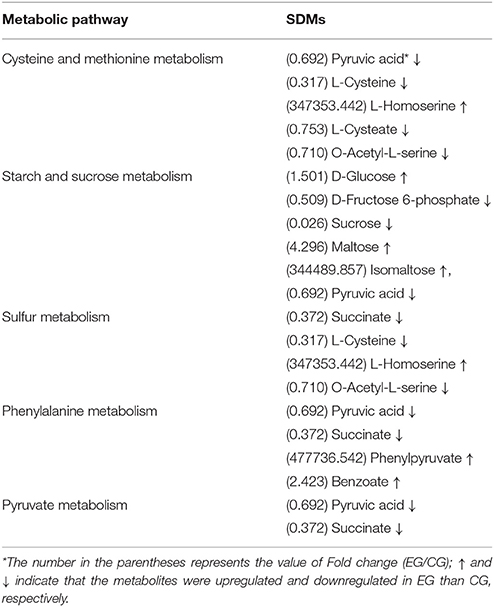
Table 3. Metabolic pathways identified on the SDMs from the hepatopancreas between EG and CG groups.
Like many other bivalves, the pearl oyster P. f. martensii filters water-suspended particles, such as bacteria, organic debris, microalgae, and microzooplankton (Wang et al., 2016). However, microalgal culturing is labor intensive and difficult to control in large-scale production. Therefore, this process hardly satisfies food requirements for industrial farming development. In previous studies, formulated diets were shown to partially or completely replace microalgae in bivalves (Nevejan et al., 2009; Gui et al., 2016; Wang et al., 2016; Yang et al., 2017a,b). Nevertheless, commercially and biologically reliable artificial diets have yet to be prepared to substitute live microalgal feed for pearl oysters.
Yang et al. (2018) proved that yeast powder is a better protein source of formulated diet for pearl oysters than corn gluten via GC–TOF/MS-based metabolomics. Thus, to determine whether diets formulated with yeast powder as a major protein source achieves the ideal effects for breeding aquatics, comparison of pearl oysters fed formulated or natural diets in general is necessary. In the present study, the effects of a formulated diet on pearl oysters grown indoors were evaluated and compared with those of pearl oysters cultured with natural diet outdoors. At the end of the trials, the survival rate of EG was significantly higher than that of CG, which indicates that the formulated diet did not negatively affect P. f. martensii. The AGRs of EG for SL, SW, and SH of EG were lower than those of CG, but the two groups exhibited similar gains in TW. These results suggest that the formulated diet is an excellent substitute for natural diet.
Exploration of the mechanism behind the phenomenon is necessary to develop optimized nutritional requirements and feeding regimes and achieve optimum growth rates in aquaculture. Aquatic nutritional metabolomics research is an emerging field. To determine differences between the formulated and natural diets, we performed GC–TOF/MS-based metabolomics analysis, compared the metabolites, and detected changes in the hepatopancreas of pearl oysters between the two groups. Metabolomics is uniquely applicable to the assessment of metabolic responses to nutritional deficiencies or excesses. GC-TOF/MS-based metabolomics can detect low-molecular-weight metabolites and their intermediates and provide additional information on metabolic processes (Sun et al., 2015). In the present study, while 1,059 valid peaks were detected, the number of metabolites detected by GC–MS in plasma has been shown to vary among animal taxa in other studies (Kodama et al., 2014; Zaitsu et al., 2014). For example, 53 metabolites from the serum of tiger puffer fish (Takifugu rubripes) were obtained (Kodama et al., 2014), and 218 metabolites were found in the serum of cow (Sun et al., 2015). Although the metabolites in blood samples are secreted, excreted, or discarded from different animal tissues in response to physiological requirements or stress (Psychogios et al., 2011), the number of metabolites detected by GC–MS in serum is usually less than that in animal tissues. Ma et al. (2017) identified 222 peaks from the serum of Eriocheir sinensis but found that only 69 metabolites shared a similarity value of >700. In the present study, 562 peaks were detected in the hepatopancreas of the oysters, but only 125 of these peaks achieved a similarity value of >700. Among the 150 SDMs found between EG and CG, only 48 components showed a similarity value of >700. The number of metabolites with a similarity value of >700 in the present study was more than that (72 metabolites) obtained in the ovarian tissue of Coilia nasus (Xu et al., 2016).
Metabolomics is a useful approach to obtain a whole-organism overview of affected pathways. The metabolic pathways identified from the SDMs represent the typical characteristics of dietary or medical intervention on organisms (Sun et al., 2015; Ma et al., 2017). The integrated key metabolic pathways are manually linked together based on the results of common key metabolic pathways and significantly changed pathways from different metabolites in the hepatopancreas. Three key metabolic pathways, including cysteine and methionine metabolism, sulfur metabolism, and starch and sucrose metabolism, were identified (Figure 6); these pathways are involved in amino acid metabolism, energy metabolism, and carbohydrate metabolism, respectively.
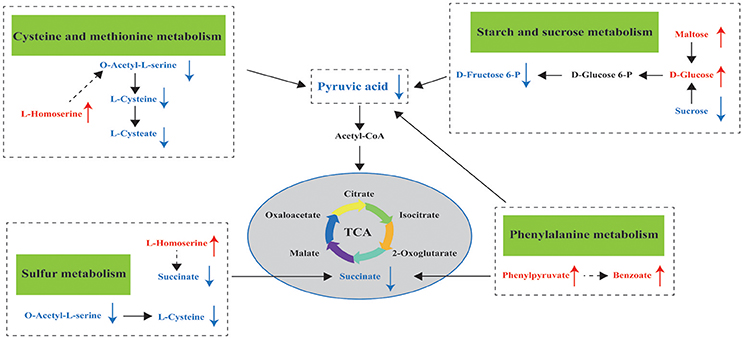
Figure 6. Hypothesized scheme of the metabolomics responses of pearl oysters P. f. martensii fed a formulated diet indoors or cultured with natural diet outdoors.
While L-homoserine levels in EG were significantly higher than those in CG, O-acetyl-L-serine and L-cysteine levels were downregulated in this group compared with those in CG. These observations suggest the effects of the formulated diet on cysteine and methionine metabolism and sulfur metabolism. L-homoserine is a nonessential amino acid that serves as the precursor of threonine and methionine; while it acts as an important functional amino acid, this acid does not participate in protein synthesis (Li et al., 2016). Low L-homoserine levels can improve growth traits and show similar threonine bioactivity in young chicks (Bryant et al., 2009). Zeng et al. (2017) reported that exogenous administration of glucose to fish upregulates L-homoserine content and greatly enhances their survival after infection. However, Bryant et al. (2009) confirmed that high levels of supplemental L-homoserine are noxious for chicks. Hao et al. (2018) surmised that high L-homoserine levels may affect glycine, serine, and threonine metabolism, as well as cysteine and methionine metabolism, thereby resulting in different growth performances in pearl oyster (P. maxima). Therefore, we propose that high L-homoserine levels in the hepatopancreas may influence amino acid metabolism, including cysteine and methionine metabolism and sulfur metabolism, and result in poorer growth performance of pearl oysters in EG compared with those in CG. However, the mechanisms underlying these modes of action have yet to be established and further investigated.
During starch and sucrose metabolism, the maltose, isomaltose, and D-glucose levels of EG were higher than those of CG. This finding proves that pearl oysters can break down α-starch in the formulated diet to produce glucose and is consistent with the higher amylase activity found in EG compared with that in CG. However, the glucose-6-phosphate, D-fructose-6-phosphate, and pyruvic acid levels in EG were downregulated (Supplemental Table 1) compared with those in CG. A decrease in levels of pyruvic acid, which is a product of glycolysis, implies a decline in glucose utilization (Rocha et al., 2011). The first step of intracellular glucose utilization is catalyzed by HK (Hall et al., 2009), and EG exhibits lower HK and G6PI concentrations compared with CG; such downregulation may result in the downregulation of D-fructose-6-phosphate and pyruvic acid. Therefore, the carbohydrate metabolism of EG is lower than that of CG, which could partly explain the poorer growth performance of pearl oysters in the former compared with those in the latter. The carbohydrate content of a diet can affect HK activity in aquatic animals (Enes et al., 2008; Moreira et al., 2008). For example, when dietary carbohydrate levels were maintained near the maximum tolerable level for metabolic utilization of carbohydrates by European sea bass juveniles, their liver HK did not increase vitality (Moreira et al., 2008). Thus, higher dietary carbohydrate levels may lead to lower HK and G6PI concentrations. This premise requires further investigations, and the effects of different dietary carbohydrate levels on pearl oyster should be studied.
β-oxidation is the catabolic process by which fatty acid molecules are broken down for energy production (Houten and Wanders, 2010). In the present study, some fatty acids such as 2-Monopalmitin (log2FC = 22.114), 2-Monoolein (log2FC = 6.050), oleic acid (log2FC = 8.696), and arachidonic acid (log2FC = 1.336) had very high FC values in EG2 (Table 2), attesting to the high fatty acid catabolic activity in EG2. Considering this, it can be hypothesized that the pearl oysters in EG2 required more energy via catabolism of fatty acids, which caused the poorer growth performance of pearl oysters in EG2 than those in CG. A similar phenomenon was also observed in farmed Haliotis midae (Venter et al., 2018). Squalene is the intermediate of cholesterol metabolism, and cholesterol is essential for membrane structure and hormone and steroid biosynthesis (Kalogeropoulos et al., 2010), such as cholecalciferol (VD3) biosynthesis, which can promote Ca2+ transport, absorption, and utilization, thereby regulating the biomineralization of pearl oyster shell. However, pearl oysters in EG achieved significantly higher squalene level (log2FC = 22.013) and significantly lower cholesterol level (log2FC = −17.419) than those in CG. This metabolic disorder could also cause a poor growth performance of pearl oysters in EG.
Comparison of the growth performance and metabolic profiles of pearl oysters in EG and CG shows that the formulated diet could be an excellent substitute for natural diet. However, the formulated diet contains insufficient nutrients that may affect cysteine and methionine metabolism, sulfur metabolism, and starch and sucrose metabolism. Thus, modification of the dietary levels of these compounds in the formulated diet are required to achieve better growth performance, such as dietary carbohydrate level. Moreover, other strategies, such as formulating more effective diets and setting better feeding regimes, should be developed to enhance the utilization of formulated diets and improve pearl production and quality.
YD, CY, RS, and XD designed the research. CY, RH, and YD conducted the research. CY and RH analyzed data. CY, RH, QW, XD, and YD contributed to the final writing of the paper. CY and RH wrote the manuscript. All authors have read and approved the final manuscript.
The authors declare that the research was conducted in the absence of any commercial or financial relationships that could be construed as a potential conflict of interest.
This work was supported by the Department of Science and Technology of Guangdong Province (Grant number: 2014A020208122), the Graduate Education Innovation Program of Guangdong Ocean University (Grant number: 201720), Innovation Team Project (grant number: 2017KCXTD016) from the Department of Education of Guangdong Province, and the Guangdong Marine and Fishery Bureau (Grant numbers: Z2014009 and B201601-Z10). We thank Zhe Zheng, Ronglian Huang and Yu Jiao for helpful discussions. Our data analysis was assisted by Biotree Biotech Co., Ltd. (Shanghai, China).
The Supplementary Material for this article can be found online at: https://www.frontiersin.org/articles/10.3389/fphys.2018.00944/full#supplementary-material
Abro, R., Moazzami, A. A., Lindberg, J. E., and Lundh, T. (2014). Metabolic insights in Arctic charr (Salvelinus alpinus) fed with zygomycetes and fish meal diets as assessed in liver using nuclear magnetic resonance (NMR) spectroscopy. Int. Aquat. Res 6, 1–11. doi: 10.1007/s40071-014-0063-9
Andersen, S. M., Assaad, H. I., Lin, G., Wang, J., Wu, G., and Aksnes, A. (2015). Metabolomic analysis of plasma and liver from surplus arginine fed Atlantic salmon. Front. Biosci. (Elite. Ed). 7, 67–78. doi: 10.2741/718
Andersen, S. M., Taylor, R., Holen, E., Aksnes, A., and Espe, M. (2014). Arginine supplementation and exposure time affects polyamine and glucose metabolism in primary liver cells isolated from Atlantic salmon. Amino Acids 46, 1225–1233. doi: 10.1007/s00726-014-1684-4
Baumgarner, B. L., and Cooper, B. R. (2012). Evaluation of a tandem gas chromatography/time-of-flight mass spectrometry metabolomics platform as a single method to investigate the effect of starvation on whole-animal metabolism in rainbow trout (Oncorhynchus mykiss). J. Exp. Biol. 215, 1627–1632. doi: 10.1242/jeb.059873
Bryant, K. I., Dilger, R. N., Parsons, C. M., and Baker, D. H. (2009). Dietary L-homoserine spares threonine in chicks. J. Nutr. 139, 1298–1302. doi: 10.3945/jn.109.104372
Cappello, T., Giannetto, A., Parrino, V., Maisano, M., Oliva, S., Marcoet, G. D., et al. (2018). Baseline levels of metabolites in different tissues of mussel Mytilus galloprovincialis (Bivalvia: Mytilidae). Comp. Biochem. Physiol. D Genomics Proteomics 26, 32–39. doi: 10.1016/j.cbd.2018.03.005
Cappello, T., Maisano, M., Mauceri, A., and Fasulo, S. (2017). 1H NMR-based metabolomics investigation on the effects of petrochemical contamination in posterior adductor muscles of caged mussel Mytilus galloprovincialis. Ecotoxicol. Environ. Saf. 142, 417–422. doi: 10.1016/j.ecoenv.2017.04.040
Cheng, K., Wagner, L., Moazzami, A. A., Gómez-Requeni, P., Schiller Vestergren, A., Brännäs, E., et al. (2016). Decontaminated fishmeal and fish oil from the Baltic Sea are promising feed sources for Arctic char (Salvelinus alpinus L.)-studies of flesh lipid quality and metabolic profile. Eur. J. Lipid Sci. Technol. 118, 862–873. doi: 10.1002/ejlt.201500247
Cipriano, R. C., Smith, M. L., Vermeersch, K. A., Dove, A. D., and Styczynski, M. P. (2015). Differential metabolite levels in response to spawning-induced inappetence in Atlantic salmon Salmo salar. Comp. Biochem. Physiol. D Genomics Proteomics 13, 52–59. doi: 10.1016/j.cbd.2015.01.001
Collette, T. W., Skelton, D. M., Davis, J. M., Cavallin, J. E., Jensen, K. M., Kahl, M. D., et al. (2016). Metabolite profiles of repeatedly sampled urine from male fathead minnows (Pimephales promelas) contain unique lipid signatures following exposure to anti-androgens. Comp. Biochem. Physiol. D Genomics Proteomics 19, 190–198. doi: 10.1016/j.cbd.2016.01.001
Deng, C. M., Liang, F. L., Fu, S., and Deng, Y. W. (2010). Research of preoperative treatment of Pinctada martensii and pearl culture. Trans. Oceanol. Limnol. 4, 124–128. doi: 10.13984/j.cnki.cn37-1141.2010.04.019
Deng, Y. W., Du, X. D., and Wang, Q. H. (2010). Selection for fast growth in the Chinese pearl oyster, Pinctada martensii: response of the first generation line. J. World Aquac. Soc. 40, 843–847. doi: 10.1111/j.1749-7345.2009.00307.x
Deng, Y. W., Fu, S., Du, X. D., and Wang, Q. H. (2009). Realized heritability and genetic gain estimates of larval shell length in the Chinese pearl oyster Pinctada martensii at three different salinities. N. Am. J. Aquac. 71, 302–306. doi: 10.1577/A08-024.1
Enes, P., Panserat, S., Kaushik, S., and Oliva-Teles, A. (2008), Growth performance metabolic utilization of diets with native waxy maize starch by gilthead sea bream (Sparus aurata) juveniles. Aquaculture 274, 101–108. doi: 10.1016/j.aquaculture.2007.11.009
Gui, Y., Kaspar, H., Zamora, L., Dunphy, B., and Jeffs, A. (2016). Capture efficiency of artificial food particles of post-settlement juveniles of the Greenshell™ mussel, Perna canaliculus. Aquaculture 464, 1–7. doi: 10.1016/j.aquaculture.2016.06.011
Hall, J. R., Short, C. E., Petersen, L. H., Stacey, J., Gamperl, A. K., and Driedzic, W. R. (2009). Expression levels of genes associated with oxygen utilization, glucose transport and glucose phosphorylation in hypoxia exposed Atlantic cod (Gadus morhua). Comp. Biochem. Physiol. D Genomics Proteomics s 4, 128–138. doi: 10.1016/j.cbd.2008.12.007
Hao, R. J., Wang, Z. M., Yang, C. Y., Deng, Y. W., Zheng, Z., Qingheng Wang, Q. H., et al. (2018). Metabolomic responses of juvenile pearl oyster Pinctada maxima to different growth performances. Aquaculture 491, 258–265. doi: 10.1016/j.aquaculture.2018.03.050
Houten, S. M., and Wanders, R. J. A. (2010). A general introduction to the biochemistry of mitochondrial fatty acid β-oxidation. J. Inherit. Metab. Dis. 33, 469–477. doi: 10.1007/s10545-010-9061-2
Jin, Y., Tian, L. X., Xie, S. W., Guo, D. Q., Yang, H. J., Liang, G. Y., et al. (2015). Interactions between dietary protein levels, growth performance, feed utilization, gene expression and metabolic products in juvenile grass carp (Ctenopharyngodon idella). Aquaculture 437, 75–83. doi: 10.1016/j.aquaculture.2014.11.031
Kalogeropoulos, N., Chiou, A., Gavala, E., Christea, M., and Andrikopoulos, N. K. (2010). Nutritional evaluation and bioactive microconstituents (carotenoids, tocopherols, sterols and squalene) of raw and roasted chicken fed on dha-rich microalgae. Food Res. Int. 43, 2006–2013. doi: 10.1016/j.foodres.2010.05.018
Kind, T., Wohlgemuth, G., Lee, D. Y., Lu, Y., Palazoglu, M., Shahbaz, S., et al. (2009). Fiehnlib-mass spectral and retention index libraries for metabolomics based on quadrupole and time-of-flight gas chromatography/mass spectrometry. Anal. Chem. 81, 10038–10048. doi: 10.1021/ac9019522
Kodama, H., Otani, K., Iwasaki, T., Takenaka, S., Horitani, Y., and Togase, H. (2014). Metabolomic investigation of pathogenesis of myxosporean emaciation disease of tiger puffer fish Takifugu rubripes. J. Fish Dis. 37, 619–627. doi: 10.1111/jfd.12154
Kullgren, A., Samuelsson, L. M., Larsson, D. G., Björnsson, B. T., and Bergman, E. J. (2010). A metabolomics approach to elucidate effects of food deprivation in juvenile rainbow trout (Oncorhynchus mykiss). Am. J. Physiol. Regul. Integr. Comp. Physiol. 299, 1440–1448. doi: 10.1152/ajpregu.00281.2010
Li, H., Wang, B. S., Zhu, L. H., Cheng, S., Li, Y. R., Zhang, L., et al. (2016). Metabolic engineering of Escherichia coli, W3110 for L-homoserine production. Process Biochem. 51, 1973–1983. doi: 10.1016/j.procbio.2016.09.024
Liu, S. L., Zhou, Y., Ru, X. S., Zhang, M. Z., Cao, X. B., and Yang, H. S. (2016). Differences in immune function and metabolites between aestivating and non-aestivating Apostichopus japonicus. Aquaculture 459, 36–42. doi: 10.1016/j.aquaculture.2016.03.029
Ma, Q. Q., Chen, Q., Shen, Z. H., Li, D. L., Han, T., Qin, J. G., et al. (2017). The metabolomics responses of Chinese mitten-hand crab (Eriocheir sinensis) to different dietary oils. Aquaculture 479, 188–199. doi: 10.1016/j.aquaculture.2017.05.032
Maherizo, G. F., Catherine, R., Yann, G., Julie, L., Sandrine, L., Joëlle, D., et al. (2017). Fungi isolated from Madagascar shrimps investigation of the Aspergillus niger metabolism by combined LC-MS and NMR metabolomics studies. Aquaculture 479, 750–758. doi: 10.1016/j.aquaculture.2017.07.015
Moreira, I. S., Peres, H., Couto, A., Enes, P., and Olivateles, A. (2008). Temperature and dietary carbohydrate level effects on performance and metabolic utilisation of diets in European sea bass (Dicentrarchus labrax) juveniles. Aquaculture 274, 153–160. doi: 10.1016/j.aquaculture.2007.11.016
Nevejan, N., Davis, J., Little, K., and Kiliona, A. (2009). Use of a formulated diet for mussel spat Mytilus galloprovincialis (Lamarck 1819) in a commercial hatchery. J. Shellfish Res. 26, 357–363. doi: 10.2983/0730-8000(2007)26[357:UOAFDF]2.0.CO;2
Psychogios, N., Hau, D. D., Peng, J., Guo, A. C., Mandal, R., Bouatra, S., et al. (2011). The human serum metabolome. PLoS ONE 6:e16957. doi: 10.1371/journal.pone.0016957
Qiu, Y., Lu, H., Zhu, J. T., Chen, X. F., Wang, A. M., and Wang, Y. (2014). Characterization of novel EST-SSR markers and their correlations with growth and nacreous secretion traits in the pearl oyster Pinctada martensii (Dunker). Aquaculture 420–421, S92–S97. doi: 10.1016/j.aquaculture.2013.09.040
Rocha, C. M., Carrola, J., Barros, A. S., Gil, A. M., Goodfellow, B. J., Carreira, I. M., et al. (2011). Metabolic signatures of lung cancer in biofluids: NMR-based metabonomics of blood plasma. J. Proteome Res. 10, 4314–4324. doi: 10.1021/pr200550p
Sheedy, J. R., Lachambre, S., Gardner, D. K., and Day, R. W. (2016). 1H-NMR metabolite profiling of abalone digestive gland in response to short-term starvation. Aquacult. International 24, 503–521. doi: 10.1007/s10499-015-9941-4
Sun, H. Z., Wang, D. M., Wang, B., Wang, J. K., Liu, H. Y., Guan, L. L., et al. (2015). Metabolomics of four biofluids from dairy cows: potential biomarkers for milk production and quality. J. Proteome Res. 14, 1287–1298. doi: 10.1021/pr501305g
Tuffnail, W., Mills, G. A., Cary, P., and Greenwood, R. (2009). An environmental, 1H NMR metabolomic study of the exposure of the marine mussel, Mytilus edulis, to atrazine, lindane, hypoxia and starvation. Metabolomics 5, 33–43. doi: 10.1007/s11306-008-0143-1
Venter, L., Vosloo, A., Du, T. L., Mienie, L. J., Rensburg, P. J. J. V., and Lindeque, J. Z. (2018). Characterising the metabolic differences related to growth variation in farmed Haliotis midae. Aquaculture 493, 144–152. doi: 10.1016/j.aquaculture.2018.04.052
Wagner, L., Trattner, S., Pickova, J., Gómez-Requeni, P., and Moazzami, A. A. (2014). 1H NMR-based metabolomics studies on the effect of sesamin in Atlantic salmon (Salmo salar). Food Chem. 147, 98–105. doi: 10.1016/j.foodchem.2013.09.128
Wang, Q. H., Yang, C. Y., Du, X. D., Liu, X. W., Sun, R. J., and Deng, Y. W. (2016). Growth performance and biochemical composition of juvenile pearl oyster Pinctada martensii fed on artificial diets. Aquacult. Int. 24, 995–1005. doi: 10.1007/s10499-015-9966-8
Wei, Y., Liang, M., Mai, K., Zheng, K., and Xu, H. (2017). 1H NMR-based metabolomics studies on the effect of size-fractionated fish protein hydrolysate, fish meal and plant protein in diet for juvenile turbot (Scophthalmus maximus, L.). Aquaculture Nutrition 23, 523–536. doi: 10.1111/anu.12420
Xu, G. C., Du, F. K., Li, Y., Nie, Z. J., and Xu, P. (2016). Integrated application of transcriptomics and metabolomics yields insights into population-asynchronous ovary development in Coilia nasus. Sci. Rep. 6:31835. doi: 10.1038/srep31835
Yang, C. Y., Hao, R. J., Deng, Y. W., Liao, Y. S., Wang, Q. H., Sun, R. J., et al. (2017b). Effects of protein sources on growth, immunity and antioxidant capacity of juvenile pearl oyster Pinctada fucata martensii. Fish Shellfish Immunol. 67, 411–418. doi: 10.1016/j.fsi.2017.06.037
Yang, C. Y., Hao, R. J., Du, X. D., Wang, Q. H., Deng, Y. W., Sun, R. J., et al. (2018). GC–TOF/MS-based metabolomics studies on the effect of protein sources in formulated diet for pearl oyster Pinctada fucata martensii. Aquaculture 486, 139–147. doi: 10.1016/j.aquaculture.2017.12.020
Yang, C. Y., Wang, Q. H., Hao, R. J., Liao, Y. S., Du, X. D., and Deng, Y. W. (2017a). Effects of replacing microalgae with an artificial diet on pearl production traits and mineralization-related gene expression in pearl oyster Pinctada fucata martensii. Aquac. Res. 48, 5331–5337. doi: 10.1111/are.13346
Ye, Y. F., Xia, M. J., Mu, C. K., Li, R. H., and Wang, C. L. (2016). Acute metabolic response of Portunus trituberculatus, to Vibrio alginolyticus, infection. Aquaculture 463, 201–208. doi: 10.1016/j.aquaculture.2016.05.041
Zaitsu, K., Miyawaki, I., Bando, K., Horie, H., Shima, N., Katagi, M., et al. (2014). Metabolic profiling of urine and blood plasma in rat models of drug addiction on the basis of morphine, methamphetamine, and cocaine-induced conditioned place preference. Anal. Bioanal. Chem. 406, 1339–1354. doi: 10.1007/s00216-013-7234-1
Keywords: metabolomics, formulated diet, nutritional requirements, GC–MS, Pinctada fucata martensii
Citation: Yang C, Hao R, Du X, Deng Y, Sun R and Wang Q (2018) Metabolomics Responses of Pearl Oysters (Pinctada fucata martensii) Fed a Formulated Diet Indoors and Cultured With Natural Diet Outdoors. Front. Physiol. 9:944. doi: 10.3389/fphys.2018.00944
Received: 26 March 2018; Accepted: 28 June 2018;
Published: 19 July 2018.
Edited by:
Xiaotong Wang, Ludong University, ChinaReviewed by:
Shengkang Li, Shantou University, ChinaCopyright © 2018 Yang, Hao, Du, Deng, Sun and Wang. This is an open-access article distributed under the terms of the Creative Commons Attribution License (CC BY). The use, distribution or reproduction in other forums is permitted, provided the original author(s) and the copyright owner(s) are credited and that the original publication in this journal is cited, in accordance with accepted academic practice. No use, distribution or reproduction is permitted which does not comply with these terms.
*Correspondence: Yuewen Deng, ZGVuZ3l3QGdkb3UuZWR1LmNu
Qingheng Wang, d2FuZ3FpbmdoZW5nX2hhaWRhQDE2My5jb20=
†These authors have contributed equally to this work.
Disclaimer: All claims expressed in this article are solely those of the authors and do not necessarily represent those of their affiliated organizations, or those of the publisher, the editors and the reviewers. Any product that may be evaluated in this article or claim that may be made by its manufacturer is not guaranteed or endorsed by the publisher.
Research integrity at Frontiers
Learn more about the work of our research integrity team to safeguard the quality of each article we publish.