
94% of researchers rate our articles as excellent or good
Learn more about the work of our research integrity team to safeguard the quality of each article we publish.
Find out more
ORIGINAL RESEARCH article
Front. Physiol., 05 June 2018
Sec. Membrane Physiology and Membrane Biophysics
Volume 9 - 2018 | https://doi.org/10.3389/fphys.2018.00689
This article is part of the Research TopicThe red cell life-cycle from erythropoiesis to clearanceView all 22 articles
 Emily S. Hartman1†
 Elena C. Brindley1,2†
 Julien Papoin1Steven L. Ciciotte3
 Yue Zhao3
 Luanne L. Peters3‡
 Lionel Blanc1,4*‡
RASA3 is a Ras GTPase activating protein that plays a critical role in blood formation. The autosomal recessive mouse model scat (severe combined anemia and thrombocytopenia) carries a missense mutation in Rasa3. Homozygotes present with a phenotype characteristic of bone marrow failure that is accompanied by alternating episodes of crisis and remission. The mechanism leading to impaired erythropoiesis and peripheral cell destruction as evidenced by membrane fragmentation in scat is unclear, although we previously reported that the mislocalization of RASA3 to the cytosol of reticulocytes and mature red cells plays a role in the disease. In this study, we further characterized the bone marrow failure in scat and found that RASA3 plays a central role in cell cycle progression and maintenance of reactive oxygen species (ROS) levels during terminal erythroid differentiation, without inducing apoptosis of the precursors. In scat mice undergoing crises, there is a consistent pattern of an increased proportion of cells in the G0/G1 phase at the basophilic and polychromatophilic stages of erythroid differentiation, suggesting that RASA3 is involved in the G1 checkpoint. However, this increase in G1 is transient, and either resolves or becomes indiscernible by the orthochromatic stage. In addition, while ROS levels are normal early in erythropoiesis, there is accumulation of superoxide levels at the reticulocyte stage (DHE increased 40% in scat; p = 0.02) even though mitochondria, a potential source for ROS, are eliminated normally. Surprisingly, apoptosis is significantly decreased in the scat bone marrow at the proerythroblastic (15.3%; p = 0.004), polychromatophilic (8.5%; p = 0.01), and orthochromatic (4.2%; p = 0.02) stages. Together, these data indicate that ROS accumulation at the reticulocyte stage, without apoptosis, contributes to the membrane fragmentation observed in scat. Finally, the cell cycle defect and increased levels of ROS suggest that scat is a model of bone marrow failure with characteristics of aplastic anemia.
Every day, a healthy individual’s bone marrow produces 200 billion erythrocytes in the process of erythropoiesis. Bone marrow failure syndromes (BMFS) are a diverse group of inherited or acquired disorders characterized by varying degrees of hematopoietic failure and a predisposition to hematologic malignancies (Shimamura and Alter, 2010). While targetable molecular markers associated with the various subclasses of BMFS have recently been identified, the full molecular pathogeneses of these diseases are likely a complex interaction between genetic changes at the hematopoietic stem cell level and alterations in the hematopoietic niche of the bone marrow itself, and these mechanisms have yet to be fully elucidated (Rankin et al., 2015). Aplastic anemia (AA) is one of the most commonly diagnosed BMFS, with over 2,500 new cases each year in North America and in Europe alone, and is characterized by a hypocellular bone marrow and ineffective hematopoiesis of the erythroid, megakaryocyte, and granulocyte/monocyte lineages (Guinan, 2011; Bodine and Berliner, 2014). At the molecular level, AA is characterized by increased levels of reactive oxygen species (ROS) and defective DNA repair mechanisms (Khincha and Savage, 2013; Richardson et al., 2015).
Like most BMFS, AA can either be acquired or inherited. Acquired AA appears to be an immune-mediated suppression of the bone marrow and is thus responsive, in most cases, to immunosuppressive therapy (Miano and Dufour, 2015). Inherited AA, however, has a complex variety of pathogeneses. Although many of the patients with BMFS have identifiable causes, 30–40% of cases still have unknown etiologies, including cases of inherited AA (Peters et al., 2013). Spontaneous and engineered models of bone marrow failure have allowed focused study of these uncharacterized molecular mechanisms. One such spontaneous model is the autosomal recessive scat (severe combined anemia and thrombocytopenia) mouse model; scat carries a missense mutation in the protein-coding Rasa3 gene (Blanc et al., 2012).
RASA3, a Ras-GTPase Activating Protein (GAP), has previously been found to play a key role in normal blood formation. This protein acts to negatively regulate the small GTPase Ras, and its localization to the membrane is required for normal function (Fukuda and Mikoshiba, 1996). The specific Rasa3 mutation in the scat mouse results in the mislocalization of RASA3 to the cytosol and thus loss of RASA3 function, which leads to increased levels of active GTP-bound Ras (Blanc et al., 2012). scat mice interestingly cycle between hematologic crisis and remission, regardless of the cytosolic localization of RASA3, suggesting that a secreted factor may mediate the crisis-remission transition. The first crisis begins in utero and lasts until ∼P9. Mice that survive the first crisis will progress to remission, during which there is a striking normalization of hematologic parameters and physical appearance. Some mice then enter a second crisis, during which there is over 90% mortality by 4 weeks of age, likely due to bone marrow failure and the resulting peripheral pancytopenia (Blanc et al., 2012). Overall, the mechanism of the cyclic phenotype in scat mouse is unknown and offers unique opportunities to study the onset and resolution of bone marrow failure.
In this study, we further characterized the bone marrow failure in scat and found that RASA3 plays a central role in cell cycle progression and maintenance of ROS levels during terminal erythroid differentiation. We observed that in mice undergoing crisis episodes, the G0/G1 phase is transiently increased at the basophilic and polychromatophilic stages, suggesting that RASA3 is involved in regulating the G1 checkpoint. In addition, while ROS levels are normal early in erythropoiesis, we observed an accumulation of ROS at the reticulocyte stage in scat mice. However, mitochondria, a potential source of ROS, are eliminated normally at the reticulocyte stage, suggesting that mitochondrial metabolism and ROS production may be altered prior to removal. Surprisingly, apoptosis is not increased, but rather significantly decreased at several stages of erythroid differentiation in scat during crisis events. Together, these data suggest that scat is a model of bone marrow failure with some of the molecular characteristics of AA. To begin testing the hypothesis that a secreted factor may be mediating the cyclic phenotype, we also characterized the differences in the plasma cytokine profile of scat mice during crisis compared to wild type. We observed that galectin-1 is significantly decreased in scat mice in crisis compared to wild type.
All experimental mice were 14–21 days old, which corresponds to the second crisis event of the scat mice. All protocols were performed according to NIH animal care guidelines, as approved and enforced by the Institutional Animal Care and Use Committees at Northwell Health and The Jackson Laboratory.
Bone marrow was flushed and dissociated with cold PBS containing 0.5% (weight/volume) bovine serum albumin (BSA) and 2 mM Ethylenediaminetetraacetic acid (EDTA), pH 8.0 (Invitrogen). Spleens were dissociated in cold PBS with 0.5% BSA only. Cells were filtered using a 70 μm cell strainer and CD45 depleted using anti-mouse CD45-conjugated microbeads and magnetic columns as per manufacturer instructions (Miltenyi). Circulating red cells, containing both reticulocytes and erythrocytes, were obtained by cardiac puncture. To obtain plasma or serum, whole blood with or without EDTA was centrifuged at 600 g for 5 min and the plasma/serum removed.
Terminal erythropoiesis was monitored using CD44, Ter119, and FSC (Forward Scatter) as markers of differentiation. While Ter119 is increased during differentiation, CD44 is lost as the erythroblasts differentiate.
Depending on the experimental purpose, reticulocyte maturation was monitored using whether CD71 and Ter119 (ROS content); or MitoTracker Red (MTR) and thiazole orange (TO, mitochondria analysis). All of these markers except for Ter119 are lost during reticulocyte maturation.
Samples were blocked with rat anti-mouse CD16/32 (2.5 μg/106 cells) for 5 min at room temperature (RT) followed by staining with a cell surface marker cocktail for 15 min at RT protected from light. Spleen and bone marrow samples were stained with rat anti-mouse CD44 APC-conjugated (0.5 μg/106 cells), rat anti-mouse CD45R/CDllb/Ly6G APC-Cy7-conjugated (0.3 μg/106 cells), and rat anti-mouse Ter119 V450-conjugated (0.5 μg/106 cells) for CM-H2DCFDA (DCF, Invitrogen) or rat anti-mouse Ter119 FITC-conjugated (1 μg/106 cells) for Dihydroethidium (DHE, Invitrogen). Peripheral blood samples were stained with rat anti-mouse Ter119 V450-conjugated (0.5 μg/106 cells) and either rat anti-mouse CD71 PE-conjugated (0.2 μg/106 cells) for DCF or rat anti-mouse CD71 FITC-conjugated (0.625 μg/106 cells) for DHE. Samples were washed twice in PBS and stained with either DHE or DCF. DHE diluted in warm IMDM/1% FBS was added to spleen and bone marrow samples at a 0.4 μM final concentration, and to RBC at a 4 μM final concentration. DCF diluted in warm 1x PBS was added at a 25 μM final concentration for all samples. DHE and DCF were added to the samples and incubated for 30 min at 37°C protected from light. All samples were washed and resuspended for flow analysis. Data was collected using the BD LSRFortessa cytometer and subsequently analyzed with FlowJo software. All cell surface marker antibodies were from BD Biosciences.
Bone marrow cells were isolated and CD45-depleted as above, blocked with rat anti-mouse CD16/32 (2.5 μg/106 cells) for 5 min at RT, and stained with an antibody cocktail of rat anti-mouse Ter119 FITC-conjugated (1 μg/106 cells), CD44 APC-conjugated (0.5 μg/106 cells), and CD45R/CDllb/Ly6G APC-Cy7-conjugated (0.3 μg/106 cells) for 15 min at RT in the dark (Liu et al., 2013). Samples were washed in PBS/0.5% BSA, resuspended in 10 μg/mL Hoechst 33342 (Invitrogen) in warm IMDM/1%FBS (1 mL/106 cells), and incubated at 37°C for 30 min in the dark. Samples were resuspended in 500 μL of 1× PBS with the addition of 0.25 μg of 7AAD (BD Biosciences) to identify dead cells. Data was collected using the BD LSRFortessa cytometer and analyzed using FlowJo software.
Plasma was separated from circulating red cells as described above and then frozen at -80°C until future use. Cytokine levels were semi-quantitated using the Abcam 97-target Mouse Cytokine Antibody Array according to the manufacturer’s protocol (ab169820). Briefly, plasma samples were diluted 1:20 in the 1× blocking buffer provided. Membranes were imaged with the Bio-Rad ChemiDocTM MP. Quantification was performed using Gilles Carpentier’s Dot Blot Analyzer for ImageJ from the ImageJ website macros/toolsets folder, according to documentation at image.bio.methods.free.fr/dotblot.html.
Plasma samples were obtained as mentioned above, and serum samples were obtained in the same manner but without the use of EDTA. Both plasma and serum samples were used to demonstrate consistency across collection methods (de Jager et al., 2009). Prior to loading, all samples were diluted 1:10 in dilution buffer provided with Abcam’s Mouse Galectin 1 ELISA Kit (ab119595), and the kit was run according to manufacturer’s protocol. The plate was read on a spectrophotometer at 450 nm at RT. Galectin-1 concentrations of each sample were extrapolated using the standard curve created on Microsoft Excel and analyzed by comparing scat and wild type measures by unpaired t-test using GraphPad Prism software.
Apoptosis was assessed using Annexin V as per manufacturer (BD Biosciences). All samples were stained with the cell surface marker antibodies as discussed in the cell cycle methods section, followed by staining with Annexin V and 7AAD. The protocol was modified by using 1 μg of Annexin V and 0.25 μg of 7AAD for 1 × 10⁶ cells. Apoptosis data was collected using the BD LSRFortessa cytometer and analyzed using FlowJo software.
Mitophagy was assessed using MitoTracker Red CMXRos (MTR; Molecular Probes) and TO (BD Biosciences) as described (Zhang et al., 2009). Doubly stained reticulocytes were obtained by sequential staining with MTR, then TO. MTR fluorescence emission between 600 and 620 nm was collected after 562 nm laser excitation using a BD LSR II flow cytometry analyzer (BD Biosciences).
For analysis by transmission electron microscopy, peripheral blood reticulocytes and red cells were fixed in 4% paraformaldehyde, 0.1% glutaraldehyde, and 1% sucrose in 0.1 M cacodylate buffer for 1 h at 4°C, then washed in 0.1 M buffer at pH 7.4; remaining aldehydes were quenched with 50 mM ammonium chloride. The fixed cells were then dehydrated and embedded in LR-White Resin, sectioned to 50–70 nm thickness, and examined in a Philips-410 electron microscope.
Statistical evaluations between different experimental groups were performed using GraphPad Prism 7 (unpaired t-test) and p < 0.05 was considered to indicate statistical significance.
We previously reported an accumulation of erythroid precursors at the polychromatophilic and orthochromatic stages in the scat mouse model (Blanc et al., 2012), suggesting potential cell cycle defects. Therefore, we isolated the bone marrow from wild type and scat mice and measured the cell cycle progression at each of the erythroid differentiation stages using the DNA-binding dye Hoechst-33342 along with the erythroid cell surface markers CD44, Ter119, and FSC. Throughout differentiation, erythroid cells lose the adhesion molecule CD44, gain the membrane glycoprotein associated-Ter119, and decrease in size, allowing analysis of distinct developing populations (Liu et al., 2013; Figure 1A). While the pattern was similar between wild type and scat within the proerythroblast population, we observed different patterns of DNA content at the basophilic and polychromatophilic stages that demonstrate a failure to progress out of G0/G1 into S or G2 in scat, indicating a defect at the G1 checkpoint. However, we observed that the pattern either normalizes or becomes indiscernible by the orthochromatic stage, as orthochromatic erythroblasts in both scat and wild type mice are almost entirely in the G0/G1 phase, consistent with previously published studies (Pop et al., 2010; Figures 1B,C). Thus, we conclude that Rasa3 plays a critical role in the G1 checkpoint at the basophilic and polychromatophilic stages of erythroid differentiation.
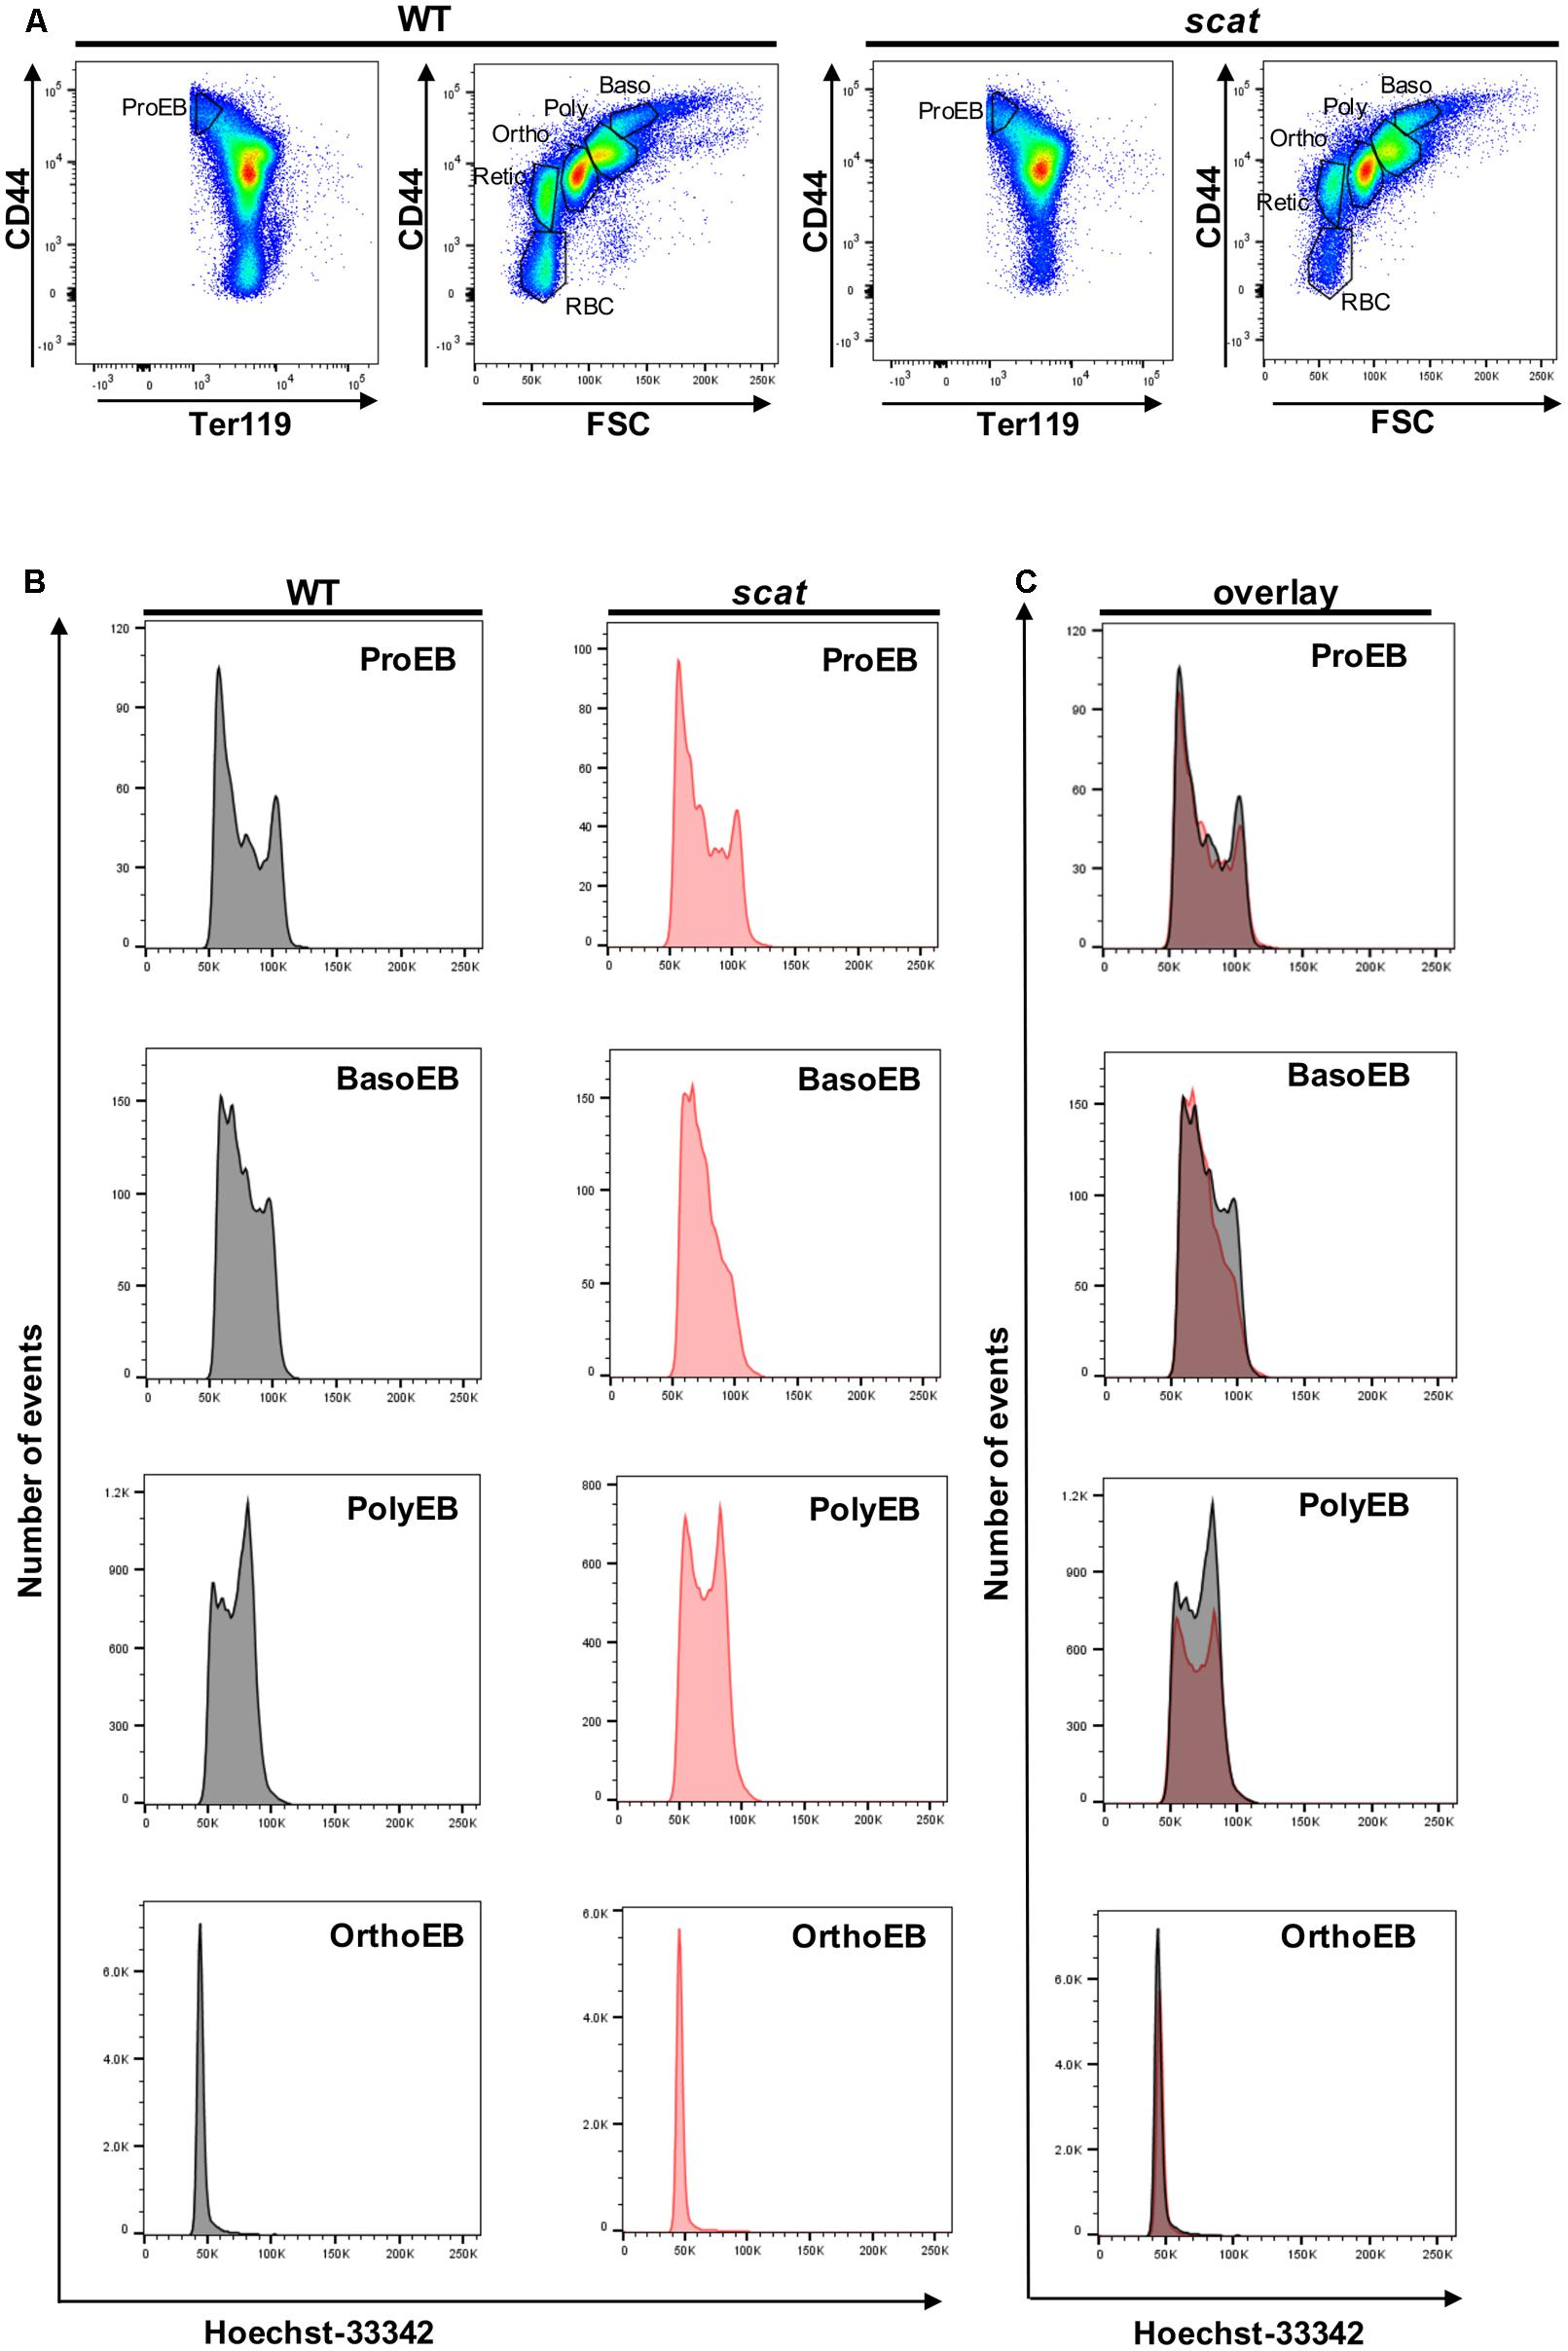
FIGURE 1. Hoechst staining reveals altered cell cycling in the basophilic and polychromatophilic stages of erythropoiesis in scat mice. (A) Gating of CD45-depleted, Ter119 positive bone marrow cells based on CD44 surface expression in wild type and scat. (B) Wild type and scat cells were stained with Hoechst dye (10 μg/mL) and analyzed as individual erythropoietic populations by flow cytometry. (C) Representative cell cycle patterns are suggestive of an accumulation of cells in the G0/G1 phase during erythropoiesis in scat mice. Representative pattern from five independent experiments.
Having shown that the cell cycle is altered specifically at the basophilic and polychromatophilic stages, we then hypothesized that increased levels of ROS could be involved in the mechanism leading to crisis in scat. To evaluate cytosolic peroxide and superoxide generation in wild type and scat, we used DCF and DHE, respectively, as previously described by George et al. (2013). We assessed ROS production in the spleen, bone marrow, and peripheral blood of the mice. A qualitative overlay of the superoxide and general oxidative stress signals in the spleens of wild type and scat indicate a relatively similar level of ROS levels (Figure 2A). However, when we quantified these ROS levels, we observed a significant increase in the peroxide levels at the proerythroblastic stage of scat spleen (Figure 2B; P < 0.05). We also noticed a trend toward increased levels of ROS throughout erythroid differentiation (Figure 2B, left panel). The same trend is observed in the bone marrow (Supplementary Figure 1). This increase in ROS does not seem to be due to an increase in cytosolic superoxide, as DHE levels remain unchanged in scat throughout differentiation, and comparable to those observed in WT (Figure 2B, right panel and Supplementary Figure 1).
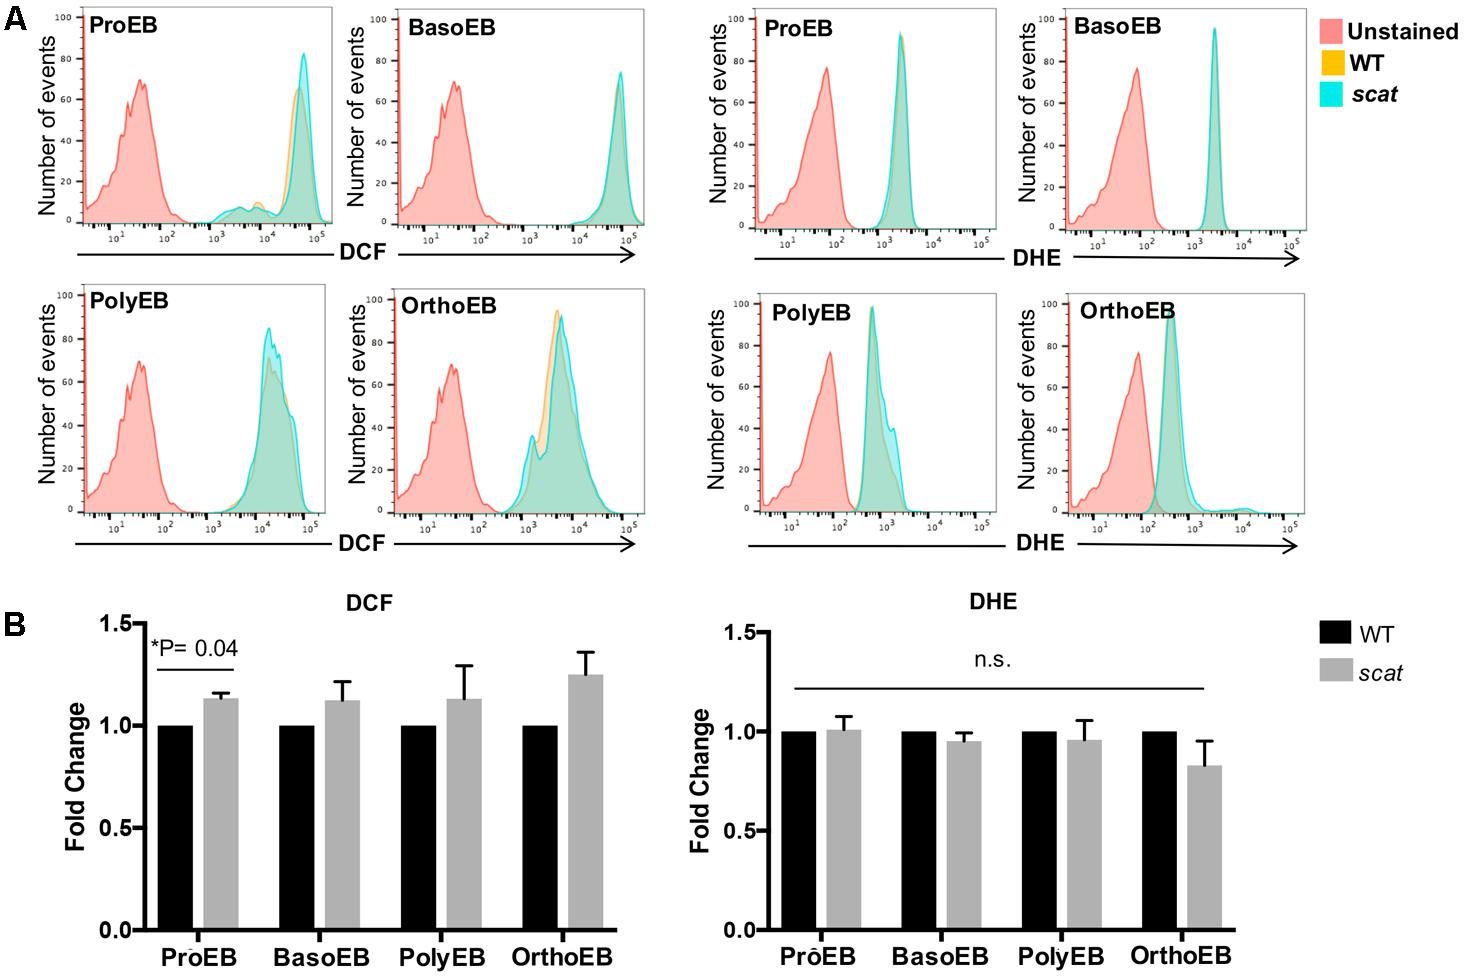
FIGURE 2. There is an increase in peroxide levels at the proerythroblastic stage of erythropoiesis in the spleen of scat mice. (A) Representative histograms showing the levels of DCF (four left panels) and DHE (four right panels) in the spleen measured as fluorescence intensity. (B) Quantification of DCF and DHE levels by population in the spleen of wild type and scat mice. Measured as fold change normalized to wild type (n = 6 for DCF and n = 14 for DHE).
Reactive oxygen species play a role in the regulation of the red cell lifespan (Friedman et al., 2004). Therefore, we evaluated these ROS levels in the peripheral blood of the mice. By using CD71 and Ter119 as markers, one can discriminate between reticulocytes and erythrocytes (Figure 3A). Due to the young age of the mice (less than 3 weeks old), there is a noticeable amount of reticulocytes in the bloodstream of WT animals. We observed that the trend toward increased DCF levels seen in the spleen (Figure 2B) is also present in scat reticulocytes (Figures 3B,C, upper panels). However, the increased levels of ROS normalize during reticulocyte maturation, as erythrocytes do not show an increase in DCF (Figures 3B,C, lower panels). Surprisingly, and unlike what we observed in the spleen, DHE levels are increased 1.4 times in scat reticulocytes compared to WT (Figures 3D,E, upper panels; P = 0.02). Nevertheless, this increase is transient, and the DHE levels normalize at the erythrocyte stage (Figures 3D,E, lower panels). Taken together, these results suggest that there is a transient increase in ROS, both early and late in erythroid differentiation in scat.

FIGURE 3. Increased ROS in scat crisis reticulocytes. (A) Representative gating of reticulocytes and erythrocytes based on levels of CD71 in wild type and scat peripheral blood. (B) Representative histograms showing the levels of DCF measured as fluorescence intensity in reticulocytes and erythrocytes. (C) Quantification of DCF levels in reticulocytes and erythrocytes based on fold change. (D) Representative histograms showing the levels of DHE measured as fluorescence intensity in reticulocytes and erythrocytes. (E) Quantification of DHE levels in reticulocytes and erythrocytes based on fold change (n = 11 for DCF and n = 9 for DHE).
Mitochondria are an important source of ROS and are among the last organelles to be eliminated at the reticulocyte stage (Ney, 2011). Therefore, we assessed mitochondrial clearance during reticulocyte maturation in both WT and scat using MTR and TO as markers for mitochondria and reticulocyte maturation by RNA content, respectively. As shown in Figure 4A, no evidence of abnormal mitochondrial retention is seen in scat. While there is an increased overall number of reticulocytes in scat compared to WT due to the compensatory reticulocytosis, there are no TO-/MitR+ events, indicating no mature reticulocytes (TO-) with mitochondria present. In addition, electron microscopy performed on the peripheral blood of WT and scat animals demonstrates that no aberrant mitochondria are observed in the scat reticulocytes (Figure 4B). Thus, we conclude that the increased ROS levels observed at the reticulocyte stage are not a byproduct of improper mitochondria elimination.
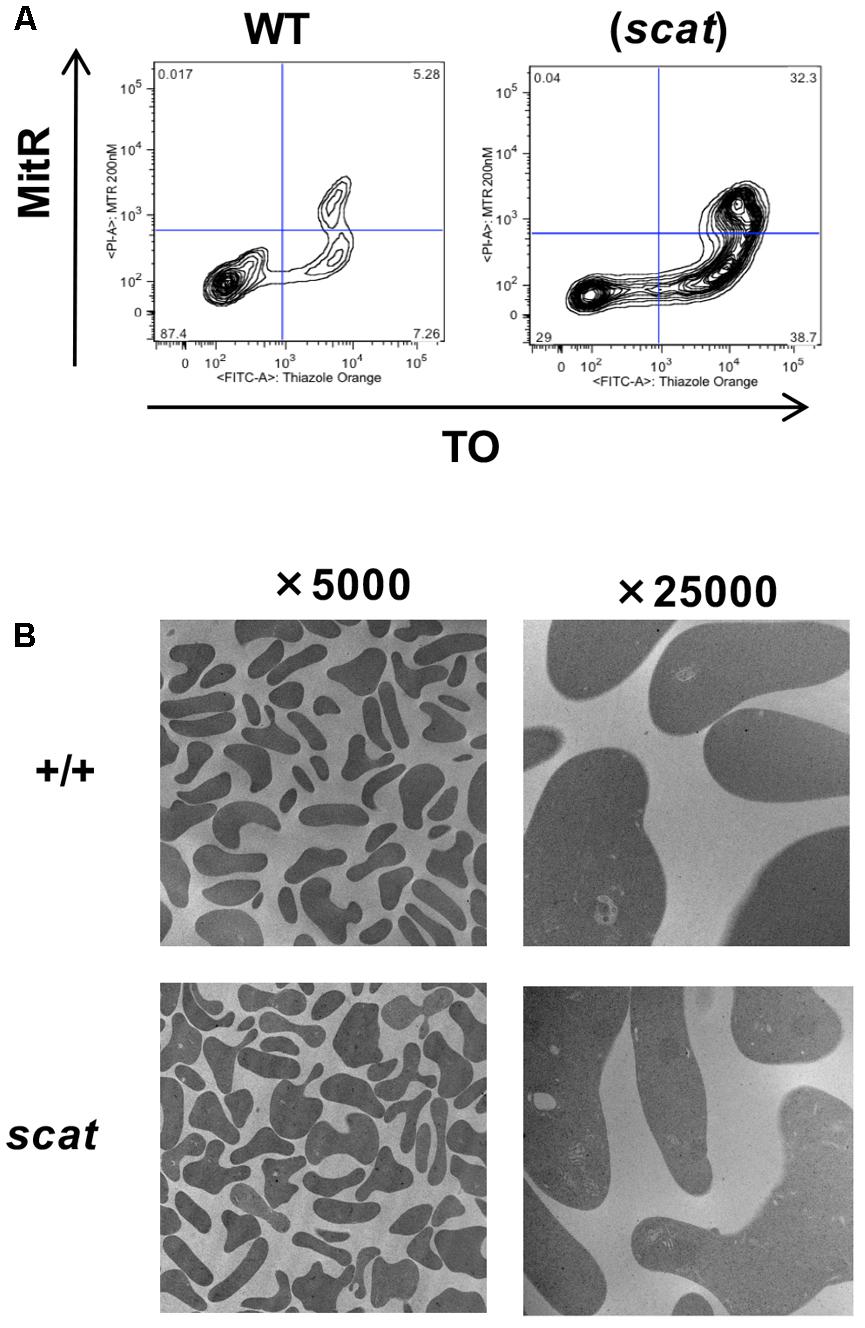
FIGURE 4. Mitochondria are removed normally during erythropoiesis in scat mice. (A) Analysis of wild type and scat peripheral blood by flow cytometry using markers for mitochondria (MitR) and RNA content of reticulocytes (TO). Early reticulocytes are ribosome-positive, mitochondria-positive (upper right quadrant), late reticulocytes ribosome-positive, mitochondria-negative (lower right quadrant), and retained mitochondria ribosome-negative, mitochondria-positive (upper left quadrant). No evidence for increased mitochondrial retention is seen. Representative pattern from five independent experiments. (B) Electron microscopy of RBCs in wild type and scat mice shows no evidence of mitochondria retention.
Given the increased ROS in the reticulocytes and the overall cellular stress associated with the bone marrow failure observed in scat, we elected to investigate apoptosis at each stage of erythroid differentiation in the bone marrow and spleen. To do so, we used the markers Annexin V and 7AAD in addition to CD44, Ter119, and FSC as described previously (Liu et al., 2013). No significant increase in the overall percentage of early apoptotic (Annexin V+ 7AAD-), late apoptotic (Annexin V+ 7AAD+), or necrotic (Annexin V- 7AAD+) cells in scat were seen compared to their littermate controls. However, we observed a significant decrease in the percentage of late apoptotic cells in the bone marrow (Supplementary Figure 2; P < 0.05). Additionally, when we quantified early apoptosis based on each individual erythroid population, we noticed a significant decrease in apoptosis in both scat bone marrow and spleen proerythroblastic, polychromatic, and orthochromatic stages (Figures 5A,B; P < 0.05). Together, these data suggest that loss of function in Rasa3 leads to decreased apoptosis.
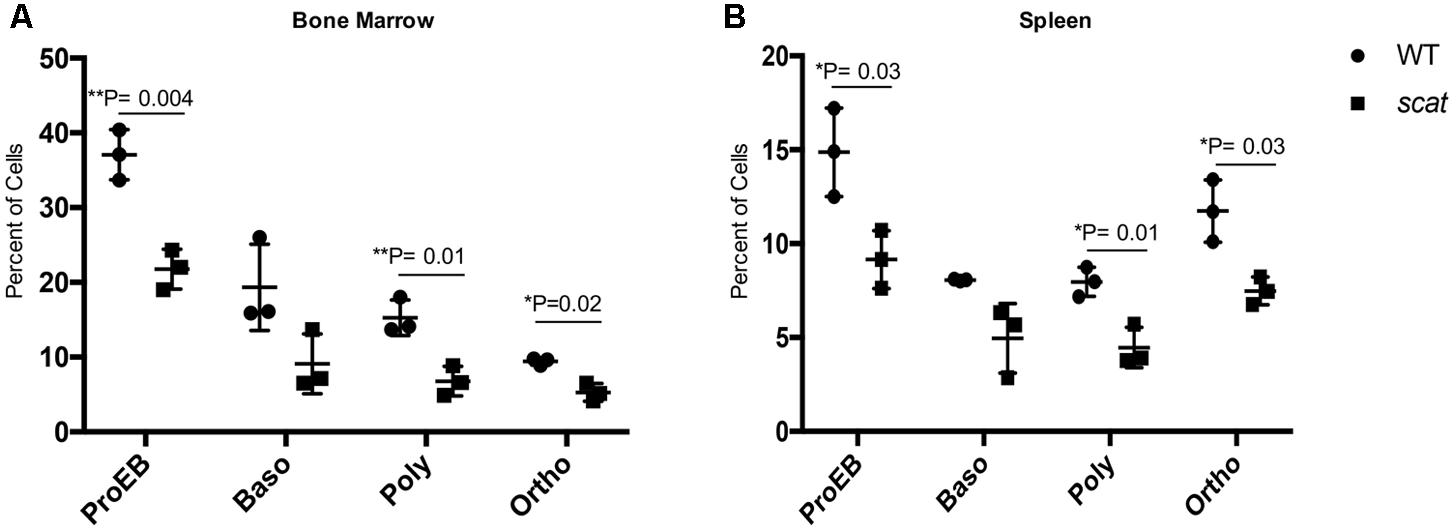
FIGURE 5. Early apoptosis is significantly decreased in scat mice at three distinct erythroid populations. (A) Quantification of early apoptosis in the bone marrow of wild type and scat mice at the proerythroblastic, basophilic, polychromatophilic, and orthochromatic erythroid differentiation stages. (B) Quantification of early apoptosis in the spleen of wild type and scat mice at the proerythroblastic, basophilic, polychromatophilic, and orthochromatic erythroid differentiation stages (n = 3).
One of the most striking aspects of the scat phenotype is the cyclic remission that includes normalization or near normalization of hematologic parameters and external physical manifestations of anemia and thrombocytopenia. The fact that remission occurs without a correction to RASA3’s aberrant location in the cytosol led to the hypothesis that a secreted factor may be mediating its onset. To test this hypothesis, we analyzed plasma cytokine profiles by cytokine array and identified several targets of interest, including galectin-1 (Figure 6A). Galectin-1 is a known mediator of stromal cell-to-stem cell interactions and transduction of intracellular signaling in the bone marrow hematopoietic niche (Liu and Rabinovich, 2010; Rabinovich and Vidal, 2011), and its levels were significantly decreased in scat mice during crisis compared to wild type (Figure 6B, 23326.5 ± 21439.72 vs. 31019.63897 ± 20110.65161; P < 0.05), making it our initial focus. Interestingly, well-known inflammatory mediators such as IL-1β and IL-6, were not significantly different between wild type and scat. To verify these results, we performed an ELISA on serum and plasma samples from scat and littermate wild type mice and indeed found significantly decreased levels of galectin-1 in samples from scat mice (Figure 6C, 2487.917 ± 606.1 pg/mL vs. 5562.417 ± 652.4 pg/mL; P < 0.05). Together, these results suggest that galectin-1 may play a role in the cyclic phenotype or serve as a biomarker of the crisis-remission transition observed in scat.
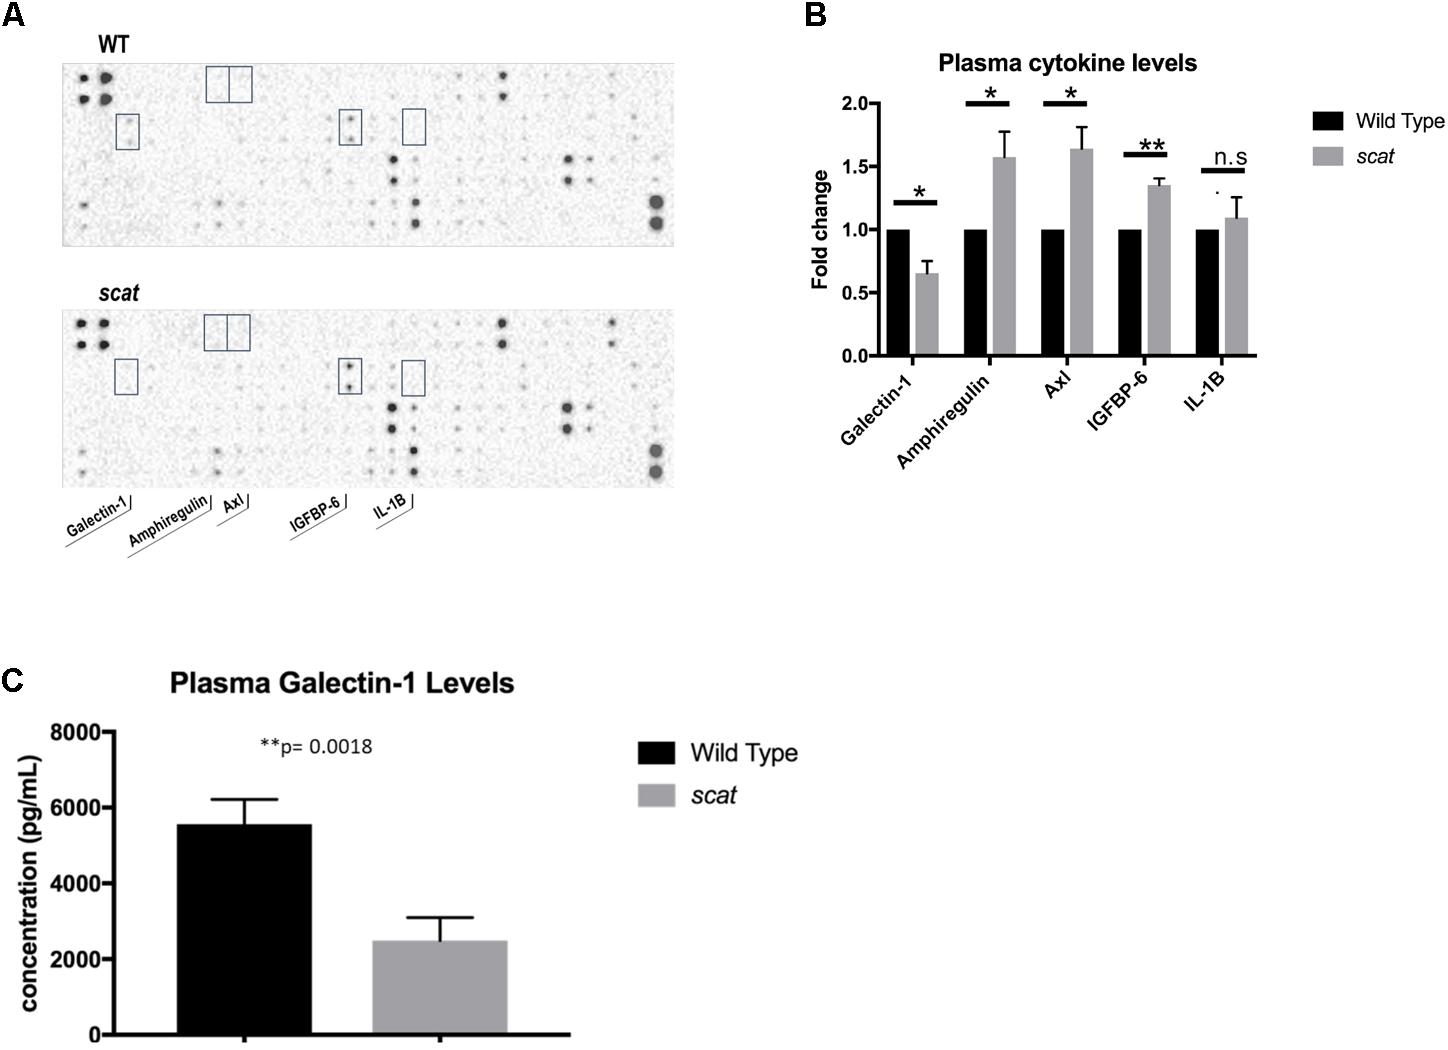
FIGURE 6. Levels of specific cytokines, including galectin-1, are altered in scat plasma and serum. (A) Analysis of plasma samples from scat and littermate WT mice by cytokine array reveals significant differences in four cytokines: galectin-1, amphiregulin, Axl, IGFBP-6, and no significant difference in levels of IL-1B (n = 3). (B) Quantification of the fold change of the cytokines specified in A; galectin-1: p = 0.0154, amphiregulin: p = 0.0366, Axl: p = 0.0135, IGFBP-6: p = 0.0011, IL-1B: p = 0.5825. (C) ELISA analysis of plasma and serum samples diluted 1:10 verifies significantly decreased levels of galectin-1 in scat samples compared to littermate WT (n = 15; p = 0.0018). ∗p < 0.05 and ∗∗p < 0.01.
In this study, we elucidate mechanisms contributing to anemia in scat mice during crisis events and propose a model in which loss of RASA3 function during erythropoiesis leads to dysregulation of several key cellular processes with the final result of anemia (Figure 7). In the bone marrow and spleen, impaired cell cycle progression and increased ROS inhibit proper proliferation and terminal differentiation, leading to eventual decreased red cell output, despite decreased apoptosis. In the periphery, increased ROS further contribute to anemia and secreted factors such as galectin-1 have a yet to be elucidated role in modulating erythropoiesis. The scat model is very unique in the context of existing mouse models of inherited bone marrow failures. Most current models focus on the immune-mediated pathogenesis of acquired AA (Scheinberg and Chen, 2013), and models of congenital AA have focused on mutations in DNA-repair pathways, such as the Fanc-/- models and more recent Brca-/- model (Parmar et al., 2009; Vasanthakumar et al., 2016). Therefore, scat and its loss of function mutation in Rasa3 implicate a unique signaling axis in congenital AA. Further, though these other models of congenital AA have similar hematopoietic defects and possibly convergent molecular mechanisms, scat is the only existing model with a cyclic phenotype that offers key opportunities to study both the onset and remission of some aspects of bone marrow failure.

FIGURE 7. Model of the mechanisms of anemia in the scat mouse model. Mutant RASA3 is rendered non-functional by its mislocalization to the cytosol, leading to dysregulated Ras signaling throughout erythroid differentiation. This dysregulated signaling is associated with an accumulation in the G0/G1 phase of the cell cycle in early erythroid precursors, impairing proper proliferation and differentiation and contributing to decreased red cell mass, despite decreased apoptosis in these populations. A block in terminal differentiation with an accumulation at the polychromatic/orthochromatic stages, as well as increased ROS accumulation in the reticulocyte stage further contribute to the anemia seen as a result of the loss of functional RASA3. Secreted factors, such as galectin-1, may contribute to mediating remission in the erythropoietic microenvironment while RASA3 remains mislocalized.
Cell cycle progression and erythropoiesis are intricately co-regulated. Proper alignment of cell cycle status with phases of erythroid maturation is crucial for regulating the transition from proliferative progenitors to increasingly differentiated precursors, allowing production of a sufficient number of fully mature red cells. Known cell cycle regulators have been shown to play key cell-intrinsic roles in promoting terminal erythroid differentiation (Sankaran et al., 2008). Further, Ras/Raf/MEK/ERK and Ras/PI3K/Akt pathways are known to control the transcription or regulation of key cell cycle regulators (Lee et al., 2008). Therefore, we examined the cell cycle status of individual erythroid differentiation populations in wild type and scat bone marrow. Our results demonstrate a pattern of accumulation in the G0/G1 phase in scat, suggestive of a defect at the G1 checkpoint that normalizes or becomes indiscernible by the orthochromatic stage. During normal erythropoiesis, most orthochromatic erythroblasts have exited the cell cycle and entered G0/G1. The G1 checkpoint integrates various intracellular signaling cascades, including pathways downstream of Ras, and either promotes or prevents DNA replication. Because loss of RASA3 function leads to increased active, GTP-bound Ras in scat, changes in Ras signaling pathways are likely influencing cell cycle progression. As mentioned above, the polychromatophilic to orthochromatic transition represents a key point of cell cycle exit during erythropoiesis that allows final terminal differentiation and enucleation. Prior work characterizing the erythroid differentiation defect in scat demonstrated an accumulation specifically at the polychromatophilic/orthochromatic stages. This accumulation therefore aligns with and supports the notion of aberrant cell cycling in scat erythropoiesis. Finally, many inherited BMFS have a predisposition for hematologic malignancies that are characterized by dysregulated cell cycling (Al-Rahawan et al., 2008). Therefore, the altered cell cycle profiles observed in scat further support its characterization as a model of inherited bone marrow failure. Future work will characterize exactly which cell cycle regulators are being affected and how altered Ras signaling mediates these changes. We will notably investigate the role played by cyclins and CDKs in the regulation of the cell cycle. Due to the fragile nature of the scat mice in crisis, we were unable to inject Bromodeoxyuridine (BrdU) that would have allowed quantification of individual G0/G1, S, and G2/M phases. However, even with our current methods, we were able to observe this consistent trend toward G0/G1 accumulation in scat.
We also identified increased ROS in scat, most notably the accumulation of superoxide in reticulocytes. ROS are known to negatively impact RBC health and lifespan, indicating that their increase likely contributes to the anemia of scat (Friedman et al., 2004). RASA3 is a known negative regulator of Ras activity, and previous studies have determined that upregulation of active Ras proteins can lead to increased intracellular ROS concentrations, further supporting a role for ROS in the scat phenotype (Zamkova et al., 2013). Impaired hemoglobin formation can also be a source of ROS. Accordingly, we previously documented hemoglobinization defects in scat (Blanc et al., 2012). Further studies will elucidate the mechanism(s) of increased ROS during erythropoiesis in scat by examining the activity of Ras isoforms, mitochondrial metabolism prior to proper removal, and hemoglobin synthesis. A surprising finding of the present work is the decrease in apoptosis seen in scat erythroid populations. Given the anemia and overall poor health of scat, one might expect to see an increase in apoptosis; however, this was not the case. Active H, K, and N-Ras are oncogenic proteins known to play a significant role in cell proliferation. Previous studies have shown that an overexpression of Ras isoforms leads to a block in terminal erythroid differentiation accompanied by increased proliferation of earlier erythroid populations (Zhang et al., 2003). Additionally, the same study demonstrated that the introduction of oncogenic Ras into erythroleukemia cells resulted in a block in terminal differentiation and extended proliferation with no effect on apoptosis (Zhang et al., 2003). This ability of precursor cells to survive and proliferate longer due to increased Ras signaling seen with loss of RASA3’s negative regulation could potentially explain why apoptosis is decreased in scat compared to wild type mice. The mechanism of the interesting cyclic phenotype of the scat mouse has yet to be elucidated and likely holds key insights into general mechanisms of onset and resolution of BMFS. We hypothesized that secreted factors may be playing a role in mediating remission and thus compared the plasma cytokine profiles of scat crisis and wild type mice. Galectin-1 was consistently decreased in scat compared to wild type, but levels of common inflammatory mediators such as IL-6 and IL-1β were unchanged. Galectins, a family of β-galactoside binding proteins, have been shown to play key roles in the bone marrow niche and the erythroblastic island, indicating that these lectins have the capacity to modulate the maturation of hematopoietic cells. Within the bone marrow niche, galectins are known mediators of stromal cell-hematopoietic cell interactions (Rabinovich and Vidal, 2011). Galectin-5, a member of the same subfamily as galectin-1, has been specifically implicated in protein sorting and regulation of exosomal uptake in rat erythroblastic islands (Barres et al., 2010). Further, galectins are also known modulators of various mitogen-activated protein kinase (MAPK) signaling pathways in several cell types, including key pathways (PI3K/Akt, Raf/Mek/MAPK) downstream of Ras that are likely to be altered with loss of RASA3 (Masamune et al., 2006; Shimizu et al., 2009). In this context, the ability of galectin-1 to modulate these signaling pathways is of great interest. Though existing data is intriguing and suggestive of galectin-1’s importance, future studies will be required to prove any mechanistic role for galectin-1 in the cyclic bone marrow failure phenotype, rather than its decrease simply being an effect of loss of RASA3 function across all cell types in the mouse, or a generic serum biomarker of disease.
EH and EB designed and performed the research, analyzed the data, and wrote the manuscript. JP, SC, and YZ performed the research, analyzed the data, and edited the manuscript. LP and LB designed the research, analyzed the data, and wrote the manuscript.
This work was supported by National Institutes of Health grant HL134043 (to LP and LB). LB is the recipient of an Allied World St. Baldrick’s Foundation Scholar Award.
The authors declare that the research was conducted in the absence of any commercial or financial relationships that could be construed as a potential conflict of interest.
The Supplementary Material for this article can be found online at: https://www.frontiersin.org/articles/10.3389/fphys.2018.00689/full#supplementary-material
Al-Rahawan, M. M., Alter, B. P., Bryant, B. J., and Elghetany, M. T. (2008). Bone marrow cell cycle markers in inherited bone marrow failure syndromes. Leuk. Res. 32, 1793–1799. doi: 10.1016/j.leukres.2008.05.020
Barres, C., Blanc, L., Bette-Bobillo, P., Andre, S., Mamoun, R., Gabius, H. J., et al. (2010). Galectin-5 is bound onto the surface of rat reticulocyte exosomes and modulates vesicle uptake by macrophages. Blood 115, 696–705. doi: 10.1182/blood-2009-07-231449
Blanc, L., Ciciotte, S. L., Gwynn, B., Hildick-Smith, G. J., Pierce, E. L., Soltis, K. A., et al. (2012). Critical function for the Ras-GTPase activating protein RASA3 in vertebrate erythropoiesis and megakaryopoiesis. Proc. Natl. Acad. Sci. U.S.A. 109, 12099–12104. doi: 10.1073/pnas.1204948109
Bodine, D., and Berliner, N. (2014). Introduction to the review series on “bone marrow failure”. Blood 124:2755. doi: 10.1182/blood-2014-08-587394
de Jager, W., Bourcier, K., Rijkers, G. T., Prakken, B. J., and Seyfert-Margolis, V. (2009). Prerequisites for cytokine measurements in clinical trials with multiplex immunoassays. BMC Immunol. 10:52. doi: 10.1186/1471-2172-10-52
Friedman, J. S., Lopez, M. F., Fleming, M. D., Rivera, A., Martin, F. M., Welsh, M. L., et al. (2004). SOD2-deficiency anemia: protein oxidation and altered protein expression reveal targets of damage, stress response, and antioxidant responsiveness. Blood 104, 2565–2573. doi: 10.1182/blood-2003-11-3858
Fukuda, M., and Mikoshiba, K. (1996). Structure-function relationships of the mouse Gap1m. Determination of the inositol 1,3,4,5-tetrakisphosphate-binding domain. J. Biol. Chem. 271, 18838–18842. doi: 10.1074/jbc.271.31.18838
George, A., Pushkaran, S., Konstantinidis, D. G., Koochaki, S., Malik, P., Mohandas, N., et al. (2013). Erythrocyte NADPH oxidase activity modulated by Rac GTPases, PKC, and plasma cytokines contributes to oxidative stress in sickle cell disease. Blood 121, 2099–2107. doi: 10.1182/blood-2012-07-441188
Guinan, E. C. (2011). Diagnosis and management of aplastic anemia. Hematology Am. Soc. Hematol. Educ. Program 2011, 76–81. doi: 10.1182/asheducation-2011.1.76
Khincha, P. P., and Savage, S. A. (2013). Genomic characterization of the inherited bone marrow failure syndromes. Semin. Hematol. 50, 333–347. doi: 10.1053/j.seminhematol.2013.09.002
Lee, J. T., Lehmann, B. D., Terrian, D. M., Chappell, W. H., Stivala, F., Libra, M., et al. (2008). Targeting prostate cancer based on signal transduction and cell cycle pathways. Cell Cycle 7, 1745–1762. doi: 10.4161/cc.7.12.6166
Liu, F. T., and Rabinovich, G. A. (2010). Galectins: regulators of acute and chronic inflammation. Ann. N. Y. Acad. Sci. 1183, 158–182. doi: 10.1111/j.1749-6632.2009.05131.x
Liu, J., Zhang, J., Ginzburg, Y., Li, H., Xue, F., De Franceschi, L., et al. (2013). Quantitative analysis of murine terminal erythroid differentiation in vivo: novel method to study normal and disordered erythropoiesis. Blood 121, e43–e49. doi: 10.1182/blood-2012-09-456079
Masamune, A., Satoh, M., Hirabayashi, J., Kasai, K., Satoh, K., and Shimosegawa, T. (2006). Galectin-1 induces chemokine production and proliferation in pancreatic stellate cells. Am. J. Physiol. Gastrointest. Liver Physiol. 290, G729–G736. doi: 10.1152/ajpgi.00511.2005
Miano, M., and Dufour, C. (2015). The diagnosis and treatment of aplastic anemia: a review. Int. J. Hematol. 101, 527–535. doi: 10.1007/s12185-015-1787-z
Ney, P. A. (2011). Normal and disordered reticulocyte maturation. Curr. Opin. Hematol. 18, 152–157. doi: 10.1097/MOH.0b013e328345213e
Parmar, K., D’andrea, A., and Niedernhofer, L. J. (2009). Mouse models of Fanconi anemia. Mutat. Res. 668, 133–140. doi: 10.1016/j.mrfmmm.2009.03.015
Peters, L. L., Paw, B. H., and Blanc, L. (2013). The scat mouse model highlights RASA3, a GTPase activating protein, as a key regulator of vertebrate erythropoiesis and megakaryopoiesis. Small GTPases 4, 47–50. doi: 10.4161/sgtp.23013
Pop, R., Shearstone, J. R., Shen, Q., Liu, Y., Hallstrom, K., Koulnis, M., et al. (2010). A key commitment step in erythropoiesis is synchronized with the cell cycle clock through mutual inhibition between PU.1 and S-phase progression. PLoS Biol. 8:e1000484. doi: 10.1371/journal.pbio.1000484
Rabinovich, G. A., and Vidal, M. (2011). Galectins and microenvironmental niches during hematopoiesis. Curr. Opin. Hematol. 18, 443–451. doi: 10.1097/MOH.0b013e32834bab18
Rankin, E. B., Narla, A., Park, J. K., Lin, S., and Sakamoto, K. M. (2015). Biology of the bone marrow microenvironment and myelodysplastic syndromes. Mol. Genet. Metab. 116, 24–28. doi: 10.1016/j.ymgme.2015.07.004
Richardson, C., Yan, S., and Vestal, C. G. (2015). Oxidative stress, bone marrow failure, and genome instability in hematopoietic stem cells. Int. J. Mol. Sci. 16, 2366–2385. doi: 10.3390/ijms16022366
Sankaran, V. G., Orkin, S. H., and Walkley, C. R. (2008). Rb intrinsically promotes erythropoiesis by coupling cell cycle exit with mitochondrial biogenesis. Genes Dev. 22, 463–475. doi: 10.1101/gad.1627208
Scheinberg, P., and Chen, J. (2013). Aplastic anemia: what have we learned from animal models and from the clinic. Semin. Hematol. 50, 156–164. doi: 10.1053/j.seminhematol.2013.03.028
Shimamura, A., and Alter, B. P. (2010). Pathophysiology and management of inherited bone marrow failure syndromes. Blood Rev. 24, 101–122. doi: 10.1016/j.blre.2010.03.002
Shimizu, M., Khoshnoodi, J., Akimoto, Y., Kawakami, H., Hirano, H., Higashihara, E., et al. (2009). Expression of galectin-1, a new component of slit diaphragm, is altered in minimal change nephrotic syndrome. Lab. Invest. 89, 178–195. doi: 10.1038/labinvest.2008.125
Vasanthakumar, A., Arnovitz, S., Marquez, R., Lepore, J., Rafidi, G., Asom, A., et al. (2016). Brca1 deficiency causes bone marrow failure and spontaneous hematologic malignancies in mice. Blood 127, 310–313. doi: 10.1182/blood-2015-03-635599
Zamkova, M., Khromova, N., Kopnin, B. P., and Kopnin, P. (2013). Ras-induced ROS upregulation affecting cell proliferation is connected with cell type-specific alterations of HSF1/SESN3/p21Cip1/WAF1 pathways. Cell Cycle 12, 826–836. doi: 10.4161/cc.23723
Zhang, J., Randall, M. S., Loyd, M. R., Dorsey, F. C., Kundu, M., Cleveland, J. L., et al. (2009). Mitochondrial clearance is regulated by Atg7-dependent and -independent mechanisms during reticulocyte maturation. Blood 114, 157–164. doi: 10.1182/blood-2008-04-151639
Keywords: erythropoiesis, mouse models, anemia, aplastic, bone marrow failure syndromes, reactive oxygen species (ROS), cell cycle, apoptosis
Citation: Hartman ES, Brindley EC, Papoin J, Ciciotte SL, Zhao Y, Peters LL and Blanc L (2018) Increased Reactive Oxygen Species and Cell Cycle Defects Contribute to Anemia in the RASA3 Mutant Mouse Model scat. Front. Physiol. 9:689. doi: 10.3389/fphys.2018.00689
Received: 17 January 2018; Accepted: 17 May 2018;
Published: 05 June 2018.
Edited by:
Lars Kaestner, Saarland University, GermanyReviewed by:
Joel S. Greenberger, University of Pittsburgh Medical Center, United StatesCopyright © 2018 Hartman, Brindley, Papoin, Ciciotte, Zhao, Peters and Blanc. This is an open-access article distributed under the terms of the Creative Commons Attribution License (CC BY). The use, distribution or reproduction in other forums is permitted, provided the original author(s) and the copyright owner are credited and that the original publication in this journal is cited, in accordance with accepted academic practice. No use, distribution or reproduction is permitted which does not comply with these terms.
*Correspondence: Lionel Blanc, TEJsYW5jQG5vcnRod2VsbC5lZHU=
†These authors have contributed equally to this work.
‡Co-senior authors
Disclaimer: All claims expressed in this article are solely those of the authors and do not necessarily represent those of their affiliated organizations, or those of the publisher, the editors and the reviewers. Any product that may be evaluated in this article or claim that may be made by its manufacturer is not guaranteed or endorsed by the publisher.
Research integrity at Frontiers
Learn more about the work of our research integrity team to safeguard the quality of each article we publish.