- 1Department of Craniofacial Biology, School of Dental Medicine, University of Colorado Anschutz Medical Campus, Aurora, CO, USA
- 2Department of Cell and Developmental Biology, School of Medicine, University of Colorado Anschutz Medical Campus, Aurora, CO, USA
- 3Department of Neuroscience, University of Oregon, Eugene, OR, USA
- 4Department of Anatomy and Cell Biology, University of Saskatchewan, Saskatoon, SK, Canada
Defects in mid-facial development, including cleft lip/palate, account for a large number of human birth defects annually. In many cases, aberrant gene expression results in either a reduction in the number of neural crest cells (NCCs) that reach the frontonasal region and form much of the facial skeleton or subsequent failure of NCC patterning and differentiation into bone and cartilage. While loss of gene expression is often associated with developmental defects, aberrant upregulation of expression can also be detrimental. microRNAs (miRNAs) are a class of non-coding RNAs that normally repress gene expression by binding to recognition sequences located in the 3′ UTR of target mRNAs. miRNAs play important roles in many developmental systems, including midfacial development. Here, we take advantage of high throughput RNA sequencing (RNA-seq) from different tissues of the developing mouse midface to interrogate the miRs that are expressed in the midface and select a subset for further expression analysis. Among those examined, we focused on four that showed the highest expression level in in situ hybridization analysis. Mir23b and Mir24.1 are specifically expressed in the developing mouse frontonasal region, in addition to areas in the perichondrium, tongue musculature and cranial ganglia. Mir23b is also expressed in the palatal shelves and in anterior epithelium of the palate. In contrast, Mir133b and Mir128.2 are mainly expressed in head and trunk musculature. Expression analysis of mir23b and mir133b in zebrafish suggests that mir23b is expressed in the pharyngeal arch, otic vesicle, and trunk muscle while mir133b is similarly expressed in head and trunk muscle. Functional analysis by overexpression of mir23b in zebrafish leads to broadening of the ethmoid plate and aberrant cartilage structures in the viscerocranium, while overexpression of mir133b causes a reduction in ethmoid plate size and a significant midfacial cleft. These data illustrate that miRs are expressed in the developing midface and that Mir23b and Mir133b may have roles in this developmental process.
Introduction
Morphogenesis of the vertebrate face is a complex event requiring coordination among a variety of signaling cascades. Human craniofacial birth defects occur at a world-wide rate of 1:800 births (Schutte and Murray, 1999; Spritz, 2001), with structural defects often resulting from failure of spatio-temporal integration of these signaling cascades. While the vertebrate mid-face has a complex embryonic origin, most facial birth defects result from disruption of cranial neural crest cell (NCC) patterning and differentiation (Chai and Maxson, 2006; Knight and Schilling, 2006; Walker and Trainor, 2006; Dixon et al., 2011; Clouthier et al., 2013). Cranial NCCs arise at the border between the neural and non-neural ectoderm and subsequently migrate to the frontonasal region (Le Douarin, 1982; Bronner-Fraser, 1995). These cells eventually give rise to most of the bone, cartilage, and connective tissue of the mid-face and neck (Couly et al., 1996; Köntges and Lumsden, 1996). NCC development relies on intricate regulation of patterning cues within specific boundaries of the head. While boundaries are established through continuous refinement of gene expression, the mechanisms required for this refinement are less clear.
MicroRNAs (miRNAs) are a class of small, noncoding RNAs that inhibit translation of target mRNAs by binding to a recognition sequence almost always in the 3′ untranslated region (UTR) of the target mRNA (Lee et al., 1993; Wightman et al., 1993; Lai, 2002; Lewis et al., 2003). This binding results in decreased mRNA translation through a number of mechanisms that can include cleavage and degradation of the target mRNA, translational repression, deadenylation of the 3′-poly(A) tail and thus mRNA decay and miRNA sponging (Hutvágner et al., 2001; Zheng and Cullen, 2003; Wu et al., 2006; Hausser and Zavolan, 2014; Jens and Rajewsky, 2015). miRNAs have been implicated in many clinically relevant processes, including development, cancer, and stem cell maintenance and differentiation (Chen et al., 2012; Fernández-Hernando et al., 2013; Kuppusamy et al., 2013; Morceau et al., 2013; Parpart and Wang, 2013). miRNAs are also involved in numerous aspects of craniofacial development, including palatogenesis, odontogenesis, and upper and lower jaw development (Tavares et al., 2015). One of the first examples of miRNA action in facial development is mir140, whose regulation of pdgfra is required for NCCs to migrate past the optic stalk on their way from the hindbrain to the future palate (Eberhart et al., 2008). A SNP in the human MIR140 gene leads to reduced Mir140 expression in murine palatal mesenchymal cells (Li et al., 2011). In addition, this SNP is associated with increased risk of nonsyndromic cleft palate in mothers who smoke during pregnancy (Li et al., 2010). These findings suggest that miRNA function is evolutionarily conserved and illustrates a role for miRNAs in human palate development. Another miRNA family involved in craniofacial development is the MIR17 and MIR92 family, which has been linked to Feingold syndrome in human patients (Kannu et al., 2013; Tassano et al., 2013). Targeted knockouts of Mir17 and Mir92 in mice results in hypoplasia of most skull bones, including reduced ossification and cleft palate, similar to human patients (Ventura et al., 2008; de Pontual et al., 2011; Li et al., 2012; Wang et al., 2013). In addition, others, such as Mir196, Mir199, and Mir200 have likely roles in determining craniofacial size, bone and cartilage formation, and cartilage size, respectively (Watanabe et al., 2008; Desvignes et al., 2014). However, targeted deletion of the miRNA processing enzyme DICER in NCCs results in hypoplasia of most craniofacial structures, suggesting that numerous other miRNAs are also likely involved in this process (Huang et al., 2010; Zehir et al., 2010; Nie et al., 2011; Oommen et al., 2012).
Here, we use data from a high-throughput miRNA sequencing project of developing mouse facial structures to identify many miRNAs that are potentially involved in craniofacial development. We have examined the expression of a number of these miRNAs in both mouse and zebrafish. Further, we have performed functional analysis of four of these miRNAs in zebrafish. Our in situ hybridization and overexpression analyses provide evidence that Mir23b and Mir133b are important regulators of craniofacial development.
Materials and Methods
miRNA-Seq Differential Expression Analysis
RNA-Seq count data with gene assignments have been deposited in the FaceBase repository for craniofacial research (www.facebase.org). Specific FaceBase accession numbers are: E10.5 FB00000662.01, E11.5 FB00000663.01, E12.5 FB00000664.01, FB00000664.01, E13.5 FB00000665.01, E14.5 FB00000666.01. Counts of overlapping and nested sequences assigned to each mature (1035 sequences) or hairpin (306 sequences) mouse miRNA were summed to obtain consolidated counts per mature or hairpin miRNA (724 and 255, respectively). A threshold of 1 was used for the RNA-seq analysis. After low filtering (mean counts per sample >5; 629 mature miRs and 163 hairpin miRNAs), we used DESeq to identify miRNAs differentially expressed by anatomy or age. For principal components analysis and hierarchical clustering, count data was normalized using the regularized log transformation in the DESeq R package. A p < 0.01 after multiple testing correction (Benjamini and Hochberg method) was used, as well as no fold-change threshold (Benjamini and Hochberg, 1995).
Mouse and Zebrafish Maintenance
All mouse embryo collection was performed using 129S6 mice (Taconic), with the day of the copulation plug denoted as 0.5 days. Embryo collection and fixation were performed as previously described (Clouthier et al., 1998). Zebrafish were maintained according to common lab practice (Westerfield, 2000), with embryo staging according to established methods (Kimmel et al., 1995). The wild type lines used are AB and an in-cross line maintained between the AB and TL lines (TAB). This study was carried out in accordance with the recommendations of the Institutional Animal Care and Use Committee (IACUC) of the University of Colorado Anschutz Medical Campus as laid out in protocols approved by IACUC. Nomenclature for miRNAs is consistent with that described in Desvignes et al. (2015). For simplicity, pri-MiR(mouse) and pri-miR (zebrafish) were annotated without the “pri” in the text below.
Cloning and Probe Synthesis
To detect expression of mouse MiRNAs, we used both Locked Nucleic Acid (LNA; Obernosterer et al., 2007) and conventional riboprobes against the primary pri-MiR transcripts, both labeled with digoxigenin (He et al., 2011). For LNA-based experiments, Exiqon LNA Mir133b (#616614-360) and Mir23b (#615366-360) probes were used. To generate pri-MiR probes, PCR primers were designed to amplify about 200–600 nt of the primary MiR transcript centered on the mature miRNA sequence for mouse and zebrafish. All primer sequences are given in Supplemental Table 1. To generate mouse pri-MiRs, PCR primers were used with genomic tail DNA obtained from tails of 2 month old mice. To generate zebrafish pri-miRs, PCR primers were used with 5 day post fertilization (dpf) zebrafish embryos. PCR products were cloned into the pCR®II-TOPO® Vector (Invitrogen). Inserts were validated by sequencing. Plasmids were linearized and transcribed using the DIG Labeling Kit (Roche). Probes were purified as previously described (Clouthier et al., 1998). The opposite stand sense probes were used as controls for specificity for the antisense expression (data not shown).
Mouse and Zebrafish Whole Mount In situ Hybridization (ISH)
Whole mount ISH in mouse was performed as previously described (Clouthier et al., 1998). For sectional miRNA ISH, serial 10 μm frontal sections through the head of E12.5 and/or E13.5 mouse embryos were collected on Superfrost Plus slides (Fisher). Subsequent ISH was performed as previously described (Hendershot et al., 2007). Hybridizations were performed at 70⋅C overnight. Colorimetric detection was performed with BM purple (Roche). Signal detection required an average of 2–3 days in staining solution. After developing, slides were rinsed in TBST, coverslipped and photographed using Nomarski optics on an Olympus BX51 compound microscope fitted with a DP71 digital camera. Whole-mount ISH in zebrafish was performed as previously described (Johnson et al., 2011). BM Purple (Roche) was used as a substrate for the alkaline phosphatase reaction. After staining, embryos were mounted in 80% glycerol or 3% methylcellulose and imaged under Nomarski optics on the Olympus BX51 compound microscope as described for mice.
Overexpression Analysis and Bone and Cartilage Staining
MiRNA duplexes were created by annealing 5p and 3p MiRs together at 95⋅C and slowly cooling to room temperature (MiR133b-3p: UUUGGUCCCCUUCAACCA; MiR133b-5p: GCUGGUCAAAUGGAACCA; MiR23b-3p: AUCACAUUGCCAGGGAUU; MiR23b-5p: GGUUCUUGGCAUGCUGA). Thirty-three micrometers of MiR23b duplex (5′—3′), 6.25 μM of MiR133b (5′—3′), and 33 μM of standard control miRNA (5′- CTTACCTCAGTTACAATTTATA -3 duplexed with 5′- TAAATTGTAACTGAGGTAAGAG-3′) were injected into single cell zebrafish embryos and allowed to grow for 6 dpf. Zebrafish embryos were fixed and stained with alizarin red and alcian blue (Birkholz et al., 2009) with minor modifications. Larvae were fixed in 2% PFA/PBS for 1 h at room temperature, washed in 100 mM Tris (pH 7.5)/10 mM MgCl2, and stained overnight in 0.04% alcian blue (Anatech Ltd) in 80% EtOH/100 mM Tris (pH 7.5)/10 mM MgCl2. Larvae were then rehydrated in 80% EtOH/100 mM Tris (pH 7.5)/10 mM MgCl2, followed by 50 and 25% EtOH/100 mM Tris (pH 7.5), cleared in 25% glycerol/0.1% KOH, then stained 30 min with 0.01% alizarin red (Sigma) in 25% glycerol/100 mM Tris (pH 7.5) and stored in 50% glycerol/0.1% KOH. Stained skeletons were dissected, flat-mounted and imaged as previously described (Johnson et al., 2011).
Results
Identification of miRNAs Involved in Midfacial Development from miRNA-Seq Data
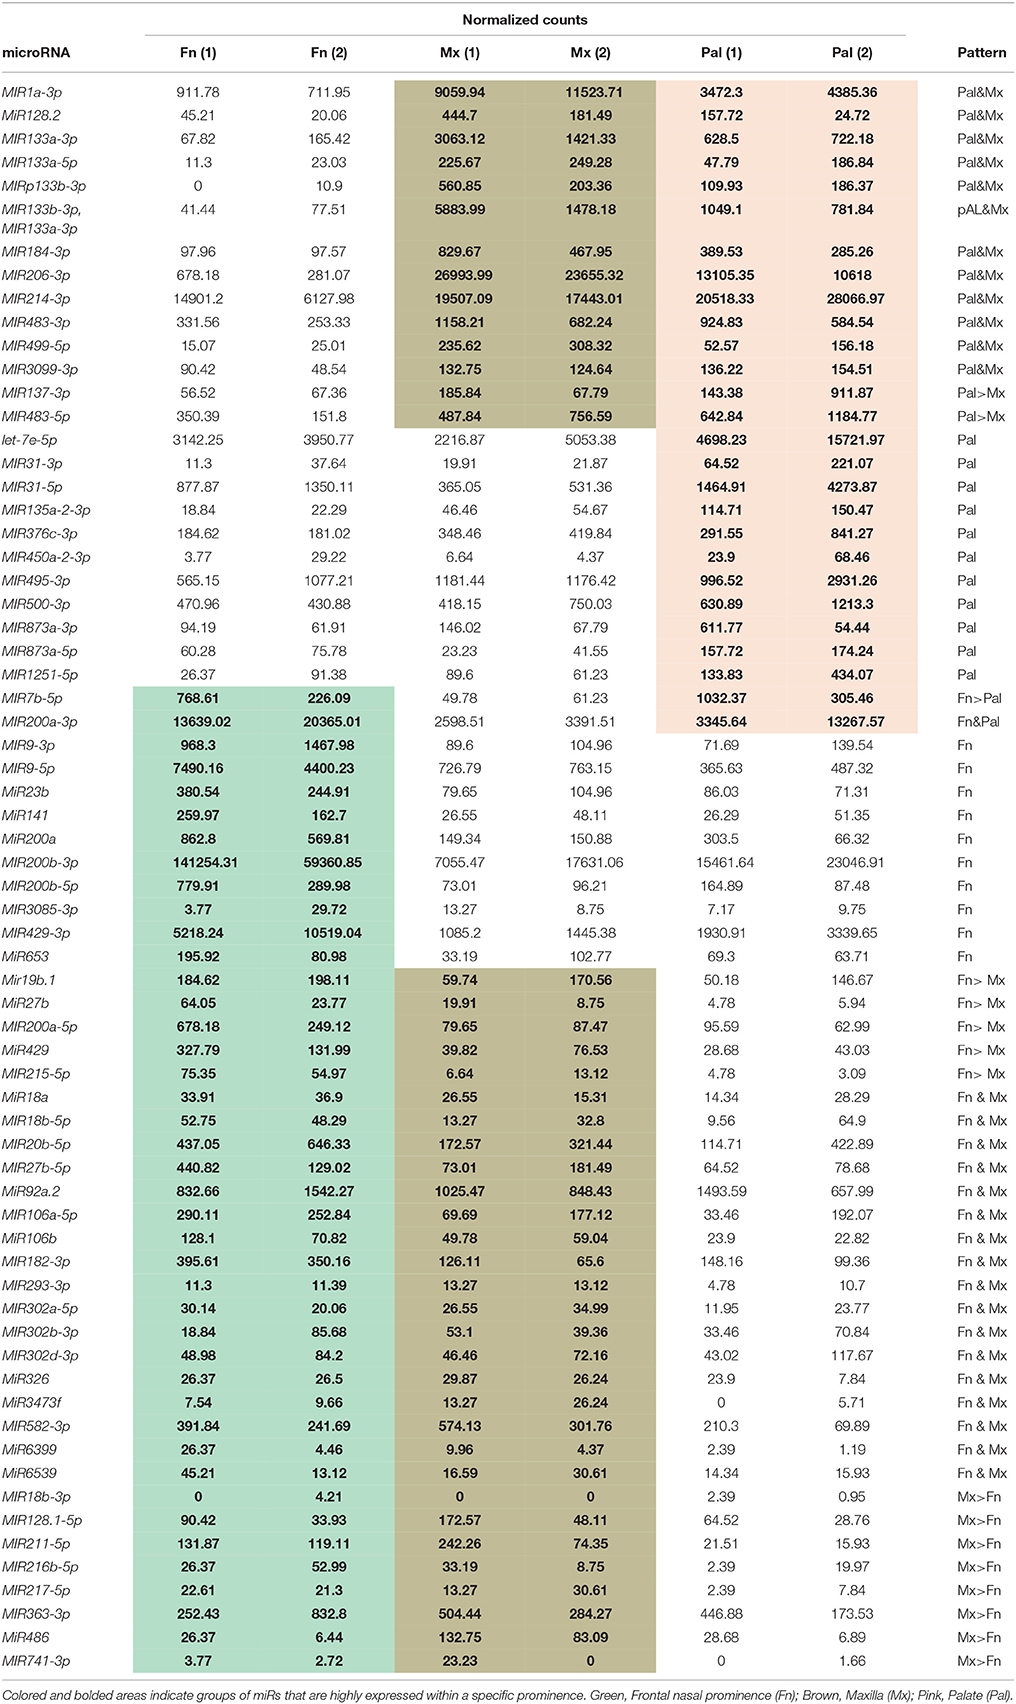
We have previously conducted massively parallel miRNA sequencing (miRNA-Seq) on miRNAs extracted from embryonic age (E) 10.5, E11.5, E12.5, E13.5, and E14.5 mouse maxillary prominences, frontonasal prominences, and palatal shelves, with the data deposited in FaceBase (www.facebase.org). Between E10.5 and E11.5, NCC-derived mesenchyme that will give rise to craniofacial structures undergoes significant patterning events that establishes the positional and functional identity of the mesenchyme. Between E12.5 and E14.5, gene expression in the facial region is driving differentiation into the bone and cartilage of the upper and lower face. Because we are interested in the mechanisms that govern this second event, we focused our analysis of miRNA expression between E12.5 and E14.5. Using a combination of biostatical approaches and packages (Section Materials and Methods), we identified 262 differentially expressed mature miRNAs and 71 hairpin miRNAs at a false discovery rate-adjusted p > 0.01 (data not shown). Of these, 49 mature miRNAs and 11 hairpin miRNAs were differentially expressed between maxillary prominences, frontonasal prominences, and palatal shelves (Figure 1A); some also differed by age (Figure 2). Table 1 shows the top differentially expressed miRNAs as total counts, while Figure 2 shows the log2fold change in expression of specific miRNAs between facial prominences at E13.5. Total counts of each miRNA are also shown in Table 1 so that the relative expression of miRNAs can be compared.
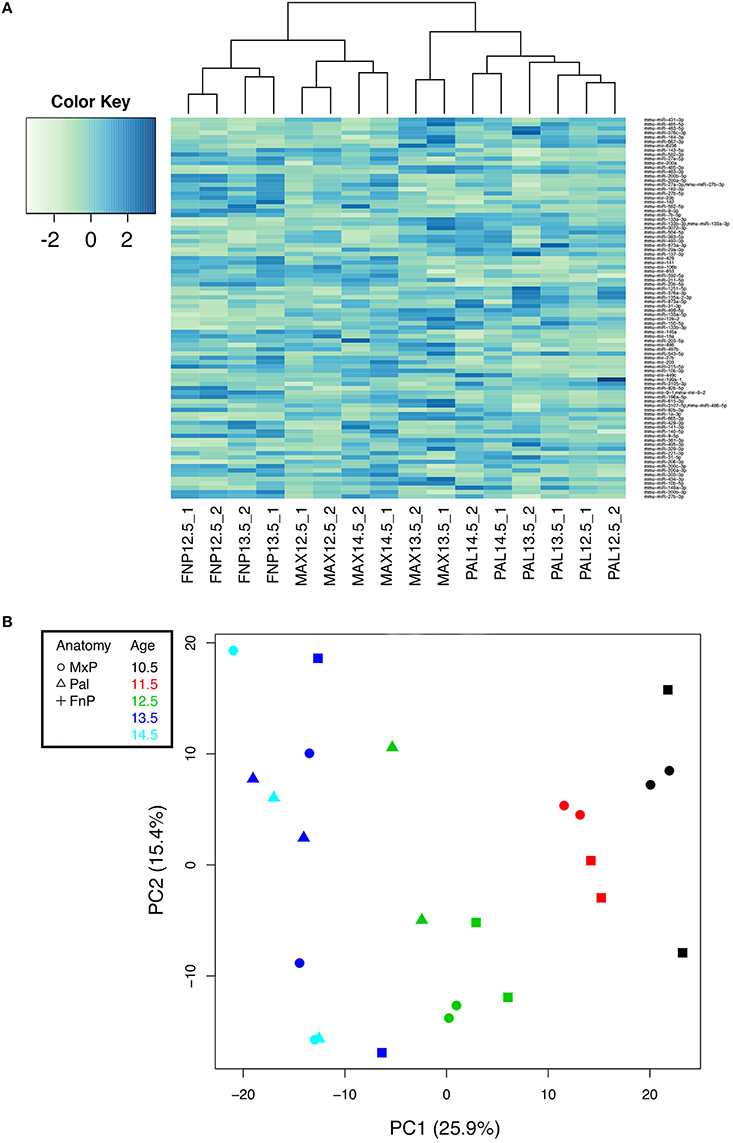
Figure 1. Analysis of miRNA-Seq data defines miRNAs whose expression differs by prominence. (A) 49 mature miRNAs and 11 hairpin miRNAs were differentially expressed by prominence (FDR adjusted p < 0.01). Hierarchical clustering of their normalized and scaled expression values (using the R hclust function, ward. D2 method) shows groups of miRNAs enriched in the frontonasal prominence (FnP), palate (Pal), the maxillary prominence (Max), or in combinations thereof. The dendrogram at the top shows the clustering of the samples; the three major divisions correspond to FnP, Pal, and Max, and duplicate samples cluster together. (B) Principal Component Analysis (PCA) analysis of data. Data is color coded by age (inset), with tissue source denoted by symbol (inset). Principal Component 1 (PC1) distributes samples by age. Principal Component 2 (PC2) is orthogonal to PC1 but does not correspond to any obvious property of the samples.
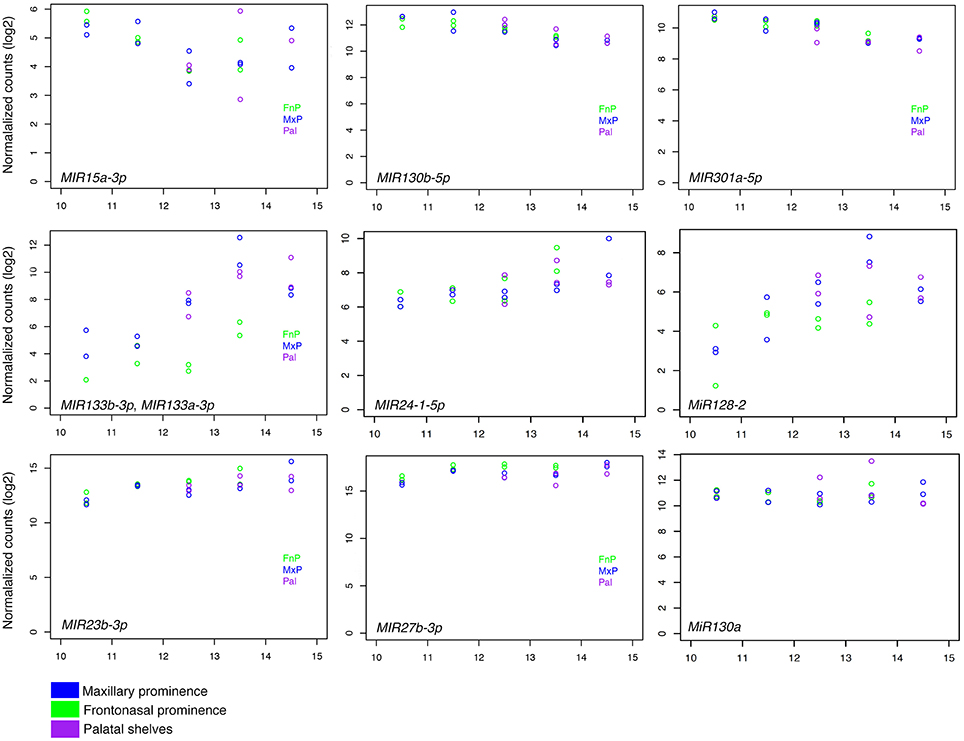
Figure 2. RNAseq values for expression of selected miRNAs. Normalized counts for selected miRNAs from each prominence (see inset) as compared to embryonic age (E10–15). Each row represents a different pattern of expression over time. (Top) Mir15a, Mir130b, and Mir301a showed a downward trend of expression over time. (Middle) Expression of Mir133b, Mir24.1, and Mir1282 increased over time. (Bottom) Mir23b, Mir27b, and Mir130a were expressed consistently over time. Blue, Maxillary prominence; Green, Frontonasal prominence; and Purple, Palate.
Principal Components Analysis of miRNAs Expressed in the Face
Principal Components Analysis (PCA) is a primary quality control assay, with the expectation that replicates will cluster and that principal components might reflect known qualities of the sample conditions (e.g., age, anatomy) or of the experiment (e.g., batch or read depth). After sequence consolidation and low-expression filtering, normalized counts for 979 miRNAs (724 mature miRNAs and 255 hairpin miRNAs) were used to analyze the principal components of the variability among the 24 samples (Figure 1B). The first principal component, which accounts for 26% of the variability, distributed the samples by age (color-coded). Neither prominence (symbols) nor read depth (not shown) correlated with any of the top five principal components. Biological duplicates from E10.5-E12.5 tended to cluster, indicating biological reproducibility at those ages. Together these demonstrate the biological reproducibility for key miRNAs between replicates and within prominences.
Expression Analysis of Selected miRNAs in the Mouse at E12.5
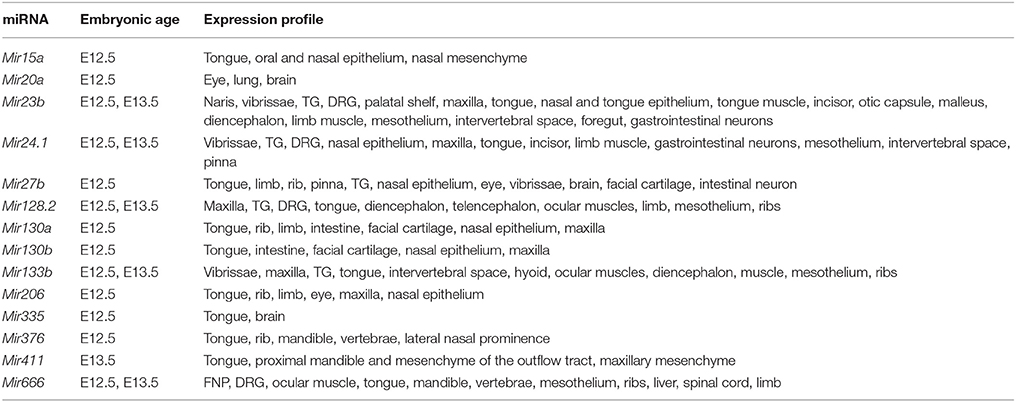
For our in situ hybridization (ISH) analysis of miRNA expression in the developing midface, we focused on E12.5 mouse embryos, as at this stage, the lateral and medial nasal prominences, palatal shelves, and maxilla are well-defined and are undergoing extensive growth. We initially examined miRNA expression in E12.5 mouse embryo using whole mount ISH and LNA probes against Mir23b, Mir24.1, and Mir666 (Supplemental Figure 1). LNA probes specifically detect the mature Mir sequence. However, the overall level of expression of these Mir's as detected in whole mount analysis was low (likely due in part to poor probe penetration; Supplemental Figure 1), leading us to examine Mir expression using frozen sectional ISH analysis. When using LNA probes against Mir23b and Mir133b, robust expression was present in a variety of facial structures, though overall background staining on the sections was high (Supplemental Figure 2). To next assess whether we could improve the signal to noise ratio of the staining, we PCR-generated probes against the pri-miRNA transcript, an approach we have previously used to examine Mir expression in embryos (He et al., 2011). Probes encompassed the pri-miRNA sequence (see (Section) Materials and Methods). These probes detect both pri-miRNAs and mature miRNAs, so expression is expected in both the nucleus and cytoplasm. However, the relative abundance of mature miRNAs for any single species compared to that of pri-miRNA species makes it far more likely that these probes detect the mature miRNA. Further, we have shown that the use of pri-miRNA probes for miRNA ISH provides comparable results to those using LNA probes (He et al., 2011). Based on our bioinformatics analysis (Figures 1, 2), we examined the expression of 13 pri-miRNAs in E12.5 mouse embryos and found that many were expressed in specific embryonic tissues, including facial structures (Table 2 and Supplemental Figures 3–9). Based on this initial analysis of ISH data, we focused our subsequent analysis on MiR23b and MiR133b.
Expression of MiR23b and MiR133b in Mouse Facial Structures at E12.5
In E12.5 wild type mouse embryos, MiR23b expression appeared throughout the facial region including the nasal epithelium, mystacial vibrissae, and vomeronasal nasal organs (Figures 3A–C), upper incisors (Figure 3D), tongue connective tissue and epithelium (Figures 3E,F), and maxillary epithelium (Figure 3F). Expression was also observed in the anterior palatal shelves, with expression more prominent on the nasal side of the shelves (Figures 3E,F) and in the trigeminal ganglion (Figure 3G). In addition, MiR23b was expressed along the palatal shelf epithelium, again starting at the midline of the shelf and continuing on the oral side (Figures 3H,I). Overall, the expression pattern of MiR23b supported our analysis (Figure 1), though it was difficult to assess the qualitative differences in expression between prominences compared to the quantitative differences of miRNA-seq. In the genome, MiR23b is part of the 850 bp Mirc23 cluster, which contains Mir23b, Mir27b, and Mir3074.1. In addition, Mir24.1 is 5 kb away from Mir23b. As previously described for many clustered miRNAs (Lagos-Quintana et al., 2003; Lim et al., 2003), Mir24.1 had an expression pattern similar to that observed for Mir23b, including expression in the nasal epithelium (Supplemental Figures 3A–C), tongue (Supplemental Figures 3E,F,H,I) and maxillary process epithelium (Supplemental Figure 3D), though expression in the palatal shelf mesenchyme and overlying epithelium (Supplemental Figures 3D,F,H,I) and trigeminal ganglia (Supplemental Figure 3G) was weak.
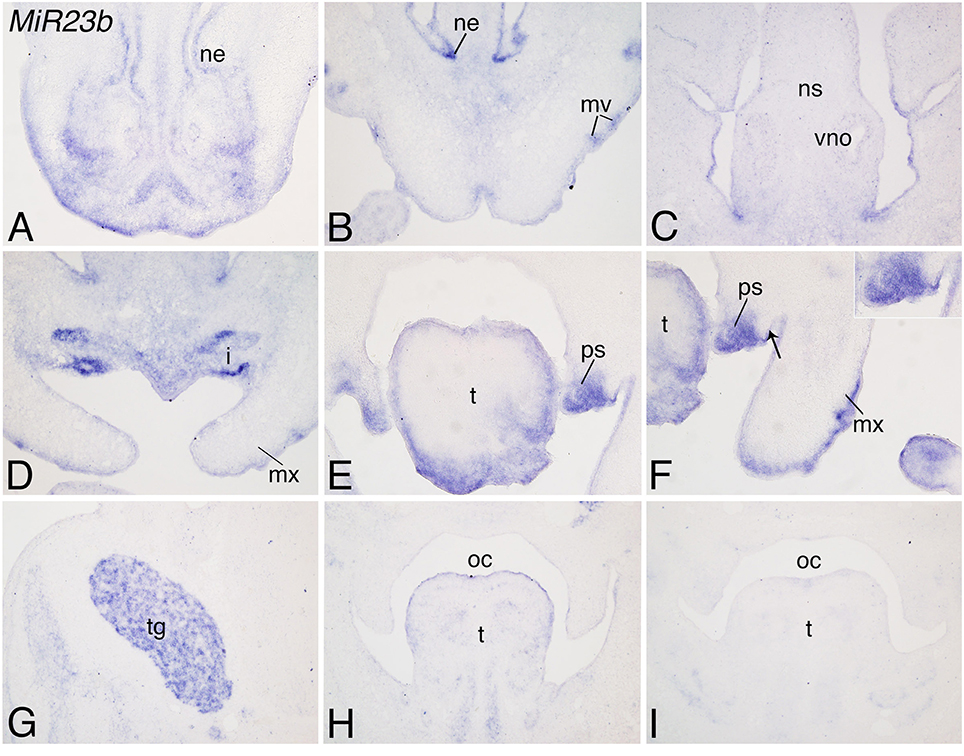
Figure 3. Expression of Mir23b in mouse facial structures at E12.5. ISH analysis in frozen frontal sections through the head of E12.5 mouse embryos. (A–C) Mir23b is moderately expressed in the nasal epithelium epithelium (ne), mystacial vibrissae (mv), nasal septum (ns), and vomeronasal organ (vo). (D–F) Mir23b is also expressed in the upper incisors (i), tongue (t), maxillary epithelium (te), and palatal shelves (ps). The arrow in (F) denotes the epithelium where Mir23b expression begins. (G–I) More posteriorly, expression is observed in the trigeminal ganglion (tg; G), posterior tongue (t; H,I). i, incisor; mx, maxilla; oc, oral cavity.
Like MiR23b, MiR133b was also strongly expressed in the craniofacial region at E12.5. Weak expression was observed in the nasal epithelium, mystacial vibrissae and maxilla (Figures 4A–C), but strong expression was observed in facial musculature, including the intrinsic and extrinsic musculature of the tongue and eye (Figures 4D–I) and facial muscles (including the masseter muscle (arrow; Figure 4F). Expression of MiR133b was not observed in the maxilla or palatal shelves, suggesting that the expression observed by miRNA-seq might reflect presence of other tissue in dissected samples. Like Mir23b, Mir133b exists in a cluster with Mir206, which had a similar pattern of expression to that of Mir133b. Message was primarily detected in facial muscles (Supplemental Figures 4E,F), with message also detected in the cornea and lens of the eye (Supplemental Figure 4A). Further, like the comparison between MiR23b and MiR24.1, expression of MiR206 was much weaker than the expression observed for MiR133b.
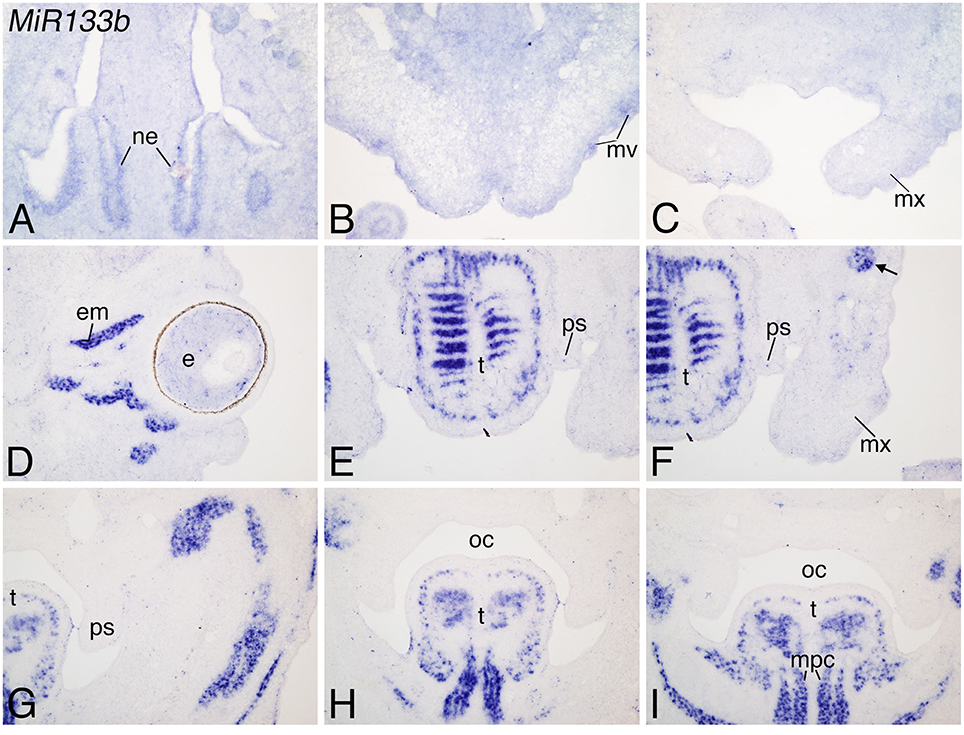
Figure 4. Expression of Mir133b in mouse facial muscles at E12.5. ISH analysis in frozen frontal sections through the head of E12.5 mouse embryos. (A–C) Mir133b is weakly expressed in the nasal epithelium (ne; A), mystacial vibrissae (mv; B), and maxilla (mx); (D–F). (mx); (D–F). Mir133b is strongly expressed in facial muscles, including the masseter (ma), and in the muscles of the eye (em; D) and tongue muscle (t; E–I) Expression is not observed in the palatal shelves (ps; E,F). (G–I) Posterior expression continues continues in the tongue muscles. e, eye; oc, oral cavity.
Expression of mir23b and mir133b is Conserved in Zebrafish Facial Structures
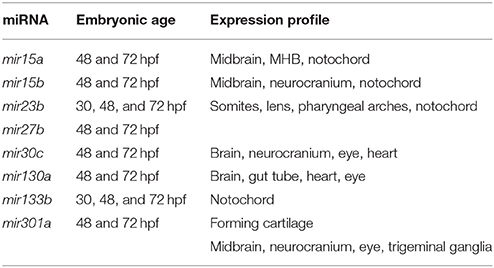
Based on analysis of mir140 action, miRNA function during facial development is also present in zebrafish embryos. Similarly, we found that a selected subset of the miRNAs from Table 1 were also expressed in the head region of 30-hours post fertilization (hpf) zebrafish embryos (Table 3 and Supplemental Figure 10). To examine whether the pattern of expression of mir23b and mir133b was also conserved between mouse and zebrafish embryos, we examined expression of both miRNAs in 30–72 hpf embryos. Expression of mir23b was detected in the head and pharyngeal arch mesenchyme (Figure 5A) and in the somitic mesoderm (Figure 5D) at 30 hpf. Diffuse expression was also present in the eye (Figure 5A). At 48 hpf, mir23b expression was still present in the head and pharyngeal arch mesenchyme while also appearing in the otic vesicle (Figure 5B). Expression was also observed in the trunk muscle and notochord (Figure 5E). By 72 hpf, expression remained in cranial muscle (Figures 5C,G) while also being present in the somite-derived trunk muscle and notochord (Figure 5F) and in ceratobranchial structures (arrows, Figure 5G).
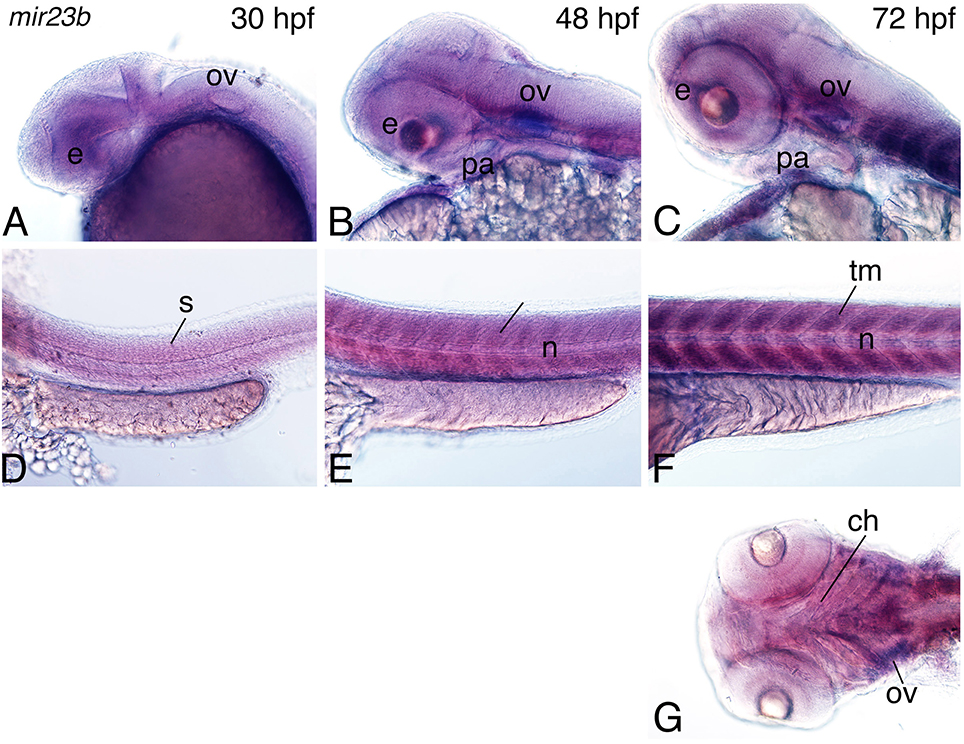
Figure 5. Expression of mir23b in zebrafish embryos. Whole-mount in situ hybridization analysis with a digoxigenin-labeled probe against the mir23b transcript at 30–72 hpf. (A–C) Expression is observed in the otic vesicle (ov; A), weakly in the eye (e), and pharyngeal arch (B,C), and palate (pl; C). (D–F) In the trunk, expression is observed in the trunk muscle the somites (s; E,D) at 30, 48 hpf, and trunk muscle (tm; F) at 72 hpf. (G) Ventral view of expression shows more detailed expression in the cranial muscle including the muscles supporting the craniofacial structures (arrows) and the eye. Anterior is to the left. n, notochord; ch, ceratohyal.
At 30 hpf, mir133b expression was also observed in the head region (around the eye and portions of the brain; Figure 6A), though expression was weaker than that of mir23b. Expression was quite strong in the developing somites (Figure 6D). By 48 hpf, expression around the otic vesicle, eye, and posterior brain was increased (Figures 6B,G). As in 30 hpf embryos, mir133b was strongly expressed in the somites (Figure 6E). By 72 hpf, mir133b expression was observed in trunk muscles (Figure 6F), otic vesicle and heart (Figure 6C). Expression was also present in the facial muscles, including the anterior mandibularis (arrow, Figure 6H) and muscles developing near the ceratobranchials, including the stemohyoideus (arrowheads, Figure 6H).
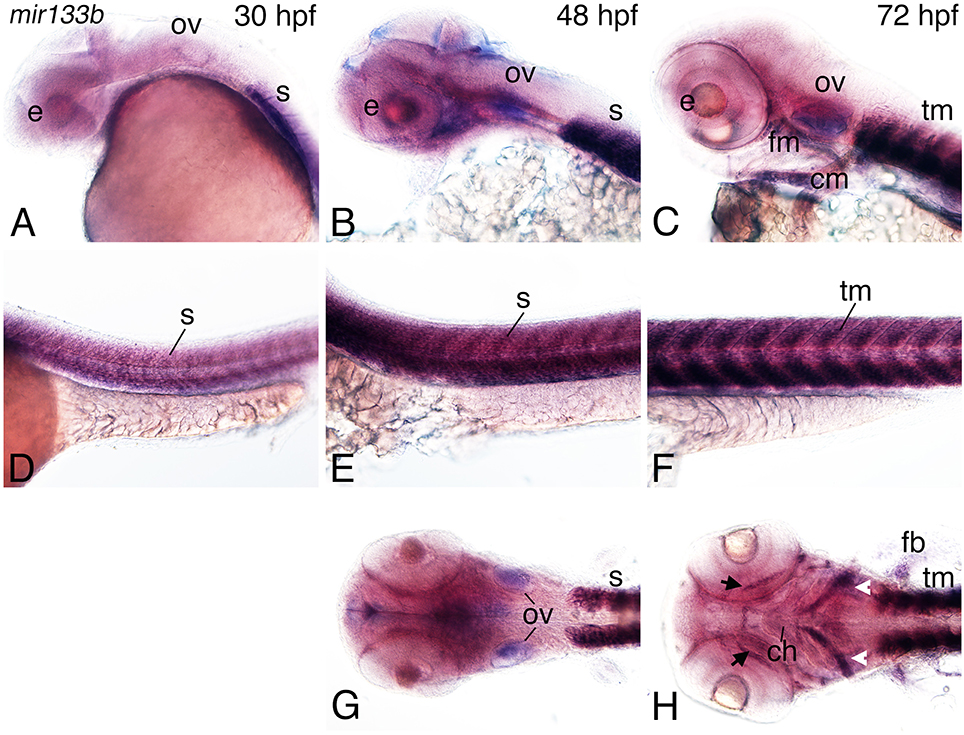
Figure 6. Expression of mir133b in zebrafish embryos. Whole-mount in situ hybridization analysis with a digoxigenin-labeled probe against mir133b at 30–72 hpf. (A–C) Expression is observed in the developing pharyngeal region, including at 48 hpf in the facial muscle (fm) and otic vessicle (B,G). (D–F) Strong expression of miR133b is observed in the somites (s; D) at 30 hpf, somites (E), and pectoral fin (pf) at 48 hpf (H) and facial muscle (fm; C), cardiac muscle (cm; C), and trunk muscle (tm; F) at 72 hpf, including the anterior mandibularis (arrows) and stemohyoideus (arrowheads) facial muscles muscles. Anterior is to the left. e, eye; tm, trunk muscle; n, notochord; ch, ceratohyal.
mir23b and mir133b Overexpression Results in Viscerocranial and Neurocranial Defects in Zebrafish
Two potential methods for assessing function of genes in zebrafish are over-expression and gene inactivation. While Crispr-Cas9-mediated gene inactivation is underway, we began our analysis of potential function by injecting 1–2 cell zebrafish embryos with duplex RNA for MiR23b and MiR133b examining cartilage development at 6 dpf. Overexpression of miRNA duplex is more likely to generate a phenotype, as increasing the repressor function will result in reduced gene expression of the miRNA gene targets. In the viscerocranium, MiR23b duplex injection resulted in aberrant development of Meckel's cartilage and the ceratohyal (Figure 7B). In addition, ectopic cartilage extended from the basihyal to the medial aspect of Meckel's cartilage (23/128; 18%; Figure 7B). Two bilateral ectopic cartilages also extended anteriorly from Meckel's cartilage. Morphological changes were also present in the neurocranium, including a slight increase in the width of the ethmoid plate likely resulting from a shortening of the trabeculae (74/128; 58%; Figures 7F,I) as compared to standard control MiR injected embryos (n = 10; Figures 7D,H,I) and control non-injected embryos (Figures 7A,E).
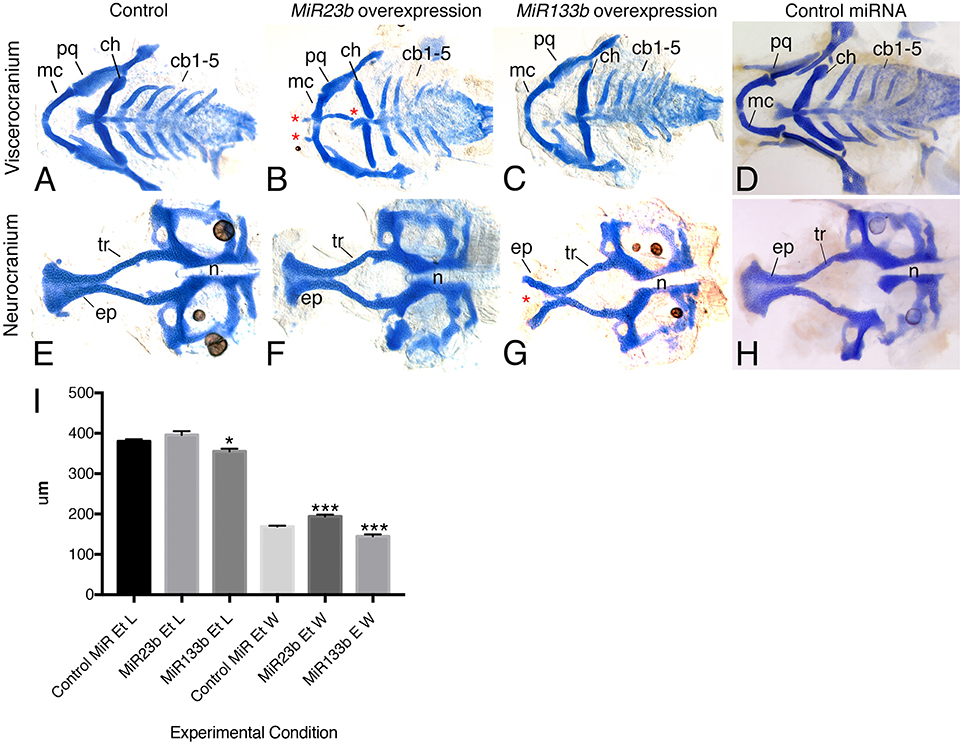
Figure 7. Injection of MiR133b and MiR23b RNA duplexes resulted in facial defects. Alcian blue stain of 6 dpf zebrafish larvae, flat mounted ventral views, anterior is to the left. (A,D,E,H) Control embryos, either uninjected or 33 μM control miR-injected, display wild type type craniofacial cartilage in both the viscerocranium and neurocranium. (B,F) Injection of 33 μM RNA duplex of MiR23b leds to a slight increase in the width of the ethmoid plate, likely resulting from shortening of the trabeculae (tr) (F), and production of ectopic cartilage (*; B) in the B) in the viscerocranium. (C,G) Injection of 6.25 μM RNA duplex of MiR133b resulted in hypoplastic cartilage structure and a cleft (*) in the ethmoid plate (ep; G,I). (I) Quantification of ethmoid plate length and width comparing standard control MiR (n = 10) injected with 33 μM compared to MiR23b (n = 9) and MiR133b (n = 9). Elements were measured and the mean and standard deviation for each are: Ethmoid plate length for control MiR, 380 ± 13.23 μm; MiR23b, 396 ± 27.13 μm; and MiR133b, 355 ± 19.27 μm; Ethmoid plate width for control MiR, 169.2 ± 4.92 μm; MiR23b, 193.9 ± 193.9 ± 14.09 μm; and MiR133b: 144.7 ± 14.7μm. Student's (Welsh's) T-test was used to compare to the standard control using GraphPad PRISM. *p < 0.02 and ***p < 0.0008. Anterior is to the left. cb, ceratobranchial; ch, ceratohyal; mc, Meckel's cartilage; n, notochord; pq, palatoquadrate.
Injection of duplex RNA for MiR133b resulted in the formation of a cleft in the ethmoid plate (40/89; 45%; Figure 7G) and a general reduction in the overall size of the neurocranium, with a significant reduction in both the ethmoid plate width and length (46/89; 52%; Figures 7G,I). Injected animals also showed a mild change in the viscerocranium, including a reduction in the size of the ceratohyal (Figure 7C).
Discussion
miRNAs have well defined roles in numerous developmental process, including craniofacial development (Tavares et al., 2015). We have shown here that numerous miRNAs are expressed within the developing midface, with expression patterns for some of these suggesting distinct functions in a variety of tissues. In addition, we have shown that over-expression of mir23b and mir133b results in changes in craniofacial cartilage morphogenesis. Together, results from our study illustrate the utility of an approach to quickly assess potential miRNA function during vertebrate morphogenesis.
Identification of miRNAs in Craniofacial Development
In addition to the identification of novel miRNAs expressed in the craniofacial complex, several miRNAs identified in this study as differentially expressed between facial prominences and over time have been identified to play a role in development in other systems. Mir199a, which we found to be enriched in the palate as compared to the FNP at E13.5, is involved in aspects of chondrogenesis and osteogenesis (Suomi et al., 2008; Lin et al., 2009). Similarly, Mir92a which is in the Mirc1 cluster on mouse chromosome 14 containing Mir17, Mir18, Mir19a, Mir20a, Mir19b-1, and Mir92a-1, is required to promote proliferation of orofacial development (Ning et al., 2013). Thus, these data confirm and validate the deep sequencing data. Other groups have performed miRNA expression profiling of the developing mouse orofacial region using microarrays (Mukhopadhyay et al., 2010) and have found similar differential expression across time for miRNAs that included Mir133a and Mir133b. Interestingly, Mir23b was not identified by microarray analysis. This may be due to the retrospective nature of microarray studies, as they are limited by the total number of miRNAs that are present on the microarray chip. This approach may exclude all of the transcribed miRNAs in the genome. By definition, the inclusion of miRNAs on microarray chips means that the miRNA has already been identified and annotated. Furthermore, because microarrays are generally based on genome sequence, they may not assay miRNAs that originate by post-transcriptional editing (de Hoon et al., 2010). In contrast, miRNA-seq is prospective: it identifies all miRNAs present in a sample, regardless of whether they have been annotated or not or whether they have experienced editing. Thus, miRNA-seq has the power to identify novel and edited miRNAs in addition to known miRNAs.
miRNA-seq was recently used on avian embryos, in which dissection of the chick, quail and duck FNPs followed by miRNA-seq identified 170 miRNAs that were differentially expressed between the three species (Powder et al., 2012). Interestingly, several miRNAs were found to be avian-specific, suggesting that miRNAs may have promoted the evolutionary diversification of facial shape and beak formation.
Potential Mir23b and Mir133b Functions and Targets
Here we have shown that Mir23b is expressed in the developing face of mouse embryos and in the head of zebrafish embryos and that its overexpression in zebrafish embryos results in ectopic cartilage structures in the viscerocranium. This may indicate roles for Mir23b in regulating either patterning of the NCC-derived mesenchyme or later chondrogenesis. One of the interesting aspects our data analysis (Figure 1) is that Mir27b expression is also present in the developing midface, with its expression mirroring that of Mir23b. In mouse, Mir23b is part of a miRNA cluster that includes Mir23b, Mir27b, Mir3074.1, and Mir24.1. In zebrafish, this corresponds to mir23b, mir27d, and mir24.1. mir23b and mir27b are separated by less than 200 bp, though it is not clear that their expression is co-regulated. In the fetal mouse liver, the Mir23b cluster regulates cell fate switch between hepatocytes and bile duct cells by regulating expression of Smad3, 4, and 5 and thereby repressing TGF-β signaling (Rogler et al., 2009). This negative regulation of TGF-β signaling is interesting, as proper regulation of TGF-β signaling is crucial for proper craniofacial development (Behnan et al., 2005). Marfan syndrome results from aberrant TGF-β signaling due to the failure of fibrullin-1 to bind to and sequester the latent form of TGF-β (Neptune et al., 2003; Chaudhry et al., 2007). Conversely, loss of TGF-β signaling is also detrimental to midfacial development, with loss of numerous TGF family members leading to facial birth defects (Iwata et al., 2011), illustrating the importance of miRNA regulation. While our miRNA-seq data suggests that the two miRNAs are co-expressed, further analysis of embryonic expression and loss-of-function phenotypes for individual miRNAs and the clusters will be required to fully understand their function. This is especially true for Mir23b and Mir27b, as while both work concurrently to drive cardiomyocyte development from ES cells in vitro, Mir23b subsequently controls the later beating phenotype of differentiated cells while Mir27b functions to inhibit this event (Chinchilla et al., 2011; Wang et al., 2012). Our analysis of expression and function in zebrafish suggest that mir23b is expressed in the pharyngeal arch mesenchyme and potentially functions to promote proliferation of chondrocytes, such that when overexpressed, ectopic cartilage arises.
Mir133b resides in a cluster that includes Mir206 and Mir133b. This family is referred to as myomiRs because they regulate genes involved in adult muscle formation. In addition, Mir133b is down-regulated in several cancers, including muscle rhabdomyosarcoma, osteosarcoma, and prostate, colorectal and gastric cancers (Namløs et al., 2012; Qin et al., 2012; Mo et al., 2013). In these abnormal contexts, MIR133b in human cervical carcinoma targets EGFR and FGFR1, similarly acting as a tumor suppressor (Namløs et al., 2012). Interestingly, both EGF and FGF signaling have been implicated in craniofacial development. Mutations in EGF signaling have been implicated in human clefting (Falagan-Lotsch et al., 2015) and cranial suture formation in mice (Rawlins et al., 2008). More roles have been ascribed for FGF signaling in craniofacial development, with FGFR1 specifically linked to skeletal dysplasias and craniosynostosis in both humans and mice, suggesting a mechanism by which Mir133b may regulate craniofacial development (Moosa and Wollnik, 2016). Changes in facial muscle can affect development of facial bone and cartilages (Reider et al., 2012). From our expression analysis, it is plausible that overexpression of Mir133b may lead to changes in facial muscle which affects subsequent viscerocranium development.
In addition, Mir133b is involved in the differentiation of dopaminergic neurons. Zebrafish mir133b is expressed in the midbrain at low levels and regulates pitx3 to control dopaminergic neuron differentiation (Sanchez-Simon et al., 2010). In contrast, mice in which Mir133b has been inactivated have normal dopaminergic neuron numbers and normal PITX3 protein levels (Heyer et al., 2012) even though Mir133b can target the Pitx3 message. This suggests the possibility that other Mir133 family members with the same seed sequence (GGACCAAA; i.e., Mir133a, Mir133c) can compensate for loss of Mir133b. Mir133b is clustered in the genome with Mir 206.1, which does not have the same seed sequence but is predicted to bind some of the same targets in mouse including Histone Deacetylase 4, DNA Polymerase α, and Connexin43 (Anderson et al., 2006; Chen et al., 2006; Kim et al., 2006; Goljanek-Whysall et al., 2012). mir133b has the potential to target the same set of myogenic targets in zebrafish, but only Histone Deacetylase 4 contains a seed sequence for mir133b. More work is needed to distinguish between these possibilities. While we have not determined the numbers of dopaminergic neurons in zebrafish in which mir133b is over-expressed, we do see specific defects in cartilage differentiation, including hypoplasia of the ethmoid plate and specific gaps or missing cartilage in the viscerocranium, suggesting that mir133b may act non-cell autonomously to regulate cartilage differentiation. While there is little known about a direct role of mir133b on the development of the craniofacial cartilage, these results suggest that it is involved in both muscle and neuronal development, both of which can influence, either directly or indirectly, formation of the craniofacial complex. In summary, our results illustrate multiple MiRNAs are expressed in the developing face. This analysis will allow for more focused analysis of miR function in both zebrafish and mouse craniofacial development.
Author Contributions
Experiments were designed by DC and KA in consultation with JP. All mouse and zebrafish experiments were performed by HD with help from BE. The RNA-seq was performed by BE and JP with bioinformatics performed by PB and JH. HD, KA, and DC analyzed and interpreted the data, and wrote the manuscript. All authors commented on the manuscript.
Funding
This work was supported by a grant from NIH/NIDCR (DE020076) to DC, KA, and JP.
Conflict of Interest Statement
The authors declare that the research was conducted in the absence of any commercial or financial relationships that could be construed as a potential conflict of interest.
Acknowledgments
We appreciate the excellent fish care provided by Morgan Singleton.
Supplementary Material
The Supplementary Material for this article can be found online at: http://journal.frontiersin.org/article/10.3389/fphys.2016.00281
References
Anderson, C., Catoe, H., and Werner, R. (2006). MIR-206 regulates connexin43 expression during skeletal muscle development. Nucleic Acids Res. 34, 5863–5871. doi: 10.1093/nar/gkl743
Behnan, S. M., Guo, C., Gong, T. W., Shum, L., and Gong, S. G. (2005). Gene and protein expression of transforming growth factor beta 2 gene during murine primary palatogenesis. Differentiation 73, 233–239. doi: 10.1111/j.1432-0436.2005.00022.x
Benjamini, Y., and Hochberg, Y. (1995). Controlling the false discovery rates: a practical and powerful approach to multiple testing. J. R. Stat. Soc. B 57, 289–300.
Birkholz, D. A., Olesnicky Killian, E. C., George, K. M., and Artinger, K. B. (2009). Prdm1a is necessary for posterior pharyngeal arch development in zebrafish. Dev. Dyn. 238, 2575–2587. doi: 10.1002/dvdy.22090
Bronner-Fraser, M. (1995). Origins and developmental potential of the neural crest. Exp. Cell Res. 218, 405–417. doi: 10.1006/excr.1995.1173
Chai, Y., and Maxson, R. E. Jr. (2006). Recent advances in craniofacial morphogenesis. Dev. Dyn. 235, 2353–2375. doi: 10.1002/dvdy.20833
Chaudhry, S. S., Cain, S. A., Morgan, A., Dallas, S. L., Shuttleworth, C. A., and Keilty, C. M. (2007). Fibrillin-1 regulates the bioavailability of TGFbeta1. J. Cell Biol. 176, 355–367. doi: 10.1083/jcb.200608167
Chen, B., Li, H., Zeng, X., Yang, P., Liu, X., Zhao, X., et al. (2012). Roles of microRNA on cancer cell metabolism. J. Transl. Med. 10:228. doi: 10.1186/1479-5876-10-228
Chen, J. F., Mandel, E. M., Thomson, J. M., Wu, Q., Callis, T. E., Hammond, S. M., et al. (2006). The role of microRNA-1 and microRNA-133 in skeletal muscle proliferation and differentiation. Nat. Genet. 38, 228–233. doi: 10.1038/ng1725
Chinchilla, A., Lozano, E., Daimi, H., Esteban, F. J., Crist, C., Aranega, A. E., et al. (2011). MicroRNA profiling during mouse ventricular maturation: a role for miR-27 modulating Mef2c expression. Cardiovasc. Res. 89, 98–108. doi: 10.1093/cvr/cvq264
Clouthier, D. E., Hosoda, K., Richardson, J. A., Williams, S. C., Yanagisawa, H., Kuwaki, T., et al. (1998). Cranial and cardiac neural crest defects in endothelin-A receptor-deficient mice. Development 125, 813–824.
Clouthier, D. E., Passos-Bueno, M. R., Tavares, A. L. P., Lyonnet, S., Amiel, J., and Gordon, C. T. (2013). Understanding the basis of Auriculocondylar syndrome: insights from human, mouse and zebrafish studies. Am. J. Med. Genet. C Semin. Med. Genet. 163, 306–317. doi: 10.1002/ajmg.c.31376
Couly, G. F., Grapin-Botton, A., Coltey, P., and Le Douarin, N. M. (1996). The regeneration of the cephalic neural crest, a problem revisited: the regenerating cells originate from the contralateral or from the anterior and posterior neural fold. Development 122, 3393–3407.
de Hoon, M. J., Taft, R. J., Hashimoto, T., Kanamori-Katayama, M., Kawaji, H., Kawano, M., et al. (2010). Cross-mapping and the identification of editing sites in mature microRNAs in high-throughput sequencing libraries. Genome Res. 20, 257–264. doi: 10.1101/gr.095273.109
de Pontual, L., Yao, E., Callier, P., Faivre, L., Drouin, V., Cariou, S., et al. (2011). Germline deletion of the miR-17 approximately 92 cluster causes skeletal and growth defects in humans. Nat. Genet. 43, 1026–1030. doi: 10.1038/ng.915
Desvignes, T., Batzel, P., Berezilkow, E., Eilbeck, K., Eppig, J. T., McAndrews, M. S., et al. (2015). miRNA nomenclature: a view INcorporating genetic orignins, biosynthetic pathways, and sequence varients. Trends Genet. 11, 613–626. doi: 10.1016/j.tig.2015.09.002
Desvignes, T., Contreras, A., and Postlethwait, J. H. (2014). Evolution of the miR199-214 cluster and vertebrate skeletal development. RNA Biol. 11, 281–294. doi: 10.4161/rna.28141
Dixon, M. J., Marazita, M. L., Beaty, T. H., and Murray, J. C. (2011). Cleft lip and palate: understanding genetic and environmental influences. Nat. Rev. Genet. 12, 167–178. doi: 10.1038/nrg2933
Eberhart, J. K., He, X., Swartz, M. E., Yan, Y. L., Song, H., Boling, T. C., et al. (2008). MicroRNA Mirn140 modulates Pdgf signaling during palatogenesis. Nat. Genet. 40, 290–298. doi: 10.1038/ng.82
Falagan-Lotsch, P., Lopes, T. S., Küchler, E. C., Tannure, P. N., Costa Mde, C., Amorinm, L. M., et al. (2015). The functional EGF+61 polymorphism and nonsyndromic oral clefts susceptibility in a Brazilian population. J. Appl. Oral Sci. 23, 390–396. doi: 10.1590/1678-775720140517
Fernández-Hernando, C., Ramírez, C. M., Goedeke, L., and Suárez, Y. (2013). MicroRNAs in metabolic disease. Arterioscler. Thromb. Vasc. Biol. 33, 178–185. doi: 10.1161/ATVBAHA.112.300144
Goljanek-Whysall, K., Sweetman, D., and Münsterberg, A. E. (2012). microRNAs in skeletal muscle differentiation and disease. Clin. Sci. 123, 611–625. doi: 10.1042/CS20110634
Hausser, J., and Zavolan, M. (2014). Identification and consequences of miRNA-target interactions–beyond repression of gene expression. Nat. Rev. Genet. 15, 599–612. doi: 10.1038/nrg3765
He, X., Yan, Y. L., DeLaurier, A., and Postlethwait, J. H. (2011). Observation of miRNA gene expression in zebrafish embryos by in situ hybridization to microRNA primary transcripts. Zebrafish 8, 1–8. doi: 10.1089/zeb.2010.0680
Hendershot, T. J., Liu, H., Sarkar, A. A., Giovannucci, D. R., Clouthier, D. E., Abe, M., et al. (2007). Expression of Hand2 is sufficient for neurogenesis and cell type-specific gene expression in the enteric nervous system. Dev. Dyn. 236, 93–105. doi: 10.1002/dvdy.20989
Heyer, M. P., Pani, A. K., Smeyne, R. J., Kenny, P. J., and Feng, G. (2012). Normal midbrain dopaminergic neuron development and function in miR-133b mutant mice. J. Neurosci. 32, 10887–10894. doi: 10.1523/JNEUROSCI.1732-12.2012
Huang, T., Liu, Y., Huang, M., Zhao, X., and Cheng, L. (2010). Wnt1-cre-mediated conditional loss of Dicer results in malformation of the midbrain and cerebellum and failure of neural crest and dopaminergic differentiation in mice. J. Mol. Cell Biol. 2, 152–163. doi: 10.1093/jmcb/mjq008
Hutvágner, G., McLachlan, J., Pasquinelli, A. E., Bálint, E., Tuschi, T., and Zamore, P. D. (2001). A cellular function for the RNA-interference enzyme Dicer in the maturation of the let-7 small temporal RNA. Science 293, 834–838. doi: 10.1126/science.1062961
Iwata, J., Parada, C., and Chai, Y. (2011). The mechanism of TGF-b during palate development. Oral Dis. 17, 733–744. doi: 10.1111/j.1601-0825.2011.01806.x
Jens, M., and Rajewsky, N. (2015). Competition between target sites of regulators shapes post-transcriptional gene regulation. Nat. Rev. Genet. 16, 113–126. doi: 10.1038/nrg3853
Johnson, C. W., Hernandez-Lagunas, L., Feng, W., Melvin, V. S., Williams, T., and Artinger, K. B. (2011). Vgll2a is required for neural crest cell survival during zebrafish craniofacial development. Dev. Biol. 357, 269–281. doi: 10.1016/j.ydbio.2011.06.034
Kannu, P., Campos-Xavier, A. B., Hull, D., Martinet, D., Ballhausen, D., and Bonafé, L. (2013). Post-axial polydactyly type A2, overgrowth and autistic traits associated with a chromosome 13q31.3 microduplication encompassing miR-17-92 and GPC5. Eur. J. Med. Genet. 56, 452–457. doi: 10.1016/j.ejmg.2013.06.001
Kim, H. K., Lee, Y. S., Sivaprasad, U., Malhotra, A., and Dutta, A. (2006). Muscle-specific microRNA miR-206 promotes muscle differentiation. J. Cell Biol. 174, 677–687. doi: 10.1083/jcb.200603008
Kimmel, C. B., Ballard, W. W., Kimmel, S. R., Ullmann, B., and Schilling, T. F. (1995). Stages of embryonic development of the zebrafish. Dev. Dyn. 203, 253–310. doi: 10.1002/aja.1002030302
Knight, R. D., and Schilling, T. F. (2006). Cranial neural crest and development of the head skeleton. Adv. Exp. Med. Biol. 589, 120–133. doi: 10.1007/978-0-387-46954-6_7
Köntges, G., and Lumsden, A. (1996). Rhombencephalic neural crest segmentation is preserved throughout craniofacial ontogeny. Development 122, 3229–3242.
Kuppusamy, K. T., Sperber, H., and Ruohola-Baker, H. (2013). MicroRNA regulation and role in stem cell maintenance, cardiac differentiation and hypertrophy. Curr. Mol. Med. 13, 757–764. doi: 10.2174/1566524011313050007
Lagos-Quintana, M., Rauhut, R., Meyer, J., Borkhardt, A., and Tuschl, T. (2003). New microRNAs from mouse and human. RNA 9, 175–179. doi: 10.1261/rna.2146903
Lai, E. C. (2002). Micro RNAs are complementary to 3′ UTR sequence motifs that mediate negative post-transcriptional regulation. Nat. Genet. 30, 363–364. doi: 10.1038/ng865
Lee, R. C., Feinbaum, R. L., and Ambros, V. (1993). The C. elegans heterochronic gene lin-4 encodes small RNAs with antisense complementarity to lin-14. Cell 75, 843–854.
Lewis, B. P., Shih, I. H., Jones-Rhoades, M. W., Bartel, D. P., and Burge, C. B. (2003). Prediction of mammalian microRNA targets. Cell 115, 787–798. doi: 10.1016/S0092-8674(03)01018-3
Li, L., Meng, T., Jia, Z., Zhu, G., and Shi, B. (2010). Single nucleotide polymorphism associated with nonsyndromic cleft palate influences the processing of miR-140. Am. J. Med. Genet. A 152A, 856–862. doi: 10.1002/ajmg.a.33236
Li, L., Shi, J. Y., Zhu, G. Q., and Shi, B. (2012). MiR-17-92 cluster regulates cell proliferation and collagen synthesis by targeting TGFB pathway in mouse palatal mesenchymal cells. J. Cell. Biochem. 113, 1235–1244. doi: 10.1002/jcb.23457
Li, L., Zhu, G. Q., Meng, T., Shi, J. Y., Wu, J., Xu, X., et al. (2011). Biological and epidemiological evidence of interaction of infant genotypes at Rs7205289 and maternal passive smoking in cleft palate. Am. J. Med. Genet. A 155A, 2940–2948. doi: 10.1002/ajmg.a.34254
Lim, L. P., Glasner, M. E., Yekta, S., Burge, C. B., and Bartel, D. P. (2003). Vertebrate microRNA genes. Science 299, 1540. doi: 10.1126/science.1080372
Lin, E. A., Kong, L., Bai, X. H., Luan, Y., and Liu, C. J. (2009). miR-199a, a bone morphogenic protein 2-responsive MicroRNA, regulates chondrogenesis via direct targeting to Smad1. J. Biol. Chem. 284, 11326–11335. doi: 10.1074/jbc.M807709200
Mo, W., Zhang, J., Li, X., Meng, D., Gao, Y., Yang, S., et al. (2013). Identification of novel AR-targeted microRNAs mediating androgen signalling through critical pathways to regulate cell viability in prostate cancer. PLoS ONE 8:e56592. doi: 10.1371/journal.pone.0056592
Moosa, S., and Wollnik, B. (2016). Altered FGF signalling in congenital craniofacial and skeletal disorders. Semin. Cell Dev. Biol. 53, 1115–1125. doi: 10.1016/j.semcdb.2015.12.005
Morceau, F., Chateauvieux, S., Gaigneaux, A., Dicato, M., and Diederich, M. (2013). Long and short non-coding RNAs as regulators of hematopoietic differentiation. Int. J. Mol. Sci. 14, 14744–14770. doi: 10.3390/ijms140714744
Mukhopadhyay, P., Brock, G., Pihur, V., Webb, C., Pisano, M. M., and Greene, R. M. (2010). Developmental microRNA expression profiling of murine embryonic orofacial tissue. Birth Defects Res. A Clin. Mol. Teratol. 88, 511–534. doi: 10.1002/bdra.20684
Namløs, H. M., Meza-Zepeda, L. A., Barøy, T., Østensen, I. H., Kresse, S. H., Kuijjer, M. L., et al. (2012). Modulation of the osteosarcoma expression phenotype by microRNAs. PLoS ONE 7:e48086. doi: 10.1371/journal.pone.0048086
Neptune, E. R., Frischmeyer, P. A., Arking, D. E., Myers, L., Bunton, T. E., Gayraud, B., et al. (2003). Dysregulation of TGF-beta activation contributes to pathogenesis in Marfan syndrome. Nat. Genet. 33, 407–411. doi: 10.1038/ng1116
Nie, X., Wang, Q., and Jiao, K. (2011). Dicer activity in neural crest cells is essential for craniofacial organogenesis and pharyngeal arch artery morphogenesis. Mech. Dev. 128, 200–207. doi: 10.1016/j.mod.2010.12.002
Ning, G., Liu, X., Dai, M., Meng, A., and Wang, Q. (2013). MicroRNA-92a upholds Bmp signaling by targeting noggin3 during pharyngeal cartilage formation. Dev. Cell 24, 283–295. doi: 10.1016/j.devcel.2012.12.016
Obernosterer, G., Martinez, J., and Alenius, M. (2007). Locked nucleic acid-based in situ detection of microRNAs in mouse tissue sections. Nat. Protoc. 2, 1508–1514. doi: 10.1038/nprot.2007.153
Oommen, S., Otsuka-Tanaka, Y., Imam, N., Kawasaki, M., Kawasaki, K., Jalani-Ghazani, F., et al. (2012). Distinct roles of microRNAs in epithelium and mesenchyme during tooth development. Dev. Dyn. 241, 1465–1472. doi: 10.1002/dvdy.23828
Parpart, S., and Wang, X. W. (2013). microRNA regulation and its consequences in cancer. Curr. Pathobiol. Rep. 1, 71–79. doi: 10.1007/s40139-012-0002-7
Powder, K. E., Ku, Y. C., Brugmann, S. A., Veile, R. A., Renaud, N. A., Helms, J. A., et al. (2012). A cross-species analysis of microRNAs in the developing avian face. PLoS ONE 7:e35111. doi: 10.1371/journal.pone.0035111
Qin, W., Dong, P., Ma, C., Mitchelson, K., Deng, T., Zhang, L., et al. (2012). MicroRNA-133b is a key promoter of cervical carcinoma development through the activation of the ERK and AKT1 pathways. Oncogene 31, 4067–4075. doi: 10.1038/onc.2011.561
Rawlins, J. T., Fernandez, C. R., Cozby, M. E., and Opperman, L. A. (2008). Timing of Egf treatment differentially affects Tgf beta2 induced cranial suture closure. Exp. Biol. Med. (Maywood). 233, 1518–1526. doi: 10.3181/0805-RM-151
Reider, M. J., Green, G. E., Park, S. S., Stamper, B. D., Gordon, C. T., Johnson, J. M., et al. (2012). A human homeotic transformation resulting from mutations in PLCB4 and GNAI3 causes auriculocondylar syndrome. Am. J. Hum. Genet. 90, 907–914. doi: 10.1016/j.ajhg.2012.04.002
Rogler, C. E., Levoci, L., Ader, T., Massimi, A., Tchaikovskaya, T., Norel, R., et al. (2009). MicroRNA-23b cluster microRNAs regulate transforming growth factor-beta/bone morphogenetic protein signaling and liver stem cell differentiation by targeting Smads. Hepatology 50, 575–584. doi: 10.1002/hep.22982
Sanchez-Simon, F. M., Zhang, X. X., Loh, H. H., Law, P. Y., and Rodriguez, R. E. (2010). Morphine regulates dopaminergic neuron differentiation via miR-133b. Mol. Pharmacol. 78, 935–942. doi: 10.1124/mol.110.066837
Schutte, B. C., and Murray, J. C. (1999). The many faces and factors of orofacial clefts. Hum. Mol. Genet. 8, 1853–1859. doi: 10.1093/hmg/8.10.1853
Spritz, R. A. (2001). The genetics and epigenetics of orofacial clefts. Curr. Opin. Pediatr. 13, 556–560. doi: 10.1097/00008480-200112000-00011
Suomi, S., Taipaleenmäki, H., Seppänen, A., Ripatti, T., Väänänen, K., Hentunen, T., et al. (2008). MicroRNAs regulate osteogenesis and chondrogenesis of mouse bone marrow stromal cells. Gene Regul. Syst. Bio. 2, 177–191.
Tassano, E., Di Rocco, M., Signa, S., and Gimelli, G. (2013). De novo 13q31.1-q32.1 interstitial deletion encompassing the miR-17-92 cluster in a patient with Feingold syndrome-2. Am. J. Med. Genet. A 161A, 894–896. doi: 10.1002/ajmg.a.35781
Tavares, A. L., Artinger, K. B., and Clouthier, D. E. (2015). Regulating Craniofacial Development at the 3′ end: MicroRNAs and their function in facial morphogenesis. Curr. Top. Dev. Biol. 115, 335–375. doi: 10.1016/bs.ctdb.2015.08.001
Ventura, A., Young, A. G., Winslow, M. M., Lintault, L., Meissner, A., Erkeland, S. J., et al. (2008). Targeted deletion reveals essential and overlapping functions of the miR-17w92 family of miRNA clusters. Cell 132, 875–886. doi: 10.1016/j.cell.2008.02.019
Walker, M., and Trainor, P. (2006). craniofacial malformations: intrinsic vs extrinsic neural crest cell defects in treacher collins and 22q11 deletion syndromes. Clin. Genet. 69, 471–479. doi: 10.1111/j.0009-9163.2006.00615.x
Wang, J., Bai, Y., Li, H., Greene, S. B., Klysik, E., Yu, W., et al. (2013). MicroRNA-17-92, a direct Ap-2alpha transcriptional target, modulates T-box factor activity in orofacial clefting. PLoS Genet. 9:e1003785. doi: 10.1371/annotation/90602bc3-5052-49ac-a7fb-33210d7c8b4d
Wang, J., Song, Y., Zhang, Y., Xiao, H., Sun, Q., Hou, N., et al. (2012). Cardiomyocyte overexpression of miR-27b induces cardiac hypertrophy and dysfunction in mice. Cell Res. 22, 516–527. doi: 10.1038/cr.2011.132
Watanabe, T., Sato, T., Amano, T., Kawamura, Y., Kawamura, N., Kawaguchi, H., et al. (2008). Dnm3os, a non-coding RNA, is required for normal growth and skeletal development in mice. Dev. Dyn. 237, 3738–3748. doi: 10.1002/dvdy.21787
Westerfield, M. (2000). The Zebrafish Book. A Guide for the Laboratory Use of Zebrafish (Danio rerio). Eugene, OR: University of Oregon Press.
Wightman, B., Ha, I., and Ruvkun, G. (1993). Posttranscriptional Regulation of the heterochronic gene lin-14 by lin-4 mediates temporal pattern formation in C. elegans. Cell 75, 855–862. doi: 10.1016/0092-8674(93)90530-4
Wu, L., Fan, J., and Belasco, J. G. (2006). MicroRNAs direct rapid deadenylation of mRNA. Proc. Natl. Acad. Sci. U.S.A. 103, 4034–4039. doi: 10.1073/pnas.0510928103
Zehir, A., Hua, L. L., Maska, E. L., Morikawa, Y., and Cserjesi, P. (2010). Dicer is required for survival of differentiating neural crest cells. Dev. Biol. 340, 459–467. doi: 10.1016/j.ydbio.2010.01.039
Keywords: craniofacial development, neural crest cell, mouse, zebrafish, RNA duplex, facebase
Citation: Ding H-L, Hooper JE, Batzel P, Eames BF, Postlethwait JH, Artinger KB and Clouthier DE (2016) MicroRNA Profiling during Craniofacial Development: Potential Roles for Mir23b and Mir133b. Front. Physiol. 7:281. doi: 10.3389/fphys.2016.00281
Received: 01 December 2015; Accepted: 21 June 2016;
Published: 14 July 2016.
Edited by:
Thimios Mitsiadis, University of Zurich, SwitzerlandReviewed by:
Ralf Kist, Newcastle University, UKBrad A. Amendt, The University of Iowa, USA
Claudio Cantù, University of Zurich, Switzerland
Copyright © 2016 Ding, Hooper, Batzel, Eames, Postlethwait, Artinger and Clouthier. This is an open-access article distributed under the terms of the Creative Commons Attribution License (CC BY). The use, distribution or reproduction in other forums is permitted, provided the original author(s) or licensor are credited and that the original publication in this journal is cited, in accordance with accepted academic practice. No use, distribution or reproduction is permitted which does not comply with these terms.
*Correspondence: Kristin B. Artinger, a3Jpc3Rpbi5hcnRpbmdlckB1Y2RlbnZlci5lZHU=;
David E. Clouthier, ZGF2aWQuY2xvdXRoaWVyQHVjZGVudmVyLmVkdQ==
†Present Address: Hai-Lei Ding, Laboratory of Anesthesiology, Xuzhou Medical College, Xuzhou, Jiangsu, China
 Hai-Lei Ding1†
 Joan E. Hooper
 Peter Batzel
 John H. Postlethwait
 Kristin B. Artinger
 David E. Clouthier