 Xiang Zhang
 Jan A. Kuivenhoven2
- 1Department of Pediatrics, Center for Liver Digestive and Metabolic Diseases, University of Groningen, University Medical Center Groningen, Groningen, Netherlands
- 2Section Molecular Genetics, Department of Pediatrics, University of Groningen, University Medical Center Groningen, Groningen, Netherlands
- 3Department of Laboratory Medicine, Center for Liver Digestive and Metabolic Diseases, University of Groningen, University Medical Center Groningen, Groningen, Netherlands
When considering the variation in the genome, transcriptome, proteome and metabolome, and their interaction with the environment, every individual can be rightfully considered as a unique biological entity. Individualized medicine promises to take this uniqueness into account to optimize disease treatment and thereby improve health benefits for every patient. The success of individualized medicine relies on a precise understanding of the genotype-phenotype relationship. Although omics technologies advance rapidly, there are several challenges that need to be overcome: Next generation sequencing can efficiently decipher genomic sequences, epigenetic changes, and transcriptomic variation in patients, but it does not automatically indicate how or whether the identified variation will cause pathological changes. This is likely due to the inability to account for (1) the consequences of gene-gene and gene-environment interactions, and (2) (post)transcriptional as well as (post)translational processes that eventually determine the concentration of key metabolites. The technologies to accurately measure changes in these latter layers are still under development, and such measurements in humans are also mainly restricted to blood and circulating cells. Despite these challenges, it is already possible to track dynamic changes in the human interactome in healthy and diseased states by using the integration of multi-omics data. In this review, we evaluate the potential value of current major bioinformatics and systems biology-based approaches, including genome wide association studies, epigenetics, gene regulatory and protein-protein interaction networks, and genome-scale metabolic modeling. Moreover, we address the question whether integrative analysis of personal multi-omics data will help understanding of personal genotype-phenotype relationships.
1. Introduction
Humans share the same genes but do not have identical DNA sequences. The latest 1000 Genomes Project reported over 84,000,000 single nucleotide polymorphisms (SNPs), 3,000,000 short insertions/deletions, and 60,000 structural variants in 2504 subjects from 26 populations, by applying whole genome sequencing as well as exome sequencing and microarray genotyping technologies (1000 Genomes Project Consortium et al., 2015). While there are large differences in the presence of both rare and common variants, it has been reported that every subject carries around 250–300 loss-of-function variants that lead gene products to having less or no function (1000 Genomes Project Consortium et al., 2010, 2012; UK10K Consortium et al., 2015). Nowadays, whole genome sequencing allows the determination of the entire DNA sequence of an individual, and the resulting genomic information is believed to enable prediction of disease risk and optimization of treatment outcome (Sadee, 2011). In practice, predicting disease phenotypes from genetic sequences is extremely challenging because the genotype-phenotype relationship is far more complex than anticipated. A single gene can be associated with multiple disease phenotypes while a single disease phenotype can be caused by mutations in multiple genes (Barabási et al., 2011). Importantly, mutations do not have identical effects on individuals due to the individual variation in interaction between genes, proteins, metabolites and environmental factors (Barabási et al., 2011; Kathiresan and Srivastava, 2012).
The complete set of (physical) interactions between molecules, such as genes, proteins and metabolites is known as the interactome (Cusick et al., 2005). In this review, we focus on the interactome in human cells. If we consider genome sequences as stills and phenotypes as a movie, then there must be a biological system which serves as a projector. It is indeed proposed that the interactome that acts as the projector and eventually translates the phenotypic effects determined by both genotypes and environmental factors (Figure 1). Vidal et al. (2011), Emmert-Streib et al. (2014) proposed that most disease phenotypes may be caused by the perturbation of the interactome, in which the products of disease genes were found to interact with each other and cluster as modules (Ghiassian et al., 2015; Menche et al., 2015). These disease modules may overlap each other, explaining the shared associated genes and clinical symptoms of different diseases (Ghiassian et al., 2015; Menche et al., 2015).
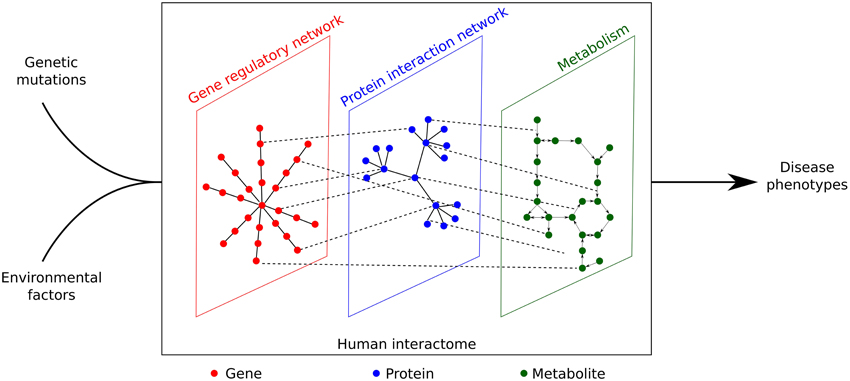
Figure 1. Genetic mutations and environmental effects can only lead to disease phenotypes through perturbation of the human interactome, which is a complex network constituted by gene regulatory network, protein interaction network, and metabolism.
To understand the projector function of the interactome, one must capture all molecular components involved in cellular functions. With the rapid development of omics technologies, it is now possible to readily profile up to 19,797 protein-coding genes, 79,795 protein-coding transcripts, 30,057 proteins, and 4229 metabolites (Psychogios et al., 2011; Harrow et al., 2012; Kim et al., 2014). Since individuality is present in the genomes, epigenomes, transcriptomes, proteomes, and metabolomes, each cell type in every human subject will have a different interactome (Feinberg et al., 2010; Montgomery and Dermitzakis, 2011; Suhre et al., 2011; Forler et al., 2014). In contrast to non-individualized medicine, personalized medicine attempts to address such subject-specific differences with respect to diagnosis and treatment (Topol, 2014). This review aims to give an overview of bioinformatic and network modeling approaches that can be used to develop individualized medicine.
2. Genome-wide Association Studies, Epigenetics and Individualized Medicine
Genome-wide association studies (GWAS) have identified a great number of common single nucleotide polymorphisms (SNPs) that are statistically associated with complex disease phenotypes. The National Human Genome Research Institute (NHGRI) GWAS catalog (www.genome.gov/gwastudies/) includes 1751 curated publications of 11,912 SNPs (Welter et al., 2014). Besides disease-associated SNPs, GWAS also identified SNPs associated with drug efficacy and toxicity, fueling the development of pharmacogenomics and guiding individualized therapies (Sadee, 2011; Crews et al., 2012; Low et al., 2014). The Pharmacogenomics Knowledgebase (PharmGKB, http://www.pharmgkb.org/) (Hewett et al., 2002; Altman, 2007) is a literature-based database which provides useful annotations on genes involved in pharmacokinetics (how the drug is absorbed, distributed, metabolized and eliminated) and pharmacodynamics (how the drug acts on its target and its mechanism of action). In the current release of PharmGKB, curated evidence for 1073 human genes involved in drug response is present.
Epigenetics has been shown to play a key role in the crosstalk between environment and genome, pointing toward the notion that epigenetic marks might explain in part the role of the environment in disease development (Bjornsson et al., 2004; Rivera and Ren, 2013). Major epigenetic alterations include DNA methylation, histone modification, and chromatin remodeling (Rasool et al., 2015). A total number of 127 reference human epigenomes are available on the website of the Roadmap Epigenomics Project (http://www.roadmapepigenomics.org/), including epigenetic landscapes of 111 primary cell and tissue types as well as 16 cell lines (Roadmap Epigenomics Consortium et al., 2015). Due to epigenetic modifications, cells can exhibit different phenotypes in response to various environmental factors, such as nutritional changes and oxidative stress. Feinberg (2007) defined this ability as phenotypic plasticity, whose abnormality is linked to diseases, such as cancers, neurodegenerative and autoimmune disorders (Howell et al., 2009). By integrating GWAS SNPs with epigenetic annotations, Farh et al. (2015) identified that 90% of potentially causal variants of autoimmune diseases are non-coding and 60% map to enhancers of immune cells.
In general, information deriving from GWAS (Table 1) and epigenetics provide possible etiological pathways rather than the exact molecular mechanisms underlying diseases. Burke and Korngiebel (2015) pointed out that although dramatic progress has been made in genomics research, there is still a gap between genomic knowledge and clinical application. To fill such gap, an accurate understanding of the genotype-phenotype relationship, which is hierarchically bridged by DNA, RNA, protein, metabolite and flux, must be developed (Figure 2). The integrative personal omics profile (iPOP) study (Chen et al., 2012) was the first example of individualized medicine attempting to overcome the gap by combining omics data sets. Over a 14-month period which also included two viral infections (HRV: human rhinovirus and RSV: respiratory syncytial virus), dr. Michael Snyder not only profiled his whole genome, but also the transcriptomes of his PBMCs (Peripheral Blood Mononuclear Cells) at 20 different time points, proteomes from PBMCs and serum across 14 time points, and metabolomes of his serum sampled 17 time points, respectively. Integration of the data sets revealed the great potential of the individualized approach. In particular, the genetic variant information of dr. Snyder indicated that he is at risk for developing coronary artery disease, basal cell carcinoma, hypertryglyceridemia, and type 2 diabetes, At the same time, he was found carrying variants that are associated with response to glucose lowering drugs, rosigitazone and metformin. Interestingly, his time series measurements of transcriptome, proteome, and metabolome across healthy states, response to RSV infection, and recovery, enabled the authors to identify an alteration of the insulin signaling response following the RSV infection (Chen et al., 2012).
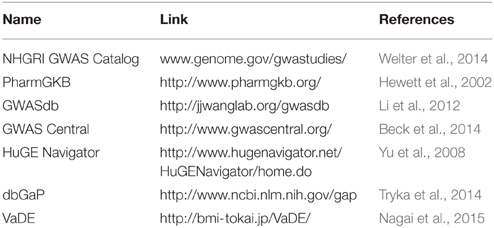
Table 1. Major SNP-trait association databases.
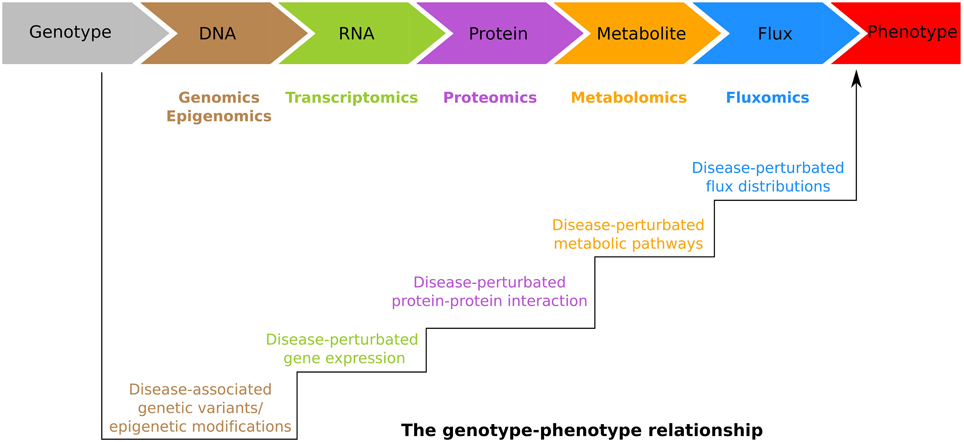
Figure 2. The genotype-phenotype relationship is hierarchically bridged by DNA, RNA, protein, metabolite and flux. These molecules are profiled in the genomics, epigenomics, transcriptomics, proteomics, metabolomics, and fluxomics, respectively. Bioinformatics and systems biology approaches try to translate these omics data sets into unified knowledge. In particular, from genomics and epigenomics, one attempts to identify the disease-associated genetic/epigenetic alterations. From transcriptomics, proteomics, metabolomics, and fluxomics, one aims to identify the genes, proteins, pathways, and the flux distributions involved in disease pathogenesis.
The iPOP study also provided us with some important insights on omics-based individualized medicine. First of all, as sequencing technologies vary considerably from each other due to sensitivity, accuracy, coverage and resolution, the measurements may contain systematic errors. Fortunately, since the human genome is constant over time, profiling with multiple DNA sequencing technologies is a way to improve the accuracy of genetic variant detection in an individual genome. As shown in the iPOP study (Chen et al., 2012), a genetic variant in the protein-coding genes can be trusted, if it is captured by the whole genome sequencing as well as whole exome sequencing. Same as above, we can also trust a genetic variant in the non protein-coding genes, if it is identified by different whole genome sequencing platforms. In contrast to the genome which is static, transcriptome, proteome, and metabolome are more dynamic and changes in their patterns represent the most valuable information for individualized medicine. To minimize systematic errors, the personal transcriptomes, proteomes, and metabolomes should be measured with standardized high-throughput methods at different time points and compared longitudinally. The longitudinal design also allows to perform statistical analysis with a single sample through applying well-established time-series data analysis techniques, such as Fourier spectral analysis and autocorrelation calculations (Chen et al., 2012). However, we have to admit that although the cost of sequencing technologies has dramatically decreased, sequencing with different platforms or multiple time points is unlikely to be performed for more than economic reasons only. In addition, the large volume of omics data sets will require substantial investments in data storage and management.
Topol (2014) rightfully indicated that individualized medicine needs translating large-scale omics data sets into useful knowledge. The approaches of omics data analysis can be roughly categorized as bioinformatics and network-based. Bioinformatics-based approaches often use statistical techniques to assess significant difference or association in the omics data. Their biological interpretation mainly relies on annotations in the community databases. Due to the chosen scope of this review, we are not going into details of these approaches. Network-based approaches, on the other hand, are mainly used to integrate multi-omics simultaneously and the network itself is subsequently used to explore biological insights. In general, network-based approaches first reconstruct biased or unbiased networks in silico, and then use the reconstructed network to interpret the omics data. A biased network indicates that prior biological knowledge is incorporated, whereas an unbiased network is purely data-driven.
Network-based approaches enable us to link genotype to phenotype, and vice versa. The constructed networks can be viewed as maps, in which we can locate GWAS results and improve our understanding the roles of genetic/epigenetic alterations in disease predisposition (Califano et al., 2012; Ghiassian et al., 2015). At the same time, these maps can also help us tracking back molecular mechanisms of given clinical phenotypes. Like what has been shown by Bartel et al. (2015), the “human blood metabolome-transcriptome interface,” a network constructed based on the correlation between serum metabolomes and whole blood transcriptomes of 712 subjects, can identify active pathways/modules with concentrations of blood cholesterol and triglycerides. In the next sections, we focus on three types of network-based approaches, namely gene regulatory network, protein-protein interaction networks, and genome-scale metabolic modeling and discuss them in a schematic manner: i.e., (1) definition and generation; (2) usage and results; (3) strength and weakness. We also discuss their applicability for individualized medicine.
3. Gene Regulatory Networks
3.1. What are Gene Regulatory Networks?
Thousands of gene products are produced from the human genome to support cell function and survival. The protein-coding genes can induce protein synthesis, whereas the non protein-coding genes encode noncoding RNAs (ncRNAs) as their gene products. Gene regulatory networks (GRNs) ensure proper levels of gene products present at the right time in the cell (Karlebach and Shamir, 2008). In the GRN, nodes represent the genes and edges indicate the interactions between gene products.
3.2. How are GRNs Generated?
Similar to gene coexpression networks, GRNs are statistically inferred from a large number of gene expression data sets. However, gene coexpression networks and GRNs are fundamentally different from each other. Pearson's correlation coefficient is used to infer coexpression networks, meaning that there is always a direct interaction for any pair of genes when their expressions are statistically correlated (Stuart et al., 2003). In contrast, GRNs are inferred mainly based on mutual information, which explicitly specifies direct or indirect interaction for each pair of genes. Mutual information defines how much information one random variable X provides about another random variable Y (Cover and Thomas, 2006). For GRNs, the random variables refer to the gene expression levels. Almost all major algorithms developed for GRN inference are mutual information-based and include ARACNe (Algorithm for the Reconstruction of accurate Cellular Networks) (Basso et al., 2005; Margolin et al., 2006), CLR (Context Likelihood of Relatdeness) (Faith et al., 2007), MRNET (Meyer et al., 2007), RN (Relevance Network) (Butte and Kohane, 2000), C3Net (Altay and Emmert-Streib, 2010a), and BC3Net (de Matos Simoes and Emmert-Streib, 2012). Different inference algorithms above were used to reconstruct human B cell GRNs and found the networks contained consistent biological information (Altay and Emmert-Streib, 2010b; de Matos Simoes et al., 2013). We refer readers to a recent review (Emmert-Streib et al., 2014) for more general concepts of GRN inference and applications. In this review, we focus on ARACNe since it is the most widely used method. ARACNe makes use of two steps to infer a genome-wide GRN (Basso et al., 2005). First, ARACNe assesses all the pair of genes by calculating their mutual information. Then, ARACNe discriminates whether the pair of genes are directly linked or separated by any other genes through applying a well-known property of mutual information called the data processing inequality (Basso et al., 2005; Cover and Thomas, 2006).
3.3. What are GRNs Used for?
The rationale of the GRN lies in the idea that genetic/epigenetic alterations contribute to disease phenotypes by inducing changes in a finite number of regulatory bottlenecks, i.e., transcription factors (TFs; Lefebvre et al., 2010; Califano et al., 2012). ARACNe-inferred GRNs are used for identification of the crucial TFs (also called master regulators) that affect the transition from healthy to diseased states and vice versa. The identified master regulators then serve as starting points to search for the driver genetic/epigenetic alterations upstream.
3.4. What Has Come Out?
Lefebvre et al. (2010) applied ARACNe to infer a human B-cell specific GRN from 254 B-cell microarray expression profiles representing 24 distinct phenotypes. The ARACNe-inferred B-cell GRN was subsequently used to identify MYB and FOXM1 as the master regulators of B-cell proliferation. Similarly, an ARACNe-inferred glioblastoma GRN was created and used by Chen et al. (2014) to identify two master regulators, C/EBPβ and C/EBPδ that are known to be involved in mesenchymal subtype of glioblastoma patients (Carro et al., 2010). Furthermore, by combining the genetic variants from the same glioblastoma patients, the authors identified that KLHL9 deletions are upstream of the two identified master regulators and act as driver mutations (Chen et al., 2014).
3.5. Strengths and Weaknesses
One of the major advantages of ARACNe-inferred GRNs is that with whole genome microarray or total RNA sequencing, the entire genome can actually be included in the ARACNe-inferred GRNs. Moreover, since it has been shown that the interactions inferred by the ARACNe algorithm are very likely to represent real biophysical and biochemical interactions (Basso et al., 2005; Lefebvre et al., 2010), ARACNe-inferred GRNs are suitable to explore all the possible interactions related to ncRNAs. This represents an important feature of ARACNe-inferred GRNs, as more or less 90% of the human genome is being transcribed, but only about 3% encodes protein. It is known that long noncoding RNAs (lncRNAs) can interact with DNA and proteins (Quinodoz and Guttman, 2014), and some lncRNA interactions are related to human diseases. For example, Hirata et al. (2015) reported that interaction between lncRNA MALAT1 and histone-lysine N-methyltransferase EZH2 is involved in renal cell carcinoma.
The major drawback of ARACNe is that a large number (≥100) of gene expression profile data covering a broad range of phenotypes is required to infer the target GRNs (Basso et al., 2005; Margolin et al., 2006). This is indeed necessary to explore a significant range of gene expression dynamics in order to obtain adequate mutual information for inferring GRNs (Margolin et al., 2006). Obviously, in practice it is costly and time-consuming.
4. Protein-protein Interaction Networks
4.1. What are Protein-protein Interaction Networks?
Proteins exert their function through interactions with other molecules (e.g., DNA, RNA, proteins, and metabolites). For instance, signal transduction is mediated through protein-protein interactions (PPIs), whereas gene expression (transcription factor-DNA) and metabolism (enzyme-substrate interaction) are mediated by protein-DNA and protein-metabolite interactions, respectively (Sevimoglu and Arga, 2014). PPIs can also refer to formation of dimers, multi-protein complexes or supramolecular assemblies (e.g., actin filaments). Since some proteins are shared by different PPIs, individual PPIs are interconnected. In the PPI network, nodes represent genes whereas edges refer to physical interactions of the respective proteins.
4.2. How are PPI Networks Generated?
There are three main resources of generic human PPI networks. The first resource is from the literature mining. We listed six primary databases (Table 2) that store and combine experimentally supported PPIs from small-scale studies. The second resource is derived from large-scale yeast-two-hybrid (Y2H) screening. In 2005, the first generation of Y2H-based human PPI network, HI-I-05, was introduced and included 2700 high-quality binary PPIs among 1705 proteins (Rual et al., 2005; Stelzl et al., 2005). In 2014, the second generation of Y2H-based human PPI network, HI-II-14, was released (Rolland et al., 2014). This time 13,944 PPIs were identified among 4303 proteins. Both HI-I-05 and HI-II-14 can be downloaded (http://interactome.dfci.harvard.edu/H_sapiens/). In addition to the Y2H system, affinity-purification mass spectrometry (AP-MS) is also developed to profile PPIs in human cells (e.g., human HEK293T, Huttlin et al., 2015). Compared to Y2H which is mainly used to identify binary interactions between two proteins, AP-MS is more focusing on deciphering the composition of protein complexes. The third resource of the human PPI network is the computational prediction, in which machine learning algorithms are applied to calculate the likelihood of interactions between two proteins based on the known interactions in the databases (Table 2). STRING (Search Tool for the Retrieval of Interacting Genes, http://string-db.org/) (Snel et al., 2000) is such a web-server including known and predicted protein interactions of over 2000 organisms. In addition to STRING, databases, such as PIPs (http://www.compbio.dundee.ac.uk/www-pips/) (McDowall et al., 2009) and hPRINT (human Predicted Protein Interactome) (Elefsinioti et al., 2011) also predict PPIs without priori experimental evidence. The hPRINT results can be retrieved in STRING as well (Franceschini et al., 2013).
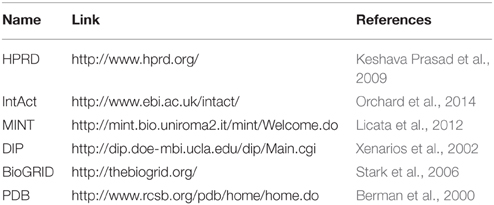
Table 2. Primary sources of protein-protein interactions.
Human proteome studies have shown distinct proteome profiles in different cell and tissue types (Kim et al., 2014; Uhlén et al., 2015). This makes it necessary to specify PPI networks in the target cell and tissue (Schaefer et al., 2013). TissueNet database (http://netbio.bgu.ac.il/tissuenet/) provides such context-specific PPI networks for 16 human tissues (Barshir et al., 2013). A generalized way to construct such context-specific PPI networks is introduced by Magger et al. (2012), who developed a specific algorithm integrating context-specific gene expression data (proteomics or transcriptomics). Gene expression data are used to assess the probability of PPIs in the generic PPI network. If a gene is not expressed, the algorithm can either remove the gene from the generic PPI network or reduce the weight of the interactions associated with the gene.
4.3. What are PPI Networks Used for?
Human PPI networks are used to identify genes, proteins and subnetworks associated with diseases (Sevimoglu and Arga, 2014). They are also used to systematically characterize PPI network perturbations associated with disease mutations. The PPI network perturbations include complete loss of gene products or alteration of PPI arrangement (Zhong et al., 2009; Sahni et al., 2013).
4.4. What Has Come Out?
Goehler et al. (2004) generated a PPI network for Huntington's disease by using the Y2H. From there, they identified GIT1, a G protein-coupled receptor kinase-interacting protein, which directly interacts with huntingtin and turns out to enhance huntingtin aggregation. Based on the generic human PPI network derived from HPRD (Human Protein Reference Database; Keshava Prasad et al., 2009), Jia and Zhao (2014) focused on PPI subnetworks that contain multiple genes frequently mutated in lung adenocarcinoma and melanoma patients. The results showed that the driver mutations interrupted the PPIs that are involved in signaling pathways (e.g., EGF receptor signaling pathway) and biological processes (e.g., DNA repair systems; Jia and Zhao, 2014). Based on the Y2H protein interaction assays, Sahni et al. (2015) reported that common SNPs from healthy subjects rarely affected PPIs, but around 60% of human disease-associated missense mutations perturbed PPIs. Furthermore, they also noticed that different mutations in the same gene can influence different PPIs.
4.5. Strengths and Weaknesses
Unlike the ARACNe-inferred GRNs, in which the interactions are statistically inferred from the gene expression levels, PPI networks derived from the literature or Y2H screening are experimentally supported. Therefore, perturbations in PPI networks can be used with confidence to elucidate the molecular basis of diseases as described in the examples given above.
A weakness of the PPI networks is incomplete coverage. According to the up-to-date GENCODE release 23 (), there are 19,797 protein-coding genes in the human genome. The number of genes covered by the most comprehensive human PPI network, HI-II-14 (Rolland et al., 2014), is only 3146 which suggests that there is still a long way to go. In addition, PPIs are often evaluated under unphysiological conditions, leading to false positive and negative PPIs included in generic PPI networks (Schaefer et al., 2013). Kuchaiev et al. (2009) reported that the false positive and negative rate of Y2H could be as high as 64 and 71%, respectively.
5. Genome-scale Metabolic Models
5.1. What are Genome-scale Metabolic Models?
Metabolites are implicated in maintenance of cellular functions and production of building blocks (e.g., purines and pyrimidines) for macromolecular biosynthesis. Computational biologists have reconstructed all metabolic reactions into one large network and name it “genome-scale metabolic model.” GEMs and GSMMs are typically used as abbreviations in the literature.
5.2. How are GEMs Generated?
In general, GEMs are constructed by using enzyme-mediated reactions, transporters and intermediary metabolites (Bordbar et al., 2014). The first landmark studies in this field emerged in 2007 when Recon1 (Duarte et al., 2007) and EHMN (Edinburgh Human Metabolic Network) (Ma et al., 2007) were manually reconstructed based on genomic and experimental data in the literature. These two human metabolic networks were merged into the HMR (Human Metabolic Reaction) database (Agren et al., 2012). In 2010, a human hepatocyte-specific metabolic network, HepatoNet1, was reconstructed based on experimental evidence for presence of metabolic reactions in human hepatocytes (Gille et al., 2010). The experimental evidence was manually curated based on information from over 1500 scientific articles. In 2013, the continuing development of Recon1, EHMN, and HepatoNet1 leads to the release of Recon2 (Thiele et al., 2013). A year later, another reconstruction of human hepatocyte-specific metabolic network, iHepatocytes2322, together with a new release of the Human Metabolic Reaction database, HMR2, were published (Mardinoglu et al., 2014).
Recon2 (Thiele et al., 2013) and HMR2 (Mardinoglu et al., 2014) represents all current knowledge of global human metabolism. Since different cell/tissue types may harbor synonymous enzymes to catalyze the same reaction and different metabolic pathways may result in the same product (Uhlén et al., 2015), it is important to reconstruct cell/tissue type specific GEMs to characterize the metabolism of target cells and tissues. For this purpose, algorithms, such as tINIT (task-driven Integrative Network Inference for Tissues) (Agren et al., 2014), GIMME (Gene Inactivity Moderated by Metabolism and Expression) (Becker and Palsson, 2008), and mCADRE (metabolic Context-specificity Assessed by Deterministic Reaction Evaluation) (Wang et al., 2012) are used to generate cell/tissue type specific GEMs from the generic GEMs (e.g., Recon2 or HMR2). These algorithms use abundances of transcripts and proteins to estimate the probability of presence of enzymes in the generic GEMs. We refer readers to an excellent review (Machado and Herrgård, 2014) for more details on the differences between the various algorithms.
5.3. What are GEMs Used for?
Human GEMs, especially cell/tissue type specific GEMs, are mainly used as scaffolds to analyze transcriptomics data obtained from patient samples, in order to identify the metabolic pathways and metabolite biomarkers that are related to disease pathogenesis.
5.4. What Has Come Out?
Using the tINIT algorithm with proteomics and transcriptomics data of human myocytes, Väremo et al. (2015) reconstructed a myocyte-specific GEM, iMyocytes2419, which made it possible to reveal that type 2 diabetes patients show extensive transcriptional changes in reactions involved in pyruvate oxidation, branched-chain amino acid catabolism, and tetrahydroflate metabolism. Mardinoglu et al. (2014) applied iHepatocytes2322 and their previously developed Reporter Metabolite algorithm (Patil and Nielsen, 2005) to analyze transcriptomics data of patients with non-alcoholic fatty liver disease, and identified that concentrations of chondroitin and heparan sulfates may represent novel biomarkers for diagnosing non-alcoholic steatohepatitis. Similar GEM-based analyses have been performed to study diseases such as, Alzheimer's disease (Lewis et al., 2010), obesity (Mardinoglu et al., 2013), and cancer (Agren et al., 2014; Yizhak et al., 2014).
5.5. Strengths and Weaknesses
In our opinion, the major advantage of GEMs is that it allows to study global metabolic flux distributions. The rate of the metabolic reactions in a pathway (metabolic flux) is determined by many aspects, such as protein concentration, protein interaction (signal transduction), enzyme kinetics and metabolite concentrations (Winter and Krömer, 2013). Therefore, metabolic fluxes can be considered as the ultimate outcome of cellular regulation at different levels (Nielsen, 2003). When listing all the reactions as well as their corresponding flux values under a particular condition, one can construct a metabolic flux distribution that represents a particular cellular phenotype in detail.
Currently, 13C stable isotope labeling is the most popular experimental method to measure in vivo fluxes (Blank and Ebert, 2013). By performing 13C fluxomic experiments, Murphy et al. (2013) noticed that different levels of oncoprotein MYC can induce distinct metabolic flux distributions in P493-6 B cells. They showed that high MYC cells as rely more heavily on amino acids and mitochondrial oxidative metabolism than low MYC cells. 13C fluxomics also revealed distinct metabolic flux distributions in different cell lines. Niklas et al. (2011) reported that human neuronal AGE1.HN cells had lower flux rates (around 2.3% of the glucose uptake flux) in the pentose phosphate pathway than other cell lines, such as HEK-293 cells (15%) and hybridoma cells (20%). These 13C fluxomic studies illustrate that various biological conditions can induce distinct metabolic flux distributions.
However, 13C fluxomics cannot deliver us a complete picture of flux distributions in the metabolic network, since only a small number of reactions can be measured. Here, GEMs provide a means to estimate metabolic flux distributions under different conditions relying on a limited number of exchange fluxes, i.e., fluxes of substrates entering the cells and the fluxes of metabolites that are secreted from the cells. It is beyond the scope of this review to explain the related mathematical theory, but we recommend the article by Rossell et al. (2011), in which they formulated how to compute complete set of fluxes from the exchange fluxes.
Bordel et al. (2010) introduced a random sampling method which can calculate means and standard deviations for each flux in the GEM under different experimental conditions, when a limited number of measurements of exchange fluxes are given. By integrating changes in gene expression between different conditions, metabolic reactions can be classified as either transcriptionally regulated (significant changes in both flux and gene expression levels), post-transcriptionally regulated (significant changes in gene expression levels but not flux), or metabolically regulated (significant changes in flux but not gene expression levels). This random sampling method was applied together with the adipocyte-specific GEM, iAdipocytes1809, and helped identifying the fluxes of glucose uptake, fatty acids uptake, oxidative phosphorylation, mitochondrial and peroxisomal β-oxidation, fatty acid metabolism and tricarboxylic acid cycle as being differentially down regulated in obese subjects (Mardinoglu et al., 2013). Gavai et al. (2015) developed a novel algorithm called Lsei-FBA (Lesat-squares with equalities and inequalities Flux Balance Analysis), and identified the fluxes of glycolysis and oxygen uptake as being decreased in brains of Alzheimer's disease patients (29 and 46%, respectively) compared to healthy subjects. Similar to the random sampling method, Lsei-FBA also requires tissue-specific GEMs, and measurements of gene expression as well as exchange fluxes.
The second biggest advantage of GEMs is that up to now it is currently the only platform that can integrate genomics, transcriptomics, proteomics, metabolomics, and fluxomics data. Yizhak et al. (2010) integrated quantitative proteomics and metabolomics with a GEM of the human erythrocyte, and predicted metabolic flux distributions in red blood cells. The flux distribution predictions were found to be consistent with the simulations made by a detailed kinetic model of human red blood cells. Bordbar et al. (2012) analyzed transcriptomics, proteomics, and metabolomics data sets of LPS-stimulated RAW 264.7 cells with a GEM of the RAW 264.7 cell line, and identified a suppressive role for de novo nucleotide synthesis in macrophage activation.
Last but not the least, it has been shown by Uhlén et al. (2015) that the minimum requirement of generating a cell/tissue type specific GEM is a single RNA sequencing profile.
Naturally, GEMs also have their limitations. First of all, although novel metabolite biomarkers for various diseases have been predicted by using cell/tissue type specific GEMs, few of them have been validated in humans, because of either technical limitation of measuring the metabolites in question or difficulty of accessing the patient materials. Secondly, since GEMs focus on metabolic enzyme-coding genes, reactions and pathways, GEMs cannot be used to study signal transduction pathways. Lastly, GEMs do not contain detailed kinetics of enzymes and produce metabolic flux distributions only under steady state conditions.
6. The Future of Individualized Medicine
6.1. Role for GRNs
Regarding individualized medicine, longitudinal transcriptomics derived from cells/tissues of an individual including healthy and diseased states are the ideal resources to assemble an individualized GRN. Zoppoli et al. (2010) introduced TimeDelay-ARACNe to infer GRNs specifically from time-course data. Such ARACNe-inferred GRN provides a personalized map, with which one can locate the genetic mutations identified in the one-dimensional genome sequences in a multi-dimensional network. By integrating gene differential expression information between healthy and diseased states, one can also identify the crucial transcription factors controlling the phenotype transition. Taken together with the network location information, one can make the most of the personal genomic information and further prioritize the damaging effect of genetic mutations.
6.2. Role for PPI Networks
PPI networks are proposed playing a role in buffering the impact of genetic mutations and environmental challenges (Forler et al., 2014; Garcia-Alonso et al., 2014). This opinion has been investigated by Garcia-Alonso et al. (2014), who built up a human PPI network by merging generic PPI networks derived from three public databases (BioGRID, Stark et al., 2006, IntAct, Orchard et al., 2014, and MINT, Licata et al., 2012). They used the reconstructed PPI network to study the effect of genetic variants predicted to be deleterious in the subjects participating in the 1000 Genomes Project, 252 healthy Spanish individuals, and 41 chronic lymphocytic leukemia patients. Interestingly, most of the potentially damaging genetic variants in healthy individuals were located in peripheral regions of the PPI network and did not really perturb the structure of the PPI network. However, when investigating the somatic variants that were predicted to be deleterious in chronic lymphocytic leukemia patients, they noticed that these mutations tended to be in internal regions of the PPI network. The above study indicates that PPI networks can help to identify whether genetic variants may be disrupting PPIs and hence may be important in explaining diseases.
6.3. Role for GEMs
GEMs have already been used successfully for individualized medicine. Agren et al. (2014) reconstructed personalized GEMs for 6 hepatocellular carcinoma patients based on proteomics data, and used these models to identify potential anticancer drug targets for the individual patients. Yizhak et al. (2014) reconstructed personalized GEMs for breast and lung cancer patients based on gene expression measurements obtained from biopsy samples. These personalized GEMs were used to predict the cancer cell growth rate, which was used to infer patient survival.
For successful individualized medicine, it should be realized that it is important to integrate information of cell/tissue type specific GEMs, in an attempt to capture whole-body metabolism. Urine, plasma, and serum are the most common samples from human subjects for diagnostic purpose (Nicholson et al., 2012). Metabolic measurements based on these samples are the results of the crosstalk of many organs and can be regarded as serving the readouts of whole-body metabolism.
Bordbar et al. (2011) build a multi-tissue GEM by integrating adipocyte, hepatocyte and myocyte-specific GEMs via a blood compartment. The assembled multi-tissue GEM was used to study the metabolic differences between non-type 2 diabetes obese and type 2 diabetes obese individuals. They reported that type 2 diabetes obese individuals lack activity in reactions catalyzed by lactate dehydrogenase, catalase and cysteine dioxygenase, comparing to the non-type 2 diabetes obese subjects. Besides integrating metabolism of different tissues and cells, the human gut microbiome is also considered important for whole-body metabolism (Mardinoglu and Nielsen, 2015). Shoaie et al. (2015) reconstructed five GEMs for five representative bacteria in the human gut, including Bacteroides thetaiotanmicron, Eubacterium rectale, Bifidobacterium adolescentis, Faecalibacterium prausnitzii, and Ruminococcus bromii. These GEMs were used to study 45 overweight and obese individuals who were subjected to an energy-restricted, high-protein diet intervention for 6 weeks. The authors reported that the diet intervention decreased the gut microbiota production of short chain fatty acids (acetate, butyrate, and propionate) and amino acids (e.g., alanine, proline and glycine etc.).
6.4. Concluding Remarks
Due to the central role of the interactome in cellular functions, we think that the roadmap of individualized medicine is moving from human genomes to interactomes. However, construction of a complete human interactome is extremely complex and it might take at least another decade (Menche et al., 2015). This review shows that GRNs, PPI networks, GEMs can characterize part of the interactome in cells. Integrating different type of networks may contribute to better understanding of the interactome, and ultimately realizing true individualized medicine.
Author Contributions
XZ wrote the manuscript. JK edited the manuscript. AG edited the manuscript.
Funding
This work was supported by grants CVON-Genius (CVON2011-19) and RESOLVE (FP7 305707).
Conflict of Interest Statement
The authors declare that the research was conducted in the absence of any commercial or financial relationships that could be construed as a potential conflict of interest.
References
1000 Genomes Project Consortium, Abecasis, G. R., Altshuler, D., Auton, A., Brooks, L. D., Durbin, R. M., et al. (2010). A map of human genome variation from population-scale sequencing. Nature 467, 1061–1073. doi: 10.1038/nature09534
1000 Genomes Project Consortium, Abecasis, G. R., Auton, A., Brooks, L. D., DePristo, M. A., Durbin, R. M., et al. (2012). An integrated map of genetic variation from 1,092 human genomes. Nature 491, 56–65. doi: 10.1038/nature11632
1000 Genomes Project Consortium, Auton, A., Brooks, L. D., Durbin, R. M., Garrison, E. P., Kang, H. M., et al. (2015). A global reference for human genetic variation. Nature 526, 68–74. doi: 10.1038/nature15393
Agren, R., Bordel, S., Mardinoglu, A., Pornputtapong, N., Nookaew, I., and Nielsen, J. (2012). Reconstruction of genome-scale active metabolic networks for 69 human cell types and 16 cancer types using init. PLoS Comput. Biol. 8:e1002518. doi: 10.1371/journal.pcbi.1002518
Agren, R., Mardinoglu, A., Asplund, A., Kampf, C., Uhlen, M., and Nielsen, J. (2014). Identification of anticancer drugs for hepatocellular carcinoma through personalized genome-scale metabolic modeling. Mol. Syst. Biol. 10:721. doi: 10.1002/msb.145122
Altay, G., and Emmert-Streib, F. (2010a). Inferring the conservative causal core of gene regulatory networks. BMC Syst. Biol. 4:132. doi: 10.1186/1752-0509-4-132
Altay, G., and Emmert-Streib, F. (2010b). Revealing differences in gene network inference algorithms on the network level by ensemble methods. Bioinformatics 26, 1738–1744. doi: 10.1093/bioinformatics/btq259
Altman, R. B. (2007). Pharmgkb: a logical home for knowledge relating genotype to drug response phenotype. Nat. Genet. 39:426. doi: 10.1038/ng0407-426
Barabási, A. L., Gulbahce, N., and Loscalzo, J. (2011). Network medicine: a network-based approach to human disease. Nat. Rev. Genet. 12, 56–68. doi: 10.1038/nrg2918
Barshir, R., Basha, O., Eluk, A., Smoly, I. Y., Lan, A., and Yeger-Lotem, E. (2013). The tissuenet database of human tissue protein-protein interactions. Nucleic Acids Res. 41, D841–D844. doi: 10.1093/nar/gks1198
Bartel, J., Krumsiek, J., Schramm, K., Adamski, J., Gieger, C., Herder, C., et al. (2015). The human blood metabolome-transcriptome interface. PLoS Genet. 11:e1005274. doi: 10.1371/journal.pgen.1005274
Basso, K., Margolin, A. A., Stolovitzky, G., Klein, U., Dalla-Favera, R., and Califano, A. (2005). Reverse engineering of regulatory networks in human b cells. Nat. Genet. 37, 382–390. doi: 10.1038/ng1532
Beck, T., Hastings, R. K., Gollapudi, S., Free, R. C., and Brookes, A. J. (2014). Gwas central: a comprehensive resource for the comparison and interrogation of genome-wide association studies. Eur. J. Hum. Genet. 22, 949–952. doi: 10.1038/ejhg.2013.274
Becker, S. A., and Palsson, B. O. (2008). Context-specific metabolic networks are consistent with experiments. PLoS Comput. Biol. 4:e1000082. doi: 10.1371/journal.pcbi.1000082
Berman, H. M., Westbrook, J., Feng, Z., Gilliland, G., Bhat, T. N., Weissig, H., et al. (2000). The protein data bank. Nucleic Acids Res. 28, 235–242. doi: 10.1093/nar/28.1.235
Bjornsson, H. T., Fallin, M. D., and Feinberg, A. P. (2004). An integrated epigenetic and genetic approach to common human disease. Trends Genet. 20, 350–358. doi: 10.1016/j.tig.2004.06.009
Blank, L. M., and Ebert, B. E. (2013). From measurement to implementation of metabolic fluxes. Curr. Opin. Biotechnol. 24, 13–21. doi: 10.1016/j.copbio.2012.10.019
Bordbar, A., Feist, A. M., Usaite-Black, R., Woodcock, J., Palsson, B. O., and Famili, I. (2011). A multi-tissue type genome-scale metabolic network for analysis of whole-body systems physiology. BMC Syst. Biol. 5:180. doi: 10.1186/1752-0509-5-180
Bordbar, A., Mo, M. L., Nakayasu, E. S., Schrimpe-Rutledge, A. C., Kim, Y. M., Metz, T. O., et al. (2012). Model-driven multi-omic data analysis elucidates metabolic immunomodulators of macrophage activation. Mol. Syst. Biol. 8, 558. doi: 10.1038/msb.2012.21
Bordbar, A., Monk, J. M., King, Z. A., and Palsson, B. O. (2014). Constraint-based models predict metabolic and associated cellular functions. Nat. Rev. Genet. 15, 107–120. doi: 10.1038/nrg3643
Bordel, S., Agren, R., and Nielsen, J. (2010). Sampling the solution space in genome-scale metabolic networks reveals transcriptional regulation in key enzymes. PLoS Comput. Biol. 6:e1000859. doi: 10.1371/journal.pcbi.1000859
Burke, W., and Korngiebel, D. M. (2015). Closing the gap between knowledge and clinical application: challenges for genomic translation. PLoS Genet. 11:e1004978. doi: 10.1371/journal.pgen.1004978
Butte, A. J., and Kohane, I. S. (2000). Mutual information relevance networks: functional genomic clustering using pairwise entropy measurements. Pac. Symp. Biocomput. 5, 418–429. doi: 10.1002/047174882X
Califano, A., Butte, A. J., Friend, S., Ideker, T., and Schadt, E. (2012). Leveraging models of cell regulation and gwas data in integrative network-based association studies. Nat. Genet. 44, 841–847. doi: 10.1038/ng.2355
Carro, M. S., Lim, W. K., Alvarez, M. J., Bollo, R. J., Zhao, X., Snyder, E. Y., et al. (2010). The transcriptional network for mesenchymal transformation of brain tumours. Nature 463, 318–325. doi: 10.1038/nature08712
Chen, J. C., Alvarez, M. J., Talos, F., Dhruv, H., Rieckhof, G. E., Iyer, A., et al. (2014). Identification of causal genetic drivers of human disease through systems-level analysis of regulatory networks. Cell 159, 402–414. doi: 10.1016/j.cell.2014.09.021
Chen, R., Mias, G. I., Li-Pook-Than, J., Jiang, L., Lam, H. Y. K., Chen, R., et al. (2012). Personal omics profiling reveals dynamic molecular and medical phenotypes. Cell 148, 1293–1307. doi: 10.1016/j.cell.2012.02.009
Cover, T. M., and Thomas, J. A. (2006). Elements of Information Theory, 2nd Edn. New York, NY: Wiley.
Crews, K. R., Hicks, J. K., Pui, C. H., Relling, M. V., and Evans, W. E. (2012). Pharmacogenomics and individualized medicine: translating science into practice. Clin. Pharmacol. Ther. 92, 467–475. doi: 10.1038/clpt.2012.120
Cusick, M. E., Klitgord, N., Vidal, M., and Hill, D. E. (2005). Interactome: gateway into systems biology. Hum. Mol. Genet. 14, R171–R181. doi: 10.1093/hmg/ddi335
de Matos Simoes, R., Dehmer, M., and Emmert-Streib, F. (2013). B-cell lymphoma gene regulatory networks: biological consistency among inference methods. Front. Genet. 4:281. doi: 10.3389/fgene.2013.00281
de Matos Simoes, R., and Emmert-Streib, F. (2012). Bagging statistical network inference from large-scale gene expression data. PLoS ONE 7:e33624. doi: 10.1371/journal.pone.0033624
Duarte, N. C., Becker, S. A., Jamshidi, N., Thiele, I., Mo, M. L., Vo, T. D., et al. (2007). Global reconstruction of the human metabolic network based on genomic and bibliomic data. Proc. Natl. Acad. Sci. U.S.A. 104, 1777–1782. doi: 10.1073/pnas.0610772104
Elefsinioti, A., Saraç, Ö. S., Hegele, A., Plake, C., Hubner, N. C., Poser, I., et al. (2011). Large-scale de novo prediction of physical protein-protein association. Mol. Cell. Proteomics 10:M111.010629. doi: 10.1074/mcp.M111.010629
Emmert-Streib, F., Dehmer, M., and Haibe-Kains, B. (2014). Gene regulatory networks and their applications: understanding biological and medical problems in terms of networks. Front. Cell Dev. Biol. 2:38. doi: 10.3389/fcell.2014.00038
Faith, J. J., Hayete, B., Thaden, J. T., Mogno, I., Wierzbowski, J., Cottarel, G., et al. (2007). Large-scale mapping and validation of escherichia coli transcriptional regulation from a compendium of expression profiles. PLoS Biol. 5:e8. doi: 10.1371/journal.pbio.0050008
Farh, K. K. H., Marson, A., Zhu, J., Kleinewietfeld, M., Housley, W. J., Beik, S., et al. (2015). Genetic and epigenetic fine mapping of causal autoimmune disease variants. Nature 518, 337–343. doi: 10.1038/nature13835
Feinberg, A. P. (2007). Phenotypic plasticity and the epigenetics of human disease. Nature 447, 433–440. doi: 10.1038/nature05919
Feinberg, A. P., Irizarry, R. A., Fradin, D., Aryee, M. J., Murakami, P., Aspelund, T., et al. (2010). Personalized epigenomic signatures that are stable over time and covary with body mass index. Sci. Transl. Med. 2, 49ra67. doi: 10.1126/scitranslmed.3001262
Forler, S., Klein, O., and Klose, J. (2014). Individualized proteomics. J. Proteomics 107, 56–61. doi: 10.1016/j.jprot.2014.04.003
Franceschini, A., Szklarczyk, D., Frankild, S., Kuhn, M., Simonovic, M., Roth, A., et al. (2013). String v9.1: protein-protein interaction networks, with increased coverage and integration. Nucleic Acids Res. 41, D808–D815. doi: 10.1093/nar/gks1094
Garcia-Alonso, L., Jiménez-Almazán, J., Carbonell-Caballero, J., Vela-Boza, A., Santoyo-López, J., Antiñolo, G., et al. (2014). The role of the interactome in the maintenance of deleterious variability in human populations. Mol. Syst. Biol. 10, 752. doi: 10.15252/msb.20145222
Gavai, A. K., Supandi, F., Hettling, H., Murrell, P., Leunissen, J. A. M., and van Beek, J. H. G. M. (2015). Using bioconductor package biggr for metabolic flux estimation based on gene expression changes in brain. PLoS ONE 10:e0119016. doi: 10.1371/journal.pone.0119016
Ghiassian, S. D., Menche, J., and Barabási, A. L. (2015). A disease module detection (diamond) algorithm derived from a systematic analysis of connectivity patterns of disease proteins in the human interactome. PLoS Comput. Biol. 11:e1004120. doi: 10.1371/journal.pcbi.1004120
Gille, C., Bölling, C., Hoppe, A., Bulik, S., Hoffmann, S., Hübner, K., et al. (2010). Hepatonet1: a comprehensive metabolic reconstruction of the human hepatocyte for the analysis of liver physiology. Mol. Syst. Biol. 6, 411. doi: 10.1038/msb.2010.62
Goehler, H., Lalowski, M., Stelzl, U., Waelter, S., Stroedicke, M., Worm, U., et al. (2004). A protein interaction network links git1, an enhancer of huntingtin aggregation, to huntington's disease. Mol. Cell 15, 853–865. doi: 10.1016/j.molcel.2004.09.016
Harrow, J., Frankish, A., Gonzalez, J. M., Tapanari, E., Diekhans, M., Kokocinski, F., et al. (2012). Gencode: the reference human genome annotation for the encode project. Genome Res. 22, 1760–1774. doi: 10.1101/gr.135350.111
Hewett, M., Oliver, D. E., Rubin, D. L., Easton, K. L., Stuart, J. M., Altman, R. B., et al. (2002). Pharmgkb: the pharmacogenetics knowledge base. Nucleic Acids Res. 30, 163–165. doi: 10.1093/nar/30.1.163
Hirata, H., Hinoda, Y., Shahryari, V., Deng, G., Nakajima, K., Tabatabai, Z. L., et al. (2015). Long noncoding rna malat1 promotes aggressive renal cell carcinoma through ezh2 and interacts with mir-205. Cancer Res. 75, 1322–1331. doi: 10.1158/0008-5472.CAN-14-2931
Howell, P. M. Jr., Liu, S., Ren, S., Behlen, C., Fodstad, O., and Riker, A. I. (2009). Epigenetics in human melanoma. Cancer Control 16, 200–218.
Huttlin, E. L., Ting, L., Bruckner, R. J., Gebreab, F., Gygi, M. P., Szpyt, J., et al. (2015). The bioplex network: a systematic exploration of the human interactome. Cell 162, 425–440. doi: 10.1016/j.cell.2015.06.043
Jia, P., and Zhao, Z. (2014). Varwalker: personalized mutation network analysis of putative cancer genes from next-generation sequencing data. PLoS Comput. Biol. 10:e1003460. doi: 10.1371/journal.pcbi.1003460
Karlebach, G., and Shamir, R. (2008). Modelling and analysis of gene regulatory networks. Nat. Rev. Mol. Cell Biol. 9, 770–780. doi: 10.1038/nrm2503
Kathiresan, S., and Srivastava, D. (2012). Genetics of human cardiovascular disease. Cell 148, 1242–1257. doi: 10.1016/j.cell.2012.03.001
Keshava Prasad, T. S., Goel, R., Kandasamy, K., Keerthikumar, S., Kumar, S., Mathivanan, S., et al. (2009). Human protein reference database–2009 update. Nucleic Acids Res. 37, D767–D772. doi: 10.1093/nar/gkn892
Kim, M. S., Pinto, S. M., Getnet, D., Nirujogi, R. S., Manda, S. S., Chaerkady, R., et al. (2014). A draft map of the human proteome. Nature 509, 575–581. doi: 10.1038/nature13302
Kuchaiev, O., Rasajski, M., Higham, D. J., and Przulj, N. (2009). Geometric de-noising of protein-protein interaction networks. PLoS Comput. Biol. 5:e1000454. doi: 10.1371/journal.pcbi.1000454
Lefebvre, C., Rajbhandari, P., Alvarez, M. J., Bandaru, P., Lim, W. K., Sato, M., et al. (2010). A human b-cell interactome identifies myb and foxm1 as master regulators of proliferation in germinal centers. Mol. Syst. Biol. 6, 377. doi: 10.1038/msb.2010.31
Lewis, N. E., Schramm, G., Bordbar, A., Schellenberger, J., Andersen, M. P., Cheng, J. K., et al. (2010). Large-scale in silico modeling of metabolic interactions between cell types in the human brain. Nat. Biotechnol. 28, 1279–1285. doi: 10.1038/nbt.1711
Li, M. J., Wang, P., Liu, X., Lim, E. L., Wang, Z., Yeager, M., et al. (2012). Gwasdb: a database for human genetic variants identified by genome-wide association studies. Nucleic Acids Res. 40, D1047–D1054. doi: 10.1093/nar/gkr1182
Licata, L., Briganti, L., Peluso, D., Perfetto, L., Iannuccelli, M., Galeota, E., et al. (2012). Mint, the molecular interaction database: 2012 update. Nucleic Acids Res. 40, D857–D861. doi: 10.1093/nar/gkr930
Low, S. K., Takahashi, A., Mushiroda, T., and Kubo, M. (2014). Genome-wide association study: a useful tool to identify common genetic variants associated with drug toxicity and efficacy in cancer pharmacogenomics. Clin. Cancer Res. 20, 2541–2552. doi: 10.1158/1078-0432.CCR-13-2755
Ma, H., Sorokin, A., Mazein, A., Selkov, A., Selkov, E., Demin, O., et al. (2007). The edinburgh human metabolic network reconstruction and its functional analysis. Mol. Syst. Biol. 3, 135. doi: 10.1038/msb4100177
Machado, D., and Herrgård, M. (2014). Systematic evaluation of methods for integration of transcriptomic data into constraint-based models of metabolism. PLoS Comput. Biol. 10:e1003580. doi: 10.1371/journal.pcbi.1003580
Magger, O., Waldman, Y. Y., Ruppin, E., and Sharan, R. (2012). Enhancing the prioritization of disease-causing genes through tissue specific protein interaction networks. PLoS Comput. Biol. 8:e1002690. doi: 10.1371/journal.pcbi.1002690
Mardinoglu, A., Agren, R., Kampf, C., Asplund, A., Nookaew, I., Jacobson, P., et al. (2013). Integration of clinical data with a genome-scale metabolic model of the human adipocyte. Mol. Syst. Biol. 9:649. doi: 10.1038/msb.2013.5
Mardinoglu, A., Agren, R., Kampf, C., Asplund, A., Uhlen, M., and Nielsen, J. (2014). Genome-scale metabolic modelling of hepatocytes reveals serine deficiency in patients with non-alcoholic fatty liver disease. Nat. Commun. 5:3083. doi: 10.1038/ncomms4083
Mardinoglu, A., and Nielsen, J. (2015). New paradigms for metabolic modeling of human cells. Curr. Opin. Biotechnol. 34C, 91–97. doi: 10.1016/j.copbio.2014.12.013
Margolin, A. A., Nemenman, I., Basso, K., Wiggins, C., Stolovitzky, G., Dalla Favera, R., et al. (2006). Aracne: an algorithm for the reconstruction of gene regulatory networks in a mammalian cellular context. BMC Bioinformatics 7(Suppl. 1):S7. doi: 10.1186/1471-2105-7-S1-S7
McDowall, M. D., Scott, M. S., and Barton, G. J. (2009). Pips: human protein-protein interaction prediction database. Nucleic Acids Res. 37, D651–D656. doi: 10.1093/nar/gkn870
Menche, J., Sharma, A., Kitsak, M., Ghiassian, S. D., Vidal, M., Loscalzo, J., et al. (2015). Disease networks. uncovering disease-disease relationships through the incomplete interactome. Science 347:1257601. doi: 10.1126/science.1257601
Meyer, P. E., Kontos, K., Lafitte, F., and Bontempi, G. (2007). Information-theoretic inference of large transcriptional regulatory networks. EURASIP J. Bioinform. Syst. Biol. 2007:79879. doi: 10.1155/2007/79879
Montgomery, S. B., and Dermitzakis, E. T. (2011). From expression qtls to personalized transcriptomics. Nat. Rev. Genet. 12, 277–282. doi: 10.1038/nrg2969
Murphy, T. A., Dang, C. V., and Young, J. D. (2013). Isotopically nonstationary 13c flux analysis of myc-induced metabolic reprogramming in b-cells. Metab. Eng. 15, 206–217. doi: 10.1016/j.ymben.2012.07.008
Nagai, Y., Takahashi, Y., and Imanishi, T. (2015). Vade: a manually curated database of reproducible associations between various traits and human genomic polymorphisms. Nucleic Acids Res. 43, D868–D872. doi: 10.1093/nar/gku1037
Nicholson, J. K., Holmes, E., Kinross, J. M., Darzi, A. W., Takats, Z., and Lindon, J. C. (2012). Metabolic phenotyping in clinical and surgical environments. Nature 491, 384–392. doi: 10.1038/nature11708
Nielsen, J. (2003). It is all about metabolic fluxes. J. Bacteriol. 185, 7031–7035. doi: 10.1128/JB.185.24.7031-7035.2003
Niklas, J., Sandig, V., and Heinzle, E. (2011). Metabolite channeling and compartmentation in the human cell line age1.hn determined by 13c labeling experiments and 13c metabolic flux analysis. J. Biosci. Bioeng. 112, 616–623. doi: 10.1016/j.jbiosc.2011.07.021
Orchard, S., Ammari, M., Aranda, B., Breuza, L., Briganti, L., Broackes-Carter, F., et al. (2014). The mintact project–intact as a common curation platform for 11 molecular interaction databases. Nucleic Acids Res. 42, D358–D363. doi: 10.1093/nar/gkt1115
Patil, K. R., and Nielsen, J. (2005). Uncovering transcriptional regulation of metabolism by using metabolic network topology. Proc. Natl. Acad. Sci. U.S.A. 102, 2685–2689. doi: 10.1073/pnas.0406811102
Psychogios, N., Hau, D. D., Peng, J., Guo, A. C., Mandal, R., Bouatra, S., et al. (2011). The human serum metabolome. PLoS ONE 6:e16957. doi: 10.1371/journal.pone.0016957
Quinodoz, S., and Guttman, M. (2014). Long noncoding rnas: an emerging link between gene regulation and nuclear organization. Trends Cell Biol. 24, 651–663. doi: 10.1016/j.tcb.2014.08.009
Rasool, M., Malik, A., Naseer, M. I., Manan, A., Ansari, S., Begum, I., et al. (2015). The role of epigenetics in personalized medicine: challenges and opportunities. BMC Med. Genomics 8(Suppl. 1):S5. doi: 10.1186/1755-8794-8-S1-S5
Rivera, C. M., and Ren, B. (2013). Mapping human epigenomes. Cell 155, 39–55. doi: 10.1016/j.cell.2013.09.011
Roadmap Epigenomics Consortium, Kundaje, A., Meuleman, W., Ernst, J., Bilenky, M., Yen, A., et al. (2015). Integrative analysis of 111 reference human epigenomes. Nature 518, 317–330. doi: 10.1038/nature14248
Rolland, T., Taşan, M., Charloteaux, B., Pevzner, S. J., Zhong, Q., Sahni, N., et al. (2014). A proteome-scale map of the human interactome network. Cell 159, 1212–1226. doi: 10.1016/j.cell.2014.10.050
Rossell, S., Solem, C., Jensen, P. R., and Heijnen, J. J. (2011). Towards a quantitative prediction of the fluxome from the proteome. Metab. Eng. 13, 253–262. doi: 10.1016/j.ymben.2011.01.010
Rual, J. F., Venkatesan, K., Hao, T., Hirozane-Kishikawa, T., Dricot, A., Li, N., et al. (2005). Towards a proteome-scale map of the human protein-protein interaction network. Nature 437, 1173–1178. doi: 10.1038/nature04209
Sadee, W. (2011). Genomics and personalized medicine. Int. J. Pharm. 415, 2–4. doi: 10.1016/j.ijpharm.2011.04.048
Sahni, N., Yi, S., Taipale, M., Fuxman Bass, J. I., Coulombe-Huntington, J., Yang, F., et al. (2015). Widespread macromolecular interaction perturbations in human genetic disorders. Cell 161, 647–660. doi: 10.1016/j.cell.2015.04.013
Sahni, N., Yi, S., Zhong, Q., Jailkhani, N., Charloteaux, B., Cusick, M. E., et al. (2013). Edgotype: a fundamental link between genotype and phenotype. Curr. Opin. Genet. Dev. 23, 649–657. doi: 10.1016/j.gde.2013.11.002
Schaefer, M. H., Lopes, T. J. S., Mah, N., Shoemaker, J. E., Matsuoka, Y., Fontaine, J. F., et al. (2013). Adding protein context to the human protein-protein interaction network to reveal meaningful interactions. PLoS Comput. Biol. 9:e1002860. doi: 10.1371/journal.pcbi.1002860
Sevimoglu, T., and Arga, K. Y. (2014). The role of protein interaction networks in systems biomedicine. Comput. Struct. Biotechnol. J. 11, 22–27. doi: 10.1016/j.csbj.2014.08.008
Shoaie, S., Ghaffari, P., Kovatcheva-Datchary, P., Mardinoglu, A., Sen, P., Pujos-Guillot, E., et al. (2015). Quantifying diet-induced metabolic changes of the human gut microbiome. Cell Metab. 22, 320–331. doi: 10.1016/j.cmet.2015.07.001
Snel, B., Lehmann, G., Bork, P., and Huynen, M. A. (2000). String: a web-server to retrieve and display the repeatedly occurring neighbourhood of a gene. Nucleic Acids Res. 28, 3442–3444. doi: 10.1093/nar/28.18.3442
Stark, C., Breitkreutz, B. J., Reguly, T., Boucher, L., Breitkreutz, A., and Tyers, M. (2006). Biogrid: a general repository for interaction datasets. Nucleic Acids Res. 34, D535–D539. doi: 10.1093/nar/gkj109
Stelzl, U., Worm, U., Lalowski, M., Haenig, C., Brembeck, F. H., Goehler, H., et al. (2005). A human protein-protein interaction network: a resource for annotating the proteome. Cell 122, 957–968. doi: 10.1016/j.cell.2005.08.029
Stuart, J. M., Segal, E., Koller, D., and Kim, S. K. (2003). A gene-coexpression network for global discovery of conserved genetic modules. Science 302, 249–255. doi: 10.1126/science.1087447
Suhre, K., Shin, S. Y., Petersen, A. K., Mohney, R. P., Meredith, D., Wägele, B., et al. (2011). Human metabolic individuality in biomedical and pharmaceutical research. Nature 477, 54–60. doi: 10.1038/nature10354
Thiele, I., Swainston, N., Fleming, R. M. T., Hoppe, A., Sahoo, S., Aurich, M. K., et al. (2013). A community-driven global reconstruction of human metabolism. Nat. Biotechnol. 31, 419–425. doi: 10.1038/nbt.2488
Topol, E. J. (2014). Individualized medicine from prewomb to tomb. Cell 157, 241–253. doi: 10.1016/j.cell.2014.02.012
Tryka, K. A., Hao, L., Sturcke, A., Jin, Y., Wang, Z. Y., Ziyabari, L., et al. (2014). Ncbi's database of genotypes and phenotypes: dbgap. Nucleic Acids Res. 42, D975–D979. doi: 10.1093/nar/gkt1211
Uhlén, M., Fagerberg, L., Hallström, B. M., Lindskog, C., Oksvold, P., Mardinoglu, A., et al. (2015). Proteomics. tissue-based map of the human proteome. Science 347:1260419. doi: 10.1126/science.1260419
UK10K Consortium, Walter, K., Min, J. L., Huang, J., Crooks, L., Memari, Y., et al. (2015). The uk10k project identifies rare variants in health and disease. Nature 526, 82–90. doi: 10.1038/nature14962
Väremo, L., Scheele, C., Broholm, C., Mardinoglu, A., Kampf, C., Asplund, A., et al. (2015). Proteome- and transcriptome-driven reconstruction of the human myocyte metabolic network and its use for identification of markers for diabetes. Cell Rep. 11, 921–933. doi: 10.1016/j.celrep.2015.04.010
Vidal, M., Cusick, M. E., and Barabási, A. L. (2011). Interactome networks and human disease. Cell 144, 986–998. doi: 10.1016/j.cell.2011.02.016
Wang, Y., Eddy, J. A., and Price, N. D. (2012). Reconstruction of genome-scale metabolic models for 126 human tissues using mcadre. BMC Syst. Biol. 6:153. doi: 10.1186/1752-0509-6-153
Welter, D., MacArthur, J., Morales, J., Burdett, T., Hall, P., Junkins, H., et al. (2014). The nhgri gwas catalog, a curated resource of snp-trait associations. Nucleic Acids Res. 42, D1001–D1006. doi: 10.1093/nar/gkt1229
Winter, G., and Krömer, J. O. (2013). Fluxomics - connecting 'omics analysis and phenotypes. Environ. Microbiol. 15, 1901–1916. doi: 10.1111/1462-2920.12064
Xenarios, I., Salwínski, L., Duan, X. J., Higney, P., Kim, S. M., and Eisenberg, D. (2002). Dip, the database of interacting proteins: a research tool for studying cellular networks of protein interactions. Nucleic Acids Res. 30, 303–305. doi: 10.1093/nar/30.1.303
Yizhak, K., Benyamini, T., Liebermeister, W., Ruppin, E., and Shlomi, T. (2010). Integrating quantitative proteomics and metabolomics with a genome-scale metabolic network model. Bioinformatics 26, i255–i260. doi: 10.1093/bioinformatics/btq183
Yizhak, K., Gaude, E., Le Dévédec, S., Waldman, Y. Y., Stein, G. Y., van de Water, B., et al. (2014). Phenotype-based cell-specific metabolic modeling reveals metabolic liabilities of cancer. Elife 3:e03641. doi: 10.7554/eLife.03641
Yu, W., Gwinn, M., Clyne, M., Yesupriya, A., and Khoury, M. J. (2008). A navigator for human genome epidemiology. Nat. Genet. 40, 124–125. doi: 10.1038/ng0208-124
Zhong, Q., Simonis, N., Li, Q. R., Charloteaux, B., Heuze, F., Klitgord, N., et al. (2009). Edgetic perturbation models of human inherited disorders. Mol. Syst. Biol. 5:321. doi: 10.1038/msb.2009.80
Keywords: personalized medicine, interactome, gene regulatory networks (GRN), protein-protein interaction (PPI), genome-scale metabolic models, integrative genomics, network medicine
Citation: Zhang X, Kuivenhoven JA and Groen AK (2015) Forward Individualized Medicine from Personal Genomes to Interactomes. Front. Physiol. 6:364. doi: 10.3389/fphys.2015.00364
Received: 12 September 2015; Accepted: 16 November 2015;
Published: 09 December 2015.
Edited by:
Adil Mardinoglu, Chalmers University of Technology, SwedenReviewed by:
Anshu Bhardwaj, Council of Scientific and Industrial Research, IndiaHyun Uk Kim, Korea Advanced Institute of Science and Technology, South Korea
Copyright © 2015 Zhang, Kuivenhoven and Groen. This is an open-access article distributed under the terms of the Creative Commons Attribution License (CC BY). The use, distribution or reproduction in other forums is permitted, provided the original author(s) or licensor are credited and that the original publication in this journal is cited, in accordance with accepted academic practice. No use, distribution or reproduction is permitted which does not comply with these terms.
*Correspondence: Xiang Zhang, eC56aGFuZzAxQHVtY2cubmw=