
94% of researchers rate our articles as excellent or good
Learn more about the work of our research integrity team to safeguard the quality of each article we publish.
Find out more
ORIGINAL RESEARCH article
Front. Physiol., 23 April 2014
Sec. Integrative Physiology
Volume 5 - 2014 | https://doi.org/10.3389/fphys.2014.00157
This article is part of the Research TopicCerebral oxygenation in health and diseaseView all 19 articles
Rationale: A critical reduction in central blood volume (CBV) is often characterized by hemodynamic instability. Restoration of a volume deficit may be established by goal-directed fluid therapy guided by respiration-related variation in systolic- and pulse pressure (SPV and PPV). Stroke volume index (SVI) serves as a surrogate end-point of a fluid challenge but tissue perfusion itself has not been addressed.
Objective: To delineate the relationship between arterial pressure variations, SVI and regional brain perfusion during CBV depletion and repletion in spontaneously breathing volunteers.
Methods: This study quantified in 14 healthy subjects (11 male) the effects of CBV depletion [by 30 and 70 degrees passive head-up tilt (HUT)] and a fluid challenge (by tilt back) on CBV (thoracic admittance), mean middle cerebral artery (MCA) blood flow velocity (Vmean), SVI, cardiac index (CI), PPV, and SPV.
Results: PPV (103 ± 89%, p < 0.05) and SPV (136 ± 117%, p < 0.05) increased with progression of central hypovolemia manifested by a reduction in thoracic admittance (11 ± 5%, p < 0.001), SVI (28 ± 6%, p < 0.001), CI (6 ± 8%, p < 0.001), and MCAVmean (17 ± 7%, p < 0.05) but not in arterial pressure. The reduction in MCAVmean correlated to the fall in SVI (R2 = 0.52, p < 0.0001) and inversely to PPV and SPV [R2 = 0.46 (p < 0.0001) and R2 = 0.45 (p < 0.0001), respectively]. PPV and SPV predicted a ≥15% reduction in MCAVmean and SVI with comparable sensitivity (67/67% vs. 63/68%, respectively) and specificity (89/94 vs. 89/94%, respectively). A rapid fluid challenge by tilt-back restored all parameters to baseline values within 1 min.
Conclusion: In spontaneously breathing subjects, a reduction in MCAVmean was related to an increase in PPV and SPV during graded CBV depletion and repletion. Specifically, PPV and SPV predicted changes in both SVI and MCAVmean with comparable sensitivity and specificity, however the predictive value is limited in spontaneously breathing subjects.
Severe hypovolemia is associated with a critical reduction in central blood volume (CBV) quite often related to hemorrhage or dehydration. This results in hemodynamic instability with a reduction in cardiac output (CO) and tissue oxygen delivery.
Volume depletion is usually of acute onset, and neurocardiovascular control mechanisms including reflexes from high and low pressure area receptors initiate the body's defending response (Guyton et al., 1980). In contrast, in chronic hypovolemia, the capillary fluid shift transfers fluid to the intravascular space (Guyton, 1980), whereas the humoro-cardiovascular and long-term renal blood volume control systems with a longer time constant come into operation (Shepherd and Vanhoutte, 1979; DiBona and Wilcox, 1992).
Restoration of adequate tissue perfusion and oxygenation is of major importance in hemodynamically unstable patients. In anesthesia and intensive care medicine, establishing this therapeutic goal typically involves intravascular fluid administration as the cornerstone of treatment for central hypovolemia.
However, diagnosing a volume deficit is not straightforward. In present clinical practice, volume treatment is commonly adjusted by recordings of the heart rate (HR) and arterial blood pressure (BP). The experience is, however, that fluid infusion by focusing on these hemodynamic variables allows for wide variation in administered volume because neither BP nor HR accurately reflects changes in CBV (Secher and Van Lieshout, 2005; Bundgaard-Nielsen et al., 2007; Maizel et al., 2007; Secher and Van Lieshout, 2010). Observations in hypotensive patients during hemorrhage indicate that reversible hypotensive hypovolemic shock is in fact characterized by a decrease in HR reflecting an increase in vagal tone (Sander-Jensen et al., 1986). Thus the sensitivity of HR as an early indicator is low and highly non-specific. This is further supported by data obtained in a human model of acute hypovolemic shock by either lower body negative pressure (Cooke et al., 2004; Rickards et al., 2014) or passive head-up tilt (Matzen et al., 1991; Ten Harkel et al., 1992; Westerhof et al., 2006).
Also, clinical signs of hypovolemia including diminished skin turgor and high urine osmolarity do not accurately reflect reductions in CBV (McGee et al., 1999).
An increase in stroke volume (SV) or CO in response to fluid therapy is considered favorable. A meta-analysis of 12 clinical studies showed that with current clinical practice, between 40 and 70% of critically ill patients are so-called responders (Michard and Teboul, 2002). The substantial number of patients not responding to fluid therapy calls for physiological monitors capable of predicting fluid responsiveness.
Respiration-related variations in left ventricular preload which are transferred to variations in arterial pressure [e.g., systolic pressure variation (SPV) and pulse pressure variation (PPV)] are being introduced in clinical medicine as potentially useful tools to guide volume administration (Michard et al., 2000; Michard and Teboul, 2002; Bendjelid and Romand, 2003; Preisman et al., 2005).
In the majority of studies aiming for candidate indices predictive for fluid responsiveness, however, the investigated end-point of a fluid challenge has been a change in SV (index; SVI) or CO / cardiac index (CI) (Marik et al., 2009).
Although SV and CO serve as surrogate end-points of a fluid challenge, brain perfusion as the actual therapeutic endpoint is as yet not being addressed by present research. The large metabolic needs of the brain reflected by respectively 20 and 25% of oxygen and glucose consumption by neuronal activity renders it extremely sensitive to sufficient and uninterrupted blood supply. In this study, the hypothesis is tested that arterial pressure variations during progressive central hypovolemia relate to changes in brain perfusion. We therefore set out to gauge the relationship between arterial pressure variations, SVI and cerebral blood flow velocity during CBV depletion and repletion in spontaneously breathing subjects.
Fourteen healthy volunteers (11 males) with a median (range) age of 25 (23–37) year, height 180 (173–204) cm and weight 72 (62–86) kg, without taking any medication and/or history of regular fainting or cardiac arrhythmia participated in this study. Phase of menstrual cycle in female subjects was not accounted for. This study was approved by the institutional Medical Ethics Committee and took place in the Laboratory for Clinical Cardiovascular Physiology in the Academic Medical Center in Amsterdam. The subjects abstained from heavy physical exercise and caffeinated beverages 4 h prior to the experiment. Diurnal variations in body fluid contents were accounted for by strictly adhering the experiment to the same hour of the day. All procedures and risks associated with the study were explained to the subjects and written informed consents were obtained.
Measurements were performed between 11 am and 3 pm in a quiet room with the subjects on a custom built computer controlled tilt table that minimizes muscle tensing and limits vestibular stimulation during tilting (Gisolf et al., 2004a). Resting supine measurements represented normovolemic conditions. Next, subjects were head-up tilted (HUT) to respectively 30 and 70 degrees causing progressive central hypovolemia of acute onset and subsequently tilted back to the supine position mimicking a rapid volume repletion. Following each angle change of the tilt table, that body position was maintained for five minutes to obtain a stable hemodynamic situation. The last 60 s of these adjustment periods were used for analysis. Following tilt-back to the supine position, the subjects rested again. Subsequently they were tilted in a sinusoidal fashion (tilting frequency varying from 0.042 to 0.2 Hz or 5 to 12/min) enhancing BP variation for evaluation of cerebrovascular autoregulatory efficacy. The breathing was paced at 13 breaths/min by auditory support. This breathing frequency was continued throughout the sinusoidal tilts, to separate the influence of gravity and the influence of respiration on the measured cardiovascular signals.
Continuous arterial BP was non-invasively measured (Nexfin, Edwards Lifesciences BMEYE, Amsterdam, the Netherlands) (Eeftinck Schattenkerk et al., 2009; Martina et al., 2012) using the volume clamp method (Truijen et al., 2012). A finger cuff fastened on the middle finger was held at heart level. A pulse contour method (Nexfin CO-trek, Edwards Lifesciences BMEYE, Amsterdam, the Netherlands)—adapted for age, gender, height and weight (Bogert et al., 2010)—provided left ventricular SV and CO by multiplying SV by instantaneous HR. SVI and CI were SV and CO divided by body surface area (Du Bois and Du Bois, 1916). SPV and PPV were calculated per breath from the BP signal according to the following formula:
with A equal to, respectively, systolic arterial pressure (SAP) and pulse pressure [PP; equal to SAP minus diastolic arterial pressure (DAP)]. Arterial pressure variations were calculated per breath and then averaged over five consecutive breaths (see Figure 1).
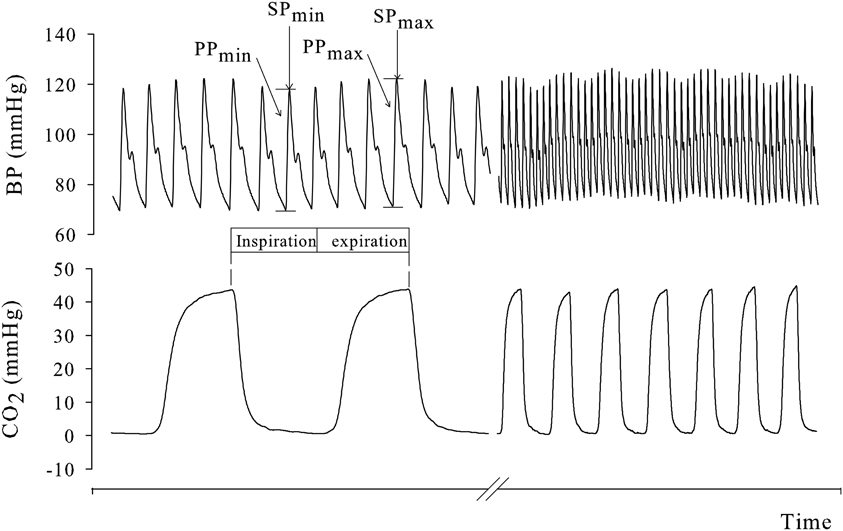
Figure 1. Variation in pulse and systolic pressure (PP and SP, respectively), induced by respiration. PPV and SPV were first calculated (Equation 1) per breath and then averaged over five consecutive breaths.
Cerebral perfusion pressure (CPP) was determined by subtracting critical closing pressure (CCP) from BP at brain level. BP at brain level was estimated by subtracting hydrostatic difference between the finger cuff and the level of transcranial insonation by Transcranial Doppler (TCD) ultrasonography and CCP was estimated by first harmonic Fourier filtered normal arterial pressure and velocity wave heart beat data as described by Aaslid et al. (2003).
Regional brain perfusion of the anterior circulation was investigated by the assessment of mean middle cerebral artery (MCA) flow velocity (Vmean) followed in the proximal segments by means of TCD (DWL Multidop X4, Sipplingen, Germany). The MCA was insonated through the temporal window just above the zygomatic arch at a depth of 40–60 mm with a pulsed 2 MHz probe. After the Doppler signal was optimized, the probe was attached to the skull in a fixed angle by means of a head-band.
The HUT induced translocation of CBV to the lower extremities was monitored by electrical impedance plethysmography (350 μA at 50 kHz; Nihon Kohden, AI-601G, Japan) measured at the level of the thorax (Krantz et al., 2000) and expressed as changes in thoracic admittance (Van Lieshout et al., 2005). Airway flow and pressure were measured by means of the Alveotest flowmeter (Jaeger, Würzburg, Germany) and end-tidal CO2 (PetCO2) was measured using a capnograph (Tonocap, Datex-Ohmeda, Madison, USA). Tidal volume (TV) was calculated by integration of the flow signal. All data were sampled at 200 Hz and collected using an Analog Devices RTI815 PC-card with custom made software. Signals were visually inspected for artifacts and analyzed offline (Matlab R2007b, Mathworks Inc. MA, USA).
Dynamic cerebral autoregulation (CA) was quantified as the counter-regulatory capacity to maintain MCAVmean during oscillatory tilt induced changes in BP. Dynamic CA was assessed by means of cross-spectral density analysis of beat-to-beat data of MAP at brain level and MCAVmean after spline interpolation and resampling at 4 Hz. Gain and phase were obtained for the frequencies equal to the oscillatory tilt frequencies (ranging from 0.042 to 0.2 Hz). The gain reflects the effective amplitude dampening of BP fluctuations and phase shift was defined positive where MCAVmean leads MAP at brain level. Coherence examined the strength of the relationship between MAP and MCAVmean (Immink et al., 2004). To account for inter-subject variability, the gain was normalized for MAP and MCAVmean and expressed as the percentage change in cm/sec per percentage change in mmHg (Panerai et al., 1999).
Results are presented as mean ± SD. The effect of HUT on measured parameters was assessed using a One Way Repeated Measures Analysis of Variance (ANOVA) test together with the Holm-Sidak method to perform pairwise multiple comparisons. When data were not normally distributed, they are presented as medians and range and non-parametric statistical tests were used.
Linear Mixed Model analysis was performed (IBM SPSS statistics 20, IBM corporation, USA) to examine the relation between brain perfusion (referred to as dependent variable) and hemodynamic and respiratory variables (fixed covariates). R2 was calculated according to the following formula:
where y and f refers to, respectively, the observed and predicted values (Edwards et al., 2008). A multivariate, stepwise regression model was constructed with MCAVmean as the dependent variable and mean arterial pressure at heart level (MAP), CPP, SVI, HR, total peripheral resistance (TPR), PetCO2 and thoracic admittance as the independent variables (Kim et al., 2008). The model was developed by forward entry and removal of the independent variables according to their significant contribution (according to the F-test) in explaining the variance in the dependent variable. Baseline measurements for both the dependent as independent variables were normalized to zero and the effect of tilt was expressed as absolute change with respect to the baseline value.
The subjects were divided into two groups according to the percent decrease in SVI or MCAVmean during progressive CBV depletion related to the resting supine value. A 15% increase in SVI in response to fluid infusion is considered clinically relevant according to previously published criteria (Michard et al., 2000; Heenen et al., 2006; Jellema et al., 2006; Soubrier et al., 2007). In this study, subjects with >15% decrease in SVI or MCAVmean were classified as having a CBV deficit. Receiver operating characteristics (ROC) curves evaluated the predictive value of PPV and SPV on volume deficits by determination of sensitivity and specificity values and its corresponding optimal threshold value (Akobeng, 2007). Accuracy was assessed by the area under the curve (AUC) values presented as area ± SD. A p-value less than 0.05 was considered to indicate a statistically significant difference.
All subjects completed the protocol. Figures 2, 3 and Table 1 summarize the hemodynamic and brain perfusion response to graded HUT and tilt back.
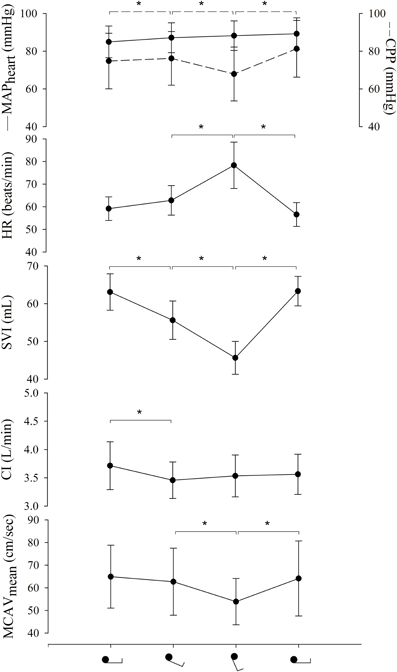
Figure 2. Hemodynamic response to graded HUT and tilt back. MAP, mean arterial pressure; CPP, cerebral perfusion pressure; HR, heart rate; SVI, stroke volume index; CI, cardiac index; MCAVmean, mean middle cerebral artery flow velocity. *p < 0.001.
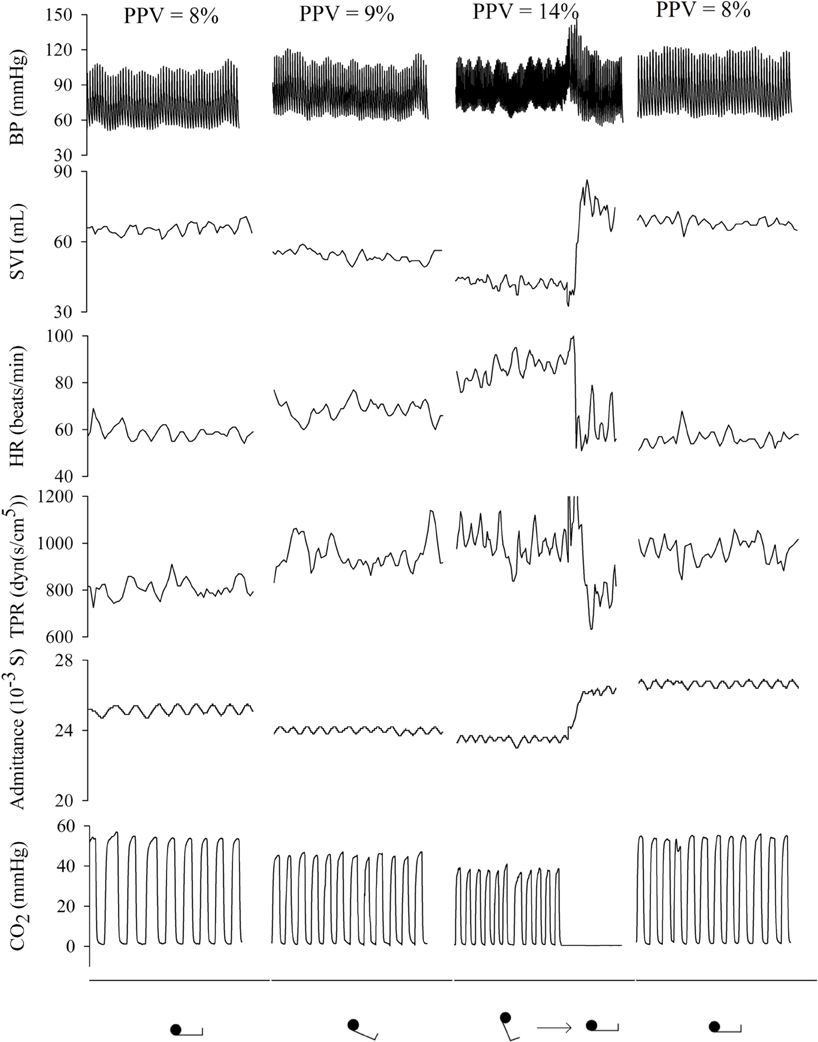
Figure 3. Representative example (subject 11) of hemodynamic response to graded HUT and tilt back. BP, blood pressure; SVI, stroke volume index; HR, heart rate; TPR, total peripheral resistance; PPV, pulse pressure variation.
Mean arterial pressure and SAP remained constant while DAP increased (11 ± 12%, p < 0.001) with 70 degrees HUT resulting in a 19 ± 11% (p < 0.001) reduction in PP. Although a decrease in CPP was demonstrated during HUT, this was not significantly different from the supine position. SVI (28 ± 6%, p < 0.001), thoracic admittance (11 ± 5%, p < 0.001) and MCAVmean (17 ± 7%, p < 0.05) declined while an increase was seen in HR (32 ± 14%, p < 0.001). CI declined (6 ± 8%, p < 0.001) and TPR increased (10 ± 11%, p < 0.001) only from 0 to 30 degrees without further change at 70 degrees HUT. PPV and SPV did not change from supine to 30 degrees HUT but substantially increased (103 ± 89% (p < 0.05) and 136 ± 117% (p < 0.05), respectively) with 70 degrees HUT. TV and breathing frequency did not change during HUT vs. the supine position while PetCO2 declined (8 ± 11%, p < 0.001) with 70 degrees HUT.
Every changing parameter returned to baseline values following tilt back except TPR which remained elevated compared to the baseline measurement (p < 0.05, Table 1).
Forward stepwise regression analysis revealed that absolute change in MCAVmean was mainly predicted by absolute change in SVI (r2 = 0.53, p < 0.001). Absolute change in PetCO2 was secondly added to this prediction model, resulting in a slightly stronger regression (r2 = 0.57, p < 0.001). Single linear plots of the dependent variable (MCAVmean) and its strongest prediction variable (SVI) are shown in Figure 4. There was only a weak relation between CPP and MCAVmean (r2 = 0.16, p = 0.007; Figure 5). The median (range) of individual correlation coefficients for the relation between SVI and MCAVmean and for CPP and MCAVmean was: r2 = 0.902 (0.059–0.999) and r2 = 0.345 (−0.672–0.998) respectively.
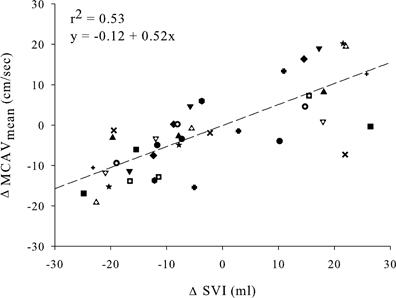
Figure 4. Linear regression plot of absolute change in MCAVmean and SVI. All subjects contributed three points in each regression line (during 30 and 70 degrees + 0 degrees after tilt back). The regression function is equal to y = −0.12 + 0.52x with corresponding correlation coefficient of r2 = 0.53 (p < 0.0001). MCAVmean, mean middle cerebral artery flow velocity; SVI, stroke volume index.
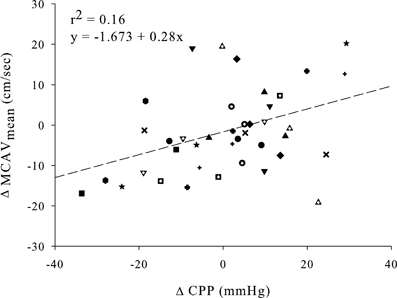
Figure 5. Single linear regression plot of absolute change in MCAVmean and CPP. All subjects contributed three points in each regression line (during 30 and 70 degrees + 0 degrees after tilt back). The regression function is equal to y = −1.673 − 0.28x with corresponding correlation coefficient of r2 = 0.16 (p = 0.007). MCAVmean, mean middle cerebral artery flow velocity; CPP, cerebral perfusion pressure.
Figure 6, panel (A) displays single linear regression plots between ΔSVI and ΔPPV or ΔSPV. Regression analysis between ΔSVI and ΔPPV/ ΔSPV showed linear correlations (PPV: r2 = 0.74, p < 0.0001 and SPV: r2 = 0.76, p < 0.0001) with a higher slope for ΔPPV compared to ΔSPV. Single linear regression analysis was also applied on ΔMCAVmean and ΔPPV or ΔSPV [see panel (B) of Figure 6]. Correlations were seen between ΔPPV/ ΔSPV and ΔMCAVmean (PPV: r2 = 0.46, p < 0.0001 and SPV: r2 = 0.43, p < 0.0001). The slope of the regression plots for both ΔPPV and ΔSPV were comparable with those between ΔPPV/ ΔSPV and ΔSVI. Again, the highest slope was seen for ΔPPV.
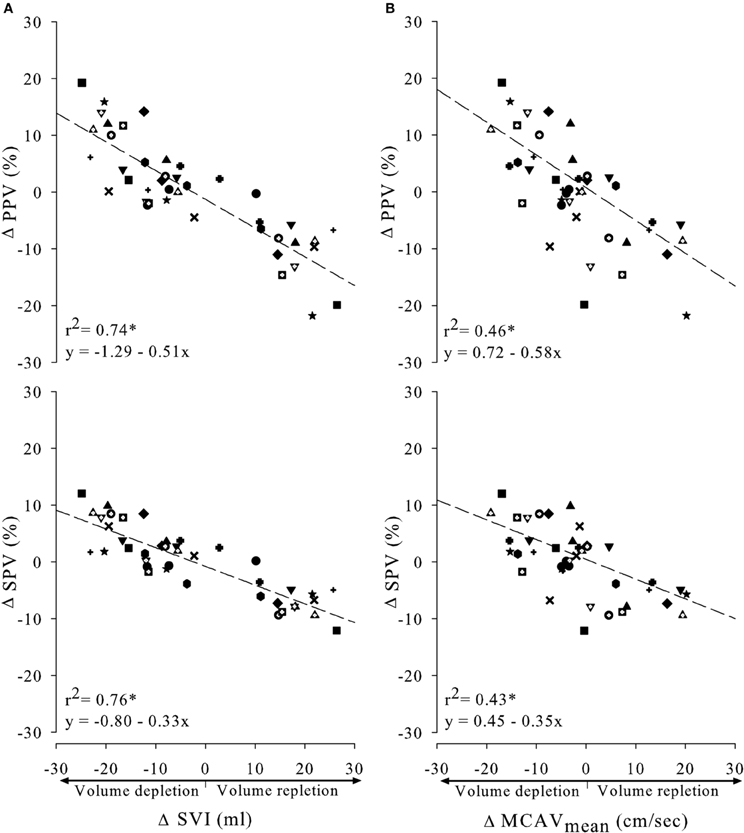
Figure 6. Relationship between absolute change in pulse or systolic pressure variation (PPV and SPV, respectively), and absolute change in SVI (A) or MCAVmean (B). All subjects were indicated by symbols and contributed three points in each regression line (during 30 and 70 degrees HUT + 0 degrees during tilt back). *p < 0.0001.
In Figure 7, ROC curves for the performance of arterial pressure variations in predicting ≥15% decrease in SVI (left panel) and ≥15% decrease in MCAVmean (right panel) are shown. The AUC values were the highest for PPV and SPV when predicting a decrease in MCAVmean compared to predicting a decrease in SVI (PPV: 0.93 vs. 0.73 and SPV: 0.93 vs. 0.80). The cutoff thresholds and its corresponding sensitivity and specificity values are described in Table 2. PPV and SPV predicted a ≥15% reduction in MCAVmean and SVI with comparable sensitivity (67/67% vs. 63/68%, respectively) and specificity (94 vs. 89% for both PPV and SPV). In Figure 8, dot histograms associated with the ROC curves are shown for the prediction of ≥15% decrease in both SVI and MCAVmean.
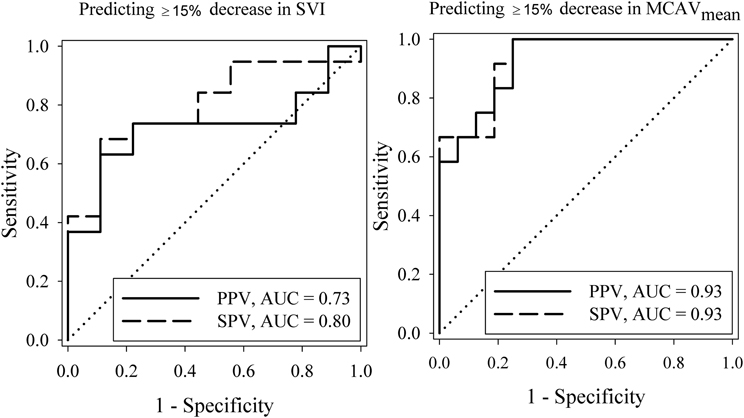
Figure 7. Receiver operating characteristics (ROC) curves for the performance of PPV and SPV in predicting ≥15% decrease in SVI (left) and ≥15% decrease in MCAVmean (right). PPV, pulse pressure variation; SPV, systolic pressure variation; AUC, area under curve; SVI, stroke volume index; MCAVmean, mean middle cerebral artery velocity.
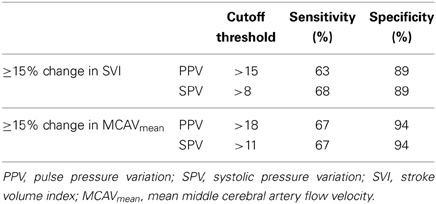
Table 2. Predictive value of PPV and SPV for (changes in) SVI and MCAVmean with cutoff thresholds and corresponding sensitivity of specificity.
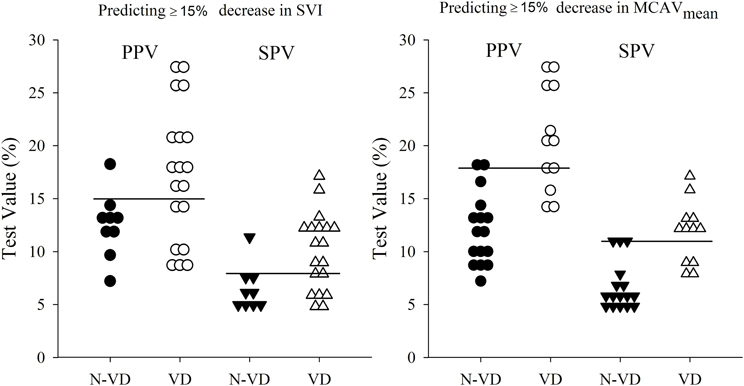
Figure 8. Dot histograms of having a volume deficit (VD) or not having a volume deficit (N-VD) defined by ≥15% HUT induced decrease in SVI (left) or MCAVmean (right). PPV is depicted by the circles and SPV is depicted by the triangles. The cutoff threshold values are represented as a horizontal line and described in Table 2. PPV, pulse pressure variation; SPV, systolic pressure variation; SVI, stroke volume index; MCAVmean, mean middle cerebral artery flow velocity.
The MCAVmean-to-MAP at brain level transfer functions displayed the expected high-pass filter characteristics of dynamic autoregulation, with a decrease in phase lead and increase in normalized gain with increasing sinusoidal tilt frequency (Figure 9). Phase and gain at 0.1 Hz were, respectively, 45 degrees and 0.89%/%.
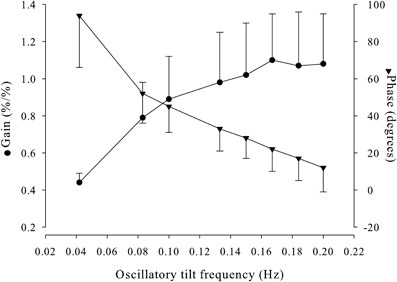
Figure 9. MCAVmean-MAP transfer function displayed by gain and phase for each oscillatory tilt frequency. MCAVmean, mean middle cerebral artery flow velocity; MAP, mean arterial pressure.
The main new finding of this study is that in spontaneously breathing subjects under conditions of depletion and repletion of CBV, MCAVmean was linearly related to arterial pressure variations. Specifically, arterial pressure variations predicted a decline in MCAVmean and SVI with comparable sensitivity and specificity.
Clinically, hypovolemia is manifested by a reduced CBV. With passive HUT, approximately 700 ml of CBV redistributes from the chest into the gravitational dependent regions, largely contained in the venous compartment and therefore not contributing effectively to the circulating blood volume (Sjöstrand, 1953; Rowell, 1986). In this study, a postural reduction in CBV coincided with a decline in SVI (Friedman et al., 1990; Matzen et al., 1991; Pawelczyk et al., 1994; Cai et al., 2000). This is attributed to blood pooling in the lower parts of the body and to a reduction in venous return which is in agreement with data from earlier studies (Harms et al., 2003; Immink et al., 2009). Constant values of MAP by a baroreflex mediated increase in TPR counterbalancing the postural reduction in SVI and CI illustrates the contention that MAP does not reflect changes in CBV (Van Lieshout and Wesseling, 2001; Secher and Van Lieshout, 2005).
Increased ventilation and corresponding lowering of PaCO2 associated with postural stress, is considered to be contributory to the reduction in MCAVmean (Kapoor, 2002; Chen-Scarabelli and Scarabelli, 2004; Donnelly et al., 2011). The mechanisms that drive breathing during postural stress are not well understood but likely find their origin in both the brain and the periphery. We earlier considered that in the upright position the larger BP variability and less stable blood flow enhance fluctuation of PaCO2 as an input signal to the carotid body chemoreceptors (Immink et al., 2013). The interaction of enhanced baroreceptor activity and carotid body chemoreceptor stimulation may modify the respiratory drive (Biscoe and Purves, 1967a,b). Arterial hypocapnia has been associated with orthostatic intolerance and lowering of PaCO2 may reduce the prevailing peripheral vasomotor tone (Shoemaker et al., 2001). Thus, the postural reduction in PetCO2 suggests a contribution of mild hypocapnia to the reduction in cerebral perfusion. We consider that PetCO2 tracks changes in arterial carbon dioxide tension (PaCO2) in a fixed body position only, whereas the PaCO2 -to- PetCO2 gradient is enhanced by the postural reduction in CO. This results in an increased VE/Q ratio (Riley et al., 1959; Gisolf et al., 2004b; Immink et al., 2006) with overestimation of the reduction in PaCO2 (Immink et al., 2006, 2009). Also, when during passive head-up tilt PetCO2 is clamped to the level in the supine position, MCA Vmean declines in the first minute of tilt only. Afterwards the postural reduction in MCA Vmean has become independent of the ~4 mmHg reduction in PetCO2 for at least 5 min in the HUT 70 position (Immink et al., 2009). In the present study, postural stress, duration of tilt and reduction in PetCO2 were comparable to the unclamped limb in that study supporting that the decrease in PetCO2 during HUT does not explain the reduction seen in MCAVmean.
The decline in CPP is explained by the HUT induced hydrostatic pressure gradient when the cerebral circulation is positioned above the level of the heart. According to the traditional concept of CA, cerebral blood flow (CBF) is maintained more or less constant in the face of changing CPP (Roy and Sherrington, 1890; Lassen, 1974). Nevertheless, postural stress elicits reductions in indices of CBF irrespective of the fact that CPP remains within the so called autoregulatory range, challenging the concept of CA as a plateau (Immink et al., 2010; Lucas et al., 2010). In fact, constant CBF would require an infinite gain which is generally not operative in humans (Van Lieshout et al., 2003; Panerai, 2004; Immink et al., 2013; Willie et al., 2014). Assessment of CA is based on introducing CCP fluctuations and quantifying their transfer to the blood velocity in a large cerebral artery in terms of phase angle and gain. This approach addresses specifically the dynamic component of CA. CA is, however, considered to encompass both static (long-term) and dynamic (short-term) components (Van Lieshout et al., 2003). It remains unclear whether short- and long-term regulation of CBF are separate mechanistic entities (Ainslie and Brassard, 2014). Reference values have not been defined and overlap exists between healthy subjects vs. patients with impaired dynamic CA. We demonstrated the expected high-pass filter characteristics and therefore assume that in the young adult subjects in this study dCA was intact. However, CA integrity does in itself not preclude some influence of the postural reduction in CPP on MCAVmean. Of interest, the postural reduction in CPP was only minor and the correlation between changes in CPP and MCAVmean weak, supporting that the effect of the reduction in CPP on MCA flow velocity, if anything, must have been limited.
Cerebral blood flow velocity and its relation with CO has been investigated in several studies. Under conditions of 30 Torr lower body negative pressure (Zhang et al., 1998) and HUT (Jorgensen et al., 1993) both CO and MCAVmean decreased whereas in response to moderate exercise (Brys et al., 2003; Ogoh et al., 2005) CO and MCAVmean increase together with CBV without changes in PaCO2. In this study, the change in CI from 0 to 30 degrees HUT was limited. From 30 to 70 degrees HUT, SVI and CBV decreased further but CO was maintained, probably attributable to the baroreflex mediated increase in HR. During progressive central hypovolemia a reduction in MCAVmean coincided with the fall in SVI, and vice versa MCAVmean and SVI both increased in response to a simulated fluid challenge by repositioning from upright to supine, supporting a dependency of MCAVmean on CBV. Furthermore, SVI appeared to be the strongest hemodynamic predictor for changes in MCAVmean. Collectively, these findings suggest that in spontaneously breathing volunteers subjected to simulated progressive central hypovolemia, changes in SVI reflect those in MCAVmean in a linear manner (see Figure 4).
During surgery or in an intensive care setting, an increase in SVI in response to fluid administration in the anesthetized patient is considered to indicate fluid responsiveness. This study demonstrated an increase in arterial pressure variations in response to a clinical relevant decrease in SVI during HUT and vice versa during tilt back. This strong correlation between SVI and arterial pressure variations is in agreement with earlier research (Hofer et al., 2005; Jacques et al., 2011). A new finding is that under the conditions of this study MCAVmean and arterial pressure variations are related too.
Although arterial pressure variations have been proven valuable to predict fluid responsiveness in patients receiving mechanical ventilation, their predictive value in spontaneously breathing patients is lower (Bendjelid and Romand, 2003; Heenen et al., 2006; Soubrier et al., 2007). Our findings are in agreement with these data, whereas the present study extends this knowledge by demonstrating that arterial pressure variations predict changes in MCAVmean with comparable sensitivity and specificity values, and a higher accuracy during graded hypovolemia. Extrapolating this to clinical practice, a fluid challenge targeting SVI also targets brain perfusion.
Potential limitations inherent to the study design should be considered. Transcranial Doppler ultrasonography is used to monitor changes in CBF. This technique has been widely used under the assumption that the cross-sectional area of the MCA is maintained during the measurement. Possible changes in the diameter of the insonated vessel by enhanced sympathetic activity could modulate velocity independently of flow. Previous research showed that increases in sympathetic outflow by baroreflex disengagement or chemoreflex activation do not alter MCA diameter (Serrador et al., 2000), and we therefore assume that a constant MCA diameter links changes in cerebral blood velocity to changes in flow.
Detecting a volume deficit is considered as the major goal of determining fluid responsiveness. However, recent studies indicate that under certain conditions fluid bolus administration is associated with an increased mortality (Maitland et al., 2011). It is recognized that fluid administration should be practiced with much greater caution and increased vigilance and a more conservative fluid management seems appropriate (Myburgh, 2011). The values represented in Table 2 are therefore optimized for high specificity rather than high sensitivity.
In summary, the present study shows for the first time in awake humans subjected to progressive central hypovolemia that arterial pressure variations are related to both CBF velocity and SVI. Specifically, PPV and SPV predicted changes in both SVI and MCAVmean with comparable sensitivity and specificity, however the predictive value is limited in spontaneously breathing subjects.
Anne-Sophie G. T. Bronzwaer contributed to the experimental design, data acquisition, data analysis and writing the manuscript. Wim J. Stok contributed to data acquisition, data analysis and manuscript revision. Berend E. Westerhof contributed to the experimental design, data analysis and manuscript revision. Johannes J. van Lieshout supervised the study, contributing to the experimental design, data analysis and writing the manuscript.
The authors declare that the research was conducted in the absence of any commercial or financial relationships that could be construed as a potential conflict of interest.
Aaslid, R., Lash, S. R., Bardy, G. H., Gild, W. H., and Newell, D. W. (2003). Dynamic pressure–flow velocity relationships in the human cerebral circulation. Stroke 34, 1645–1649. doi: 10.1161/01.STR.0000077927.63758.B6
Ainslie, P. N., and Brassard, P. (2014). Why is the neural control of cerebral autoregulation so controversial? F1000Prime Rep. 6:14. doi: 10.12703/P6-14
Akobeng, A. K. (2007). Understanding diagnostic tests 3: receiver operating characteristic curves. Acta Paediatr. 96, 644–647. doi: 10.1111/j.1651-2227.2006.00178.x
Bendjelid, K., and Romand, J. A. (2003). Fluid responsiveness in mechanically ventilated patients: a review of indices used in intensive care. Intensive Care Med. 29, 352–360. doi: 10.1007/s00134-003-1777-0
Biscoe, T. J., and Purves, M. J. (1967a). Observations on carotid body chemoreceptor activity and cervical sympathetic discharge in the cat. J. Physiol. 190, 413–424.
Biscoe, T. J., and Purves, M. J. (1967b). Observations on the rhythmic variation in the cat carotid body chemoreceptor activity which has the same period as respiration. J. Physiol. 190, 389–412.
Bogert, L. W., Wesseling, K. H., Schraa, O., Van Lieshout, E. J., De Mol, B. A., Van, G. J., et al. (2010). Pulse contour cardiac output derived from non-invasive arterial pressure in cardiovascular disease. Anaesthesia 65, 1119–1125. doi: 10.1111/j.1365-2044.2010.06511.x
Brys, M., Brown, C. M., Marthol, H., Franta, R., and Hilz, M. J. (2003). Dynamic cerebral autoregulation remains stable during physical challenge in healthy persons. Am. J. Physiol. Heart Circ. Physiol. 285, H1048–H1054. doi: 10.1152/ajpheart.00062.2003
Bundgaard-Nielsen, M., Holte, K., Secher, N. H., and Kehlet, H. (2007). Monitoring of perioperative fluid administration by individualized goal-directed therapy. Acta Anaesthesiol. Scand. 51, 331–340. doi: 10.1111/j.1399-6576.2006.01221.x
Cai, Y., Boesen, M., Stromstad, M., and Secher, N. H. (2000). An electrical admittance based index of thoracic intracellular water during head-up tilt in humans. Eur. J. Appl. Physiol. 83, 356–362. doi: 10.1007/s004210000296
Chen-Scarabelli, C., and Scarabelli, T. M. (2004). Neurocardiogenic syncope. BMJ 329, 336–341. doi: 10.1136/bmj.329.7461.336
Cooke, W. H., Ryan, K. L., and Convertino, V. A. (2004). Lower body negative pressure as a model to study progression to acute hemorrhagic shock in humans. J. Appl. Physiol. 96, 1249–1261. doi: 10.1152/japplphysiol.01155.2003
DiBona, G. F., and Wilcox, C. S. (1992). “The kidney and the sympathetic nervous system,” in Autonomic Failure, eds R. Bannister and C. J. Mathias (Oxford: Oxford), 178–196.
Donnelly, J., Lucas, S. J., Thomas, K. N., Galvin, S. D., and Ainslie, P. N. (2011). Profound hyperventilation and development of periodic breathing during exceptional orthostatic stress in a 21-year-old man. Respir. Physiol. Neurobiol. 177, 66–70. doi: 10.1016/j.resp.2011.02.012
Du Bois, B., and Du Bois, E. F. (1916). A formula to estimate the approximate surface area if height and weight be known. Arch. Intern. Med. 17, 863–871.
Edwards, L. J., Muller, K. E., Wolfinger, R. D., Qaqish, B. F., and Schabenberger, O. (2008). An R2 statistic for fixed effects in the linear mixed model. Stat. Med. 27, 6137–6157. doi: 10.1002/sim.3429
Eeftinck Schattenkerk, D. W., Van Lieshout, J. J., Van den Meiracker, A. H., Wesseling, K. R., Blanc, S., Wieling, W., et al. (2009). Nexfin noninvasive continuous blood pressure validated against Riva-Rocci/Korotkoff. Am. J. Hypertens. 22, 378–383. doi: 10.1038/ajh.2008.368
Friedman, D. B., Jensen, F. B., Matzen, S., and Secher, N. H. (1990). Non-invasive blood pressure monitoring during head-up tilt using the Penaz principle. Acta Anaesthesiol. Scand. 34, 519–522. doi: 10.1111/j.1399-6576.1990.tb03137.x
Gisolf, J., Akkerman, E. M., Schreurs, A. W., Strackee, J., Stok, W. J., and Karemaker, J. M. (2004a). Tilt table design for rapid and sinusoidal posture change with minimal vestibular stimulation. Aviat. Space Environ. Med 75, 1086–1091.
Gisolf, J., Wilders, R., Immink, R. V., Van Lieshout, J. J., and Karemaker, J. M. (2004b). Tidal volume, cardiac output and functional residual capacity determine end-tidal CO2 transient during standing up in humans. J. Physiol. 554(Pt 2), 579–590. doi: 10.1113/jphysiol.2003.056895
Guyton, A. C. (1980). “Control theory and its application to arterial pressure regulation: proportional control, integral control, gain, and damping mechanism,” in Circulatory Physiology III. Arterial Pressure and Hypertension, ed A. C. Guyton (Philadelphia: Saunders W.B.), 30–54.
Guyton, A. C., Cowley, A. W., Norman, A. R., Coleman, T. G., and Samar, R. E. (1980). “The arterial baroreceptor reflex, a pressure buffering system,” in Circulatory Physiology III. Arterial Pressure and Hypertension, ed A. C. Guyton (Philadelphia, PA: Saunders W.B.), 248–265.
Harms, M. P. M., Van Lieshout, J. J., Jenstrup, M., Pott, F., and Secher, N. H. (2003). Postural effects on cardiac output and mixed venous oxygen saturation in humans. Exp. Physiol. 88, 611–616. doi: 10.1113/eph8802580
Heenen, S., De, B. D., and Vincent, J. L. (2006). How can the response to volume expansion in patients with spontaneous respiratory movements be predicted? Crit. Care 10, R102. doi: 10.1186/cc4970
Hofer, C. K., Muller, S. M., Furrer, L., Klaghofer, R., Genoni, M., and Zollinger, A. (2005). Stroke volume and pulse pressure variation for prediction of fluid responsiveness in patients undergoing off-pump coronary artery bypass grafting. Chest 128, 848–854. doi: 10.1378/chest.128.2.848
Immink, R. V., Hollmann, M. W., Truijen, J., Kim, Y. S., and Van Lieshout, J. J. (2010). The cerebrovascular pressure-flow relationship: a simple concept but a complex phenomenon. Hypertension 56:e2. doi: 10.1161/HYPERTENSIONAHA.110.152728
Immink, R. V., Pott, F. C., Secher, N. H., and Van Lieshout, J. J. (2013). Hyperventilation, cerebral perfusion and syncope. J. Appl. Physiol. 116, 844–851. doi: 10.1152/japplphysiol.00637.2013
Immink, R. V., Secher, N. H., Roos, C. M., Pott, F. C., Madsen, P. L., and Van Lieshout, J. J. (2006). The postural reduction in middle cerebral artery blood velocity is not explained by PaCO2. Eur. J. Appl. Physiol. 96, 609–614. doi: 10.1007/s00421-006-0136-6
Immink, R. V., Truijen, J., Secher, N. H., and Van Lieshout, J. J. (2009). Transient influence of end-tidal carbon dioxide tension on the postural restraint in cerebral perfusion. J. Appl. Physiol. 107, 816–823. doi: 10.1152/japplphysiol.91198.2008
Immink, R. V., van den Born, B. J., Van Montfrans, G. A., Koopmans, R. P., Karemaker, J. M., and Van Lieshout, J. J. (2004). Impaired cerebral autoregulation in patients with malignant hypertension. Circulation 110, 2241–2245. doi: 10.1161/01.CIR.0000144472.08647.40
Jacques, D., Bendjelid, K., Duperret, S., Colling, J., Piriou, V., and Viale, J. P. (2011). Pulse pressure variation and stroke volume variation during increased intra-abdominal pressure: an experimental study. Crit. Care 15:R33. doi: 10.1186/cc9980
Jellema, W. T., Groeneveld, A. B., Wesseling, K. H., Thijs, L. G., Westerhof, N., and Van Lieshout, J. J. (2006). Heterogeneity and prediction of hemodynamic responses to dobutamine in patients with septic shock. Crit. Care Med. 34, 2392–2398. doi: 10.1097/01.CCM.0000233871.52553.CD
Jorgensen, L. G., Perko, M., Perko, G., and Secher, N. H. (1993). Middle cerebral artery velocity during head-up tilt induced hypovolaemic shock in humans. Clin. Physiol. 13, 323–336. doi: 10.1111/j.1475-097X.1993.tb00333.x
Kapoor, W. N. (2002). Current evaluation and management of syncope. Circulation 106, 1606–1609. doi: 10.1161/01.CIR.0000031168.96232.BA
Kim, Y. S., Immink, R. V., Stok, W. J., Karemaker, J. M., Secher, N. H., and van Lieshout, J. J. (2008). Dynamic cerebral autoregulatory capacity is affected early in Type 2 diabetes. Clin. Sci. (Lond). 115, 255–262. doi: 10.1042/CS20070458
Krantz, T., Cai, Y., Lauritsen, T., Warberg, J., and Secher, N. H. (2000). Accurate monitoring of blood loss: thoracic electrical impedance during hemorrhage in the pig. Acta Anaesthesiol. Scand. 44, 598–604. doi: 10.1034/j.1399-6576.2000.00519.x
Lucas, S. J., Tzeng, Y. C., Galvin, S. D., Thomas, K. N., Ogoh, S., and Ainslie, P. N. (2010). Influence of changes in blood pressure on cerebral perfusion and oxygenation. Hypertension 55, 698–705. doi: 10.1161/HYPERTENSIONAHA.109.146290
Maitland, K., Kiguli, S., Opoka, R. O., Engoru, C., Olupot-Olupot, P., Akech, S. O., et al. (2011). Mortality after fluid Bolus in African Children with severe infection. N. Engl. J. Med. 364, 2483–2495. doi: 10.1056/NEJMoa1101549
Maizel, J., Airapetian, N., Lorne, E., Tribouilloy, C., Massy, Z., and Slama, M. (2007). Diagnosis of central hypovolemia by using passive leg raising. Intensive Care Med. 33, 1133–1138. doi: 10.1007/s00134-007-0642-y
Marik, P. E., Cavallazzi, R., Vasu, T., and Hirani, A. (2009). Dynamic changes in arterial waveform derived variables and fluid responsiveness in mechanically ventilated patients: a systematic review of the literature. Crit. Care Med. 37, 2642–2647. doi: 10.1097/CCM.0b013e3181a590da
Martina, J. R., Westerhof, B. E., Van, G. J., de Beaumont, E. M., Truijen, J., Kim, Y. S., et al. (2012). Noninvasive continuous arterial blood pressure monitoring with Nexfin(R). Anesthesiology 116, 1092–1103. doi: 10.1097/ALN.0b013e31824f94ed
Matzen, S., Perko, G., Groth, S., Friedman, D. B., and Secher, N. H. (1991). Blood volume distribution during head-up tilt induced central hypovolaemia in man. Clin. Physiol. 11, 411–422. doi: 10.1111/j.1475-097X.1991.tb00813.x
McGee, S., Abernethy, W. B. III., and Simel, D. L. (1999). The rational clinical examination. Is this patient hypovolemic? J. Am. Med. Assoc. 281, 1022–1029. doi: 10.1001/jama.281.11.1022
Michard, F., Boussat, S., Chemla, D., Anguel, N., Mercat, A., Lecarpentier, Y., et al. (2000). Relation between respiratory changes in arterial pulse pressure and fluid responsiveness in septic patients with acute circulatory failure. Am. J. Respir. Crit. Care Med. 162, 134–138. doi: 10.1164/ajrccm.162.1.9903035
Michard, F., and Teboul, J. L. (2002). Predicting fluid responsiveness in ICU patients: a critical analysis of the evidence. Chest 121, 2000–2008. doi: 10.1378/chest.121.6.2000
Myburgh, J. A. (2011). Fluid resuscitation in acute illness–time to reappraise the basics. N. Engl. J. Med. 364, 2543–2544. doi: 10.1056/NEJMe1105490
Ogoh, S., Brothers, R. M., Barnes, Q., Eubank, W. L., Hawkins, M. N., Purkayastha, S., et al. (2005). The effect of changes in cardiac output on middle cerebral artery mean blood velocity at rest and during exercise. J. Physiol. 569(Pt 2), 697–704. doi: 10.1113/jphysiol.2005.095836
Panerai, R. B. (2004). System identification of human cerebral blood flow regulatory mechanisms. Cardovasc. Eng. Int. J. 4, 59–71. doi: 10.1023/B:CARE.0000025123.43747.e1
Panerai, R. B., Dawson, S. L., and Potter, J. F. (1999). Linear and nonlinear analysis of human dynamic cerebral autoregulation. Am. J. Physiol. Heart Circ. Physiol. 277(3 Pt 2), H1089–H1099.
Pawelczyk, J., Matzen, S., Friedman, D. B., and Secher, N. H. (1994). “Cardiovascular and hormonal responses to central hypovolaemia in humans,” in Blood Loss and Shock, eds N. H. Secher, J. A. Pawelczyk, and J. Ludbrook (London: Edward Arnold), 25–36.
Preisman, S., Kogan, S., Berkenstadt, H., and Perel, A. (2005). Predicting fluid responsiveness in patients undergoing cardiac surgery: functional haemodynamic parameters including the Respiratory Systolic Variation Test and static preload indicators. Br. J. Anaesth. 95, 746–755. doi: 10.1093/bja/aei262
Rickards, C. A., Vyas, N., Ryan, K. L., Ward, K. R., Andre, D., Hurst, G. M., et al. (2014). Are you bleeding? Validation of a machine-learning algorithm for determination of blood volume status: application to remote triage. J. Appl. Physiol (1985) 116, 486–494. doi: 10.1152/japplphysiol.00012.2013
Riley, R. L., Permutt, S., Said, S., Godfey, M., Cheng, T. O., Howell, J. B. L., et al. (1959). Effect of posture on pulmonary dead space in man. J. Appl. Physiol. 14, 339–344.
Rowell, L. B. (1986). Human Circulation Regulation During Physical Stress. Oxford: Oxford University Press.
Roy, C. S., and Sherrington, C. S. (1890). On the regulation of the blood supply to the brain. J. Physiol. (Lond.) 11, 85–108.
Sander-Jensen, K., Secher, N. H., Bie, P., Warberg, J., and Schwartz, T. W. (1986). Vagal slowing of the heart during haemorrhage: observations from 20 consecutive hypotensive patients. Br. Med. J. 292, 364–366. doi: 10.1136/bmj.292.6517.364
Secher, N. H., and Van Lieshout, J. J. (2005). Normovolaemia defined by central blood volume and venous oxygen saturation. Clin. Exp. Pharmacol. Physiol 32, 901–910. doi: 10.1111/j.1440-1681.2005.04283.x
Secher, N. H., and Van Lieshout, J. J. (2010). Heart rate during haemorrhage: time for reappraisal. J. Physiol. 588(Pt 1), 19. doi: 10.1113/jphysiol.2009.184499
Serrador, J. M., Picot, P. A., Rutt, B. K., Shoemaker, J. K., and Bondar, R. L. (2000). MRI measures of middle cerebral artery diameter in conscious humans during simulated orthostasis. Stroke 31, 1672–1678. doi: 10.1161/01.STR.31.7.1672
Shepherd, J. T., and Vanhoutte, P. M. (1979). The Human Cardiovascular System. Facts and Concepts. New York, NY: Raven Press.
Shoemaker, J. K., O'Leary, D. D., and Hughson, R. L. (2001). PET(CO2) inversely affects MSNA response to orthostatic stress. Am. J. Physiol. Heart Circ. Physiol. 281, H1040–H1046.
Sjöstrand, T. (1953). Volume and distribution of blood and their significance in regulating the circulation. Physiol. Rev. 33, 202–225.
Soubrier, S., Saulnier, F., Hubert, H., Delour, P., Lenci, H., Onimus, T., et al. (2007). Can dynamic indicators help the prediction of fluid responsiveness in spontaneously breathing critically ill patients? Intensive Care Med. 33, 1117–1124. doi: 10.1007/s00134-007-0644-9
Ten Harkel, A. D. J., Baisch, F., and Karemaker, J. M. (1992). Increased orthostatic blood pressure variability after prolonged head down tilt. Acta Physiol. Scand. 144(S604), 89–99.
Truijen, J., Van Lieshout, J. J., Wesselink, W. A., and Westerhof, B. E. (2012). Noninvasive continuous hemodynamic monitoring. J Clin. Monit. Comput. 26, 267–278. doi: 10.1007/s10877-012-9375-8
Van Lieshout, J. J., Harms, M. P., Pott, F., Jenstrup, M., and Secher, N. H. (2005). Stroke volume of the heart and thoracic fluid content during head-up and head-down tilt in humans. Acta Anaesthesiol. Scand. 49, 1287–1292. doi: 10.1111/j.1399-6576.2005.00841.x
Van Lieshout, J. J., and Wesseling, K. H. (2001). Continuous cardiac output by pulse contour analysis? Br. J. Anaesth. 86, 467–469. doi: 10.1093/bja/86.4.467
Van Lieshout, J. J., Wieling, W., Karemaker, J. M., and Secher, N. H. (2003). Syncope, cerebral perfusion, and oxygenation. J. Appl. Physiol. 94, 833–848.
Westerhof, B. E., Gisolf, J., Karemaker, J. M., Wesseling, K. H., Secher, N. H., and Van Lieshout, J. J. (2006). Time course analysis of baroreflex sensitivity during postural stress. Am. J. Physiol. Heart Circ. Physiol. 291, H2864–H2874. doi: 10.1152/ajpheart.01024.2005
Willie, C. K., Tzeng, Y. C., Fisher, J. A., and Ainslie, P. N. (2014). Integrative regulation of human brain blood flow. J. Physiol. 592, 841–859. doi: 10.1113/jphysiol.2013.268953
Keywords: arterial pulse pressure, arterial systolic pressure, cerebrovascular circulation, fluid therapies, body fluids, head-up tilt, spontaneous breathing
Citation: Bronzwaer A-SGT, Stok WJ, Westerhof BE and van Lieshout JJ (2014) Arterial pressure variations as parameters of brain perfusion in response to central blood volume depletion and repletion. Front. Physiol. 5:157. doi: 10.3389/fphys.2014.00157
Received: 29 November 2013; Accepted: 03 April 2014;
Published online: 23 April 2014.
Edited by:
Patrice Brassard, Laval University, CanadaReviewed by:
Caroline Alice Rickards, The University of North Texas Health Science Center, USACopyright © 2014 Bronzwaer, Stok, Westerhof and van Lieshout. This is an open-access article distributed under the terms of the Creative Commons Attribution License (CC BY). The use, distribution or reproduction in other forums is permitted, provided the original author(s) or licensor are credited and that the original publication in this journal is cited, in accordance with accepted academic practice. No use, distribution or reproduction is permitted which does not comply with these terms.
*Correspondence: Johannes J. van Lieshout, Acute Admissions Unit, Department of Internal Medicine, F7-252, Academic Medical Center, University of Amsterdam, PO Box 22700, 1100 DE Amsterdam, Netherlands e-mail:ai5qLnZhbmxpZXNob3V0QGFtYy51dmEubmw=
Disclaimer: All claims expressed in this article are solely those of the authors and do not necessarily represent those of their affiliated organizations, or those of the publisher, the editors and the reviewers. Any product that may be evaluated in this article or claim that may be made by its manufacturer is not guaranteed or endorsed by the publisher.
Research integrity at Frontiers

Learn more about the work of our research integrity team to safeguard the quality of each article we publish.