- 1 Department of Mechanical Engineering, Johns Hopkins University, Baltimore, MD, USA
- 2 Institute for Computational Medicine, Johns Hopkins University, Baltimore, MD, USA
- 3 Division of Otolaryngology, George Washington University, Washington, DC, USA
Advances in high-performance computing are enabling a new generation of software tools that employ computational modeling for surgical planning. Surgical management of laryngeal paralysis is one area where such computational tools could have a significant impact. The current paper describes a comprehensive effort to develop a software tool for planning medialization laryngoplasty where a prosthetic implant is inserted into the larynx in order to medialize the paralyzed vocal fold (VF). While this is one of the most common procedures used to restore voice in patients with VF paralysis, it has a relatively high revision rate, and the tool being developed is expected to improve surgical outcomes. This software tool models the biomechanics of airflow-induced vibration in the human larynx and incorporates sophisticated approaches for modeling the turbulent laryngeal flow, the complex dynamics of the VFs, as well as the production of voiced sound. The current paper describes the key elements of the modeling approach, presents computational results that demonstrate the utility of the approach and also describes some of the limitations and challenges.
Introduction
Voice is a critical component of the unique human attribute known as speech. In addition to being the primary mode of communication, our voice allows us to create music and express our emotions. Our voice is produced through the process of phonation in the larynx. Phonation is initiated by a series of neural commands to the various extrinsic and intrinsic laryngeal muscles. These muscles (the thyroarytenoid, posterior cricoarytenoid, cricothyroid, and lateral cricoarytenoid) adduct and abduct the vocal folds (VFs), which are complex, multi-layered structures, and adjust their tension during phonation (Figure 1). The adduction of the VFs closes the glottis, thereby creating a barrier for the expulsion of air from the lungs. As air is forced from the lungs, the adducted VFs are pushed apart due to air pressure, and if the conditions are right, the VFs are set into sustained flow-induced vibrations (Figure 2A). The VF vibrations produce a pulsatile turbulent “glottal jet” (Figure 2B) and this jet, along with the time-varying aerodynamic forces on the VFs are directly responsible for the generation of sound in this larynx. For a normal larynx, most of the acoustic energy is contained in the so-called fundamental phonation frequency (F0) and its super-harmonics. The spectrum of the sound produced in the larynx is subsequently modified by a person’s oral and nasal pharynx and finally, shaped into speech by the coordinated movements of the oral cavity, tongue, palate, teeth, and lips.
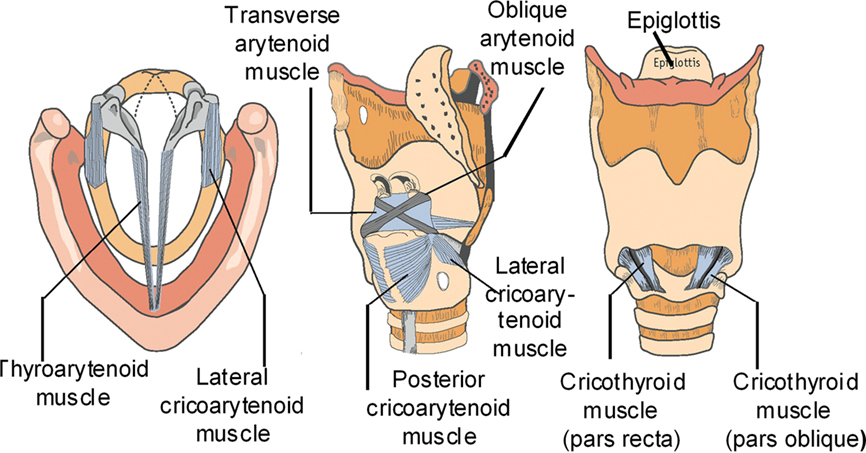
Figure 1. From left to right, axial, oblique, and anterior views of the laryngeal cartilages and intrinsic laryngeal muscles.
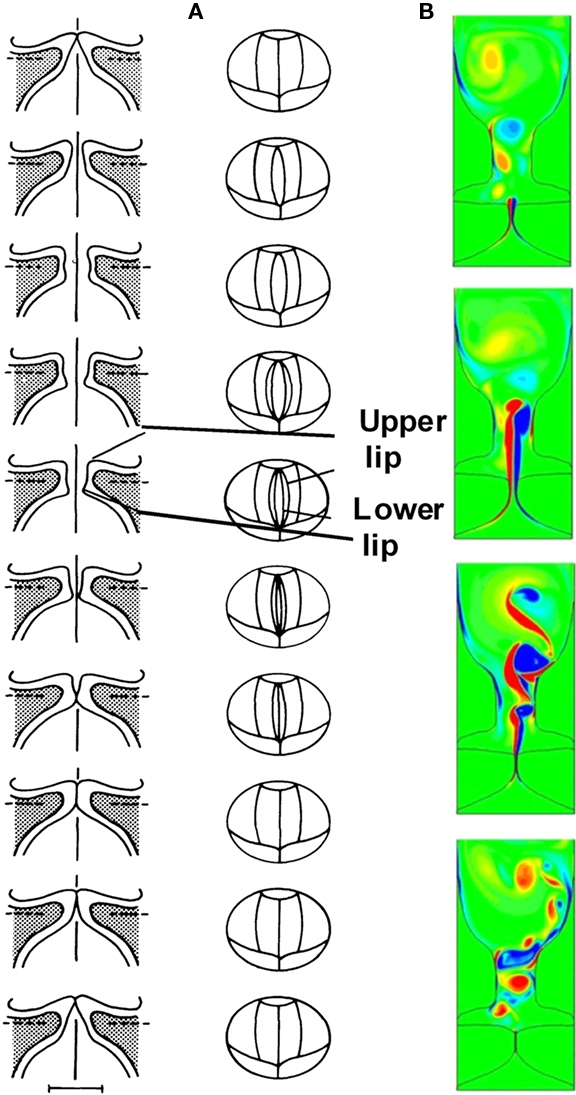
Figure 2. (A) Flow-induced vibrations in vocal folds (B) Glottal jet is produced due to vocal folds vibration (Zheng et al., 2010).
Clinical Significance
While the majority of the population is accustomed to normal voice production, at some point in our lives, at least 20% of the human population will develop a voice production disorder. Only during these times do most of us take note of our sound source. One of the most common illnesses that affects voice production is partial weakness of the vocal cord, i.e., vocal fold paresis or paralysis (VFP). A weakness in one side of the larynx leads to asymmetry in vibration of the VFs (Figure 3A). Asymmetrical vibration along with incomplete glottal closure at the moment when the VFs should be closed causes a “leaky valve” and inefficient coupling of the VF tissue with the air stream. Incomplete VF closure during vibration leads to hoarseness and glottal closure symptoms. Glottal closure symptoms include increased effort with voice production, voice fatigue, decreased loudness, and discomfort with prolonged voice use. If VF closure is severely limited, these patients may not be able to speak more than three words before they need to take another breath to continue speaking. VFP can be severely debilitating and impair basic communication in the workplace, at home, and in society. Other common illnesses that affect VF closure include VF nodules, cysts, polyps, papilloma, and carcinoma (Figure 3B). VF closure is affected by a mass effect associated with the epithelium and/or the subepithelial tissues in these benign and malignant lesions.
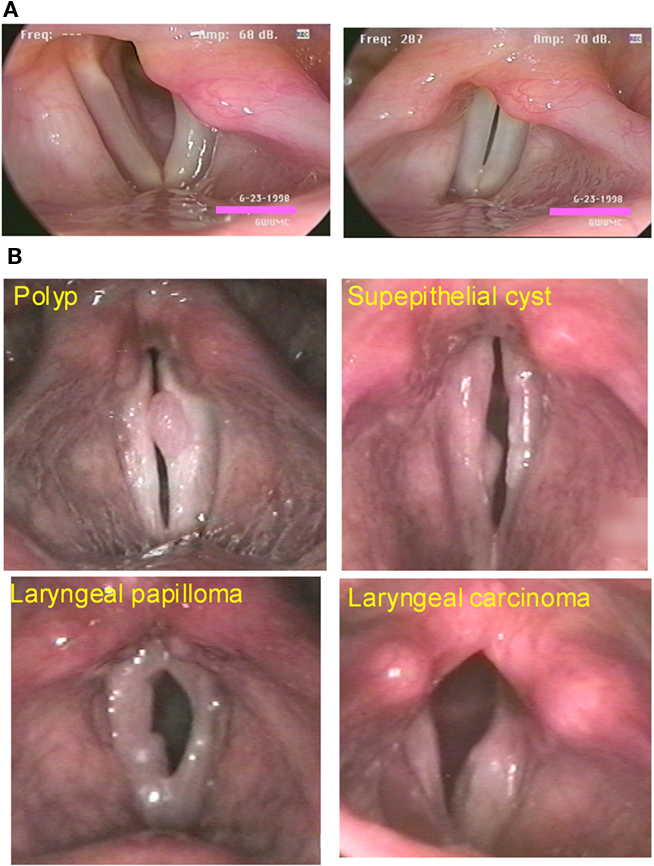
Figure 3. (A) Abduction and adduction of the larynx in a patient with a vocal fold paresis on the left side of the image. (B) Some common illnesses that affect vocal fold closure.
Simulation-Based Assessment and Surgery Planning Tool
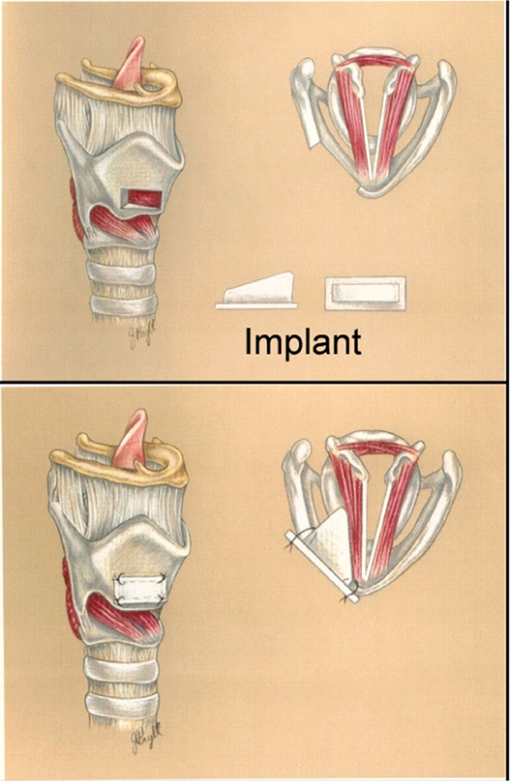
Phonation is governed primarily by the principles of aerodynamics, structural-dynamics, and aero-structural interaction – that are all squarely within the discipline of engineering. As such engineers/physicists have attempted to uncover the physical mechanisms underlying voice since at least the 1940s. With the advances in computational hardware and software however, the possibility of introducing computational biomechanics models into the clinical setting, for assessment of pathologies as well as to aid surgery, is becoming a reality. By performing a fundamental analysis of VF vibration in the normal and abnormal larynx, we can better discern subtle differences in the mechanism of glottal incompetence. By having a more detailed understanding of the interaction of the VF mucosa with the superficial lamina propria and the underlying VF musculature, we can develop improved diagnostic techniques for patients with glottal incompetence. One candidate for such simulation-assisted therapies is VFP which is often treated with a surgical implant placed within the VF, a procedure called a medialization laryngoplasty (Figure 4). The goal of a medialization laryngoplasty is to accurately place an implant in the VF at the exact location of the membranous VF. The contour of the implant must be such that a uniform amount of pressure is placed along the length of the VF during voice production. However, subtle changes in implant shape could produce profound effects on the dynamical properties of the VF. Currently, modifications in the implant size and shape rely upon surgical intuition and experience as well as changes in the laryngeal configuration and voice production during surgery. While subtle changes in the implant provide varying degrees of success with the surgical procedure, up to 25% (Bielamowicz, 2004) of patients will require additional procedures to enhance glottal closure, including modification of the original implant shape and location.
A concerted effort has been made in recent years to develop realistic computer models of phonatory VF function and glottal flow (Berry and Titze, 1996; Kob et al., 1999; Alipour and Scherer, 2000; Alipour et al., 2000; Jiang et al., 2001; Avanzini and Rocchesso, 2002; deVries et al., 2002; Zhao et al., 2002; Gunter, 2003; LaMar et al., 2003; Rosa et al., 2003). However, due to a number of reasons the goal remains elusive. First, parameterization of VF anatomy and physiology is far from complete. Second, in our view, modeling/computational approaches that have been used to date impose constraints on the level of realism that can be injected into these computer models. Due to this lack of realism, even though these computer models are providing invaluable insight into the biophysics of phonation, they have found limited direct use in the clinical community.
Development of such a computational model requires not only the incorporation of realistic VF anatomy (geometry and mechanical properties), but also the use of a simulation approach which, given an anatomically realistic description of the VFs, can then accurately reproduce the complex spatio-temporal dynamics associated with glottal airflow and VF vibration. Such a capability has become possible by combining modern scanning/imaging and geometric reconstruction techniques with recently developed continuum mechanics based models of the VFs and state-of-the-art computational fluid dynamics (CFD) techniques. Due to the demand for high-fidelity, these simulations are computationally intensive and another key enabling factor is the use of large-scale parallel computation.
Methods
We describe the key features of a simulation-based surgery planning tool that is designed to predict the optimal placement and shape of the VF implant based upon data from the pre-operative laryngeal endoscopy and CT scan. By using the normal VF’s motion, we can predict the optimal tissue deformation needed to reconstitute glottal closure during voice production. We propose simulating the VF vibration of the paretic and normal VF from a subject with VFP. A tissue deformation with a simulated implant would be performed on the paretic VF such that tissue deformation of the paretic VF would reproduce the normal VF. Thus, both VFs vibrate symmetrically in the model. By using this technique, the surgeon will know the exact shape and position of the VF implant before the surgery. As such, this modeling technique will provide a pre-operative planning tool. The surgeon will shape the implant according to the specification of the model and will be placed through the larynx using additional computer-based tools that will guide the surgeon on the optimal placement of the implant. The additional computer-based tools will allow the surgeon to see the internal laryngeal anatomy by looking through the cartilage and will fuse images obtained from laryngeal endoscopy. By fusing this data with pre-operative CT images, the surgeon will have an exacting knowledge of the ideal location of the surgical implant. The key features of the computer model are:
1. Image Based Geometric Reconstruction of Vocal Fold and Glottal Anatomy: All simulations of VF vibrations to date have employed idealized/simplified VF and airway lumen geometries (Berry and Titze, 1996; Kob et al., 1999; Alipour and Scherer, 2000; Alipour et al., 2000; Jiang et al., 2001; Avanzini and Rocchesso, 2002; deVries et al., 2002; Zhao et al., 2002; Gunter, 2003; LaMar et al., 2003; Rosa et al., 2003). However, given the wide variations found in laryngeal and VF anatomy (Bielamowicz, 2004), use of such idealized VF geometries would be incommensurate with the high-fidelity continuum mechanics and CFD techniques that are to be employed here. Furthermore, for this to be a viable surgery planning tool, it is essential to include as much patient-specific laryngeal and VF anatomical information as possible. In the current approach, thin-slice CT scans of the larynx and image reconstruction techniques are used to extract three-dimensional geometrical models of the VFs and airway lumen.
2. Continuum Mechanics Based Model of the Vocal Folds: Significant progress has been made in this area since the seminal work of Ishizaka and Flanagan (1972) and Titze (1973), where limited degree-of-freedom lumped element models were proposed. In the current approach, the VF model is based on sophisticated continuum models which lead to higher accuracy in the spatial as well as temporal resolution of the VF dynamics. The model being employed includes (1) three-layered VF structure with the cover, ligament, and VF body modeled as transversely isotropic but distinct materials based on well established experimental data (Hirano et al., 1982; Alipour and Titze, 1985, 1991, 2000; Min et al., 1995; Chan and Titze, 1999), (2) a physics-based VF collision model (Gunter, 2003; Rosa et al., 2003) which minimizes the use of ad hoc contact mechanisms (Alipour and Scherer, 2000; Alipour et al., 2000) and (3) modeling of implant as a distinct rigid entity with pre-specified shape and material properties.
3. High Resolution Modeling of Glottal Aerodynamics: Glottal airflow during phonation is highly complex due to the inherent unsteadiness imposed by the VF vibration as well as transition to turbulence in the glottal jet. Turbulence in the glottal jet plays a major role in sound production and therefore, the computer model should have the ability to accurately represent the turbulence. Many past studies have employed very rudimentary models for the glottal flow (Kob et al., 1999; Jiang et al., 2001; Avanzini and Rocchesso, 2002; LaMar et al., 2003). In the current study, we employ direct numerical simulation (DNS) and large-eddy simulation (LES) approaches for modeling the fluid dynamics. These approaches can accurately reproduce a wide range of the spatial and temporal scales in the flow, thereby improving overall fidelity and producing high-quality data, which can yield excellent insight into the flow physics. Such approaches have become the gold standard in scientific investigations of engineering flows (Moin and Mahesh, 1998; Piomelli, 1999) and have only been applied to physiological flows (Mittal et al., 2001; Zhao et al., 2002; Mittal, 2003) in the last decade.
4. Direct Computation of Voiced Sound: A significant capability that has been included in our computational model is direct computation of aero-acoustic sound generation and propagation associated with human phonation. This feature provides data that can be directly compared with the measurements from laryngeal examinations, and enables us to draw clear connections between biomechanics and voice. The ability to directly compute the sound also has implications for the clinical usage of the computer-based surgery planning tool, since it will allow the surgeon to clearly assess the voice characteristics associated with different implant configuration.
Results and Discussion
In this section we provide an overview of the results obtained from our simulations. The focus here is to provide results that are representative rather than comprehensive. Toward the end of this section, we also describe some of the limitations and challenges associated with the current modeling approach.
Continuum Based Modeling of Vocal Fold Dynamics
In this section, we describe the continuum based modeling of the VFs dynamics using a finite-element solver. An open-source C++ finite-element solver Tahoe1 is employed for the solid domain, which offers a variety of constitutive models and can handle large solid deformations. The equations governing VF vibration and deformation are the Navier equations, written as:

where i and j range from 1 to 3, σ is the stress tensor, fi is the body force component in the i direction, σs is the density of the solid, and di is the component of tissue displacement in the i direction. The VFs are modeled as non-linear viscoelastic material (Resse and Govindjee, 1998) and geometric as well as material non-linearities are included in these models where appropriate.
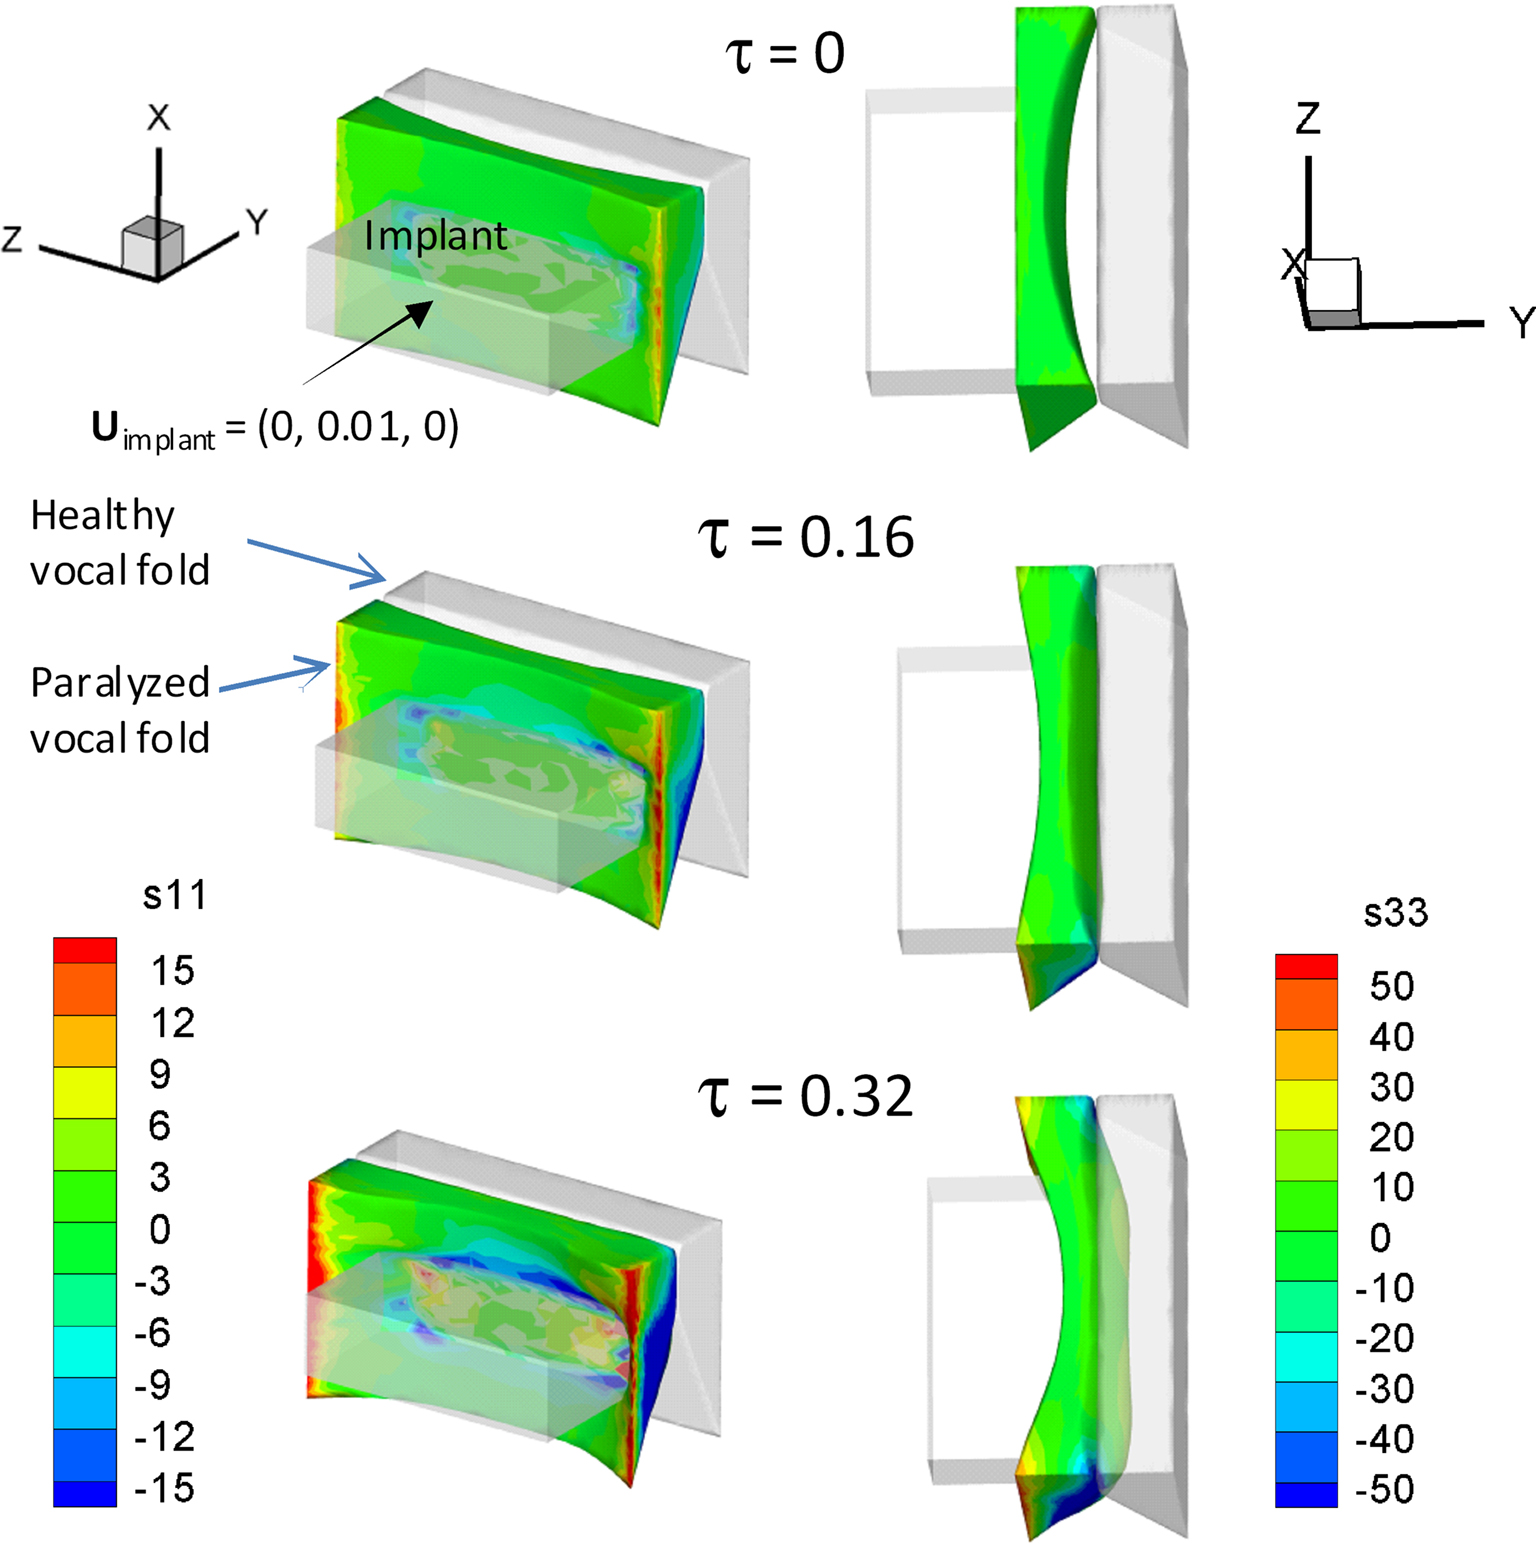
Normal VF vibration is adequately modeled as a small-strain, linear, viscoelastic problem, and later sections will describe results associated with this condition. Here we present results for a case where large-strain and the associated geometric non-linearity cannot be ignored. As depicted in Figure 3A, a patient with VFs paralysis/paresis in his/her left VF is not able to medialize (bring to center) the VFs, thereby leaving a gap between the two VFs during attempted phonation. Note that the left and right columns in Figure 5 show the side and top views of the VFs, respectively. The implant and the healthy VF are shown in gray while the paralyzed VF is represented in color. Incomplete closure does not allow robust flow-induced vibrations to occur in the VFs and can lead to complete loss of voice or a weak or breathy voice. The common treatment for this type of disease is medialization laryngoplasty, wherein the surgeon opens a window in the patient’s thyroid cartilage and inserts a surgical implant into the paralyzed VF to push it to the center (Isshiki et al., 1974). This thyroplasty implant is a patient-specific device that must be properly aligned in reference to the underlying VF and have a size and shape such that it medializes the VF and alters the vibratory characteristics of the VF to a state that most closely resembles that of the healthy VF. Usually surgeons use trial-and-error to intra-operatively decide the configuration and location of the implant. This procedure is highly dependent on the experience of the surgeon and high (up to 24%) revision rates have been reported for this type of surgery (Bielamowicz, 2004).
The medialization of the paralyzed VF can be modeled using FEM and the results of our Tahoe-based FEM modeling are shown in Figure 5. During the simulation, the position of healthy VF is held fixed. In keeping with typical anatomical values for a human adult, the VFs are assumed to be 2 cm long, extend a maximum of 0.4 cm toward the glottal midline and the inferior–superior size of the VFs is 1.2 cm. A 31,143 tetrahedral elements grid is used to represent the entire three-dimensional VF. The boundary conditions are as follows: the side surfaces (x–y plane) of the VFs are fixed in time; there is no traction force on the surface (x–z plane) which is facing the implant and not in contact with the implant; and the surface which is in contact with the implant moves into the VF with a constant but very slow velocity. The material properties of the VF are considered spatially uniform and the following tissue properties are used in the simulation (Zheng et al., 2009): density (σ) = 1043 kg/mm3, Young’s Modulus (E) = 104 kPa, Poisson ratio (ν) = 0.30, and damping coefficient of the viscoelastic tissue (η) = 5 poise. The shapes of the VFs are shown at different dimensionless times in Figure 5 and the dimensionless stresses in the VF are shown via the color contours. At τ = 0, the implant starts penetrating the VF and at τ = 0.16, the paralyzed VF moves to the midline. At this time, the stresses near the side surfaces of the VF are the largest. At τ = 0.32, the paralyzed VF starts penetrating the healthy VF (shown in gray) and large stresses develop near the side surfaces of the VF (Figure 5). We expect that the demonstrated computational tool will enable surgeons to predict the position of the VF and implant during the surgery.
Immersed Boundary Method for Glottal Aerodynamics
Glottal flow during phonation is highly complex due to the inherent unsteadiness imposed by the VF vibrations, the complex flow and supraglottal structure interaction as well as transition to turbulence in the glottal jet. The governing equation for the glottal flow are the unsteady Navier–Stokes equations given by

where i, j = 1, 2, 3, vi are the velocity components, p is the pressure, and σ and ν are the fluid density and kinematic viscosity. These equations are discretized using a cell-centered, collocated (non-staggered) arrangement of the primitive variables vi, p. In addition, the face-center velocities, Ui, are computed and stored. This separate computation of face velocity, which was initially proposed by Zang et al. (1994), results in discrete mass-conservation to machine accuracy and leads to a more accurate and robust solution procedure. The fractional-step method of van Kan (1986) is used to integrate the equations in time and this consists of three sub-steps. The first sub-step requires the solution of an advection–diffusion equation. In this sub-step, a second-order Adams–Bashforth scheme is employed for the convective terms while the diffusion terms are discretized using an implicit Crank–Nicolson scheme which eliminates the viscous stability constraint. The second sub-step requires the solution of the pressure correction equation which is solved with the constraint that the final velocity be divergence-free. Once the pressure is obtained, the velocity field is updated to its final value in the final sub-step.
A multi-dimensional ghost-cell methodology is used to incorporate the effect of the immersed boundary on the flow. This method falls in the category of sharp-interface immersed boundary methods (IBM; Mittal and Iaccarino, 2005). In this method, the body surface, such as VF and airway lumen surface, is represented by an unstructured grid with triangular elements and this surface is immersed into the Cartesian volume grid. The Cartesian cells are identified as solid-cells or fluid-cells depending on whether they are inside or outside the immersed body. The method proceeds by identifying the ghost cells which are solid cells which have at least one fluid cell neighbor (Figure 6). A “probe” is then extended from one of these ghost cells onto an “image-point” inside the fluid such that it intersects normal to the immersed boundary and the boundary intercept is midway between the ghost-node and the image-point. Next, a bi-linear interpolation (tri-linear in three-dimensional) is used to express the value of a generic flow variable at the image-point in terms of the surrounding nodes. Following this, the value of the variable at the ghost-cell is computed by using a central-difference approximation along the normal probe such that the prescribed boundary condition at the boundary intercept is incorporated. To ensure local and global second-order accuracy in the computations in the procedure, boundary conditions on the immersed boundary are prescribed to second-order accuracy and a second-order accurate discretization is employed for the fluid cells.
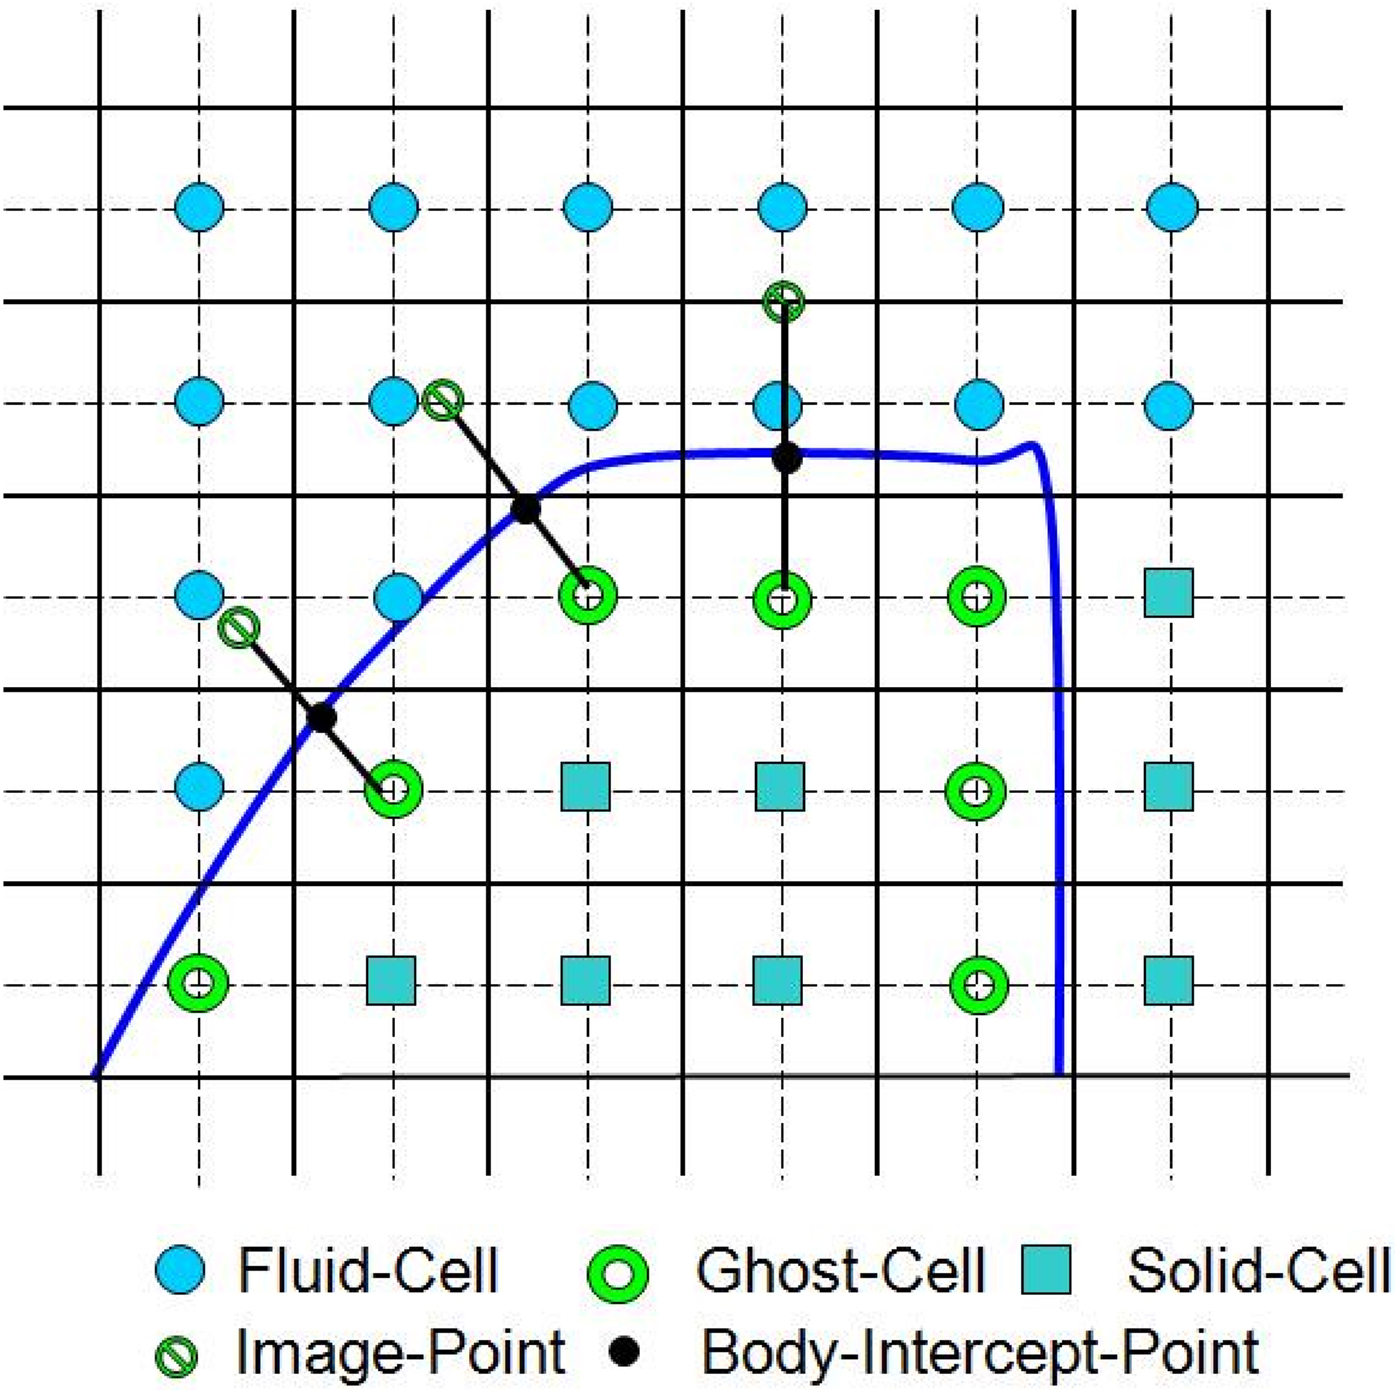
Figure 6. Schematic describing ghost-cell methodology (adapted from Zheng et al., 2010).
Boundary motion can now be included into this formulation with relative ease. The governing equations are written in the Eulerian form, and we move the boundary at a given time-step, recompute the body-intercepts, image-points, and then advance the flow equations in time. The boundary motion is accomplished by moving the nodes of the surface triangles as determined by the solid deformation. The general framework can therefore be considered as Eulerian–Lagrangian, wherein the immersed boundaries are explicitly tracked as surfaces in a Lagrangian mode, while the flow computations are performed on a fixed Eulerian grid. Details of the IBM can be found in Reference (Mittal et al., 2008).
To minimize the use of ad hoc assumptions in turbulence modeling, DNS and LES approaches are employed; these are two of the most accurate approaches currently available for flow modeling. As compared to LES, DNS is more accurate and demands a higher temporal and spatial resolution (Moin and Mahesh, 1998; Lin et al., 2007). As an alternative, LES produces quite accurate results at a computational cost which is significantly lower than a corresponding DNS. The application of LES to physiological flows has been shown to be quite effective by Mittal et al. (2001, 2003) and Choi et al. (2009) among others. The subgrid scale (SGS) model used in the current LES employs the dynamic global coefficient form of the algebraic eddy viscosity model introduced by Vreman (2004). This model is implemented within our Cartesian grid based IBM and has been validated against canonical flows including turbulent channel flow and flow past a circular cylinder (Ramakrishnan et al., 2009).
A high spatial and temporal resolution and long integration times are usually required for the patient-specific simulations to provide an accurate boundary representation and the meaningful statistical data from multiple phonatory cycles. Such three-dimensional simulations are extremely challenging due to the computational expense involved and this has severely limited the deployment of three-dimensional laryngeal computational models. To alleviate this computational expense and reduce reasonable turn-around time for these simulations, two computational techniques – multi-grid method and parallelization, are employed. A geometric multi-grid method is employed to solve pressure Poisson equation. In this method, the sharp-interface immersed boundaries are represented only at finest grid level. At the coarse grid levels, the interfaces are represented through the volume fraction of coarse cells without boundary reconstruction. This multi-grid method has shown a performance that scales with N1.17 where N is the number of grid points. An additive Schwartz type domain decomposition technique is used to parallelize the three-dimensional Cartesian grid immersed boundary flow solver. Parallel performance benchmarks indicate reasonable (60%) scale up on a variety of platforms for CPU-counts up to 128 for typical grids employed in the phonation models.
Phonation in CT Based Models
The accuracy of the prediction with phonatory computer models usually relies on the level of realism injected in these models, and one of the key requirements for the development of assessment and surgical management tool for laryngeal pathologies is the patient-specific modeling. To conduct a patient-specific study, we require a realistic geometric reconstruction of both the airway lumen and the VFs, as well as a capability for performing a high-fidelity simulation of flow–tissue interaction. In the current study, a thin-slice CT scan of the larynx (0.5 mm plane-to-plane resolution) has been performed on a 30-year-old male subject with normal (undiseased) VFs at The George Washington University Hospital. To be able to assess the VF surfaces, the subject was asked to phonate during the scan and the scan covers the subject’s entire larynx. This thin-slice CT scan provides sufficient spatial resolution to accurately reconstruct the anatomical structure, such as VFs, false VF, etc. Both the surface of laryngeal airway lumen and VFs are extracted from this CT scan using a commercial software, “Mimics.” Figure 7A shows three views with airway lumen highlighted and bottom right figure is the extracted three-dimensional geometry of the lumen. The three-dimensional VF surfaces, shown in Figure 7B, are reconstructed using the same dataset and software. This results in an approximate 1.0 cm (thickness) × 1.0 cm (depth) × 2.0 cm (length) dimension of VFs.
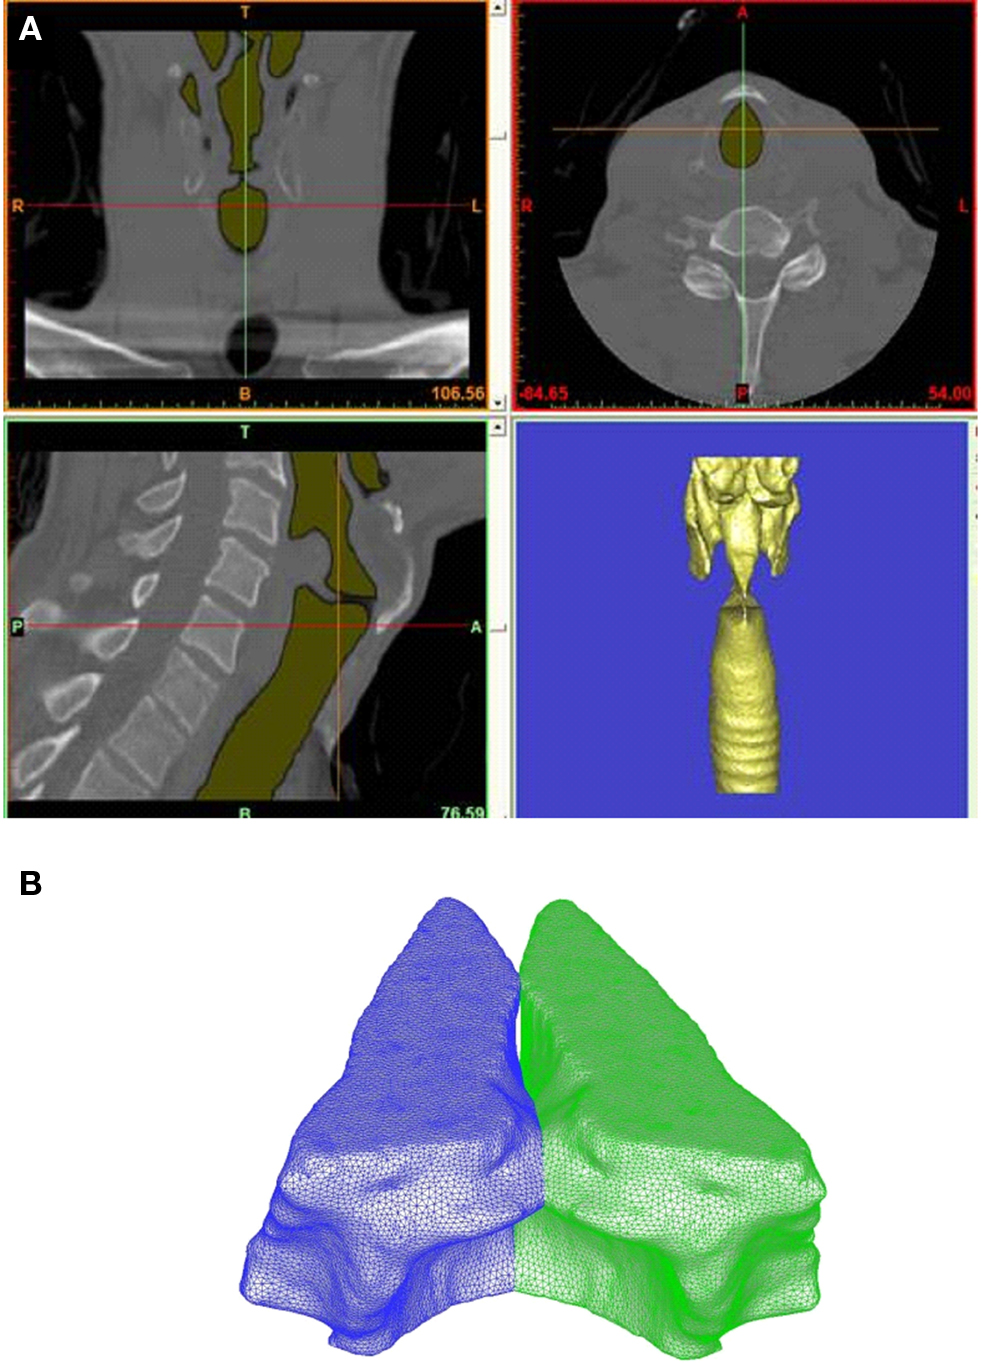
Figure 7. (A) High-resolution CT scan of normal male human larynx. Figure shows three views with airway lumen highlighted and bottom right figure shows the extracted three-dimensional geometry of the lumen. (B) Computer reconstructed vocal folds based on thin-slice CT scan.
Conducting high-fidelity flow–structure interaction simulations on the above complex geometric models are usually computationally expensive. Thus, as the first step toward patient-specific modeling, we have conducted a three-dimensional flow–structure interaction simulation based on a simplified geometric model. This simplified simulation mainly serves two purposes: (a) it is used to quickly explore difficulties and problems associated with this approach and find the proper boundary conditions and parameters in the simulation setup; (b) even with simplified geometric models, this simulation has much higher fidelity than the existing models, and it can be used to gain new insight of biophysics of phonation.
In our simplified model, the air lumen is assumed to be a 12 cm × 2.0 cm × 1.5 cm straight rectangular duct. There is no longitudinal variation in both VFs and false vocals surfaces and their cross-sectional profiles are extracted from one coronal view of the CT scan (shown in Figure 7A left up figure). As shown in Figure 8, the VFs are located from x = 2.16–3.16 cm in the stream-wise direction which results in a location of the glottal exit exactly at x = 3 cm. The pressure is prescribed at the inlet and exit and the pressure drop is kept at a typical value of 1 kPa (Titze, 1994). The Hirano’s (1977) three-layer histology is used to model the VF internal anatomical structure. The configurations of these layers are adopted from Luo et al. (2008) and material properties of these layers are given in Table 1. The Reynolds number based on the peak flux averaged velocity, maximum glottal gap width, and kinematic viscosity is about 210.
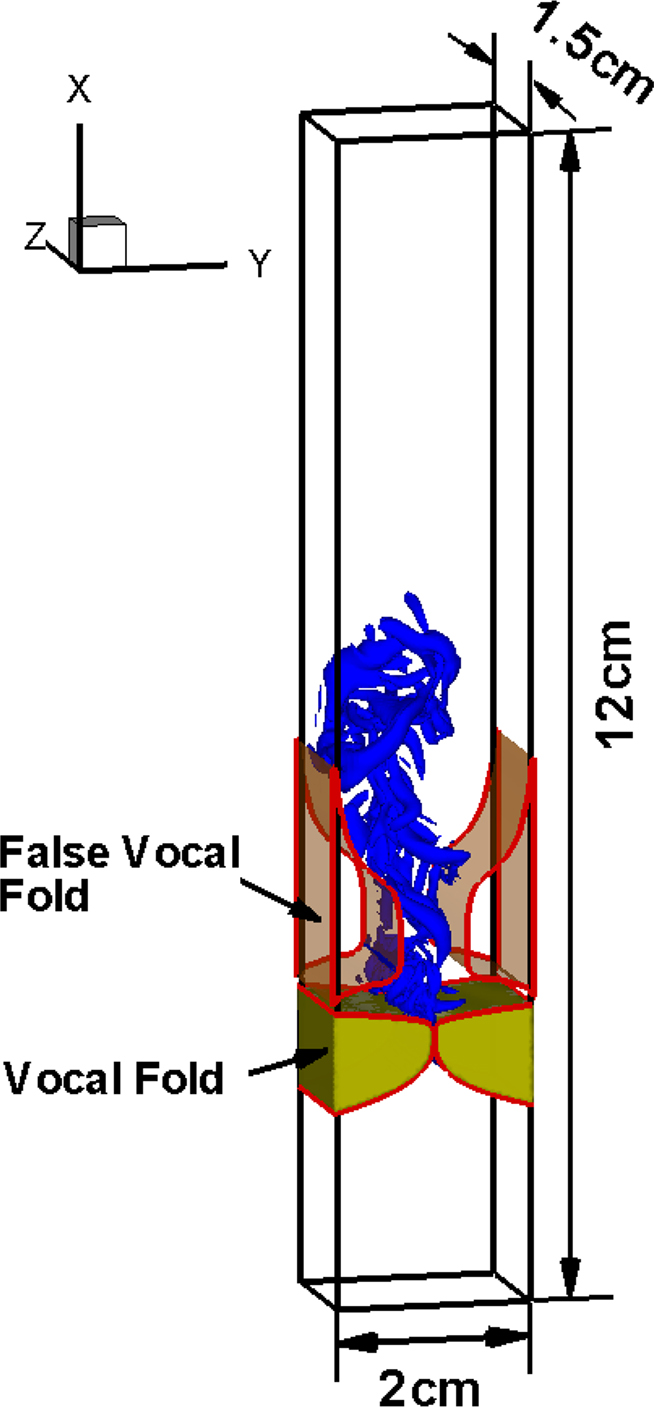
Figure 8. Computational domain and computed flow structures in a three-dimensional model of the larynx.
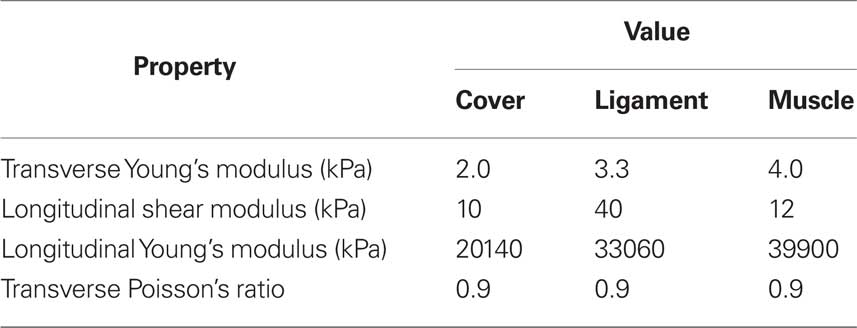
Table 1. Material properties for three layers of the vocal fold model based on Alipour et al. (2000) and Cook et al. (2008).
This simulation employs a non-uniform 256 × 128 × 64 Cartesian grid for the flow solver and a 58,427 tetrahedral element grid for the solid solver. The simulation has been carried out for 21 phonatory cycles in order to extract meaningful statistics. Figure 9A shows the time variation of glottal flow rate. The typical mean glottal flow rate measured in the experiments ranges from 110 to 220 ml/s (Zemlin, 1998) and the peak glottal flow rate ranges 200–580 ml/s (Hertegard et al., 1992). In the current study, the mean glottal flow rate and phase-averaged peak glottal flow rate are 121 and 298 ml/s respectively, which fall within these typical ranges. More details on the modeling and computational methodology used in this section are described in Zheng et al. (2010).
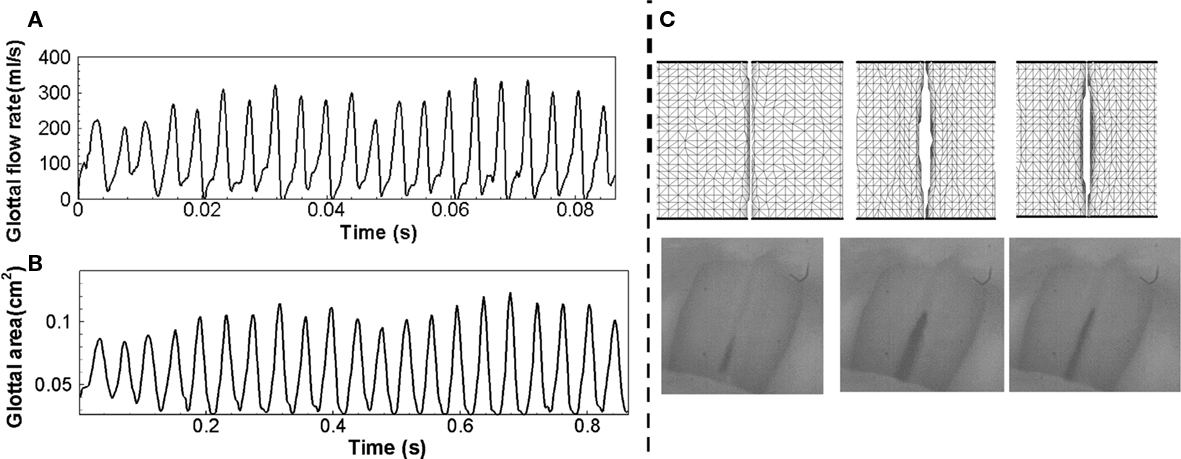
Figure 9. (A) Time variation of glottal flow rate, (B) time variation of projected glottal area, (C) Computed VF deformation (top) which can be directly compared to high-speed video recordings (bottom).
Figure 9C shows the VF vibration pattern captured in the superior views of the VFs at three different time instants within one vibration cycle, which matches the vibration pattern captured using high-speed video recordings during phonation. The projected glottal area can be computed by integrating the smallest distance between the two VFs along the longitudinal direction and Figure 9B shows the time variation of the projected glottal area. According to the modified version of van den Berg’s formula (van den Berg, 1958; Titze, 1992; Hertegard and Gauffin, 1995), the peak projected glottal area can be estimated based on subglottal pressure and peak glottal flow rate using following equation.

where A is the peak projected glottal area in cm2, U is glottal flow rate in ml/s, P is subglottal pressure in cm water, σ is air density in g/cm3, k is empirical coefficient varied between 0.9 and 1.5 depending on glottal shape and flow. The estimation of glottal area based on the current subglottal pressure and glottal flow rate ranges from 0.08 to 0.12 cm2 and the phase-averaged peak glottal area is 0.108 cm2. The fundamental phonation frequency computed using the glottal flow rate is 243 Hz, which leads to a 4.2-ms vibration period. It should be noted that this frequency is relatively high, but still within the human phonation frequency range from 60 to 260 Hz (Zemlin, 1998).
One of the primary merits of a computer-aided surgery/assessment tool is that it allows us to examine clinically relevant quantities and features that cannot be assessed by traditional diagnostic tools. For example, excessive and prolonged mechanical stresses are usually believed to be responsible for VF fatigue and damage. In extreme cases, such stress conditions cause laryngeal pathologies such as VF nodules (Figure 3B). Thus, accurate computation of the stress inside the VFs can help shed insights into such laryngeal pathologies. The contours of mechanical stresses at the longitudinal center plane of VF (z = 0.75 cm) at two extreme positions during one phonatory cycle are shown in Figure 10. Since the medial in-plane has been enforced, we only compute two normal stresses σxx, σyy, and the shear stress τxy. Figure 10A shows the contours of three stress components (σxx, σyy, and τxy) at the beginning of the opening phase. During this phase, the subglottal pressure pushes VFs to gradually open from beneath. Thus, compressive stress is observed at the inferior part of VFs, while the maximum compressive stress occurs at the inferior root. Due to the preservation of the overall volume of VFs, there is a high level of tensile stress (positive σxx and σyy) at the superior part. The large shear stress observed at the superior tip of VFs results from the traveling mucosal wave along the VF surface. Later, when the VFs are maximally opened (Figure 10B), compressive stress is still found at the inferior part of the VFs while tensile stress occurs on the surface of the glottis due to a negative intraglottal pressure. The shear stress at this stage is much smaller (50%) compared to the beginning of the opening stage.
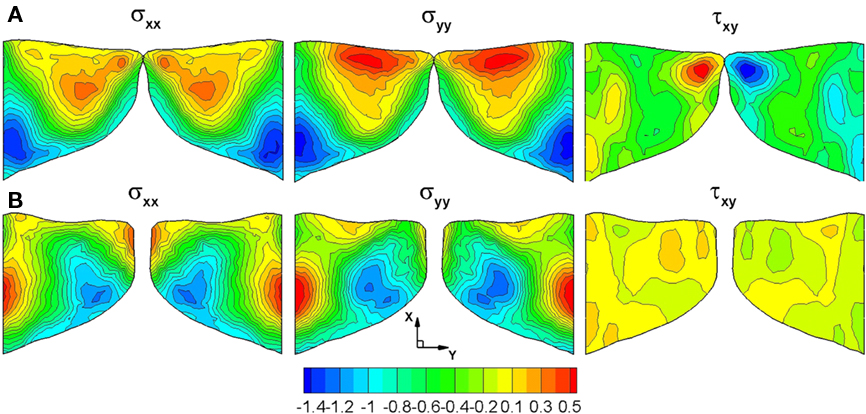
Figure 10. Stress contours (kPa) on the center plane (z = 0.75 cm) of the vocal folds during the opening and closing phase of the vibration cycle (A) Beginning of the opening phase (B) Maximal opening.
This is the first time that the high-fidelity three-dimensional flow–structure interaction simulation has been carried out to study the glottal flow and VF vibration during phonation. The key characteristics of the computed results, such as glottal flow rate, vibration pattern, and peak glottal area are found to be within the normal physiological range. Mechanical stresses have also been computed to gain insights into the laryngeal pathologies. This simulation has also proved that current approach is amenable for studying biomechanical process of phonation. Ongoing extension of the current work is focused on simulating phonation in the CT based, patient-specific laryngeal models.
Direct Computation of Voiced Sound
The surgeon makes fine adjustments to the implant shape and size intra-operatively based on feedback obtained by listening to the voiced sound of the patient. Given the important role of this feedback mechanism on the success of the surgical procedure, it is useful for the computational model to be able to predict the sound associated with various laryngeal models. We have in fact introduced such a capability into our computational model and the key features of this capability are described in this section.
It is known that the dominant source of voiced sound is the flow rate fluctuation in the vocal tract caused by the vibration of VFs in the larynx (Titze, 1994). The glottal flow rate fluctuation generates monopole sound in conjunction with the acoustic response of the vocal tract, and this monopole sound is the dominant component of voiced sound (Stevens, 1998). The typical human vocal tract system is shown in Figure 11A. The acoustic system of the vocal tract can be considered as an open-ended duct and acts as a resonator for acoustic waves. In reality, the resonance frequencies of vocal tract system are affected by the cross-sectional area variation along the vocal tract, the radiation impedance at the mouth (open-end), and other coupling effects. The resulting resonance frequencies constitute the formant frequencies of voiced sound (Stevens, 1998). Therefore, the shape of vocal tract has a significant effect on the actual voiced sound generation. There have been several computational aero-acoustics (CAA) studies of human phonation (Zhao et al., 2002; Bae and Moon, 2008; Link et al., 2009). However, all of these studies have focused on the VF vibration and laryngeal flow, and the vocal tract is assumed to be a simple, infinitely long duct. In the present study, we directly compute the voiced sound generation with realistic vocal tract geometry for a given glottal flow rate input and also consider the propagation of this sound into the ambient region outside the subject’s mouth.
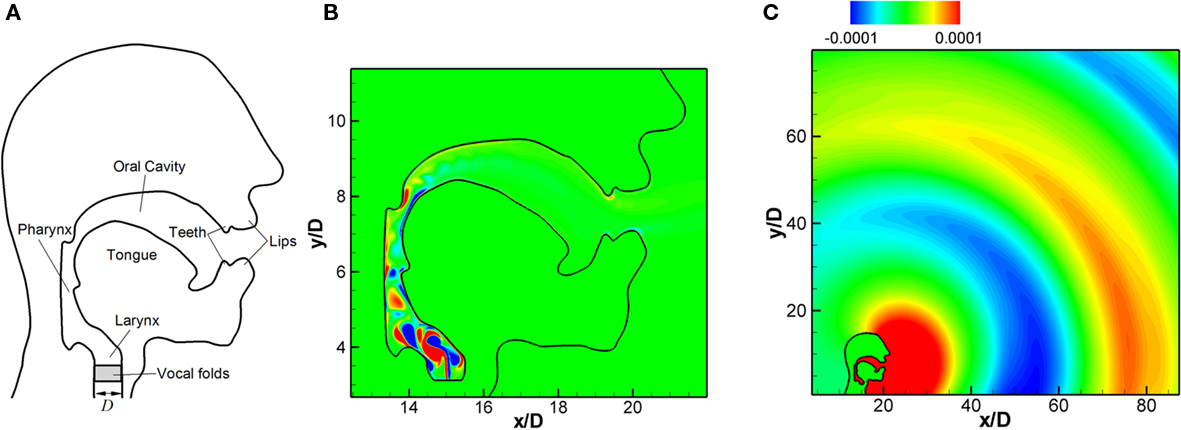
Figure 11. (A) Typical human vocal tract system (B) flow field inside the vocal tract: instantaneous vorticity contours. (C) propagation of generated voiced sound; instantaneous fluctuating pressure contours (Seo and Mittal, 2011).
The typical Mach numbers of flow through vocal tract is about M = 0.1 and at this low Mach number, solving the full compressible Navier–Stokes equations to simultaneously resolve the flow and acoustic field is usually very costly. In the current approach, the computation of voiced sound generation is performed using a hydrodynamic/acoustic splitting method (Seo and Moon, 2006). In this hybrid approach, the flow at low Mach numbers is approximated as an incompressible flow and the flow field is computed efficiently with the incompressible flow solver described in previous section. The acoustic field is then modeled by using a perturbed compressible equation with the computed flow field data. In this study we employ the linearized perturbed compressible equations (LPCE) proposed by Seo and Moon (2006). The LPCE resolves sound generation and propagation for the base incompressible flow field as accurately as the acoustical DNS with the full compressible Navier–Stokes equations. This hybrid approach has been validated comprehensively for canonical problems (Seo and Moon, 2006, 2007; Moon et al., 2010) at low Mach numbers. The geometries of human head and vocal tract representing the sagittal symmetry plane considered in this study are shown in Figure 11A. Although the geometry has been simplified significantly, it is complex enough so as to pose a serious challenge to any conventional CAA method. In order to handle this complex geometry, a high-order IBM (Seo and Mittal, 2011) has been applied to the present acoustic solver.
The IBM used for the acoustic solver is the sharp-interface method based on the ghost-cell approach (Mittal et al., 2008). The ghost cells are determined using the same procedure used for the FSI flow solver shown in the above section. The wall boundary condition is imposed by specifying an appropriate value at the ghost point. In the present high-order IBM (Seo and Mittal, 2011) for the acoustic solver, the value at the ghost cell is determined by satisfying the boundary condition at the body-intercept point using high-order polynomials. The coefficients of the polynomials are determined by a weighted least-squares error minimization and the details of the procedure can be found in Seo and Mittal (2011). This method allows a high level of flexibility with respect to the choice of the stencil points. One essentially needs to find a sufficient number of fluid points around the body-intercept point to accomplish the interpolation.
In the present model problem, the diameter of the trachea in the larynx, D = 0.02 m (Figure 11A) is chosen as the characteristics length scale and the outer domain boundaries are extended to 100D. A Cartesian grid with total 1024 × 1024 grid points is used with the minimum grid spacing, Δx = 0.02D. The vocal tract is modeled from the end of VFs and a glottal flow rate is prescribed as an inflow velocity boundary condition at the lower end of the vocal tract which coincides with the glottal outlet. The glottal gap size is assumed to be d = 0.1D and velocity inlet boundary condition is only applied over this glottal gap in order to model the glottal. A parabolic profile is used for the velocity distribution and the maximum jet velocity is Vmax = 34 m/s (Zheng et al., 2009). Thus, the flow Mach number based on a maximum jet velocity is M = Vmax/c = 0.1 (c ≈ 340 m/s for air). In the present case, the glottal flow rate input is modeled with the Liljencrants–Fant (LF) model (Fant, 1986). Note that the glottal flow rate obtained by the FSI simulations presented in the above sections can also be used as the input. The fundamental frequency, f0 = 1/T0 is set to 125(Hz) which is a typical value for an adult male’s voice.
The flow field is computed with the immersed boundary flow solver for about 40 glottal cycles (40T0). With the fluctuating inlet flow rate, a pulsatile jet flow is developed at the vocal tract inlet and the instantaneous vorticity field is shown in Figure 11B. The acoustic field computed with LPCE is shown in Figure 11C. One can see the generation of monopole sound at the end of mouth and its propagation into the surrounding region. The sound pressure level (SPL) spectrum at 30D (about 60 cm) from the end of mouth is shown in Figure 12A, and its spectral peak is observed at the third harmonic of the fundamental frequency. As mentioned above, this is due to the resonance effect of the vocal tract system. The length of the vocal tract system in the current model is about l = 12.5D. If the vocal tract is assumed as a simple one-dimensional duct the first resonance frequency is estimated as F1 = 2.72f0 which is about 340 Hz. The estimated F1 is therefore reasonably close to the third harmonic of the fundamental frequency which confirms our hypothesis.
In the “source-filter mechanism” widely used in the analysis of voiced sound studies (Stevens, 1998), the voiced sound signal is related to the glottal source (glottal flow rate or its time derivative) using a filter or transfer function (TF) which represents the acoustic response of the vocal tract. This TF can be computed with the present results. In the frequency domain, the TF can be estimated as

where E is the time rate of change of the glottal flow rate. The spectrum of time derivative of glottal flow rate, E is plotted along with the SPL spectrum of acoustic signal at 30D from the end of mouth in Figure 12A. The TF is computed by Eq. 4 at every harmonic of the fundamental frequency, f = nf0 and plotted in Figure 12B. The TF represents the acoustic response of the vocal tract system and one can clearly see the formant frequencies (Stevens, 1998) of the current vocal tract system. The advantage of this direct computation of TF is that all the effects such as area variation, radiation impedance, and acoustic energy dissipation can be resolved without assumption or modeling. Moreover, the effect of the base flow can also be included in order to extract the finer features of the voiced sound. The directly computed TF would be quite helpful in the study of glottal source by the inverse filtering of voice sound signal (Plumpe et al., 1999). The present method would be a reliable prediction tool when used for actual three-dimensional geometry obtained with CT and ultrasound imaging (Stone, 1991) and also can be dynamically coupled with the VF motion and laryngeal flow for the real voiced sound computation. The computed sound can be output in an audio format allowing the surgeon to actually listen to this sound; this significantly improves the usability of this software as a surgical modeling tool.
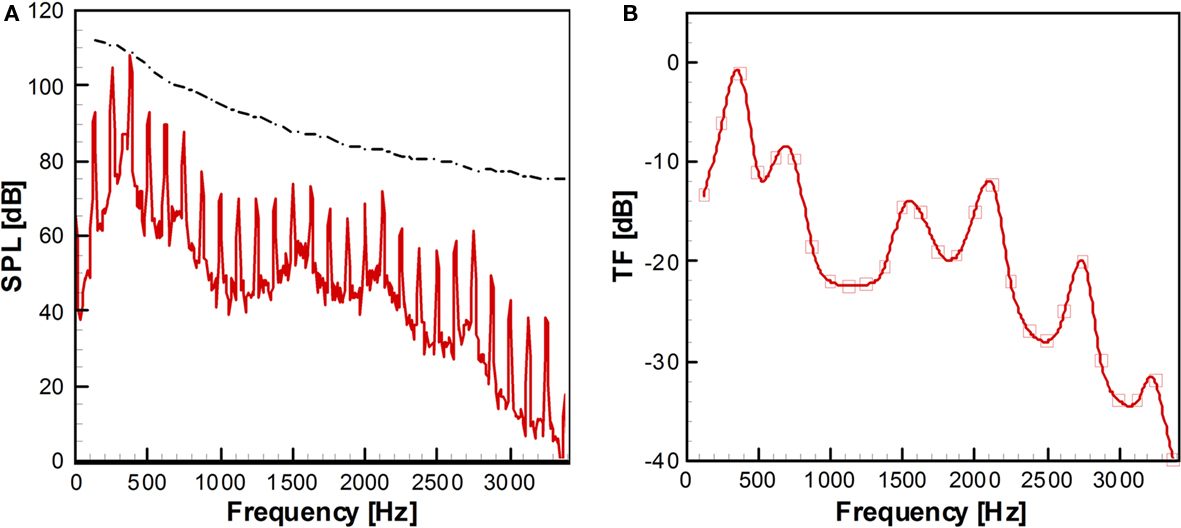
Figure 12. (A) Sound pressure level (SPL) spectrum at 30D from the end of mouth. Dash-dot line: Envelope of the spectrum of the time derivative of glottal flow rate. (B) Transfer function computed by Eq. 4. The values are computed at the each harmonics of fundamental frequency and the continuous curve is made by parametric splines (Seo and Mittal, 2011).
Outstanding Issues, Limitations, and Uncertainties in the Modeling
In this section, we discuss the key outstanding issues as well as the limitations and uncertainties in phonation modeling.
Vocal fold boundary condition
Nearly all the past numerical simulations of VF vibration have utilized rigid boundary conditions at lateral, anterior and posterior surfaces, and traction-free boundary condition at remaining surfaces. (Berry and Titze, 1996; Alipour et al., 2000; Cook and Mongeau, 2007; Tao and Jiang, 2007; Cook et al., 2008, 2009). Although they are not strictly consistent with the real laryngeal conditions, such assumptions reduce the complexity of the model while retaining the key features of VF dynamics. Hunter et al. (2004) constructed a model with more complicated boundary conditions and constraints in an attempt to model the movement of the arytenoid cartilage, thyroid cartilage, and cricoarytenoid joint to investigate VF posturing. While their model represented the anatomic structure of the larynx more precisely, this may not be necessary in the modeling of phonation since the cartilaginous components of the VF processes are unlikely to have much movement after posturing is complete.
Vocal fold material properties
The various layers of human VF have different material properties. The cover layer is soft and pliable, playing an important role in mucosal-wave propagation (Titze et al., 1993). The ligament is stiffest among three layers, known to be critical in high pitched singing (van den Berg, 1958), and the body layer is the bulk of VFs, important for fundamental frequency and threshold pressure regulation (Zhang et al., 2007; Zhang, 2010). Knowledge of the material properties of each layer is essential for accurate numerical modeling of human phonation. Changes in material properties can lead to behavior such as chaotic vibration or biphonation (Berry et al., 1994; Tao and Jiang, 2006). In the last 30 years, much effort has been undertaken to parameterize the material properties of VF tissue including in vitro measurement of canine larynx and in vivo measurement of human larynges (Perlman et al., 1984; Perlman, 1985; Perlman and Titze, 1985; Perlman and Durham, 1987; Goodyer et al., 2006, 2007a,b, 2009). There have been two comprehensive studies that have examined the effect of material properties on VF eigenstructure (Berry and Titze, 1996; Cook et al., 2009). Cook et al. (2009), in particular, the effect of tissue material property uncertainty on VF dynamics have been investigated thoroughly over the full range of documented values.
Vocal fold internal structure
The internal geometry of VFs varies from individual to individual depending on factors such as gender, age, and health, and this variation could significantly affect the speech production (Hirano et al., 1981). However, due to the limitation of current imaging techniques, the inner structure of patient’s VFs cannot be identified. Thus, there is a need to assess the sensitivity of VF dynamics to the internal structure in order to quantify the uncertainty this produces in the model prediction. Here we summarize an eigenmode based assessment of this uncertainty. A three-dimensional, three-layer VF model without longitudinal variation is employed as the baseline configuration, as shown in Figure 13A. The overall geometry and size are based on the widely used M5 profile (Scherer et al., 2001) and the material of each layer is assumed to be linear elastic, transverse isotropic and nearly incompressible. The material properties for each layer are taken from (Alipour et al., 2000) and listed in Table 1. The thickness of cover and ligament layer is 0.33 and 1.11 mm respectively. In the current study, the VF is discretized by about 23,000 tetrahedral elements with higher grid density around cover and ligament to resolve the subtle variation in layer thickness, as shown in Figure 13C. Fixed boundary conditions are imposed on the lateral, anterior, and posterior surfaces, while traction-free boundary conditions are imposed on remaining surfaces. Further details of this study are given in Xue et al. under review.
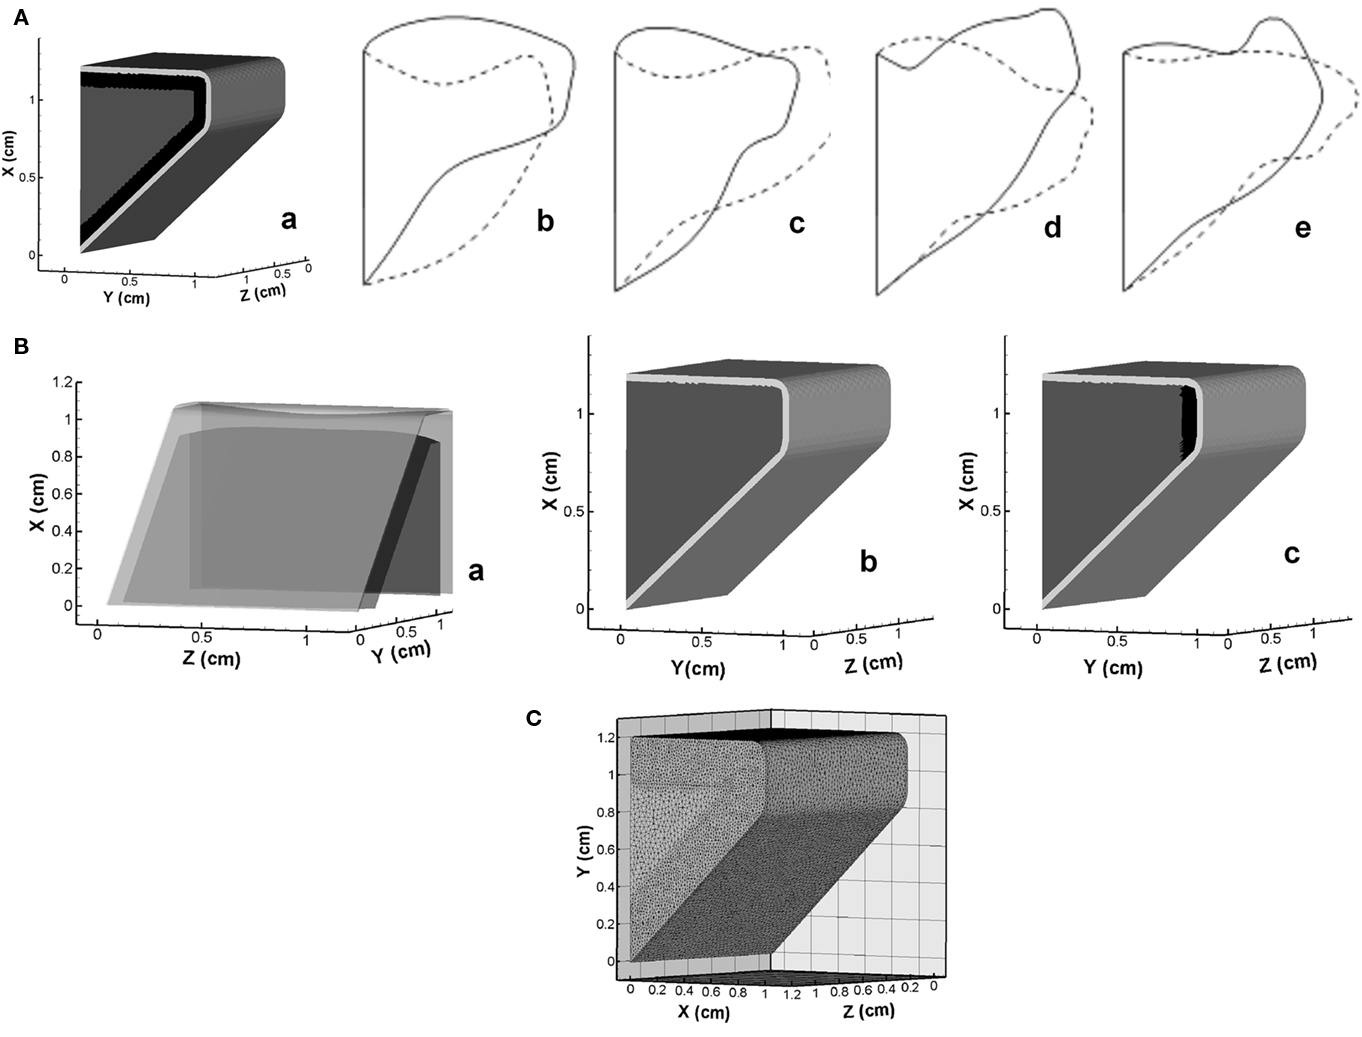
Figure 13. (A) Three-dimensional vocal fold model and mid-coronal views of the first four eigenmodes. (a) Geometry model; (b) Mode-1; (c) Mode-2; (d) Mode-3; (e) Mode-4. (B) Schematics of inner structure of variant vocal fold models employed in the current study. (a) Hirano’s model; (b) two-layer model; (c) medial ligament model. (C) Volume mesh of the vocal fold employed in simulations.
The mid-coronal view of two extreme phases of the first four eigenmodes is shown in Figures 13Ab–e. The first eigenmode (Mode-1) reveals a strong vertical motion primarily on the superior and inferior surfaces. Mode-2 presents a lateral motion with a slight phase difference between the inferior and superior surfaces. Mode-3 is a vertical motion of the whole VF. Mode-4 presents a more apparent phase difference between the superior and inferior surface, which is believed as the most important mode contributing to the formation of the distinct convergent–divergent glottal shape.
The sensitivity study is first performed on three cases with relatively large scale structural variations. One case considers the longitudinal variation of the thicknesses of inner layers. The thickness of each layer is based on Hirano’s measurement (Hirano et al., 1981) on human VF, and we denote this model as the “Hirano’s model” (Figures 13Ba). Two other distinct models, as shown in Figures 13Bb,c, are the “two-layer model,” in which ligament layer is assumed to be absent (Story and Titze, 1995; Cook et al., 2008, 2009), and the “medial ligament” model where the ligament is limited to a small region near the median (Alipour et al., 2000; Tao and Jiang, 2007). The first four eigenmodes of each model are computed and compared to corresponding baseline modes. The result indicates that VF vibratory modes are quite insensitive to the longitudinal variation of thickness of inner layers as well as the variation of ligament length. However, complete removal of ligament layer (the two-layer model) generates quite different modal shapes from other three models, which suggests that a certain level of variation in layer thickness tends to significantly change modal shapes.
In order to further explore the effect of thickness variation, we have examined the dependence of eigenmodes on the thicknesses of the ligament and cover layers. The thicknesses of ligament and cover layers are systematically and individually changed in a range of 50–200 and 0–200% respectively about baseline values. For these cases, we find noticeable differences in the eigenmodes. Interestingly, the comparison of the eigenmodes of each model with all the baseline modes indicates that many of these changes are associated with a change in the modal-order. For instance, when the cover thickness increases to 1.5 times of the baseline value, the second eigenmode shows significant similarity with the baseline Mode-4 and -3; after the thickness reaches two times of the nominal value, the fourth baseline mode becomes the first eigenmode of these models. Given that the baseline Mode-4 has a strong converging–diverging (mucosal-wave type) behavior, it can be concluded that an increase in cover thickness enhances the tendency for mucosal-wave formation. The effect of the ligament thickness is non-monotonic in that both very thick and very thin ligaments promote the appearance of mucosal-wave vibration type. In the zero-ligament-thickness case (the two-layer model), the mucosal-wave mode appears as the first mode and it becomes the second mode when the ligament thickness is more than 50% higher.
In summary, the overall conclusion regarding the feasibility of accurate computational modeling of phonation in the face of relatively high levels of uncertainty regarding the inner structure is generally positive. However, significant changes in ligament and cover thickness can potentially produce different dynamics and a more precise parameterization of these features would be beneficial for a surgical modeling.
Conclusion
Simulation-assisted therapies and diagnosis are around the proverbial corner. In the arena of phonosurgery, current trends in high-performance computing (Dongarra, 2004) indicate that rapid, even real-time modeling of phonation in patient-specific configurations will be possible by the end of this decade and this has significant implications for the management and diagnosis of voice pathologies. While significant challenges need to be overcome in areas of tissue characterization as well as the development of tools for automated translation of imaging data into biomechanical models, the approach described here takes a significant step in realizing a future where computer models will serve as an essential tool in phonosurgery.
Conflict of Interest Statement
The authors declare that the research was conducted in the absence of any commercial or financial relationships that could be construed as a potential conflict of interest.
Acknowledgments
The project described was supported by Grant Number ROlDC007125 from the National Institute on Deafness and Other Communication Disorders (NIDCD). The content is solely the responsibility of the authors and does not necessarily represent the official views of the NIDCD or the NIH. This research was also supported by the National Science Foundation through TeraGrid resources provided by the National Institute of Computational Science under grant number TG-CTS100002. We would also like to thank Professor Thao D. Nguyen for introducing solid dynamics solver “Tahoe” to us and for helping us couple this open source code to our CFD code.
Footnote
- ^Tahoe is an open-source C++ finite element solver, developed at Sandia National Labs, CA, USA (http://sourceforge.net/projects/tahoe).
References
Alipour, F., Berry, D. A., and Titze, I. R. (2000). A finite-element model of vocal-fold vibration. J. Acoust. Soc. Am. 108, 3003–3012.
Alipour, F., and Scherer, R. C. (2000). Dynamics glottal pressures in an excised hemilarynx model. J. Acoust. Soc. Am. 14, 442–454.
Alipour, F., and Titze, I. R. (1985). “Simulation of particle trajectories of vocal fold tissue during phonation,” in Vocal Fold Physiology: Biomechanics, Acoustics, and Phonatory Control, eds I. R. Titze and R. C. Scherer. (Denver, CO: Denver Center of Performing Arts), 183–190.
Alipour, F., and Titze, I. R. (1991). Elastic models of vocal fold tissues. J. Acoust. Soc. Am. 90, 1326–1331.
Alipour, F., and Titze, I. R. (2000). Vocal fold bulging effects on phonation using biophysical computer model. NCVS Status Prog. Rep. 13, 105–114.
Avanzini, F., and Rocchesso, D. (2002). Efficiency, accuracy and stability issues in discrete time simulations of single reed wind instruments. J. Acoust. Soc. Am. 5, 111.
Bae, Y., and Moon, Y. J. (2008). Computation of phonation aeroacoustics by an INS/PCE splitting method. Comput. Fluids 37, 1332–1343.
Berry, D. A., Herzel, H., Titze, I. R., and Krisher, K. (1994). Interpretation of biomechanical simulations of normal and chaotic vocal fold oscillations with empirical eigenfunctions. J. Acoust. Soc. Am. 95, 3595–3604.
Berry, D. A., and Titze, I. R. (1996). Normal modes in continuum model of vocal fold tissues. J. Acoust. Soc. Am. 100, 3345–3354.
Bielamowicz, S. (2004). Perspectives on medialization laryngoplasty. Otolaryngol. Clin. North Am. 37, 139–160.
Chan, R. W., and Titze, I. R. (1999). Viscoelastic shear properties of human vocal fold mucosa: measurement methodology and empirical results. J. Acoust. Soc. Am. 106, 2008–2021.
Choi, J., Tawhai, M. H., Hoffman, E. A., and Lin, C.-L. (2009). On intra- and intersubject variabilities of airflow in the human lungs. Phys. Fluids 21, 101901.
Cook, D. D., and Mongeau, L. (2007). Sensitivity of a continuum vocal fold model to geometric parameters, constraints and boundary conditions. J. Acoust. Soc. Am. 121, 2247–2253.
Cook, D. D., Nauman, E., and Mongeau, L. (2008). Reducing the number of vocal fold mechanical tissue properties: evaluation of the incompressibility and planar displacement assumptions. J. Acoust. Soc. Am. 124, 3888–3896.
Cook, D. D., Nauman, E., and Mongeau, L. (2009). Ranking vocal fold model parameters by their influence on modal frequencies. J. Acoust. Soc. Am. 126, 2002–2010.
deVries, M. P. D., Schutte, H. K., Veldman, A. E. P., and Verkerke, G. K. (2002). Glottal flow through a two-mass model: comparison of Navier–Stokes solutions with simplified models. J. Acoust. Soc. Am. 111, 1847–1853.
Goodyer, E., Hemmerich, S., Muller, F., Kobler, J., and Hess, M. (2007a). The shear modulus of the human vocal fold, preliminary results from 20 larynxes. Eur. Arch. Otorhinolaryngol. 264, 45–50.
Goodyer, E., Muller, F., Licht, A., and Hess, M. (2007b). In vivo measurement of the shear modulus of the human vocal fold – interim results from 8 patients. Eur. Arch. Otorhinolaryngol. 264, 631–635.
Goodyer, E., Muller, F., Bramer, B., Chauhan, D., and Hess, M. (2006). In vivo measurement of the elastic properties of the human vocal fold. Eur. Arch. Otorhinolaryngol. 263, 445–462.
Goodyer, E., Selham, N. V., Choi, S. H., Yamashita, M., and Dailey, S. H. (2009). The shear modulus of the human vocal fold in a transverse direction. J. Voice 23, 151–155.
Gunter, H. (2003). A mechanical model of vocal fold collision with high spatial and temporal resolution. J. Acoust. Soc. Am. 113, 994–1000.
Hertegard, S., and Gauffin, J. (1995). Glottal area and vibratory patterns studied with simultaneous stroboscopy, flow glottography, and electroglottography. J. Speech Hear. Res. 30, 85–100.
Hertegard, S., Gauffin, J., and Karlsson, I. (1992). Physiological correlates of the inversed filtered flow waveform. J. Voice 6, 224–234.
Hirano, M. (1977). “Structure and vibratory behavior of the vocal folds,” in Dynamic Aspect of Speech Production, eds M. Sawashima and F. S. Cooper (Tokyo: University of Tokyo Press), 13–30.
Hirano, M., Kikita, Y., Ohmaru, K., and Kurita, S. (1982). Structure and mechanical properties of vocal fold. Speech Lang. 7, 271–297.
Hirano, M., Kurita, S., and Nakashima, T. (1981). “The structure of the vocal folds,” in Vocal Fold Physiology eds K. N. Stevens and M. Hirano (Tokyo: University of Tokyo Press), 33–41.
Hunter, E. J., Titze, I. R., and Alipour, F. (2004). A three dimensional model of vocal fold abduction/adduction. J. Acoust. Soc. Am. 115, 1747–1759.
Ishizaka, K., and Flanagan, J. L. (1972). Synthesis of voiced sounds from a two-mass model of the vocal cords. Bell Syst. Technol. J. 51, 1233–1268.
Isshiki, N., Morita, H., and Okamura, H. (1974). Thyroplasty as a new phonosurgical technique. Acta Otolaryngol. 78, 451–457.
Jiang, J. J., Zhang, Y., and Stern, J. (2001). Modeling of chaotic vibrations in symmetric vocal folds. J. Acoust. Soc. Am. 110, 2120–2128.
Kob, M., Alhauser, N., and Reiter, U. (1999). “Time-Domain Model of The Singing Voice,” in Proceedings of the 2nd COST G-6 Workshop on Digital Audio Effects (DAFx99), NTNU, Trondheim.
LaMar, M. D., Qi, Y., and Xin, J. (2003). Modeling vocal fold motion with a hydrodynamic semicontinuum model. J. Acoust. Soc. Am. 114, 445–464.
Lin, C.-L., Tawhai, M. H., McLennan, G., and Hoffman, E. A. (2007). Characteristics of the turbulent laryngeal jet and its effect on airflow in the human intra-thoracic airways. Respir. Physiol. Neurobiol. 157, 295–309.
Link, G., Kaltenbacher, M., Breuer, M., and Dollinger, M. (2009). A 2D finite-element scheme for fluid–solid–acoustic interaction and its application to human phonation. Comput. Methods Appl. Mech. Eng. 198, 3321–3334.
Luo, H., Mittal, R., Zheng, X., Bielamowicz, S. A., Walsh, R. J., and Hahn, J. K. (2008). An immersed-boundary method for flow–structure interaction in biological systems with application to phonation. J. Comput. Phys. 227, 9303–9332.
Min, Y. B., Titze, I. R., and Alipour, F. (1995). Stress–strain response of the human vocal ligament. Ann. Otol. Rhinol. Laryngol. 104, 563–569.
Mittal, R. (2003). “Computational modeling in bio-hydrodynamics: trends, challenges and recent advances,” in 13th International Symposium on Unmanned Untethered Submersible Technology (UUST) New England Center, Durham, New Hampshire, USA.
Mittal, R., Dong, H., Bozkurttas, M., Najjar, F. M., Vargas, A., and von Loebbecke, A. (2008). A versatile sharp interface immersed boundary method for incompressible flows with complex boundaries. J. Comput. Phys. 227, 4825–2852.
Mittal, R., and Iaccarino, G. (2005). Immersed boundary methods. Annu. Rev. Fluid Mech. 37, 239–261.
Mittal, R., Simmons, S. P., and Najjar, F. (2003). Numerical study of pulsatile flow in a constricted channel. J. Fluid Mech. 485, 337–378.
Mittal, R., Simmons, S. P., and Udaykumar, H. S. (2001). Application of large-eddy simulation to the study of pulsatile flow in a modeled arterial stenosis. J. Biomech. Eng. 123, 325–332.
Moin, P., and Mahesh, K. (1998). Direct numerical simulation: a tool in turbulence research. Annu. Rev. Fluid Mech. 30, 539–578.
Moon, Y. J., Seo, J. H., Bae, Y. M., Roger, M., and Becker, S. (2010). A hybrid prediction for low-subsonic turbulent flow noise. Comput. Fluids 39, 1125–1135.
Perlman, A. L. (1985). A Technique for Measuring the Elastic Properties of Vocal Fold Tissue. Dissertation, The University of Iowa, Iowa City, IA.
Perlman, A. L., and Durham, P. L. (1987). “In vitro studies of vocal fold mucosa during isometric conditions,” in Laryngeal Function in Phonation and Respiration, eds T. Baer, C. Sasaki, and K. Harris (Boston, MA: Little, Brown and Co), 291–303.
Perlman, A. L., and Titze, I. R. (1985). “Measurement of viscoelastic properties in live tissue,” in Vocal Fold Physiology: Biomechanics, Acoustics and Phonatory Control, eds I. R. Titze and R. C. Scherer (Denver, CO: Denver Center for the Performing Arts), 273–281.
Perlman, A. L., Titze, I. R., and Cooper, D. S. (1984). Elasticity of canine vocal fold tissue. J. Speech Hear. Res. 27, 212–219.
Piomelli, U. (1999). Large-eddy simulation: achievements and challenges. Prog. Aerosp. Sci. 35, 335–362.
Plumpe, M. D., Quatieri, T. F., and Reynolds, D. A. (1999). Modeling of the glottal flow derivative waveform with application to speaker identification. IEEE Trans. Speech Audio Proc. 7, 569–586.
Ramakrishnan, S., Zheng, L., Mittal, R., Najjar, F., Lauder, G., and Hedrick, T. (2009). “Large eddy simulation of flows with complex moving boundaries: application to flying and swimming in animals,” in 39th AIAA Fluid Dynamics Conference, AIAA, San Antonio, TX, 2009–3976.
Resse, S., and Govindjee, S. (1998). A theory of finite viscoelasticity and numerical aspects. Int. J. Solids Struct. 35, 3455–3482.
Rosa, M. O., Pereira, J. C., Grellet, M., and Alwan, A. (2003). A contribution to simulating a three-dimensional larynx model using the finite element method. J. Acoust. Soc. Am. 114, 2893–2905.
Scherer, R. C., Shinwari, D., Witt, K. J., Zhang, C., Kucinschi, R., and Afjeh, A. A. (2001). Intraglottal pressure profiles for a symmetric and oblique glottis with a divergence angle of 10 degrees. J. Acoust. Soc. Am. 109, 1616–1630.
Seo, J. H., and Mittal, R. (2011). A high-order immersed boundary method for acoustic wave scattering and low-Mach number flow-induced sound in complex geometries. J. Comput. Phys. 230, 1000–1019.
Seo, J. H., and Moon, Y. J. (2006). Linearized perturbed compressible equations for low Mach number aeroacoustics. J. Comput. Phys. 218, 702–719.
Seo, J. H., and Moon, Y. J. (2007). Aerodynamic noise prediction for long-span bodies. J. Sound Vib. 306, 564–579.
Story, B. H., and Titze, I. R. (1995). Voice simulation with a body-cover model of the vocal folds. J. Acoust. Soc. Am. 97, 1249–1259.
Tao, C., and Jiang, J. J. (2006). Anterior–posterior biphonation in a finite element model of vocal fold vibration. J. Acoust. Soc. Am. 120, 1570–1577.
Tao, C., and Jiang, J. J. (2007). Mechanical stress during phonation in a self-oscillating finite-element vocal fold model. J. Biomech. 41, 2191–2198.
Titze, I. R. (1992). Phonation threshold pressure: a missing link in glottal aerodynamics. J. Acoust. Soc. Am. 85, 901–906.
Titze, I. R., Jiang, J. J., and Hsiao, T. Y. (1993). Measurement of mucosal wave propagation and vertical phase difference in vocal fold vibration. Ann. Otol. Rhinol. Laryngol. 102, 58–63.
van den Berg, J. (1958). Myoelastic-aerodynamic theory of voice production. J. Speech Hear. Res. 1, 227–244.
van Kan, J. (1986). A second-order accurate pressure-correction scheme for viscous incompressible flow. SIAM J. Sci. Stat. Comput. 7, 870.
Vreman, A. W. (2004). An eddy-viscosity subgrid-scale model for turbulent shear flow: algebraic theory and applications. Phys. Fluids 16, 3670–3681.
Zang, Y., Streett, R. L., and Koseff, J. R. (1994). A non-staggered fractional step method for time-dependent incompressible Navier–Stokes equations in curvilinear coordinates. J. Comput. Phys. 114, 18–33.
Zemlin, W. R. (1998). Speech and Hearing Science: Anatomy and Physiology, 3rd Edn. Englewood Cliffs, NJ: Prentice Hall.
Zhang, K., Siegmund, T., and Chan, R. W. (2007). A two-layer composite model of the vocal fold lamina propria for fundamental frequency regulation. J. Acoust. Soc. Am. 122, 1090–1101.
Zhang, Z. (2010). Dependence of phonation threshold pressure and frequency on vocal fold geometry and biomechanics. J. Acoust. Soc. Am. 127, 2554–2562.
Zhao, W., Zhang, C., Frankel, S. H., and Mongeau, L. (2002). Computational aeroacoustics of phonation part 1: computational methods and sound generation mechanisms. J. Acoust. Soc. Am. 112, 2134–2146.
Zheng, X., Bielamowicz, S., Luo, H., and Mittal, R. (2009). Computational study of the effect of false vocal folds on glottal flow and vocal fold vibration during phonation. Ann. Biomed. Eng. 37, 625–642.
Keywords: biomechanics, fluid-structure interaction, phonation, surgical-planning, computational fluid dynamics
Citation: Mittal R, Zheng X, Bhardwaj R, Seo JH, Xue Q and Bielamowicz S (2011) Toward a simulation-based tool for the treatment of vocal fold paralysis. Front. Physio. 2:19. doi: 10.3389/fphys.2011.00019
Received: 02 February 2011;
Paper pending published: 12 March 2011;
Accepted: 13 April 2011;
Published online: 02 May 2011.
Edited by:
Timothy W. Secomb, University of Arizona, USAReviewed by:
Ching-Long Lin, The University of Iowa, USAScott Thomson, Brigham Young University, USA
Copyright: © 2011 Mittal, Zheng, Bhardwaj, Seo, Xue and Bielamowicz. This is an open-access article subject to a non-exclusive license between the authors and Frontiers Media SA, which permits use, distribution and reproduction in other forums, provided the original authors and source are credited and other Frontiers conditions are complied with.
*Correspondence: Rajat Mittal, 126 Latrobe, 3400 North Charles Street, Baltimore, MD 21218, USA. e-mail:bWl0dGFsQGpodS5lZHU=


 Jung Hee Seo1