 Jun Huang
 Rongcheng Dong
 Jie Chen
94% of researchers rate our articles as excellent or good
Learn more about the work of our research integrity team to safeguard the quality of each article we publish.
Find out more
ORIGINAL RESEARCH article
Front. Phys., 04 April 2025
Sec. Social Physics
Volume 13 - 2025 | https://doi.org/10.3389/fphy.2025.1584958
This article is part of the Research TopicReal-World Applications of Game Theory and Optimization, Volume IIView all 10 articles
The widespread integration of Internet of Things (IoT) technology in the military domain has brought significant attention to the security concerns surrounding the Internet of Battlefield Things (IoBT). Given the limited communication resources within IoBT, there is a growing focus on detecting network security without interrupting normal network operations. Topology serves as a crucial foundation for the detection of network security in IoBT, facilitating the discovery of abnormal devices and the detection of unauthorized access. Security detection based on topology can effectively enhance the information security and operational levels of IoBT. This paper utilizes matching analysis of time series for information exchanged between neighboring nodes and implements IoBT topology inference based on flow rate estimation, and a threshold parameter adaptive adjustment strategy is innovatively proposed to improve the accuracy of topology inference. The non-cooperative inference method proposed in this paper enables network topology inference without network access and information parsing, exhibiting strong generality and independence from the discovery of acknowledgment frames during information exchange processes. The simulation results demonstrate the feasibility and superiority of this method.
With the continuous evolution of military technology, the demands placed on information transmission efficiency and security during battlefield operations have escalated Wen et al. [1]. Traditional military systems encounter several limitations, including high costs, extended deployment times, constrained communication resources, and low information transmission efficacy Conradie [2]. In order to effectively improve the efficiency of battlefield communication, the construction of a distributed battlefield network has become the development direction for military communication networks worldwide Chen et al. [3]. Compared to traditional military systems, large-scale distributed networks composed of various military systems can achieve faster, cheaper, and more flexible battlefield deployment and information transmission. As a crucial component of the distributed battlefield network, IoBT is receiving increasing attention globally Abuzainab and Saad [4]. IoBT connects various combat elements through information sensing, linking them to the military information network. This integration bridges the gap between the network domain and the physical domain, providing new perspectives for constructing a novel military communication network system Akter et al. [5]. Within the IoBT framework, real-time perception and rapid response to the status information and dynamics of weapon systems, combat units, and battlefield environments are facilitated through network communication. Despite the introduction of security measures, IoBT remains challenging to effectively counter attacks such as man-in-the-middle attacks, communication node impersonation, and information tampering Li et al. [6]. When impersonating nodes gain access to the network, the attackers can launch denial-of-service attacks by sending a large volume of useless information, leading to network congestion Islam et al. [7]. Additionally, they can disrupt normal information transmission by forging information, affecting the regular operations of military forces, such as altering commands or fabricating false situational information Rutravigneshwaran et al. [8]. To detect hidden abnormal nodes in the network and enhance the security performance of IoBT, topology discovery proves to be an effective means. Topology inference methods can be broadly classified into cooperative and non-cooperative categories, depending on network accessibility assumptions. Cooperative methods rely on network accessibility and parseable messages as their fundamental premise. They are further divided into methods based on protocol analysis Yan [9]; Yong et al. [10] and methods based on network tomography Chen et al. [11]; Zhang and Phillips [12]; Jin et al. [13]. Some methods necessitate the transmission of numerous probing packets to finalize the inference, rendering them impractical for scenarios with restricted information acquisition and inaccessible networks. Moreover, the traffic generated by the detection devices upon access can escalate the network load, exacerbating the strain, especially in environments with limited communication resources. Consequently, this can impede the efficiency of information transmission within the network. Currently, research on non-cooperative topology inference methods is relatively scarce. Relevant research outcomes mainly focus on inferring network topology based on the correlation between data frames and acknowledgment frames Niu et al. [14]. Common methods include granger causality Tilghman and Rosenbluth [15], transfer entropy Sharma et al. [16], clusteringLiu et al. [17], neural network Testi and Giorgetti [18] etc. The aforementioned methods strictly rely on the confirmation information sent from the receiving node to the sending node after data frames are transmitted. In cases where the protocol lacks a confirmation mechanism, these methods cannot infer the communication relationships between nodes. Additionally, due to the typically short length of acknowledgment frames, there is a risk of undetectable situations during the monitoring process, increasing the probability of false negatives and false positives to some extent.
To address the shortcomings of the aforementioned methods, this paper proposes a non-cooperative topology inference method based on flow rate estimation. In this method, for the monitored communication signals, the transmission times of information from different nodes are extracted. Subsequently, the close correlation between the relay nodes and the sending nodes in terms of flow rates is utilized to determine the communication relationships. In order to improve the accuracy of communication relationship inference, a threshold parameter adaptive method is also proposed. Finally, the results of communication relationship determination are integrated to achieve the inference of network topology.
The remaining sections of the paper are organized as follows. In Section 2, the related models adopted are presented. In Section 3, the non-cooperative topology inference method based on flow rate estimation is presented in detail. In Section 4, the simulation experiments and results are shown, followed by conclusions in Section 5.
The schematic diagram of the topology inference scenario is shown in Figure 1. The green objects represent IoBT communication equipments. Security detection devices are deployed in proximity to each IoBT communication equipment, enabling them to monitor signals within the deployment area effectively. The red line represents that two communication equipments are close enough to send signals to each other. While detection devices can detect the location information and capture all communication signals in the area, they lack the capability to parse the content of transmitted information. Therefore, the challenge at hand is: How can we infer the network topology of IoBT without directly accessing the network or parsing the transmitted information?
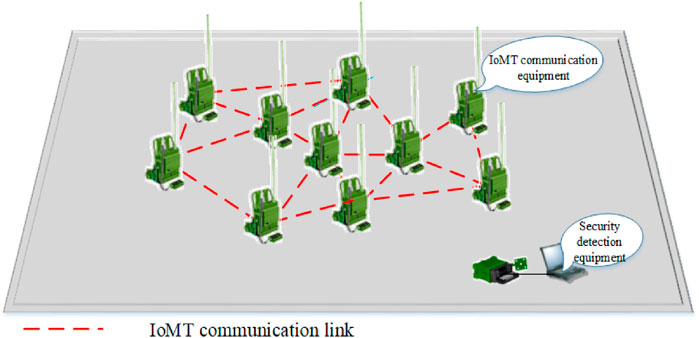
Figure 1. The schematic diagram of the topology inference scenario.
The topology diagram of the IoBT in Figure 1 is shown in Figure 2. In Figure 2,
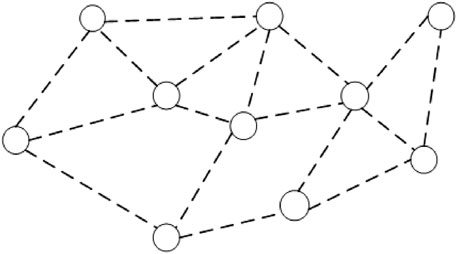
Figure 2. Network topology diagram.
The topology inference results are represented using an adjacency matrix
Due to the impact of communication device transmission power and environmental attenuation, each communication device in IoBT has limitations on its communication range Ganesh and Venkataraman [19]. To ensure effective information transmission, communication networks often employ multi-hop methods to achieve long-distance information transmission Singh and Shrivastava [20]. In IoBT, devices can act as both sending nodes and receiving nodes, and they can also serve as relay nodes to forward information. When the sending node (source node) and the receiving node (destination node) cannot be reached in a single hop, multiple data packets will be successively relayed among intermediate nodes Chai et al. [21]. The term “information flow” refers to the flow created by the relayed data packets between intermediate nodes.
Assuming that only one information flow passes between two adjacent nodes within a certain period, as shown in Figure 3. From Figure 3, it can be observed that the sending moments of network node data are represented as points on the real axis, described using a one-dimensional point process
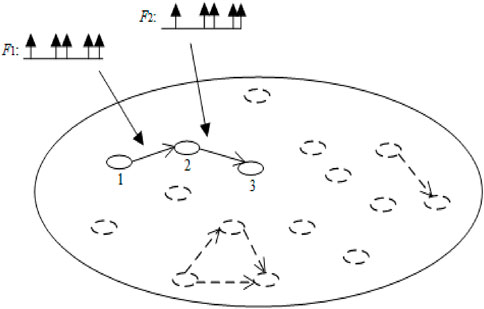
Figure 3. Schematic diagram of a single information flow passing through adjacent nodes.
Examining the forwarding process of an individual data packet within the information flow as the subject of observation, the reliable transmission of the same packet along adjacent links in the information flow path is subject to a delay, referred to here as the packet single-hop forwarding delay
where
where
Figure 4 illustrates a scenario where the same node forwards two information flows. It can be observed that when utilizing the sending time sequences
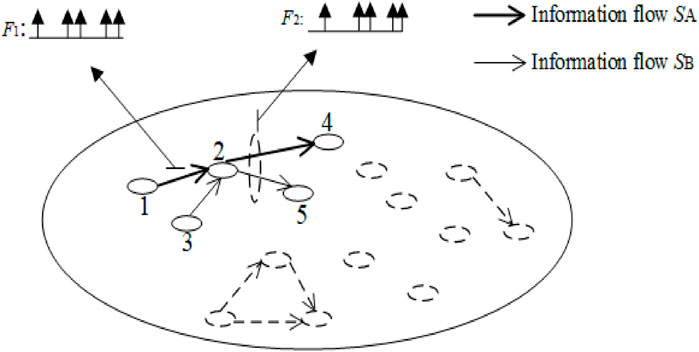
Figure 4. Schematic diagram of a node forwarding two information flows.
The process of topology inference of the IoBT is depicted in Figure 5. It involves analyzing and inferring the network topology based on the timestamp sequence of packet data transmission during the node’s sending process. If it can be determined that there is information forwarding between some nodes in the network, especially between two adjacent wireless nodes, and directional information flow is detected between them, then these two wireless nodes and the corresponding directional edges can be considered as part of the entire network topology. Through prolonged accumulation and observation, the complete topology of the network can be inferred. This method does not rely on parsing the content of packet data, making it highly suitable for topology inference in IoBT.
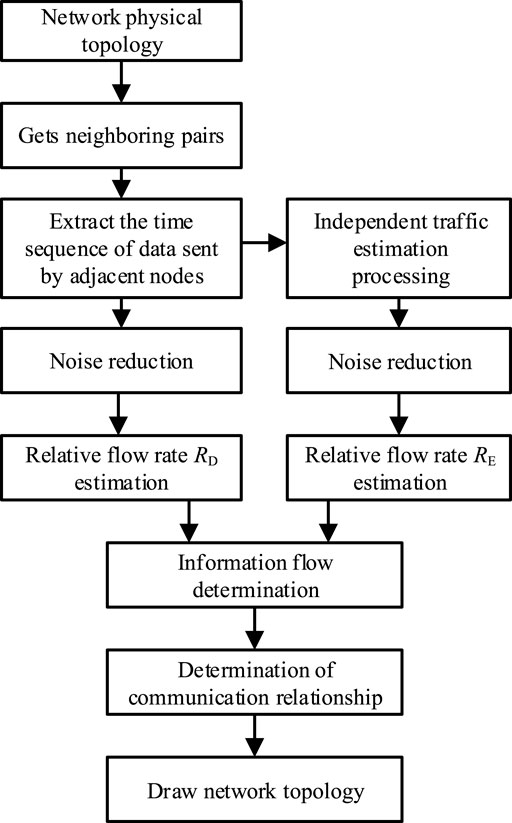
Figure 5. Non-cooperative topology inference process flowchart based on flow rate estimation.
Based on obtaining the physical topology of the IoBT and identifying pairs of adjacent nodes in the target network, the sending time sequence of data from adjacent nodes is extracted. By comparing the length differences between data frames and link control frames, the frames containing data are identified and arranged in chronological order on the time axis. Subsequently, the denoising method is applied to remove data that does not meet the criteria. The relative flow rate
Utilizing the characteristic that the single-hop forwarding delay of packets has a maximum value, matching is conducted between the time sequences of data transmission from adjacent nodes. Data transmission times within a certain time range difference are grouped as the same packet data, while unmatched data is deemed noise and promptly removed. The objective of denoising is to identify potential packet data for the information flow.
Addressing the two types of useless time records mixed in the information flow, one caused by the relay node forwarding other information flows and those caused by the relay node itself sending information flows, the maximum delay
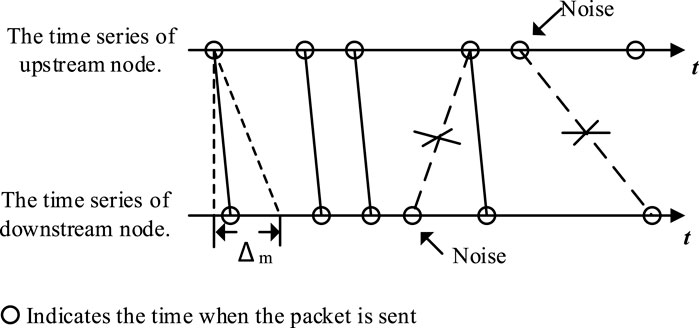
Figure 6. Noise reduction process diagram using the matching method for adjacent node data transmission times.
From the diagram, it can be seen that when the time difference between the downstream node’s packet transmission time and the upstream node’s packet transmission time is less than
From the above subsection, we can see that
where
Count the possible number of information flow packets, calculate the proportion of these packets among the total number of data transmissions from adjacent nodes, and obtain the magnitude of the relative flow rate value
where
The adjacent node data sending time sequences are subjected to sampling processing to generate a new time sequence reflecting the independent flow components between adjacent node pairs. Subsequently, denoising and relative flow rate estimation are applied to the new time sequence to obtain the value of the relative flow rate under the condition of mutually independent time sequences of adjacent nodes, which is denoted as
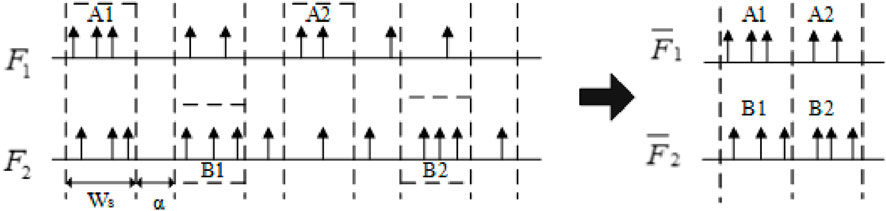
Figure 7. Denoising process diagram using ITA for adjacent node data transmission time sequence.
Comparing
Drawing the network topology based on the identified information flow transmission paths. In the topology inference process, a confirmation method based on “topological convergence” is employed. Specifically, after continuous processing of a substantial amount of link transmission activities over an extended period, if the network topology inference results no longer change, it is considered as the end of identification. The stabilized topology inference result is then considered as the final identification result. Considering the analysis of the aforementioned inference process, the pseudocode for the non-cooperative inference of IoBT topology based on flow rate estimation is presented as Algorithm 1. By lines 4, 6 and 18 in Algorithm 1, we have the run time complexity of the algorithm
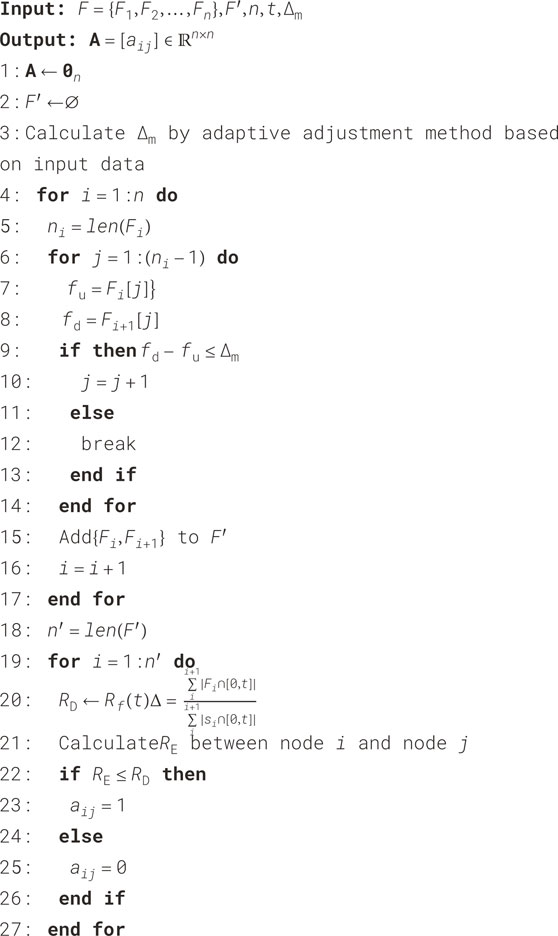
Algorithm 1. Topology inference algorithm.
To validate the feasibility of the method, a simulation environment was built using simulation software. Currently, mainstream simulators include NS-2, NS-3, GloMoSim, OPNET, QualNet, EXata, etc Walia et al. [23]. In comparison to other simulators, both EXata and QualNet are developed based on GloMoSim, utilizing an efficient parallel simulation kernel. EXata and QualNet indeed showcase remarkable advantages in simulation speed, scalability, and model fidelity, making them prime choices for simulating large-scale wireless networks. Given these advantages of EXata, it was used in this paper’s research to construct experimental scenarios and conduct relevant experiments.
In EXata, communication nodes were deployed to construct the network based on the grid model, the scenario diagram is shown in Figure 8, and relevant simulation parameters are listed in Table 1. From the diagram, it can be observed that the simulated network consists of 49 nodes positioned in a fixed manner arranged in a grid. Additionally, for simplification purposes, while maintaining the relative relationship between the network coverage area and node communication distance, the communication distance of the communication nodes and the coverage area of the network were uniformly reduced in the simulated network. The communication distance for communication nodes was set to 250 m, and the simulation area was set to
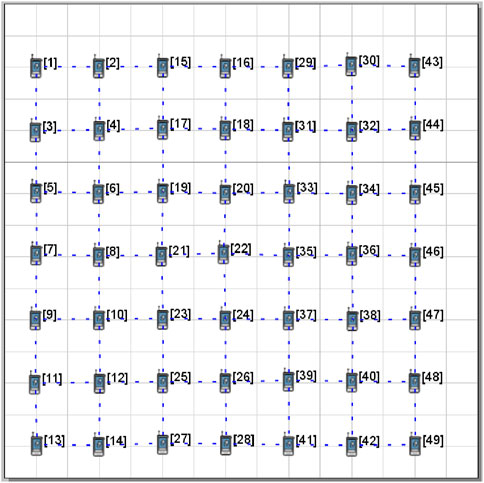
Figure 8. The scenario diagram.
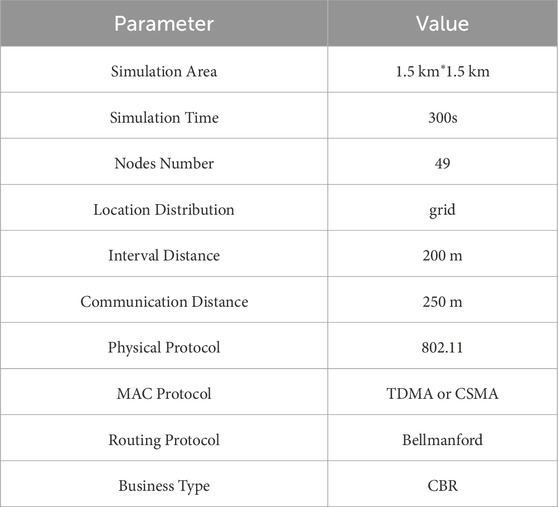
Table 1. Parameter settings in the EXata simulation environment.
In order to show the necessity of
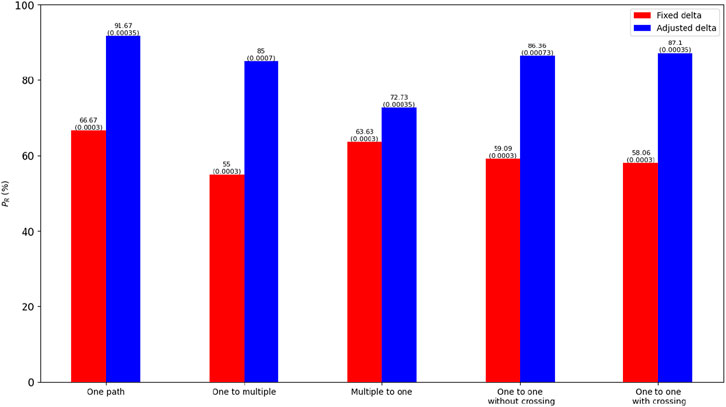
Figure 9. Bar chart of scene and accuracy relation with fixed delta.
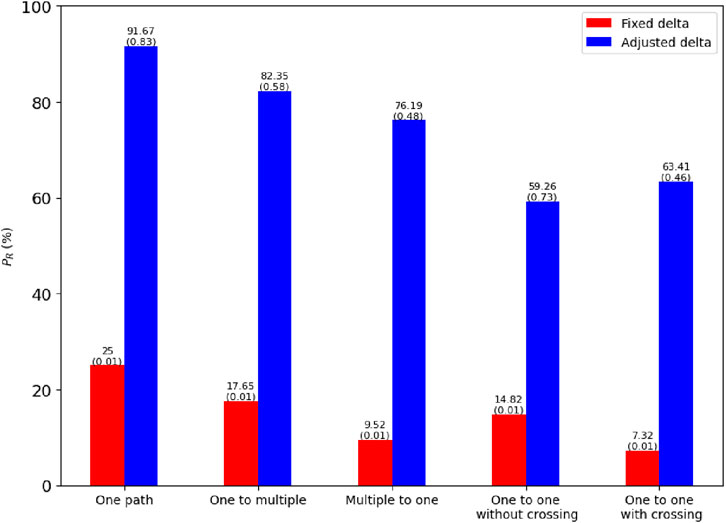
Figure 10. Bar chart of scene and accuracy relation with adaptive value.
In Figures 9, 10, the abscissa represents the different scenarios under the CSMA and TDMA protocols, from left to right: one path mode, one-to-multiple mode, multiple-to-one mode, one-to-one without crossing mode and one-to-one with crossing mode. As can be seen from Figure 9, CSMA was used and
During the coarse-grained setting phase,
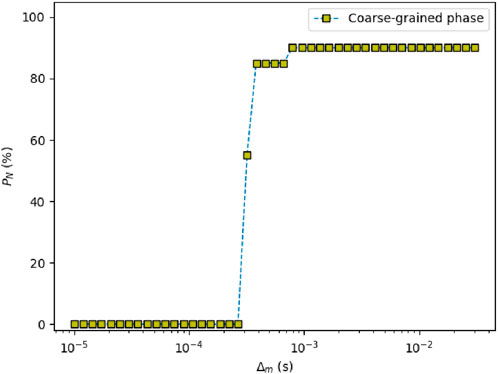
Figure 11. The diagram of the coarse-grained setting stage.
In the fine-grained adjustment phase,
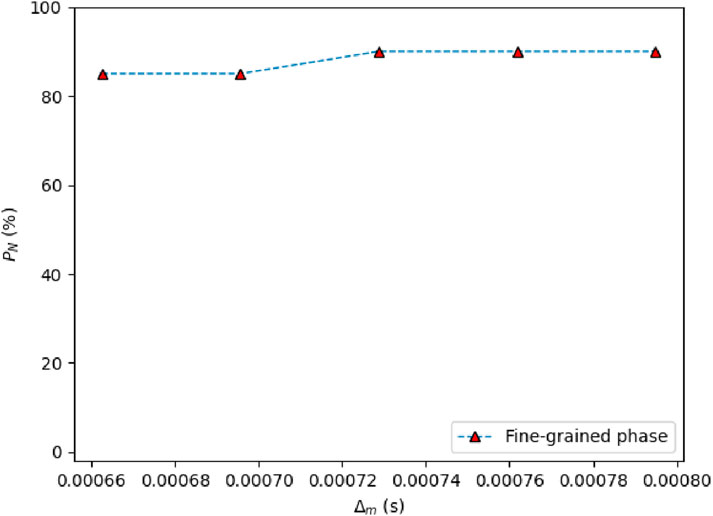
Figure 12. The diagram of the fine-grained adjustment stage.
As can be seen from Figure 13, the algorithm cannot make effective inferences when the detection duration is less than
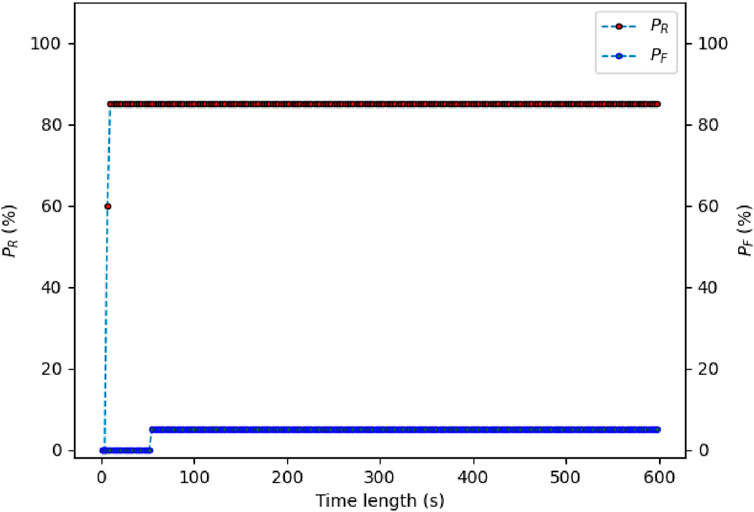
Figure 13. The influence of monitoring duration on inference accuracy and false rate.
As can be seen from Figure 14, when the loss rate reaches a certain value, around
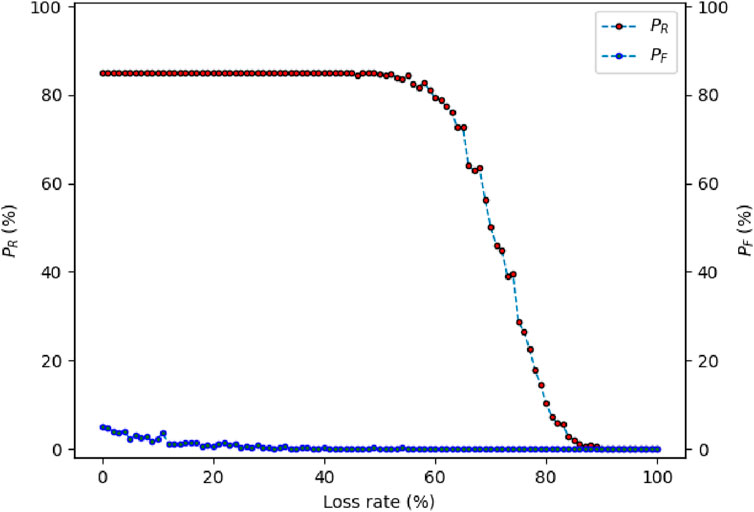
Figure 14. The influence of loss rate on inference accuracy and false rate.
In the aforementioned simulated network environment, the algorithm’s performance is validated in conjunction with different typical operational scenarios. In each scenario, the value of
Multiple-to-one operational mode refers to a scenario where multiple nodes in the network communicate with a specified node during the simulation period. This operational mode often occurs in practical scenarios where lower-level units report situations to higher-level units. The simulation scenario diagram containing the business information flow is shown in Figure 15, nodes 4, 7, 13, 31, 45, and 46 transmit a CBR to node 22, respectively. The time duration of every CBR is 30s. The topology inference result is depicted in Figure 16. It can be observed that the node pairs identification accuracy rate
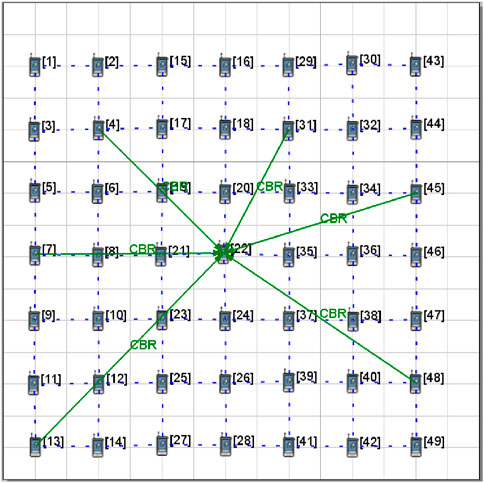
Figure 15. Multiple-to-one business mode scenario diagram.
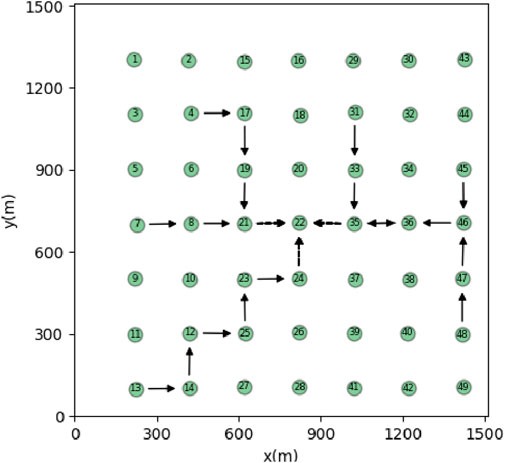
Figure 16. Inference result for the multiple-to-one operational mode.
One-to-multiple operational mode refers to a scenario where a specified node distributes information to multiple nodes in the network during the simulation period. This operational mode often occurs in practical scenarios where higher-level units assign tasks to lower-level units. The simulation scenario diagram is shown in Figure 17, node 22 transmits one CBR to nodes 4, 7, 13, 31, and 45, respectively. The topology inference result is depicted in Figure 18. It can be observed that the node pairs identification accuracy rate
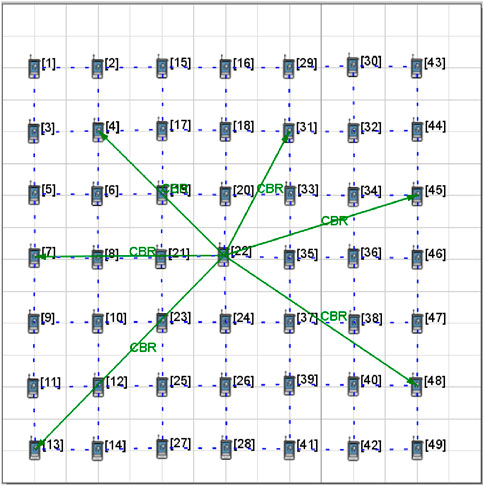
Figure 17. One-to-multiple business mode scenario diagram.
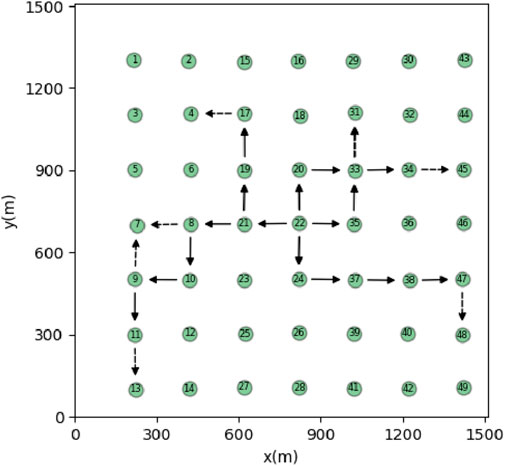
Figure 18. Inference result for the one-to-multiple operational mode.
One-to-one operational mode refers to a scenario where a specified node in the network randomly initiates business communication with other nodes in the network. This operational mode often occurs in practical scenarios where adjacent units exchange information. Two simulation scenarios were constructed based on whether there are crossings in the information flow transmission paths, as shown in Figures 19, 20. The topology inference results are depicted in Figures 21, 22. From those figures, it can be observed that in the case of non-crossing business flows, the node pairs identification accuracy rate
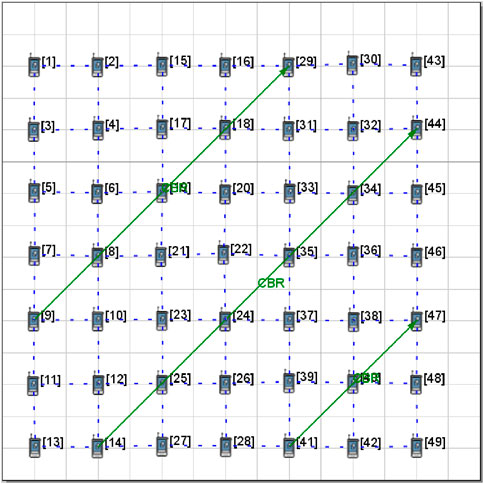
Figure 19. Scene diagram for the one-to-one operational mode (non-crossing).
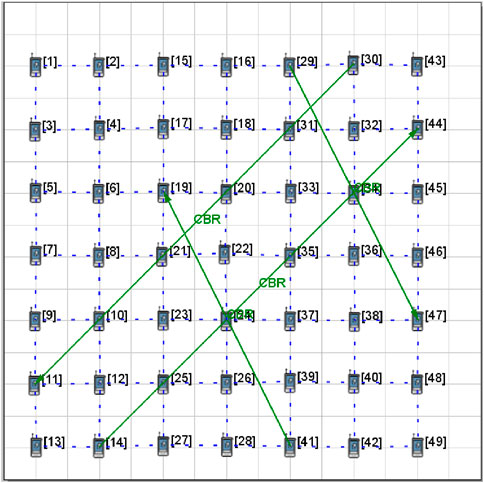
Figure 20. Scene diagram for the one-to-one operational mode (crossing).
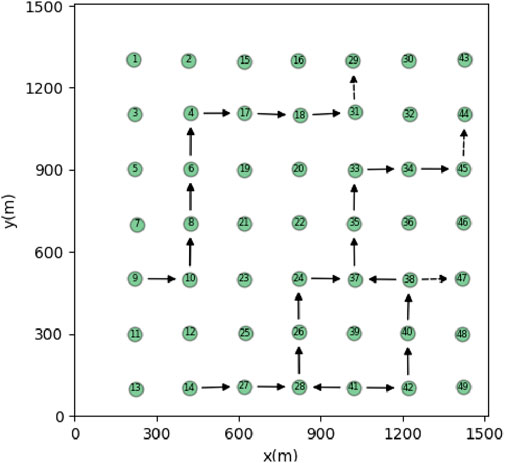
Figure 21. Inference result for the one-to-one operational mode (non-crossing).
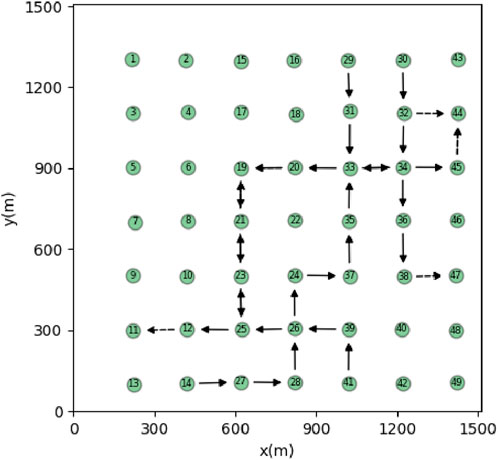
Figure 22. Inference result for the one-to-one operational mode (crossing).
This paper investigates the topology inference of IoBT without network access and information parsing. We propose a non-cooperative topology inference method for IoBT based on flow rate estimation. In the method, the sending time sequences of data between adjacent nodes in the IoBT are extracted. According to the requirement of the maximum delay in information transmission in the network, the information flow within a certain threshold of the information transmission time between adjacent nodes is extracted. In order to improve the accuracy of communication relationship inference, a threshold parameter adaptive method is also proposed, by adjusting the value adaptively, the negative influence of fixed value on the inference result is avoided. The relative flow rate size
However, there are limitations and challenges associated with the proposed method. First, the proposed algorithm operates in a centralized manner. Since the runtime complexity of the algorithm is polynomial with respect to the input size, the execution time increases significantly as the size of the network grows. This makes the proposed method less suitable for large-scale networks, where the computational overhead and latency could become prohibitive. To address this, future work could explore distributed or parallelized versions of the algorithm, leveraging modern computing architectures such as edge computing or cloud-based solutions to improve scalability and efficiency.
Second, the proposed method is primarily designed for static networks. The input to the algorithm, which is the timestamp sequence, remains fixed during the execution of the algorithm. As a result, the inferred topology reflects only a snapshot of the network’s state at the time the input was collected. If the network topology changes after the input is taken—due to node mobility, link failures, or adversarial actions—the accuracy of the inferred topology may degrade significantly. This limitation is particularly critical in IoBT environments, where network dynamics are inherent due to the mobility of combat units, environmental factors, and evolving mission requirements. To overcome such a challenge, future research should focus on developing adaptive and real-time topology inference methods capable of handling dynamic network conditions.
The original contributions presented in the study are included in the article/supplementary material, further inquiries can be directed to the corresponding author.
JH: Conceptualization, Data curation, Formal Analysis, Funding acquisition, Methodology, Project administration, Resources, Writing – original draft. RD: Conceptualization, Data curation, Formal Analysis, Methodology, Writing – review and editing. ZN: Formal Analysis, Investigation, Writing – review and editing. CP: Data curation, Software, Writing – review and editing. JC: Validation, Writing – review and editing.
The author(s) declare that no financial support was received for the research and/or publication of this article.
The authors would like to thank the reviewers for their valuable comments and suggestions.
The authors declare that the research was conducted in the absence of any commercial or financial relationships that could be construed as a potential conflict of interest.
The author(s) declare that no Gen AI was used in the creation of this manuscript.
All claims expressed in this article are solely those of the authors and do not necessarily represent those of their affiliated organizations, or those of the publisher, the editors and the reviewers. Any product that may be evaluated in this article, or claim that may be made by its manufacturer, is not guaranteed or endorsed by the publisher.
1. Wen J, Yang J, Wang S. Development status and prospect of electronic warfare equipment technology. Inf Countermeasure Technology (2022) 1:1–10. doi:10.12399/j.issn.2097-163x.2022.01.001
2. Conradie NH. Autonomous military systems: collective responsibility and distributed burdens. Ethics Inf Technology (2023) 25:20. doi:10.1007/s10676-023-09696-9
3. Chen J, Zheng X, Peng L, Xu Z, Li A. Research on land battlefield situation distribution network based on brn. J Phys Conf Ser (2020) 1646:012048. doi:10.1088/1742-6596/1646/1/012048
4. Abuzainab N, Saad W. Dynamic connectivity game for adversarial internet of battlefield things systems. IEEE Internet Things J (2018) 5:378–90. doi:10.1109/JIOT.2017.2786546
5. Akter R, Golam M, Doan V-S, Lee J-M, Kim D-S. Iomt-net: blockchain-integrated unauthorized uav localization using lightweight convolution neural network for internet of military things. IEEE Internet Things J (2023) 10:6634–51. doi:10.1109/JIOT.2022.3176310
6. Li X, Wei P, Wei ZJ, Guosong L, Ping W. Research on security issues of military internet of things. In: 2020 17th international computer conference on wavelet active media technology and information processing (ICCWAMTIP) (2020). p. 399–403. doi:10.1109/ICCWAMTIP51612.2020.9317401
7. Islam A, Masuduzzaman M, Akter A, Young Shin S. Mr-block: a blockchain-assisted secure content sharing scheme for multi-user mixed-reality applications in internet of military things. In: 2020 international conference on information and communication technology convergence (ICTC) (2020). p. 407–11. doi:10.1109/ICTC49870.2020.9289327
8. Rutravigneshwaran P, Anitha G, Prathapchandran K. Trust-based support vector regressive (tsvr) security mechanism to identify malicious nodes in the internet of battlefield things (iobt). Int J Syst Assur Eng Management (2024) 15:287–99. doi:10.1007/s13198-022-01719-w
9. Yan H. The study on network topology discovery algorithm based on snmp protocol and imp protocol. In: 2012 IEEE international Conference on computer Science and automation engineering (beijing: ieee) (2012). p. 665–8.
10. Yong W, Nan P, Xiaoling T. Network topology discovery algorithm based on ospf. In: 2010 international conference on intelligent computing and integrated systems (2010). p. 136–9. doi:10.1109/ICISS.2010.5656788
11. Chen R, Chang L, Hui Y, Cheng N, Zhang W. Noncooperative topology inference of wireless networks with monitoring sensors. IEEE Internet Things J (2023) 10:19282–95. doi:10.1109/JIOT.2023.3281388
12. Zhang X, Phillips C. A survey on selective routing topology inference through active probing. IEEE Commun Surv & Tutorials (2012) 14:1129–41. doi:10.1109/SURV.2011.081611.00040
13. Jin X, Yiu W-PK, Chan S-HG, Wang Y. Network topology inference based on end-to-end measurements. IEEE J Selected Areas Commun (2006) 24:2182–95. doi:10.1109/JSAC.2006.884016
14. Niu Z, Ma T, Shu N, Shan H. Interference sources localization and communication relationship inference with cognitive radio iot networks. IEEE Access (2020) 8:103062–72. doi:10.1109/access.2020.2998730
15. Tilghman P, Rosenbluth D. Inferring wireless communications links and network topology from externals using granger causality. In: Milcom 2013 - 2013 IEEE military communications conference. San Diego, CA, USA: IEEE (2013). p. 1284–9.
16. Sharma P, Bucci DJ, Brahma SK, Varshney PK. Communication network topology inference via transfer entropy. IEEE Trans Netw Sci Eng (2020) 7:562–75. doi:10.1109/tnse.2018.2889454
17. Liu C, Wu X, Zhu L, Yao C, Yu L, Wang L, et al. The communication relationship discovery based on the spectrum monitoring data by improved dbscan. IEEE Access (2019) 7:121793–804. doi:10.1109/ACCESS.2019.2938296
18. Testi E, Giorgetti A. Blind wireless network topology inference. IEEE Trans Commun (2021) 69:1109–20. doi:10.1109/TCOMM.2020.3036058
19. Ganesh P, Venkataraman H. Rf-based wireless communication for shallow water networks: survey and analysis. Wireless Personal Commun (2021) 120:3415–41. doi:10.1007/s11277-021-09068-w
20. Singh M, Shrivastava L. Multi-objective optimized multi-path and multi-hop routing based on hybrid optimization algorithm in wireless sensor networks. Wireless Networks (2024) 30:2715–31. doi:10.1007/s11276-024-03686-5
21. Chai Y, Zeng X, Liu Z. The future of wireless mesh network in next-generation communication: a perspective overview. Evolving Syst (2024) 15:1635–48. doi:10.1007/s12530-024-09583-8
22. Roy A, Pachuau JL, Saha AK. An overview of queuing delay and various delay based algorithms in networks. Computing (2021) 103:2361–99. doi:10.1007/s00607-021-00973-3
Keywords: internet of battlefield things (IoBT), non-cooperative, topology inference, flow rate estimation, network security
Citation: Huang J, Dong R, Niu Z, Peng C and Chen J (2025) Non-cooperative inference method for the IoBT topology based on flow rate estimation. Front. Phys. 13:1584958. doi: 10.3389/fphy.2025.1584958
Received: 28 February 2025; Accepted: 20 March 2025;
Published: 04 April 2025.
Edited by:
Dun Han, Jiangsu University, ChinaCopyright © 2025 Huang, Dong, Niu, Peng and Chen. This is an open-access article distributed under the terms of the Creative Commons Attribution License (CC BY). The use, distribution or reproduction in other forums is permitted, provided the original author(s) and the copyright owner(s) are credited and that the original publication in this journal is cited, in accordance with accepted academic practice. No use, distribution or reproduction is permitted which does not comply with these terms.
*Correspondence: Rongcheng Dong, ZG9uZ3JjaDE5OTVAb3V0bG9vay5jb20=
Disclaimer: All claims expressed in this article are solely those of the authors and do not necessarily represent those of their affiliated organizations, or those of the publisher, the editors and the reviewers. Any product that may be evaluated in this article or claim that may be made by its manufacturer is not guaranteed or endorsed by the publisher.
Research integrity at Frontiers
Learn more about the work of our research integrity team to safeguard the quality of each article we publish.