 Bo Sun
 Yue Li1
 Zhijian Gao
 Mingjiang Zhang
94% of researchers rate our articles as excellent or good
Learn more about the work of our research integrity team to safeguard the quality of each article we publish.
Find out more
ORIGINAL RESEARCH article
Front. Phys., 12 March 2025
Sec. Optics and Photonics
Volume 13 - 2025 | https://doi.org/10.3389/fphy.2025.1569734
This article is part of the Research TopicAcquisition and Application of Multimodal Sensing Information - Volume IIView all 10 articles
This paper presents the design and fabrication of a T-shaped quartz tuning fork (QTF) for quartz-enhanced photoacoustic spectroscopy (QEPAS) gas sensing systems, specifically targeting the detection of decomposition products in sulfur hexafluoride (SF6). Through theoretical analysis and simulations, the geometrical parameters of the T-shaped QTF were optimized to achieve a low resonant frequency of 12.46 kHz and a quality factor of 4,587 in SF6 gas matrix. The optimized system demonstrated a minimum detection limit (MDL) of 1 ppm for C2H2 in SF6 matrix, with a normalized noise equivalent absorption (NNEA) coefficient of 2.037 × 10⁻⁸ cm-1 W/√Hz. This study successfully validates the effectiveness of the T-shaped QTF for sensitive gas detection in SF6 matrix, providing a promising technical solution for online monitoring of decomposition products and fault diagnosis in SF6-insulated equipment.
With the accelerated global transition to green and low-carbon energy, the demand for clean electricity is rapidly increasing. To accommodate the challenges posed by the integration of high proportions of renewable energy sources into power grids, grid systems are expanding in scale and complexity. This necessitates enhanced intelligence, automation, and resilience in power grids [1, 2]. To safeguard industrial security and socio-economic stability, it is essential to leverage smart grids and advanced sensing technologies for intelligent monitoring, fault prediction, and rapid recovery. Gas-insulated switchgear (GIS), utilizing SF6 gas for its exceptional insulation and arc-quenching capabilities, has emerged as a key element of modern high-voltage power systems, superseding conventional oil-insulated equipment [3]. Fault prediction and diagnosis in GIS are of paramount importance for the reliable operation of power systems. The development of a fault detection system tailored for GIS equipment is needed.
SF6 is widely used as an ideal insulating medium due to its properties as a colorless, odorless, non-toxic, and non-flammable gas with a density of 146 g/mol. Its insulation strength is 2–3 times greater than that of air, and it possesses high dielectric strength, remaining relatively stable at room temperature [4–6]. However, operational issues within GIS, such as arcing, partial discharges, or excessive temperatures, can cause SF6 to decompose into lower fluorides like SF4, SF2, and S2F10 [7]. These lower fluorides can react with trace amounts of oxygen and water vapor present in the equipment under discharge and high-temperature conditions, generating corrosive byproducts including SO2, SOF2, SO2F2, SOF4, H2S, HF, and CO. These decomposition products may deposit on the surfaces of insulating materials, thereby increasing the risk of corrosion and dielectric breakdown in metallic components, which can lead to equipment malfunction. Moreover, some decomposition products, including SO2, SOF2, HF, and CO, are toxic, presenting health concerns [8, 9].
In GIS equipment, different types of faults can generate various species and concentrations of SF6 decomposition products. By analyzing these decomposition products in conjunction with historical operational data, it is possible to infer the potential fault types and their severity [10]. Currently, SF6 decomposition product detection primarily employs four methods: gas chromatography, electrochemical sensors, gas detection tubes, and Fourier-transform infrared spectroscopy [11–18]. Gas chromatography effectively separates complex gas mixtures with high precision and stability; however, its sample preparation process is cumbersome, time-consuming, and costly, making it unsuitable for rapid on-site testing [11, 12]. Electrochemical sensors offer a quick response to changes in gas concentration, making them suitable for real-time monitoring and field applications, but they have a limited lifespan and higher maintenance costs [12–14]. Gas detection tubes are easy to operate but provide lower accuracy and are susceptible to human error [15, 16]. Fourier-transform infrared spectroscopy, based on laser spectroscopic techniques, mitigates uncertainties associated with chemical reactions; nonetheless, its detection sensitivity remains limited and is prone to interference from environmental noise [14, 17, 18].
Photoacoustic spectroscopy (PAS) based on absorption spectroscopy technology [19], analyzes trace gases by detecting the acoustic signals released when these gases absorb laser energy at specific wavelengths, thereby obtaining the spectral information of the gas within its characteristic absorption wavelength range and facilitating the analysis of gas compositions and concentration measurement [20–25]. As an emerging laser spectroscopic technique, QEPAS has developed rapidly since it was first introduced by Professor Frank’s team at Rice University in 2002 [26–29]. In QEPAS, a low-cost, compact QTF serves as the acoustic detector. The modulated laser beam passes unobstructed through the two prongs of the tuning fork, and the resultant photoacoustic signal, which is proportional to both the laser power and the target gas concentration, causes the prongs to vibrate synchronously in opposite directions (antisymmetric bending mode). The piezoelectric effect of quartz allows the bending of the QTF prongs to generate piezoelectric charges, which are collected by the metal coating on the surface of the fork and transmitted via electrodes connected to the QTF, enabling the inversion of the target gas concentration. One significant advantage of QEPAS technology is that it operates without optical detectors, thus exhibiting characteristics such as wavelength independence and a direct correlation between detection sensitivity and laser power. Moreover, QEPAS utilizes the QTF to replace traditional broadband microphones used in PAS, leveraging the QTF’s small size, low-cost, high-quality factor [30–35].
The standard commercial QTFs used in QEPAS technology exhibit several limitations. First, the 0.3 mm prong spacing of standard QTFs in QEPAS requires precise optical beam alignment, as contact between the excitation light and prongs causes significant interference. This limitation complicates the application of longer-wavelength infrared, high-power LED, and THz laser sources. Second, the modulation frequency in photoacoustic spectroscopy is determined by the resonance frequency of the QTF. Standard QTF with 32.7 kHz resonance frequency restricts the efficient detection of gases with slow relaxation, resulting in low electroacoustic conversion. Additionally, in SF6 gas matrix, standard commercial QTFs face significant challenges. The SF6 molecule has a high density and mass, resulting in a relatively slow diffusion rate. This means that at higher frequencies, the vibrational response of the QTF is notably restricted, leading to ineffective detection of low concentrations of SF6 decomposition products [36, 37]. Under these conditions, the responsiveness of the QTF to heavier molecules, such as SF6 and its byproducts, declines further, reducing detection sensitivity. Moreover, the high resonance frequency of the QTF hinders the capture of thermal acoustic signals from gas molecules, particularly in applications requiring high sensitivity, leading to signal loss. To address these issues in the promotion of QEPAS technology, it is crucial to design a new type of customized QTF with a lower resonance frequency and wider prong spacing. However, increasing the prong spacing will lead to an upward trend in resonance frequency, and changes in this parameter may affect the quality factor of the tuning fork. Therefore, the development of high-performance custom tuning forks requires sound theoretical guidance to ensure their effective application in SF6 gas matrix.
This paper presents our recent advancements in the design, fabrication, and application of a customized quartz tuning fork (QTF) for SF6 decomposition product detection via quartz-enhanced photoacoustic spectroscopy (QEPAS). Specifically, we designed and fabricated a novel T-shaped QTF, characterized by its wider prong spacing, lower resonance frequency, and maintained high-quality factor—features crucial for efficient QEPAS sensing in SF6 matrix. To validate the performance of this custom QTF in a QEPAS sensor, a C2H2 gas sensor was constructed using a distributed feedback (DFB) laser with a center wavelength of 1,532 nm as the excitation source, and its performance metrics were systematically evaluated. This approach not only demonstrates the capability of the T-shaped QTF to overcome the common limitations of standard QTFs in SF6 matrix, but it also presents a practical pathway for high-sensitivity and high-selectivity detection of SF6 decomposition products, thereby enabling improved fault diagnosis in GIS equipment.
The SF6 molecule possesses a large mass and density, which reduces molecular diffusion rates and significantly impacts the vibrational characteristics of QTFs. Commercially available standard QTF exhibit a quality (Q)-factor of 12,741 in N2, but the Q-factor drops to 3,757 in SF6, rendering their sensing capabilities ineffective [37]. To achieve efficient QEPAS detection in SF6 matrix, the geometrical and electrical parameters of the QTF can be tailored to better match the requirements of the QEPAS technique. In fact, the resonant frequency and quality factor of the QTF are critical parameters influencing the performance of QEPAS sensors. Starting analysis from the resonant frequency (f0) of the QTF, for effective demodulation of the photoacoustic signal, f0 must be equal to the modulation frequency (fa) of the excitation source. Furthermore, fa and the radiative lifetime (τ) of the gas molecules must satisfy the condition f·τ ≪ 1 to ensure efficient excitation of the photoacoustic signal [33]. It is necessary to lower the resonant frequency of the QTF to match the slower molecular relaxation rates of various SF6 decomposition products and to avoid signal loss at high frequencies due to the diffusion limitations of SF6 molecules. Considering the Q-factor of the QTF, which represents the ratio of the total energy stored by the fork to the energy dissipated per oscillation cycle, a higher Q value indicates that the tuning fork can amplify the signal to a greater extent based on resonance. However, in high-purity SF6 gas matrixs, pursuing an excessively high Q-factor is not desirable due to the damping effect of the SF6 gas on the QTF. An overly high Q-factor can lead to a sluggish response of the QTF to the photoacoustic signals generated by the decomposition products, hindering the rapid capture of signals originating from these products. It is crucial to optimize the Q-factor of the QTF so that it can effectively amplify the signal of decomposition products while also responding quickly to changes in the decomposition product signal. Consequently, the QTF design for SF6 gas matrix must simultaneously address the reduction of resonant frequency while maintaining an appropriate Q-factor and accounting for the effects of gas damping, ultimately achieving sensitive and efficient detection of SF6 and its decomposition products.
According to the Euler-Bernoulli equation, the resonant frequency f0 of a QTF is closely related to its geometrical parameters, such as prong length L, width T, and the gap S between two prongs [38, 39]:
Here, ρ and E represent the density and Young’s modulus of the material used to fabricate the QTF, respectively. For quartz, a material renowned for its excellent temperature stability of the piezoelectric coefficient, these values are 2,650 kg/m3 and 0.72 × 10¹¹ N/m2, respectively. Considering the influence of the spacing between the QTF prongs on the ease of optical collimation of the excitation source, to reduce the resonant frequency f0, the width of the prongs should be decreased while increasing their length.
Regarding the Q-factor of the QTF, this parameter reflects the energy dissipation level of the QTF prong during a single oscillation cycle. The losses can generally be categorized into intrinsic and extrinsic losses, such as losses due to friction with the surrounding gas and thermoelastic damping. These losses coexist but are not correlated with each other, and currently, there are no established theories or formulas to accurately quantify them. Among these various losses, the loss due to gas friction is typically much greater than the sum of the other losses. Therefore, in our theoretical analysis, we can approximate by only considering these types of loss. The empirical formula related to this gas friction loss is given by [36]:
where μ is the gas viscosity, ρ0 is the gas pressure, and t is the thickness of the QTF. Substituting the expression for f0 into the above equation, it becomes evident that to achieve a high Q-factor, the width of the prongs should be increased, along with an increase in the QTF’s resonant frequency f0. However, when the frequency is less than 10 kHz, it is not guaranteed that Q > 10,000 at atmospheric pressure. Clearly, for conventional QTF geometries, a high Q-factor and a low resonant frequency cannot be simultaneously achieved. Therefore, a compromise must be made in selecting appropriate parameters while increasing the spacing between the prongs.
Based on the preceding analysis, a T-shaped QTF was designed. A detailed schematic is shown in Figure 1, T1, T2, L1, and L2 represent the widths and lengths of the top and bottom sections of the T-shaped QTF prongs, respectively. By the aforementioned expressions for the QTF’s resonant frequency and Q-factor, we can initially determine the range of values for each geometrical parameter. Further refinement of these parameters requires modeling the QTF by COMSOL software and conducting simulation calculations. Then, the QTF’s prong thickness, t, the total prong length, L, and the width of the prong T1, were set to 0.25 mm, 9.4 mm, and 2 mm, respectively, based on the parameters of a previously fabricated novel wide-prong-spacing QTF [40]. Given that the electrode pattern used in the experiment extends approximately 2.4 mm from the top, L1 was set to 2.4 mm. The electrode pattern, in this case, refers to the thin metallic film, electroplated onto the quartz surface after QTF fabrication to conduct the piezoelectric signal. A gold film was employed to maximize protection against corrosion damage to the quartz QTF caused by the highly corrosive components SO2, SOF2, SO2F2, SOF4, and H2S, which are often found in SF6 decomposition products. However, despite these measures, due to the inevitable presence of H2O molecules in GIS equipment, H2S can still react with gold under the presence of H2O to form Au2S, affecting the accuracy of the output piezoelectric signal. Therefore, periodic inspection of the detection module is necessary to ensure the equipment’s accuracy.
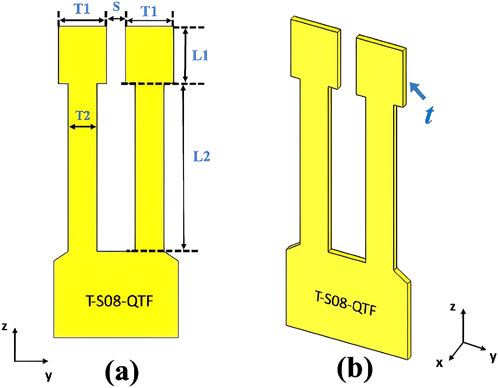
Figure 1. (A) Front view schematic of the T-S08-QTF. (B) Side view schematic of the T-S08-QTF.
Furthermore, COMSOL simulation results indicate a positive linear relationship between the QTF’s base resonant frequency and the ratio T2/T1, with a 70% threshold. When T2/T1 is less than 70%, the QTF’s resonant frequency drops below 10 kHz. However, further reduction of this ratio increases the instability of the QTF’s geometrical and mechanical model, thus compromising stable oscillation of the QTF. Therefore, T2/T1 was set to 0.7, leading to T2 = 1.4 mm. After completing the theoretical parameter settings, a T-shaped QTF, as depicted in Figure 1 and named T-S08-QTF, were fabricated from quartz material. The electrical parameters of these QTFs were then experimentally measured. The measured frequency response curves of the T-S08-QTF in N2 and SF6 matrix are shown in Figure 2. By performing a Lorentzian fit to these response curves, it can be determined that the resonant frequency and Q-factor of the T-S08-QTF, as presented in Table 1. These measured values are in good agreement with the theoretical calculations and validating the theoretical model. The Q-factor of the T-S08 QTF in SF6 is nearly 1,000 higher than that of conventional standard QTF.
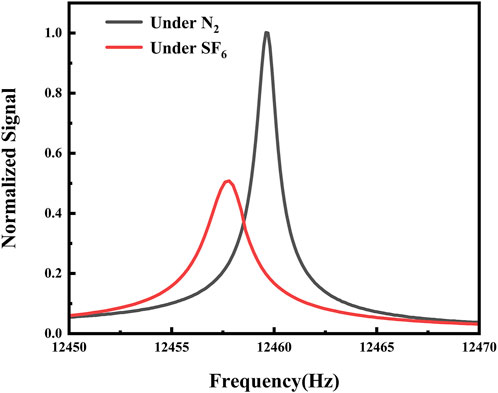
Figure 2. Frequency response curve of the T-S08-QTF measured in a N2 and SF6 matrix.
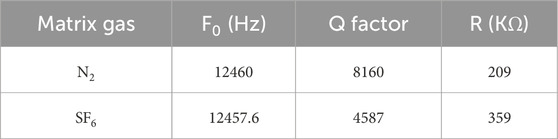
Table 1. Resonant frequency (f0), Q-factor, and resistance (R)of the T-S08-QTF in N2 and SF6 environments.
To validate the performance of the T-S08-QTF in a QEPAS system, a gas sensing system was constructed, as shown in Figure 3, using acetylene (C2H2) as the target analyte. After consulting the HITRAN database, the C2H2 absorption line at 6523.88 cm-1 was selected as the operating wavelength for the excitation source. Consequently, a near-infrared distributed feedback (DFB) laser, packaged in a butterfly configuration, was employed here. The laser’s temperature and current were controlled by a driver board. The QEPAS spectrophone consisted of the T-S08-QTF and a miniature acoustic micro-resonator, sealed within a ∼100 cm3 stainless steel gas cell. The gas cell was equipped with 25 mm diameter calcium fluoride optical windows on either side to ensure sufficient interaction between the excitation source and the gas within the cell. The transmittance of the windows exceeded 95% for the excitation source. The laser light was delivered to the gas cell through a fiber with a focusing lens, passing non-contact through the optical micro-resonator and the T-S08-QTF with its large prong spacing. A power meter was placed behind the gas cell to measure the laser power in real-time. The gas cell ports were equipped with inlet and outlet interfaces, connected to a gas line that included a diaphragm pump, needle valve, pressure controller, and flow meter, to control and monitor the pressure and flow rate within the gas line. Based on the selected C2H2 absorption line, the DFB laser’s temperature was adjusted to 13.8°C, matching the laser’s center wavelength with the target absorption line. A complete C2H2 absorption spectrum could be obtained by applying a scanning current. To reduce background noise and enhance the signal-to-noise ratio, a 2f wavelength modulation photoacoustic detection method was employed in this QEPAS sensor. Wavelength modulation of the DFB laser was achieved by applying a modulated current, with the modulation frequency set to half of the T-S08-QTF’s resonant frequency. The piezoelectric current generated by the T-S08-QTF was converted into a voltage signal by a transimpedance amplifier with a feedback resistor of 10 MΩ and then connected to the signal input of a lock-in amplifier (Stanford Research System, SR830). The synchronous signal input of the lock-in amplifier was synchronized with the modulation signal output of a function generator, enabling the demodulation of the voltage signal at twice the modulation frequency and the acquisition of the second harmonic signal, which is related to the target gas concentration. The lock-in amplifier’s integration time was set to 300 ms, the filter slope was set to 12 dB/octave, and the corresponding detection bandwidth was 0.833 Hz.
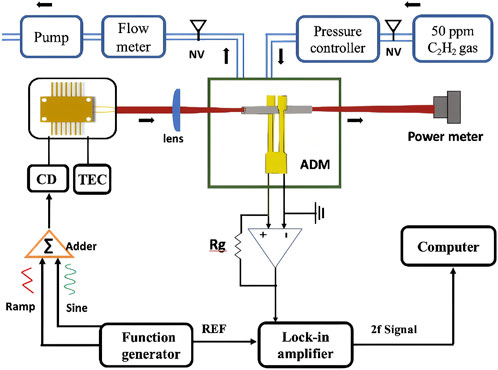
Figure 3. Schematic of the QEPAS sensor for C2H2 detection in SF6 matrix.
In QEPAS gas sensing systems, the spectrophone is a core component, consisting of a QTF and a micro-resonator. The micro-resonator typically comprises a pair of thin-walled stainless steel tubes with small inner diameters. The two tubes are symmetrically positioned on either side of the QTF along the optical path, vertically aligned such that the center of each tube is positioned 1.5 mm from the tips of the QTF prongs, with each tube leaving a small gap with the outer sides of the QTF prongs. As an acoustic micro-resonator, the resonant tubes can enable the photoacoustic signal to resonate within the micro-resonator and form a standing wave, thus enhancing the photoacoustic signal intensity. To achieve the optimal signal collection and amplification effect of the micro-resonator, its geometrical dimensions need to be optimized. Since the prongs gap distance of the T-S08-QTF is 0.8 mm, the inner diameter of the micro-resonator should be no less than 0.8 mm to allow a relatively large optical spot size to pass through the QTF without contact. In this experiment, resonant cavities with a 1.3 mm inner diameter were first fabricated from thin stainless steel. The 50 ppm C2H2 signal was then collected while the micro-resonator length was adjusted from 4 mm to 15 mm. This optimization experiment was conducted at standard atmospheric pressure and room temperature about 24°C, the resulting C2H2 peak signal data are shown in Figure 4A. A maximum signal of 53 μV was obtained at a resonator length of 5 mm. With the resonator length fixed at 5 mm, the resonant resonator’s inner diameter was then further optimized by adjusting it from 0.7 mm to 1.9 mm. The resulting 50 ppm C2H2 peak signal data are shown in Figure 4B. A maximum signal of 87 μV was obtained at an inner diameter of 1 mm. Therefore, the optimal resonator length and inner diameter dimensions for the micro-resonator were determined to be 5 mm and 1 mm, respectively. The modulation depth used in the system during the above experiments was a previously optimized value of 13 mA.
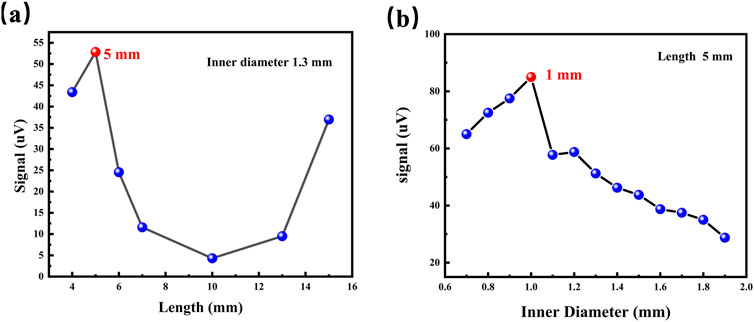
Figure 4. (A) Micro-Resonator length optimization results; (B) Micro-Resonator inner diameter optimization results.
In QEPAS systems, optimization of the operating pressure is necessary. Initially, as the gas chamber pressure gradually increases from an extremely low pressure, the gas molecule density increases, leading to a stronger interaction between laser and matter, and consequently, an increase in the photoacoustic signal. On the other hand, as the ambient pressure continues to rise, the gas molecule density further increases, and the frequency of collisions with the QTF increases. This significantly increases the gas damping effect, which constrains the free vibration of the QTF, increases vibrational energy loss, and thus weakens the vibration performance, resulting in a decrease in the photoacoustic signal. Therefore, due to the combined effect of these two opposing factors, finding an optimal pressure balance point is necessary to obtain the best photoacoustic signal. Data measurements were taken every 100 Torr, starting from 100 Torr. The measurement analyte was the 50 ppm C2H2 signal in an SF6 matrix. This process allowed us to analyze the impact of different pressures on sensor performance and to identify the optimal operating conditions. The experimental results, shown in Figure 5, indicate that the sensitivity of the QEPAS sensor increases significantly with increasing pressure, reaching a peak when the pressure reaches 300 Torr. However, as the pressure continues to increase beyond 300 Torr, the C2H2 signal begins to decrease.
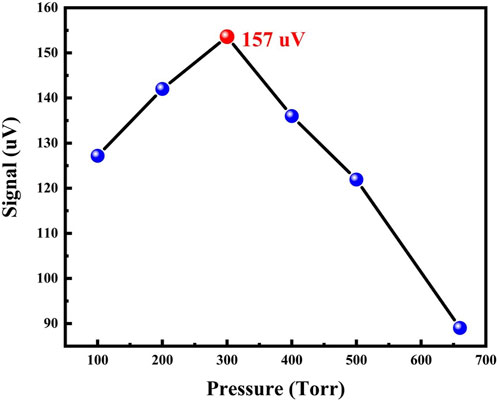
Figure 5. Optimization results for the operating pressure of the QEPAS system.
After completing the aforementioned parameter optimization experiments, the detection sensitivity of the C2H2 sensor based on the T-S08-QTF was experimentally determined. The 2f-QEPAS signal of the acetylene gas and the noise background signal were measured by operating the system at 300 torr, with the gas chamber filled with a 50 ppm C2H2/SF6 mixture, as shown in Figure 6. The results indicate that the signal amplitude obtained was 157 μV. The 1σ noise level, determined from the background signal with high-purity SF6, was 3 μV. Based on this, the MDL of the system for C2H2 gas under atmospheric conditions was determined to be 1 ppm. Considering the system’s detection bandwidth of 0.833 Hz and the excitation light power of 21 mW, the NNEA coefficient of the system was calculated to be 2.037 × 10⁻⁸ cm-1W/√Hz.
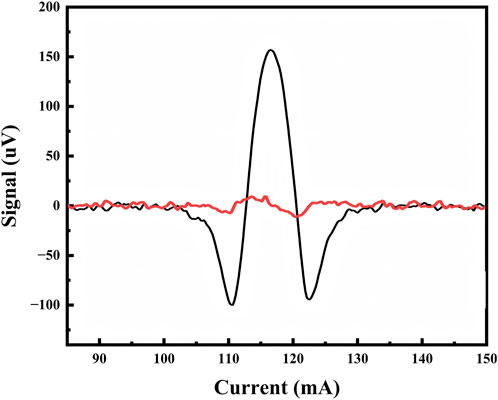
Figure 6. Second harmonic signal obtained for 50 ppm C2H2 in an SF6 matrix.
This paper theoretically analyzes the influence of QTF geometric parameters on its resonant frequency and Q-factor, considering the high density and large molecular mass characteristics of SF6 gas. Based on this analysis, a T-shaped quartz tuning fork (T-S08-QTF) with a lower resonant frequency (∼12.46 kHz) and a larger prong spacing (0.8 mm) was designed and fabricated. The experimentally measured Q-factors of the T-S08-QTF in N2 and SF6 environments were 8,160 and 4,587, respectively, which are in good agreement with theoretical predictions. A QEPAS gas sensing system based on the T-S08-QTF was constructed, and system parameters were optimized using C2H2 as the target gas. Through experiments, the optimal micro-resonator length and inner diameter of the acoustic micro-resonator were determined to be 5 mm and 1 mm, respectively. The optimized operating pressure was 300 Torr. The experimental results show that with 50 ppm C2H2/SF6 gas mixture, the MDL of the system for acetylene was 1 ppm, and the NNEA coefficient was 2.037 × 10⁻⁸ cm-1 W/√Hz. This study successfully designed and fabricated a novel T-shaped QTF suitable for gas detection in SF6 matrix and demonstrated its effectiveness in a QEPAS sensor system. The optimized QEPAS sensor exhibited good sensitivity and a low detection limit, offering a promising approach for detecting SF6 decomposition products in gas-insulated equipment. Future work will explore the T-S08-QTF’s performance in detecting specific decomposition products (SO2, SOF2, HF, CO), its long-term stability, and anti-interference capabilities. Further system optimization, including advanced data processing, will enhance detection accuracy and reliability.
The datasets presented in this article are not readily available because The dataset can be accessed through a collaborative agreement. Requests to access the datasets should be directed to c3VuYm9AdHl1dC5lZHUuY24=.
BS: Conceptualization, Data curation, Formal Analysis, Funding acquisition, Investigation, Methodology, Project administration, Resources, Software, Supervision, Validation, Visualization, Writing–original draft, Writing–review and editing. YL: Writing–review and editing. ZG: Writing–review and editing. MZ: Writing–review and editing, Funding acquisition.
The author(s) declare that financial support was received for the research, authorship, and/or publication of this article. National Key Research and Development Program of China (2023YFF0715700); Natural Science Foundation of China (U23A20375).
The authors declare that the research was conducted in the absence of any commercial or financial relationships that could be construed as a potential conflict of interest.
The author(s) declare that no Generative AI was used in the creation of this manuscript.
All claims expressed in this article are solely those of the authors and do not necessarily represent those of their affiliated organizations, or those of the publisher, the editors and the reviewers. Any product that may be evaluated in this article, or claim that may be made by its manufacturer, is not guaranteed or endorsed by the publisher.
1. Medina C, Ríos MAC, González G. Transmission grids to foster high penetration of large-scale variable renewable energy sources–A review of challenges, problems, and solutions. Int J Renew Energ Res (Ijrer) (2022) 12(1):146–69. doi:10.20508/ijrer.v12i1.12738.g8400
2. Hassan Q, Hsu C-Y, Mounich K, Algburi S, Jaszczur M, Telba AA, et al. Enhancing smart grid integrated renewable distributed generation capacities: implications for sustainable energy transformation. Sustainable Energ Tech Assessments (2024) 66:103793. doi:10.1016/j.seta.2024.103793
3. Yang X, Chen B, He Y, Zhu C, Zhou X, Liang Y, et al. Ppb-level SO2 photoacoustic sensor for SF6 decomposition analysis utilizing a high-power UV laser with a power normalization method. Sensors (2024) 24(24):7911. doi:10.3390/s24247911
4. Jong EC, Macek PV, Perera IE, Luxbacher KD, McNair HM. An ultra-trace analysis technique for SF6 using gas chromatography with negative ion chemical ionization mass spectrometry. J Chromatogr Sci (2015) 53(6):854–9. doi:10.1093/chromsci/bmu154
5. Yin X, Dong L, Wu H, Gao M, Zhang L, Zhang X, et al. Compact QEPAS humidity sensor in SF6 buffer gas for high-voltage gas power systems. Photoacoustics (2022) 25:100319. doi:10.1016/j.pacs.2021.100319
6. Williams SRO, Moate PJ, Hannah MC, Ribaux BE, Wales WJ, Eckard RJ. Background matters with the SF6 tracer method for estimating enteric methane emissions from dairy cows: a critical evaluation of the SF6 procedure. Anim Feed Sci Technol (2011) 170(3-4):265–76. doi:10.1016/j.anifeedsci.2011.08.013
7. Dervos CT, Vassiliou P. Sulfur hexafluoride (SF6): global environmental effects and toxic byproduct formation. J Air & Waste Manage Assoc (2000) 50(1):137–41. doi:10.1080/10473289.2000.10463996
8. Rhrissi I, Bouhmouche A, Arba Y, Moubah R. AlC3 monolayer: highly responsive and selective gas sensing material for SF6 decomposed gases (SOF2, SO2F2 and SO2). Colloids Surf A: Physicochemical Eng Aspects (2024) 700:134724. doi:10.1016/j.colsurfa.2024.134724
9. Mahdi AS, Abdul-Malek Z, Arshad RN. SF6 decomposed component analysis for partial discharge diagnosis in GIS: a review. IEEE Access (2022) 10:27270–88. doi:10.1109/access.2022.3156926
10. Chen B, Li H, Zhao X, Gao M, Cheng K, Shao X, et al. Trace photoacoustic SO2 gas sensor in SF6 utilizing a 266 nm UV laser and an acousto-optic power stabilizer. Opt Express (2023) 31(4):6974–81. doi:10.1364/oe.483240
11. Kóréh O, Rikker T, Molnár G, Mahara BM, Torkos K, Borossay J. Study of decomposition of sulphur hexafluoride by gas chromatography/mass spectrometry. Rapid Commun Mass Spectrom (1997) 11(15):1643–8. doi:10.1002/(sici)1097-0231(19971015)11:15<1643::aid-rcm14>3.3.co;2-3
12. Liu C-H, Palanisamy S, Chen S-M, Wu P-S, Yao L, Lou B-S. Mechanism of formation of SF6 decomposition gas products and its identification by GC-MS and electrochemical methods: a mini review. Int J Electrochem Sci (2015) 10(5):4223–31. doi:10.1016/s1452-3981(23)06617-8
13. Thirumalraj B, Palanisamy S, Chen S-M, Wu P-S, Yao L, Lou B-S. Electrochemical sensing of SF6 decomposition products based on a screen printed carbon electrode. Int J Electrochem Sci (2015) 10(4):3098–105. doi:10.1016/s1452-3981(23)06522-7
14. Dong M, Zhang C, Ren M, Albarracín R, Ye R. Electrochemical and infrared absorption spectroscopy detection of SF6 decomposition products. Sensors (2017) 17(11):2627. doi:10.3390/s17112627
15. Suehiro J, Zhou G, Hara M. Detection of partial discharge in SF6 gas using a carbon nanotube-based gas sensor. Sensors Actuators B: Chem (2005) 105(2):164–9. doi:10.1016/j.snb.2004.05.050
16. Zhang X, Zhang Y, Tang J, Cui Z, Li Y, Zhou H, et al. Optical technology for detecting the decomposition products of SF6: a review. Opt Eng (2018) 57(11):110901. doi:10.1117/1.oe.57.11.110901
17. Luo ZC, Han FY, Tang B, Zhang LF, Liu CY, Liang QQ, et al. Optical properties and decomposition mechanisms of SF6 at different partial discharge determined by infrared spectroscopy. AIP Adv (2018) 8(6):065107. doi:10.1063/1.5030524
18. Zhang X, Yan J, Zhang Y, Cheng L, Bian C, Chen X. Infrared spectrum analysis and quantitative detection of SF6 characteristic decomposition components SO2F2 and SOF2. IEEE Trans Dielectrics Electr Insul (2022) 29(4):1316–23. doi:10.1109/tdei.2022.3183654
19. Liu C, Wang G, Zhang C, Patimisco P, Cui R, Feng C, et al. End-to-end methane gas detection algorithm based on transformer and multi-layer perceptron. Opt Express (2024) 32(1):987. doi:10.1364/oe.511813
20. Yin X, Wu H, Dong L, Li B, Ma W, Zhang L, et al. Ppb-level SO2 photoacoustic sensors with a suppressed absorption–desorption effect by using a 7.41 μm external-cavity quantum cascade laser. ACS Sensors (2020) 5(2):549–56. doi:10.1021/acssensors.9b02448
21. Li B, Wu H, Feng C, Wang J, Jia S, Zheng P, et al. Photoacoustic heterodyne CO sensor for rapid detection of CO impurities in hydrogen. Anal Chem (2023) 96(1):547–53. doi:10.1021/acs.analchem.3c04753
22. Yin X, Gao M, Miao R, Zhang L, Zhang X, Liu L, et al. Near-infrared laser photoacoustic gas sensor for simultaneous detection of CO and H2S. Opt Express (2021) 29(21):34258–68. doi:10.1364/oe.441698
23. Li B, Feng C, Wu H, Jia S, Dong L. Photoacoustic heterodyne breath sensor for real-time measurement of human exhaled carbon monoxide. Photoacoustics (2022) 27:100388. doi:10.1016/j.pacs.2022.100388
24. Liu X, Cui J, Feng C, Tian Q, Cui R, Zhao Y, et al. Differential photoacoustic cell-based Fourier transform photoacoustic spectroscopy for background-free gas detection [Invited]. Chin Opt Lett (2024) 22(10):101203. doi:10.3788/col202422.101203
25. Wei Q, Li B, Zhao B, Yang P, Dong L. Photoacoustic spectroscopy for fault diagnostics in high voltage power transmission systems: a review. Measurement (2024) 227:114259. doi:10.1016/j.measurement.2024.114259
26. Kosterev AA, Bakhirkin YA, Curl RF, Tittel FK. Quartz-enhanced photoacoustic spectroscopy. Opt Lett (2002) 27(21):1902–4. doi:10.1364/ol.27.001902
27. Kinjalk K, Paciolla F, Sun B, Zifarelli A, Menduni G, Giglio M, et al. Highly selective and sensitive detection of volatile organic compounds using long wavelength InAs-based quantum cascade lasers through quartz-enhanced photoacoustic spectroscopy. Appl Phys Rev (2024) 11:021427. doi:10.1063/5.0189501
28. Li B, Feng C, Wu H, Jia S, Dong L. Calibration-free mid-infrared exhaled breath sensor based on BF-QEPAS for real-time ammonia measurements at ppb level. Sensors Actuators B: Chem (2022) 358:131510. doi:10.1016/j.snb.2022.131510
29. Wang J, Wu H, Sampaolo A, Patimisco P, Spagnolo V, Jia S, et al. Quartz-enhanced multiheterodyne resonant photoacoustic spectroscopy. Light: Sci & Appl (2024) 13:77. doi:10.1038/s41377-024-01425-1
30. Wu H, Dong L, Zheng H, Yu Y, Ma W, Zhang L, et al. Beat frequency quartz-enhanced photoacoustic spectroscopy for fast and calibration-free continuous trace-gas monitoring. Nat Commun (2017) 8(1):15331. doi:10.1038/ncomms15331
31. Dong L, Kosterev AA, Thomazy D, Tittel FK. QEPAS spectrophones: design, optimization, and performance. Appl Phys B (2010) 100:627–35. doi:10.1007/s00340-010-4072-0
32. Wu G, Xing J, Gong Z, Ma J, Fan Y, Wu X, et al. Single fiber-type double cavity enhanced photoacoustic spectroscopy sensor for trace methane sensing. J Lightwave Technol (2024) 42(11):3393–8. doi:10.1109/jlt.2024.3353200
33. Wu H, Dong L, Yin X, Sampaolo A, Patimisco P, Ma W, et al. Atmospheric CH4 measurement near a landfill using an ICL-based QEPAS sensor with VT relaxation self-calibration. Sensors Actuators B: Chem (2019) 297:126753. doi:10.1016/j.snb.2019.126753
34. Pan Y, Lu P, Cheng L, Li Z, Liu D, Zhao J, et al. Open-closed single-tube on-beam tuning-fork-enhanced fiber-optic photoacoustic spectroscopy. Photoacoustics (2024) 39:100639. doi:10.1016/j.pacs.2024.100639
35. Pan Y, Fu L, Zhang J, Lu P, Liu D, Zhao J, et al. Miniaturized and highly-sensitive fiber-optic photoacoustic gas sensor based on an integrated tuning fork by mechanical processing with dual-prong differential measurement. Photoacoustics (2023) 34:100573. doi:10.1016/j.pacs.2023.100573
36. Sun B, Zifarelli A, Wu H, Dello Russo S, Li S, Patimisco P, et al. Mid-infrared quartz-enhanced photoacoustic sensor for ppb-level CO detection in a SF6 gas environment exploiting a T-grooved quartz tuning fork. Anal Chem (2020) 92(20):13922–9. doi:10.1021/acs.analchem.0c02772
37. Sun B, Patimisco P, Sampaolo A, Zifarelli A, Spagnolo V, Wu H, et al. Light-induced thermoelastic sensor for ppb-level H2S detection in a SF6 gas matrices exploiting a mini-multi-pass cell and quartz tuning fork photodetector. Photoacoustics (2023) 33:100553. doi:10.1016/j.pacs.2023.100553
38. Patimisco P, Sampaolo A, Dong L, Giglio M, Scamarcio G, Tittel FK, et al. Analysis of the electro-elastic properties of custom quartz tuning forks for optoacoustic gas sensing. Sensors Actuators B: Chem (2016) 227:539–46. doi:10.1016/j.snb.2015.12.096
39. Patimisco P, Borri S, Sampaolo A, Beere HE, Ritchie DA, Vitiello MS, et al. A quartz enhanced photo-acoustic gas sensor based on a custom tuning fork and a terahertz quantum cascade laser. Analyst (2014) 139(9):2079–87. doi:10.1039/c3an01219k
Keywords: QEPAS, SF6 decompositions, quartz tuning fork, trace gas detection, micro-resonator
Citation: Sun B, Li Y, Gao Z and Zhang M (2025) Quartz-enhanced photoacoustic spectroscopy for SF6 gas matrix based on a T-shaped quartz tuning fork. Front. Phys. 13:1569734. doi: 10.3389/fphy.2025.1569734
Received: 01 February 2025; Accepted: 20 February 2025;
Published: 12 March 2025.
Edited by:
Kaijie Xu, University of Alberta, CanadaReviewed by:
Fang Song, Jilin University, ChinaCopyright © 2025 Sun, Li, Gao and Zhang. This is an open-access article distributed under the terms of the Creative Commons Attribution License (CC BY). The use, distribution or reproduction in other forums is permitted, provided the original author(s) and the copyright owner(s) are credited and that the original publication in this journal is cited, in accordance with accepted academic practice. No use, distribution or reproduction is permitted which does not comply with these terms.
*Correspondence: Bo Sun, c3VuYm9AdHl1dC5lZHUuY24=
Disclaimer: All claims expressed in this article are solely those of the authors and do not necessarily represent those of their affiliated organizations, or those of the publisher, the editors and the reviewers. Any product that may be evaluated in this article or claim that may be made by its manufacturer is not guaranteed or endorsed by the publisher.
Research integrity at Frontiers
Learn more about the work of our research integrity team to safeguard the quality of each article we publish.