 Yuyin Ma1
 Chao Wang
95% of researchers rate our articles as excellent or good
Learn more about the work of our research integrity team to safeguard the quality of each article we publish.
Find out more
ORIGINAL RESEARCH article
Front. Phys. , 19 March 2025
Sec. Social Physics
Volume 13 - 2025 | https://doi.org/10.3389/fphy.2025.1562015
This article is part of the Research Topic Finance and Production Complex Systems View all 10 articles
Introduction: With the continuous development of the global securities market, share pledges as a business form are gradually emerging. However, there are also certain risks associated with share pledges. There are many common pledges between different share pledgers, which may result in financial contagion.
Methods: This paper constructs a common share pledge network and proposes an identification method of systemically important listed companies by analyzing the characteristics of its network structure, to improve the stability of the financial market.
Results: The results show that the share pledges are concentrated in a certain number of large companies, exhibiting scale-free characteristics and multiple local community features. The supervision of share pledges will promote the formation of such characteristics. Although financial supervision reduces the probability of share pledge risks, it also improves the importance of companies with high centrality in the share pledge market.
Discussion: Compared with the traditional network characteristics the centrality of the common share pledge network will provide more information about the share pledge risk. Different characteristics of network centrality can effectively identify systemically important companies, which has important regulatory value for financial risk prevention.
Share pledge refers to an act of shareholders using their own equity holdings as collateral to finance funds from financial institutions such as securities companies or banks [1]. Share pledges not only provide an important way for shareholders to raise funds but are also seen as a loan-like business model offered by banks and securities companies, which has resulted in significant earnings growth for financial institutions [2]. In recent years, the business model of share pledging in emerging markets has seen unprecedented growth. In developed capital markets, share pledges are rare due to the relatively decentralized distribution of equity. In contrast, listed companies in emerging markets tend to exhibit a more concentrated shareholding structure, which leads to greater financing challenges for companies. Therefore, share pledges have become more prevalent in emerging markets. Due to the risk factors associated with this financing method, the possibility of contagion risk has also increased.
Empirical evidence most share pledges hurt stock prices [3]. When a company discloses a share pledge, it usually conveys negative information to the market about its poor operation and financing difficulties, which may lead to a drop in the stock price. To mitigate these negative effects, the probability of capitalization following a share pledge by a major shareholder also increases [4]. Although this may help stabilize the stock price in the short term, it does not really improve the long-term business performance of the company and is even likely to give rise to speculative behaviors such as market value management [5, 6]. With high pledge ratios, large shareholders will be more inclined to pursue high-risk investment projects to earn more returns [7], which not only pose a financial risk but also involve moral hazard. Due to information asymmetry, shareholders also have incentives to manipulate stock prices. This moral hazard may lead to a crash in stock prices. If the stock price falls sharply, the pledgee may ask major shareholders to buy back the equity in advance, thus increasing the risk of control power transfer [8–10].
The share pledge business is a common yet high-risk financing approach. To effectively manage the risk of default due to stock price volatility, the pledger usually sets multiple risk control mechanisms such as pledge rate, warning line, and liquidation threshold. If the pledging ratio of major shareholders on the exchange market is higher, the mark-to-market and mandatory liquidation mechanisms are more likely to be activated during stock price declines. It will exacerbate the leverage effect and lead to a much higher stock price crash risk [1]. It is relatively common for pledged shares in emerging markets to hit liquidation thresholds, which has attracted extensive regulatory attention [11]. When the stock market encounters continuous downturn pressure, if the pledger fails to fill the account, or the stock price falls below the preset liquidation thresholds, banks and other financial institutions may take measures to mitigate the potential loss by “forced liquidation” for the sake of risk control and asset preservation [12]. Due to the common share pledge network, a crisis at an institution has the potential to spread to other institutions. If an institution suffers forced liquidation, its equity value will decrease, thereby affecting other institutions holding shares in that institution. To minimize losses, these institutions may choose to sell the shares at low prices [13]. According to signaling theory, such selling behavior may trigger a chain reaction in the market, further exacerbating the decline in corporate performance and elevating credit risk and default risk. The more connected institutions are in the share pledge network, the faster this risk contagion occurs [1].
For this risk contagion process, complex networks and network dynamics provide a useful tool for the study [14–19]. Tong et al. (2021) constructed a network model of major shareholders of listed companies and found that the degree of common shared shareholders accelerates the risk in the stock market [20]. In addition, the impact of common shareholders consisting of financial institutions is more pronounced. Greenwood et al. (2015) explored how systemic risk is triggered by selling investments based on the common investment network in the face of negative shocks [21]. These studies not only explore the risk contagion mechanism in financial markets but also provide assistance in the formulation of risk management and regulatory policies.
In summary, it is important to study the impact of contagion risk on companies due to share pledges. Network relationships in share pledges provide an effective way to study contagion risk between companies. Therefore, this paper portrays the common network relationship between listed companies with share pledges to study the risk contagion process. It further identifies the systemic importance of listed companies based on topological characteristics of the common share pledge network. This study not only helps to reveal the risk of share pledges but also identifies systemically important companies. In addition, this study provides a new perspective for regulatory policies and intervention strategies to maintain the stability of the capital market.
Share pledge defaults involve a large number of stakeholders with intricate relationships with each other. The existence of a common share pledge relationship can contribute to a stock price collapse when shares pledges are sold by the pledgee. The basis for portraying common share pledge relationships among listed companies is a bipartite network between listed companies and institutional investors.
The bipartite network contains two types of nodes and connections between nodes. It can be expressed as
Based on the share pledge bipartite network, the traditional network model is further used to portray a common share pledge network between different companies [22]. The common share pledge network is constructed as follows: taking all the companies pledging shares as nodes, if there exists at least one common pledgee in any company, they are defined to have a common share pledge relationship, i.e., there exists a network connecting edge. The common share pledge network can be represented by
The main topological characteristics of networks include the connectivity of the nodes and the distribution of connections. The connectivity of the common share pledge network contains network density, average degree, clustering coefficient, average shortest path, and modularity.
Network density reflects the tightness of connections between nodes in a network. It is defined as the ratio of the number of actually existing edges to the number of all possible edges. The network density is calculated by
where L is the number of edges actually present in the network.
The average path length is the average of all of the distances over all pairs of nodes in a network, which reflects the overall connectivity of the network. It also measures the efficiency with which information travels through the network because the efficiency in a network is also defined by distances [23, 24]. The average path length is calculated by
The clustering coefficient measures the degree of interconnection between neighboring nodes in a network, reflecting local connectivity and the “clique” phenomenon. The clustering coefficient is one of the local characteristics for networks that are based at the node level, it can be calculated by
Modularity is a measure of quality that a network is partitioned into modules (or communities). It reflects the extent to which nodes in the network are classified into modules with tight internal connections but sparse connections to other modules. Modularity is calculated by
where mi and mk denote the modules to which node i and node k belong, and I is an indicative function that is 1 when node i and node k belong to the same module and 0 otherwise. The algorithm and resolution of modularity are referred to Blondel et al. (2008) and Lambiotte et al. (2008) respectively [25, 26].
In addition, network centrality is often used to identify the important nodes in the network, which is a basis for identifying systemically important companies in common share pledge networks [27]. Network centrality is classified as degree centrality, closeness centrality, betweenness centrality, and eigenvector centrality. Degree centrality and network density portray similar network characteristics. The same as closeness centrality and average path length. Therefore, only other centrality metrics are considered.
Betweenness centrality measures the degree to which a node mediates the connection relationship between any two other nodes in the network. It is defined as
where
Eigenvector centrality evaluates the centrality of a node in the network based on the importance of its neighbors. It mainly considers the importance of vertices as passing bridges in the graph, rather than a centrality measure that only considers the direct importance of vertices. It is defined as
where
The systemic risk of the share pledge market is portrayed by the dynamic network analysis. Based on the common share pledge network, the risk contagion process is simulated by the system dynamics method. Assume that the company i with a common share pledge relationship suffers a crisis. Its market value is defined as 0 to simplify the simulation. Then the financial institution s holding the share pledge of the company i will liquidate these assets. Moreover, the financial institution s may also sell its other pledged shares in exchange for liquidity due to risk aversion. Given that the company j has a share pledge relationship with the financial institution s, then it will also suffer contagion risks due to the stock price drops caused by the selling of pledged shares. Based on the market depth of the stock, we define that the proportion of sold share pledges to the total market value of the company j is equal to the proportion of its stock price decline. Therefore, if the pledged shares of the company i are sold by all of its pledgees, the stock price of the company j may experience a notable decline. Moreover, if the company j has a share pledge relationship with other financial institutions at the same time, the contagion risk will further spread to other financial institutions. However, financial institutions will set a liquidation threshold for the pledged shares to prevent the stock price from falling and causing losses. We define that the liquidation threshold is 130%, which is the common standard in the Chinese stock market. It means the proportion of the share pledge losses when approaching the liquidation threshold is
The individual risks of listed companies are portrayed by the default distance. The default probability model is used to estimate the individual default risk of listed companies [28]. It is calculated as
where ddit denotes the default distance of company i at moment t; Eit denotes the total market capitalization of the company that is calculated by the product of the total number of shares issued and the market price; Dit denotes the face value of the company’s debt that obtained by adding half of the company’s long-term liabilities to its short-term liabilities; rit-1 denotes the company’s annual log stock return;
We include the five percentage points in this term to represent term structure volatility, and we include the 25% times equity volatility to allow for volatility associated with default risk according to Bharath and Shumway (2008) [28]. Combining Equations 7, 8 we can calculate the company’s default distance ddit. On this basis, the company’s default probability
China is one of the emerging markets that require mandatory disclosure of stock pledges which provides appropriate data on share pledges [29]. Therefore, this study takes the annual data of share pledges of all listed companies in China’s A-shares as a sample. The sample interval is chosen as 2008 to 2024. The sample includes a total of 3,312 listed companies, all of which have engaged in new share pledge business within the sample interval. According to the statistics of share pledge data, the average share pledge term is about 1.39 years, so the time window is set to 1 year. Data on share pledges are obtained from the CSMAR database. To highlight the role of financial institutions in the risk contagion process, it constructs the common share pledging network by excluding the relationship in which an individual investor serves as the pledgee and the network relationship formed with institutional investors such as banks and securities companies as pledgees are considered.
The common share pledge network is uniquely determined by the node and the edge. Therefore, the characterization of nodes and edges is the key to revealing the relationship of the common share pledge network. This study mainly explores the following systemic characteristics of the common share pledge network: density, average degree, clustering coefficient, average shortest path, and modularity, which are calculated by Equations 1-6 respectively. These economic implications are mainly divided into two categories, which describe the node characteristics of the network (e.g., clustering coefficient, modularity) and edge characteristics (e.g., average degree, average shortest path). The network characteristics were calculated by Gephi 0.10.1. When calculating these characteristics, the unconnected nodes were excluded because they have no contribution to the contagion process of the share pledge risk.
Figure 1 shows the statistical results of the number of share pledges of all listed companies in China’s A-shares from 2008 to 2024. The share pledges in China’s stock market have gradually become prevalent since 2008, especially after the opening of exchange-based share pledges in 2013. Because the market had no unified standards for the limit of the pledge rate, the number of share pledges increased dramatically. After the share pledge crisis broke out in 2018, the financial regulatory authorities issued policies to restrict pledgees from forcibly liquidating share pledges. Meanwhile, with the regulator’s requirement in 2018 that the cap on the pledge ratio of listed companies’ shares should not exceed 60%, the financing way of share pledges began to contract sharply. The number of share pledges has gradually and steadily declined. Due to the impact of COVID-19 on the global economy and society from 2019, the number of share pledges has continued to shrink and it is still at a low level at present.
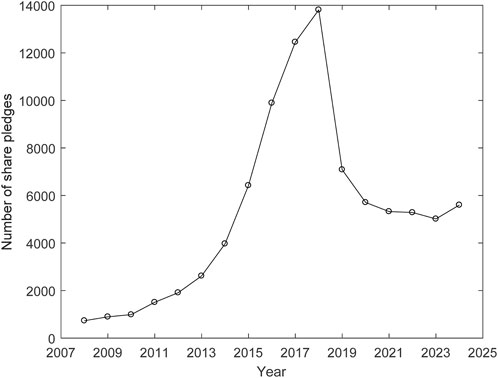
Figure 1. Number of share pledges.
The analysis of topological characteristics of the common share pledge network helps to explore the trends of China’s share pledge market. The number of connected edges of the network is the most direct characteristic, which is mainly portrayed by the density and degree distribution of the network. Network density in Figure 2 mainly measures the degree of connectivity of the entire network. Notably, the network density and degree distribution are calculated without considering isolated nodes. The isolated node lacks a channel for contagion risks, so it is not helpful for risk identification. In terms of common share pledge relationships, Figure 2 shows apparent phased characteristics. The network density was relatively stable from 2008 to 2012. After the opening of exchange-based share pledges in 2013, the network density showed a substantial increase and remained at a high level from 2013 to 2017. It implies that as the number of share pledges increases, the pledgees are gradually concentrating on some large financial institutions (as shown in Section 3.3). The phased density has shown a substantial decline as a result of strengthening regulations following the outbreak of the share pledge crisis in 2018. However, unlike the downward trend of the number of share pledges in Figure 1, the density of the common share pledge network continues to rise and exceed the historical peak after COVID-19 in 2019. Due to the high-risk property of share pledges, most financial institutions gave up share pledges as an investment strategy after the elimination of COVID-19. Therefore, the current share pledge is mainly concentrated in some large financial institutions. This is an inevitable trend in market development, but it also increases the concentration risk of share pledges, which provides a warning for future regulation.
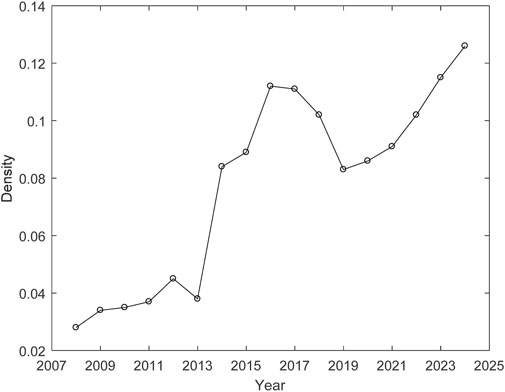
Figure 2. Density of the common share pledge network.
The average degree of the network in Figure 3 mainly portrays the average number of participants in common share pledges per listed company. Due to the limited number of pledgees, more pledgers will inevitably choose the same pledgees when share pledges become more prevalent. It will lead to an increase in the number of common share pledges in the market. Figure 3 shows that the listed company in China’s stock markets has the highest common share pledge relationship with nearly 200 other listed companies. It means that the common share pledge in China’s stock market is widely prevalence. In addition, Figure 3 shows a trend consistent with Figure 1 i.e., common share pledges were prevalent with the regulation liberalization in 2013–2017 and seriously controlled after the tightening of financial regulations in 2018. Although the average degree is stably around 100, it is still at a high level, so the supervision of the common share pledge still needs to be strengthened.
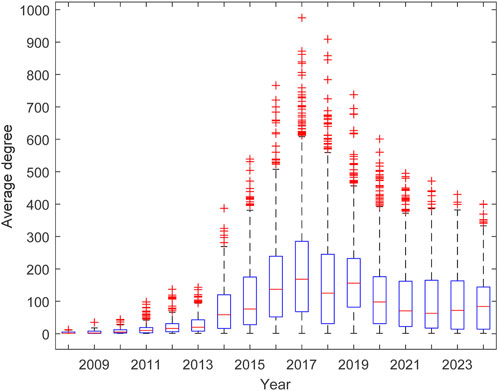
Figure 3. Average degree of the common share pledge network.
We further analyze the characteristics of the common share pledge network in terms of average path length, clustering coefficients, and community structure. All of them portray the degree of local associations in the network. The results are shown in Figures 4–6. The trends in average path length, clustering coefficients, and modularity are generally similar which are opposite to the trends in the connectivity of the network. Overall, the average path lengths, clustering coefficients, and modularity of the network show a downward trend over the 2013–2017 period, while they all increase after the strengthening of financial regulation since 2018. However, they have fallen back after the COVID-19.
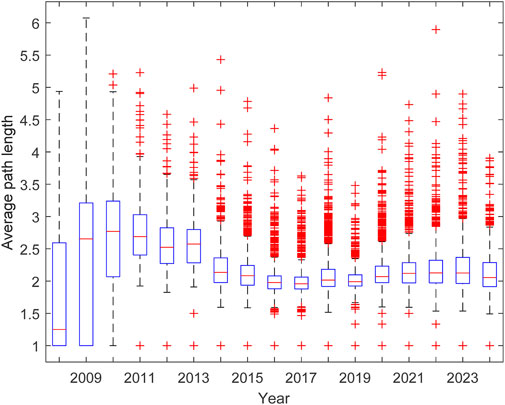
Figure 4. Average path length of the common share pledge network.
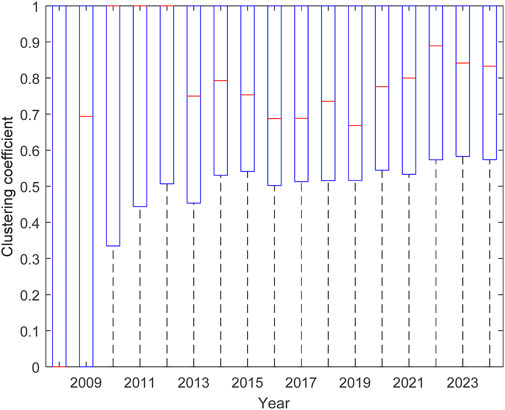
Figure 5. Clustering coefficient for the common share pledge network.
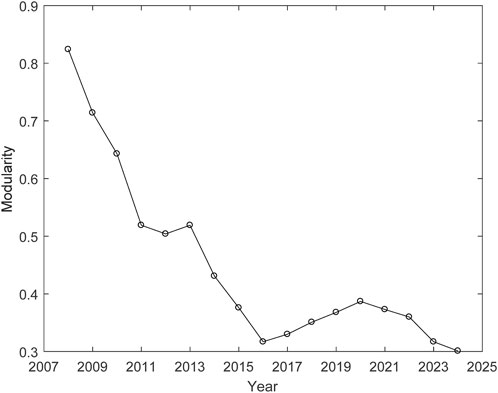
Figure 6. Modularity of the common share pledge network.
The average path length portrays the accessibility between nodes. The longer the average path the more distant the network relationship between two nodes. As the number of share pledges increases, the likelihood that companies have a common share pledge relationship with each other is promoted, which greatly reduces the distance between different companies. Therefore, the average path length shows an opposite trend to the average degree of the common share pledge network. The clustering coefficient portrays the degree of agglomeration between different nodes. Although the average degree of the common share pledge network increased between 2013 and 2017, the trend of the clustering coefficient decreased in Figure 5. However, the average degree of the common share pledge network decreased from 2018 to 2024, while its clustering coefficient increased instead. This indicates that participants are widely active during the booming period of the share pledge market, while only some large financial institutions are active in the face of financial recession. The characteristics of the modularity of the common share pledge network in Figure 6 further validate this conclusion. Modularity mainly characterizes the quality of community structure division in a network, with higher modularity indicating stronger community structure. If a company in the community suffers a crisis, its share pledges held by the financial institution will be liquidated. In this case, other companies in the community will also be impacted. Therefore, the modularity provides channels for risk contagion and helps to identify key nodes in the community. In summary, there are some differences in the topological characteristics among different nodes in the common share pledge network. These differences provide risk information for identifying systemically important companies.
The topological structure of the common share pledge network helps to mine the risk information of listed companies, and then identify systemically important companies. The predictive capacity of network characteristics is further validated by the dynamic contagion risk of the share pledge market in Figure 7. Figure 7 presents that the potential contagion risk gradually increased with the increasing number of share pledges from 2008 to 2012. Especially after the liberalization of on-exchange share pledges in 2013, the contagion risk in the share pledge market continued to rise and remained at a high level. Due to the supervision of the share pledge market in 2018 and the following shock of COVID-19, the number of share pledges dropped dramatically. As a result, the contagion risk of share pledges has been controlled. However, with the end of COVID-19, the contagion risk has rebounded in recent years. The dynamic contagion risk is closely related to the density of the common share pledge network, indicating that the common share pledge network provides a channel for the contagion risk. Therefore, the topological characteristics implied by the common share pledge network are helpful for the risk identification of listed companies. Moreover, the highest proportion of contagion risk accounts for about 80%–90% of the share pledges, indicating that not all nodes will suffer contagion risks. This is mainly because some nodes with low modularity or high average paths are almost independent, resulting in an extremely long channel of risk contagion.
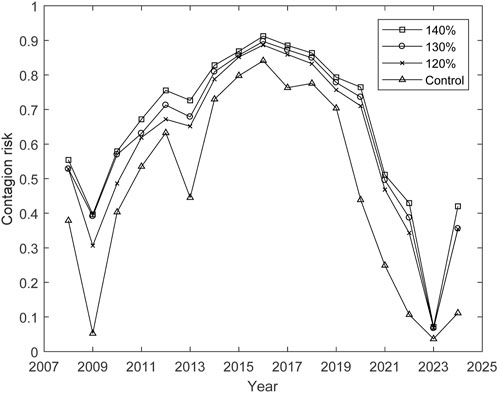
Figure 7. Contagion risk of the common share pledge network.
Figure 7 also presents the simulation results of contagion risk at the 120% and 140% liquidation thresholds to enhance the robustness. They show the same trend as the baseline case (130% liquidation threshold), and the level of contagion risks are very close. It means the results of contagion risks are robust. The robustness analysis in Figure 7 also indicates that a higher liquidation threshold is more likely to trigger fire sales of the share pledges. Therefore, the Chinese stock market has set a 20% higher warning line before the liquidation threshold to indicate the share pledge risk and reduce concentrated fire sales. In addition, this study further explores the impact of reducing the share pledge ratio on contagion risks to discuss the risk control strategies. The result is labeled as “Control” in Figure 7, which assumes that the share pledge ratio is 80% of the original level. A similar result indicates that the model is effective. Moreover, reducing the share pledge ratio is more effective in controlling contagion risks when compared to the results of different liquidation thresholds, which highlights that strengthening supervision contributes to financial stability.
Further analyzing the individual topological characteristics of the common share pledge network, which are portrayed in terms of degree, clustering coefficient, and average path length. In addition, eigenvector centrality and authority centrality are also the metrics to portray the individual network structure.
To capture the stock of unresolved share pledges, this study analyzes the individual topological characteristics of the common share pledge network using accumulated share pledge data from 2008 to 2024. Figure 8 visualizes the network, where the nodes represent the listed companies in China’s stock markets, and their colors indicate the number of common share pledge relationships that exist in the company. The connections indicate the existence of a common share pledge relationship between companies, and their thickness indicates the number of common pledgees between any two companies. Figure 8 shows that most of the listed companies have few common pledgees in their share pledge relationships, and many companies have dense common pledgees, thus forming a network characterized by multiple “core-periphery” distributions. This conclusion is also emphasized by the individual degree distribution with “leptokurtosis and heavy tails” presented in Figure 9A. Figure 9B further presents the individual degree distribution in double logarithmic axes. Although the individual degree distribution of the network is difficult to fit with a single function, it can be expressed as a power law distribution with an exponential truncation, i.e., it is characterized by a scale-free distribution.
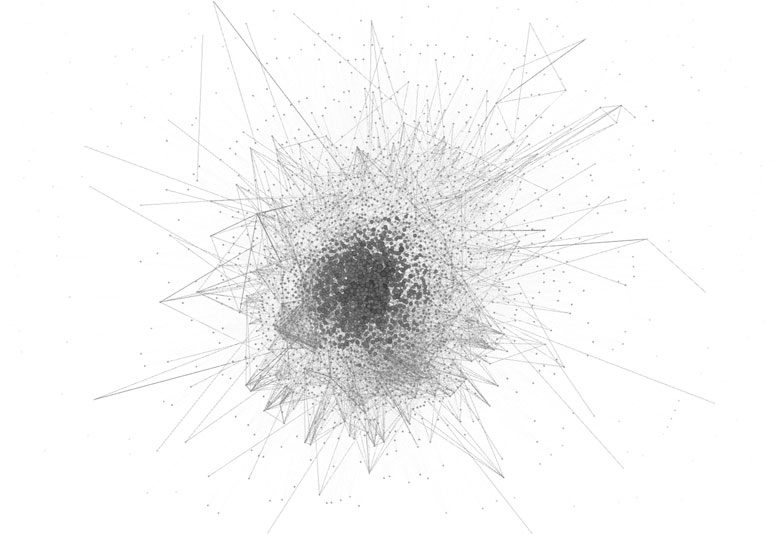
Figure 8. Common share pledge network relationship.
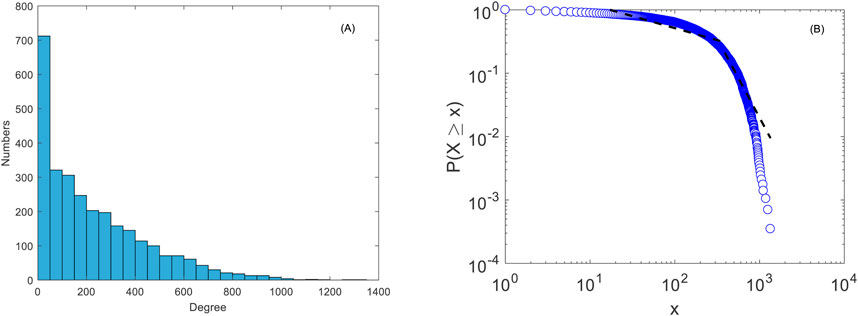
Figure 9. Individual degree distribution of the common share pledge network. (A) Histogram plots; (B) Logarithm plots.
The individual statistics of clustering coefficients and average path lengths are shown in Figures 10, 11. They show that the clustering coefficients and average path lengths of the nodes are generally fitted by normal distributions. The clustering coefficient fits a normal distribution with a mean of 0.5211 and a standard deviation of 0.1644. However, the distribution of clustering coefficients does not exactly conform to the standard normal distribution but rather has the characteristics of a positively skewed distribution. Recall that the clustering coefficients of the common share pledge network in Figure 5 are high, while that formed by the undischarged share pledges in Figure 10 is lower. It means that the cycles of most share pledges are short and the common share pledge relationship is highly concentrated in the short term, thus forming the phased feature of the share pledge relationship.
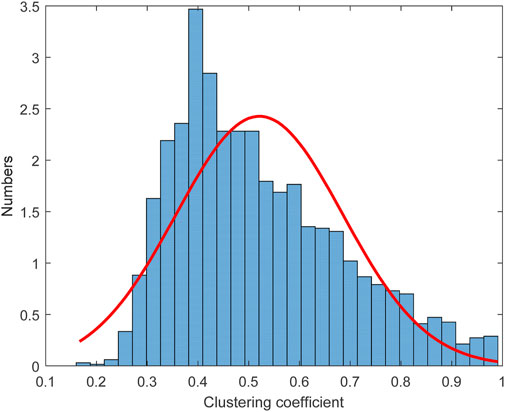
Figure 10. Individual clustering coefficient for the common share pledge network.
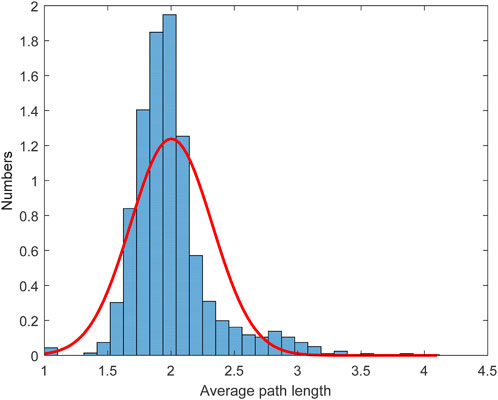
Figure 11. Individual average path length for the common share pledge network.
The average path length is fitted with a normal distribution with a mean of 2.0025 and a standard deviation of 0.3221. The average path length is not exactly in line with the standard normal distribution. It also fits the lognormal distribution with “leptokurtosis and heavy tails,” which indicates that the common share pledges of some listed companies are denser.
The statistical results of centralities are shown in Figures 12, 13. Although different types of centrality distributions have differences, they are similar to moderate centrality in Figure 9 and both show scale-free distributions. It further indicates that some listed companies have dense common share pledges. Therefore, systemically important nodes can be identified based on the density of common share pledges.
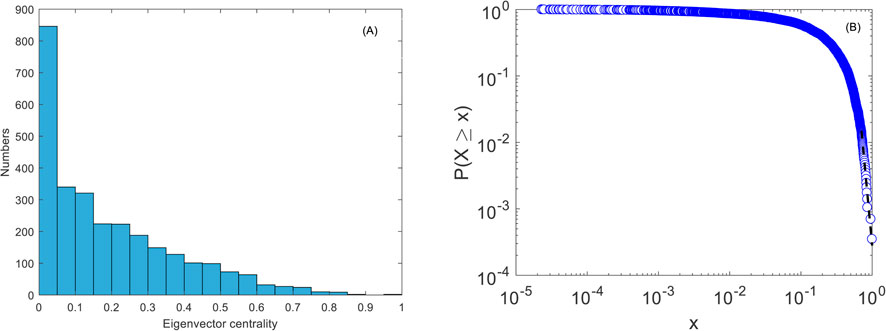
Figure 12. Eigenvector centrality of the common share pledge network. (A) Histogram plots; (B) Logarithm plots.
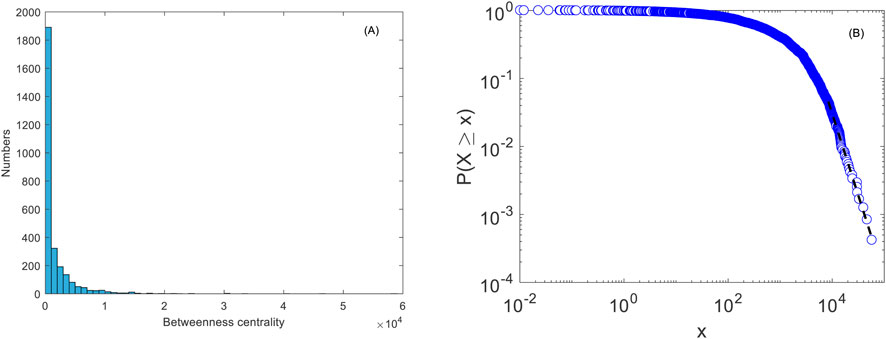
Figure 13. Betweenness centrality of the common share pledge network. (A) Histogram plots; (B) Logarithm plots.
It further mines the risk information of listed companies from the individual topological characteristics of the network and conducts regression analysis for the default probability of individual companies. In addition to the classical clustering coefficient and average shortest path in complex networks, the individual characteristics related to the centrality (i.e., the degree centrality, betweenness centrality, and eigenvector centrality) are considered to identify systemically important listed companies. To eliminate the impact of other explicit factors, control variables are set as follows. The fundamental variables of the company include logarithmic total assets (size) and share concentration (hhi). The financial performance variables include a debt-to-asset ratio (lev) and return on assets (roa). The market performance variables include annual turnover rate (hls) and price-to-book ratio (pb). The companies labeled by ST were excluded from the sample to eliminate the influence of outliers. The missing data were removed from the regression model. In addition, the winsorization is used at the 1% level to test the robustness of regressions.
Table 1 presents a variable correlation matrix to evaluate potential multicollinearity issues of the variables. The result indicates that there is a low correlation between the dependent variables, explanatory variables, and control variables. However, the correlation between centrality variables is high, which is consistent with the fact. Then the Variance Inflation Factor (VIF) values are further calculated. It shows an average VIF value of 1.85, and the VIF values of each variable are all less than 2. Therefore, it is no potential multicollinearity issues among the variables in this model. Table 2 presents statistical descriptions of all variables. It shows that there are differences in the statistical characteristics of different centrality variables, and this is the basis for characterizing the network topology through different centralities.

Table 1. Variable correlations.
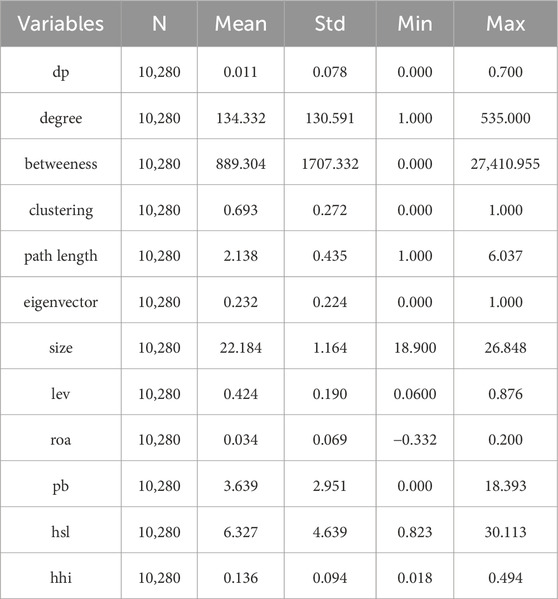
Table 2. Statistical descriptions.
This study analyzes the impact of individual topological characteristics of the network on the default probability of companies using the two-way fixed effects model in the baseline regression. The results of Table 3 help to explore the effectiveness of the common share pledge network in identifying systemically important nodes. The regression coefficients of degree centrality, betweenness centrality, and eigenvector centrality with companies’ default probability are all positively significant at the 1% level, and that of the average path length is negatively significant at the 10% level. Given the fact that the dense common share pledge relationships promote the risk exposure between the pledgor and pledgee, thereby it increases the contagion risk faced by the companies. This indicates that the risk information of companies can be effectively identified through the centrality characteristics of the network. The critical nodes or critical paths identified based on the centrality characteristics provide channels for contagion risk among listed companies and increase the systemic risk that companies face. However, the regression coefficient of the clustering coefficient is negatively significant at the 1% level, which is consistent with the result of Figure 5. It indicates that companies with higher clustering coefficients do not mean higher contagion risks, while centrality characteristics are more able to reflect the contagion risk of the share pledge market compared to traditional network properties. We further use a 1% winsorized sample for regression to test the robustness of the model, and the robust results are presented in Table 4.
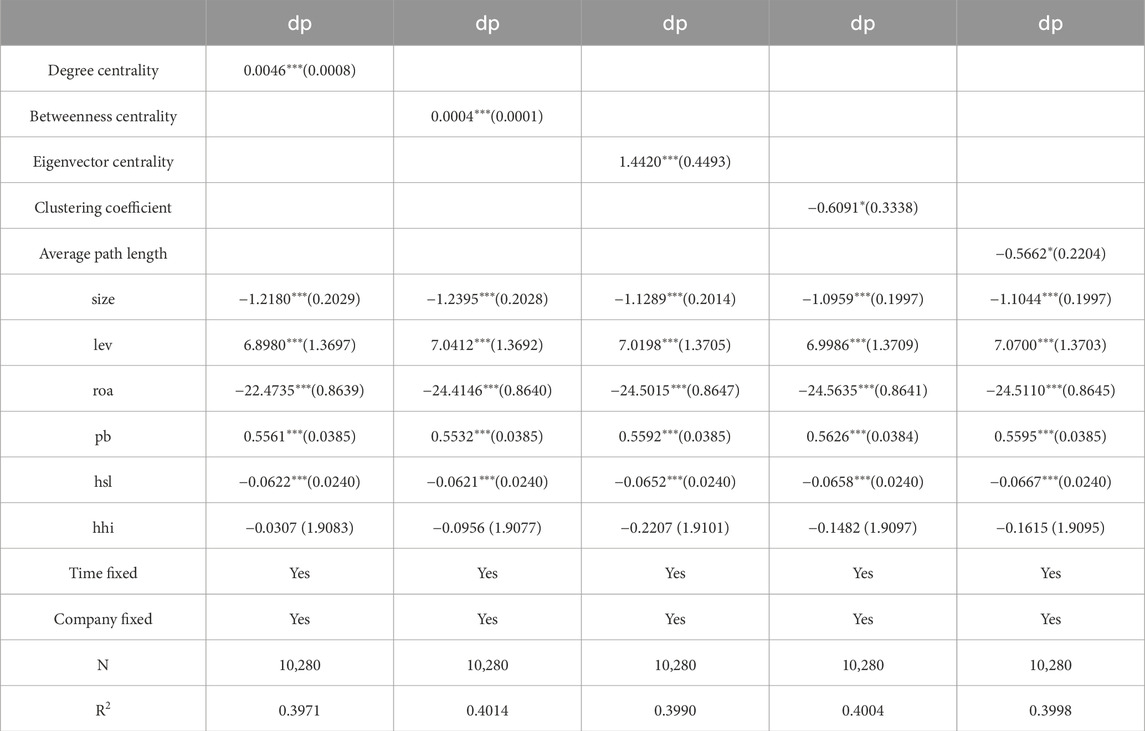
Table 3. Baseline regression for individual topological characteristics and default probability.
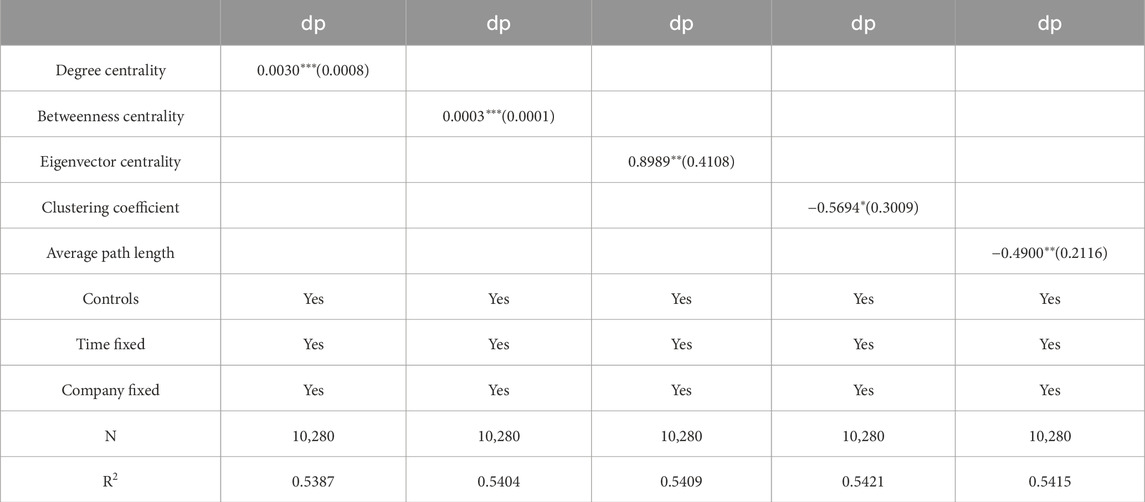
Table 4. Winsorized result for individual topological characteristics and default probability.
As the risk of stocks increases, the space for shareholders to “profit” from the stocks they hold is continuously compressed and gradually disappears, and even greater wealth losses may occur. Therefore, when the stock risk of a company increases, shareholders are more likely to pledge their equity, converting equity with “market value” into highly liquid funds with “usable value” as soon as possible, thereby transferring the risk of wealth loss due to stock price decline and liquidity risk to the pledgees. This process highlights the endogeneity issue of our study. In addition, the calculation of default probability requires the use of stock volatility. Therefore, the lag of the explained variable should be considered in terms of the previous period’s stock volatility. To further address the endogeneity issue of our study, the system Gaussian mixture model (GMM) is further used for regression, and the results are presented in Table 5. The regression coefficients of GMM generally verify the explanatory of centrality characteristics on the share pledge risk. The result highlights the robust conclusion after considering endogeneity issues.
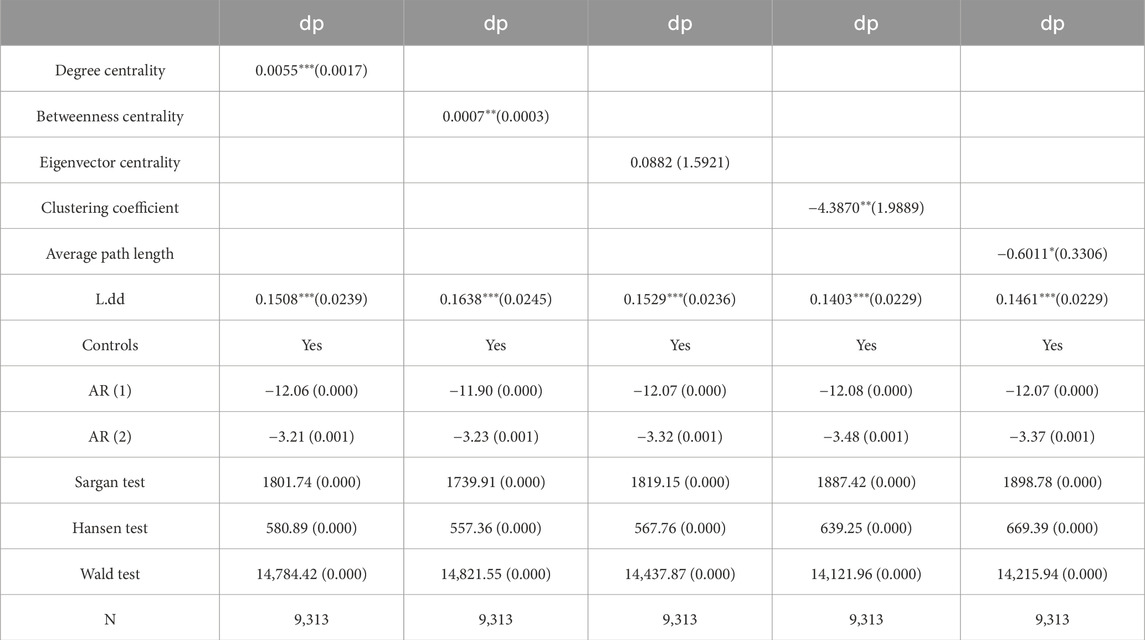
Table 5. GMM regression results for individual topological characteristics and default probability.
According to the analysis, financial regulation has a decisive impact on the share pledge market. To explore how changes in the network density are related to policy adjustments, the policy dummy variable is used for the regression to provide relevant causal analyses. The policy dummy variable is conducted with 2018 as the threshold. The results after adding policy items and their interaction items in the baseline regression are presented in Table 6. The results indicate that the coefficients of regulatory policy are negatively significant with the default risk at the 1% level, suggesting that strengthening supervision of share pledges can effectively mitigate financial risks. The coefficients of interaction terms between regulatory policy and network centrality characteristics are significant at the 5% or 10% level. Moreover, they have the same symbol as network centrality characteristics, indicating that the role of network centrality characteristics in risk identification is more prominent when regulatory policies are strengthened. At this time, the share pledge market is shrinking, and some companies are eliminated by the market, which strengthens the network centrality characteristics of the remaining companies and their position in risk contagion. The policy interaction term of the clustering coefficient is not significant because its ability to identify risks is weak as discussed. This also emphasizes the importance of network centrality characteristics in risk identification.
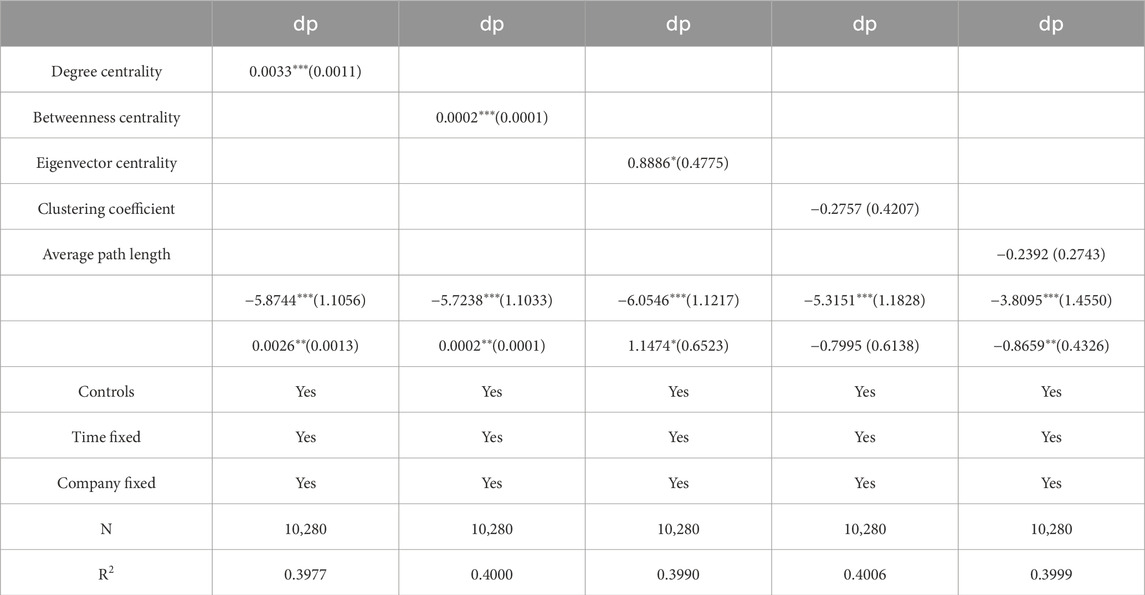
Table 6. Impact of regulatory policy on individual topological characteristics and default probability.
We further incorporate a real-world case to enhance the practical relevance and policy implications of the study. At the end of 2018, the total share pledges of A-share reached ¥ 4.61 trillion, accounting for 10.32% of the total A-share market value. There are 3,542 companies in A-share with unlisted share pledges, accounting for 99.13% of the total number of A-share listed companies. Among them, over 60 companies have pledged more than 60% of their shares, exceeding the regulatory threshold of 50%.
This study takes Yinyi Co., Ltd. as the case to discuss the 2018 tightening of share pledge financing regulations in China and its impact on contagion risk. Yinyi Co., Ltd. (000981) is a real estate company listed on A-share. It was forced liquidation when faced with stock crashes during the 2018 market turmoil due to high share pledge ratios. The share pledges of Yinyi Co., Ltd. have been increasing since 2015, with the highest proportion reaching 86.32%. At the end of 2018, its proportion of share pledges was 72.63%, which is far higher than the threshold of 50% in the new regulations. The market value of Yinyi Co., Ltd.’s share pledges ranked the top three A-share companies. Therefore, Yinyi Co., Ltd. is a typical case for study.
With the outbreak of share pledge risks in 2018, the stock price of Yinyi Co., Ltd. has continuously hit the limit down, and most of the share pledges approach the warning line. Therefore, the Yinyi Co., Ltd. tried to avoid the liquidation risk by suspending trading. However, with the strengthening of financial regulation, the strictest suspension and resumption rules have been implemented. After the Yinyi Co., Ltd. was forced to resume trading, its stock price continued to hit the limit down. The sharp decline in the market value of share pledges has increased the liquidation risk of Yinyi Co., Ltd. In addition, the difficulty of financing has also increased after tightening the share pledge supervision. Yinyi Co., Ltd. had to default in the face of the cash crunch, and it further received default disposal notices from five pledgees. The default triggers market panic. This concern has led to a fire sale by investors, which exacerbates the decline in stock prices. Thus, Yinyi Co., Ltd. went downhill and it finally filed for bankruptcy in 2019. Moreover, the risk also spreads to other listed companies in the YinYi Group, such as Guangxi Hechi Chemical Co., Ltd. and Ningbo Kangqiang Electronics Co., Ltd. Eventually, 16 companies under the Yinyi Group merged and restructured together in 2020 and renamed the company as “SENSTEED HI-TECH GROUP” in 2023. However, this reform did not improve the company’s losses. Since 2018, SENSTEED HI-TECH GROUP has suffered consecutive losses of up to ¥ 15 billion.
The case of Yinyi Co., Ltd. shows that excessive reliance on share pledge financing carries serious potential risks. Although the strong regulation of share pledge financing has an impact on the stock market in the short term, it is conducive to market stability and healthy development by cleaning up the stock market in the long run. Therefore, it should continue to improve the regulatory rules to promote high-quality development of the stock market in the future.
With the expansion of the securities market, the share pledge as a business form experienced booming growth in emerging markets. However, the risk of share pledges should also warrant attention. The share pledge relationships are more concentrated in emerging markets. As a result, there are a large number of common share pledges between different share pledgers. Due to this common share pledge network, once the risk breaks out, it will have a cascading effect. The impact will spread to multiple markets such as the stock market, banks, securities, and funds, which in turn will bring great harm to the entire financial market and the real economy. Therefore, this study proposes an identification method for systemically important listed companies by analyzing topological characteristics of a common share pledge network to improve the stability of the financial system and the ability to regulate financial risks. The following conclusions are obtained from the study.
Share pledge relationships in emerging financial markets are characterized by phases. Most share pledges have short cycles, and the common share pledge relationships form multiple localized communities in the short term. The strengthening financial regulation will promote the concentration of share pledges in some large companies, and the common share pledge relationship is characterized by a scale-free distribution. Although it reduces the possibility of risks in the share pledge market, it also enhances the position of companies with high centrality characteristics in the contagion of share pledge risks. This phenomenon implies direction for future financial regulation. The centrality characteristics of the common share pledge network can provide more risk information for identifying systemically important companies, which is helpful in financial risk prevention.
The findings implicate the following policy insights. The regulators should increase regulation for common share pledge issues to identify and address potential risks. The risks of the common share pledge should be diversified through policy guidance. It should optimize the structure of the share pledge market and promote its healthy development. More stable share pledge relationships are helpful to reduce frequent share pledges and share pledge releases in the short term, thereby reducing market volatility. It is important to strengthen the supervision of systemically important companies in the future. Using the common share pledge network to identify systemically important companies helps to prevent companies from triggering systemic risks.
The original contributions presented in the study are included in the article/supplementary material, further inquiries can be directed to the corresponding author.
YM: Conceptualization, Methodology, Software, Writing–original draft, Writing–review and editing. QS: Resources, Writing–original draft, Writing–review and editing. CW: Writing–original draft, Writing–review and editing, Supervision, Validation, Visualization.
The author(s) declare that financial support was received for the research, authorship, and/or publication of this article. This research was funded by Ministry of Education of Humanities and Social Science (No. 21YJC790108).
The authors are grateful for the funding support in the writing process. They thank the editors for their hard work in the article review process and the reviewers for their professional opinions.
The authors declare that the research was conducted in the absence of any commercial or financial relationships that could be construed as a potential conflict of interest.
The author(s) declare that no Generative AI was used in the creation of this manuscript.
All claims expressed in this article are solely those of the authors and do not necessarily represent those of their affiliated organizations, or those of the publisher, the editors and the reviewers. Any product that may be evaluated in this article, or claim that may be made by its manufacturer, is not guaranteed or endorsed by the publisher.
1. Qin X, Wang Z. Share pledge financing network and systemic risks: evidence from China. J Banking Finance (2023) 152:106871. doi:10.1016/j.jbankfin.2023.106871
2. Li W, Zhou J, Yan Z, Zhang H. Controlling shareholder share pledging and firm cash dividends. Emerging Markets Rev (2020) 42:100671. doi:10.1016/j.ememar.2019.100671
3. Dou Y, Masulis RW, Zein J. Shareholder wealth consequences of insider pledging of company stock as collateral for personal loans. Rev Financial Stud (2019) 32(12):4810–54. doi:10.1093/rfs/hhz034
4. Dudley E. Social capital and entrepreneurial financing choice. J Corporate Finance (2021) 70:102068. doi:10.1016/j.jcorpfin.2021.102068
5. Chen CC, Chen CD, Lien D. Financial distress prediction model: the effects of corporate governance indicators. J Forecast (2020) 39(8):1238–52. doi:10.1002/for.2684
6. Sun X, Lei Y. Research on financial early warning of mining listed companies based on BP neural network model. Resour Pol (2021) 73:102223. doi:10.1016/j.resourpol.2021.102223
7. Anderson R, Puleo M. Insider share-pledging and equity risk. J Financial Serv Res (2020) 58(1):1–25. doi:10.1007/s10693-020-00332-x
8. Chan K, Chen HK, Hu SY, Liu YJ. Share pledges and margin call pressure. J Corporate Finance (2018) 52:96–117. doi:10.1016/j.jcorpfin.2018.08.003
9. Pang C, Wang Y. Stock pledge, risk of losing control and corporate innovation. J Corporate Finance (2020) 60:101534. doi:10.1016/j.jcorpfin.2019.101534
10. Hu J, Zhong L, Qiao J. Equity pledge and debt financing of listed companies. Finance Res Lett (2024) 59:104771. doi:10.1016/j.frl.2023.104771
11. Zhou M, Li K, Chen Z. Corporate governance quality and financial leverage: evidence from China. Int Rev Financial Anal (2021) 73:101652. doi:10.1016/j.irfa.2020.101652
12. Luo W, Guo X, Zhong S, Wang J. Environmental information disclosure quality, media attention and debt financing costs: evidence from Chinese heavy polluting listed companies. J Clean Prod (2019) 231:268–77. doi:10.1016/j.jclepro.2019.05.237
13. Pichler A, Poledna S, Thurner S. Systemic risk-efficient asset allocations: minimization of systemic risk as a network optimization problem. J Financial Stab (2021) 52:100809. doi:10.1016/j.jfs.2020.100809
14. An P, Zhou J, Li H, Sun B, Shi Y. The evolutionary similarity of the co-shareholder relationship network from institutional and non-institutional shareholder perspectives. Physica A: Stat Mech Its Appl (2018) 503:439–50. doi:10.1016/j.physa.2018.02.183
15. Fang T, Wang D, Lin Z, Wang X. Extreme risk measurement for the oil and China’s sectors system—network-based approach and machine learning methods. Front Phys (2023) 11:1292418. doi:10.3389/fphy.2023.1292418
16. Ren C, Zhu Z, Zhou D. Multi-quantile systemic financial risk based on a monotone composite quantile regression neural network. Front Phys (2024) 12:1484589. doi:10.3389/fphy.2024.1484589
17. Jia K, Yin L. From governance contagion to risk contagion: research on systemic risk contagion from the perspective of governance externality. Front Phys (2024) 12:1476000. doi:10.3389/fphy.2024.1476000
18. Shao H, Wang D, Zhou B. Economic policy uncertainty on stock market risk contagion: a network-based approach. Front Phys (2024) 11:1094659. doi:10.3389/fphy.2023.1094659
19. Jia Y, Chen H, Liu J, Wang X, Guo R, Wang X. Exploring network dynamics in scientific innovation: collaboration, knowledge combination, and innovative performance. Front Phys (2024) 12:1492731. doi:10.3389/fphy.2024.1492731
20. Tong H, Jia Z, Zhang M, Qi J. Analysis of stock-shareholder associated network based on complex network. J Math Finance (2021) 11(01):107–22. doi:10.4236/jmf.2021.111005
21. Greenwood R, Landier A, Thesmar D. Vulnerable banks. J Financial Econ (2015) 115(3):471–85. doi:10.1016/j.jfineco.2014.11.006
22. Jackson MO. A typology of social capital and associated network measures. Social choice welfare (2020) 54(2):311–36. doi:10.1007/s00355-019-01189-3
23. Latora V, Marchiori M. Efficient behavior of small-world networks. Phys Rev Lett (2001) 87(19):198701. doi:10.1103/PhysRevLett.87.198701
24. Strang A, Haynes O, Cahill ND, Narayan DA. Generalized relationships between characteristic path length, efficiency, clustering coefficients, and density. Social Netw Anal Mining (2018) 8:14–6. doi:10.1007/s13278-018-0492-3
25. Blondel VD, Guillaume JL, Lambiotte R, Lefebvre E. Fast unfolding of communities in large networks. J Stat Mech Theor Exp (2008) 2008(10):P10008. doi:10.1088/1742-5468/2008/10/P10008
26. Lambiotte R, Delvenne JC, Barahona M. Laplacian dynamics and multiscale modular structure in networks (2008). arxiv preprint arxiv:0812.1770. doi:10.48550/arXiv.0812.1770
27. Kuzubaş TU, Ömercikoğlu I, Saltoğlu B. Network centrality measures and systemic risk: an application to the Turkish financial crisis. Physica A: Stat Mech its Appl (2014) 405:203–15. doi:10.1016/j.physa.2014.03.006
28. Bharath ST, Shumway T. Forecasting default with the Merton distance to default model. Rev Financial Stud (2008) 21(3):1339–69. doi:10.1093/rfs/hhn044
Keywords: share pledge, network structure, systemic importance, stock market, financial risk
Citation: Ma Y, Sun Q and Wang C (2025) Systemically important company identification based on topological characteristics of the common share pledge network. Front. Phys. 13:1562015. doi: 10.3389/fphy.2025.1562015
Received: 16 January 2025; Accepted: 27 February 2025;
Published: 19 March 2025.
Edited by:
Ze Wang, Capital Normal University, ChinaCopyright © 2025 Ma, Sun and Wang. This is an open-access article distributed under the terms of the Creative Commons Attribution License (CC BY). The use, distribution or reproduction in other forums is permitted, provided the original author(s) and the copyright owner(s) are credited and that the original publication in this journal is cited, in accordance with accepted academic practice. No use, distribution or reproduction is permitted which does not comply with these terms.
*Correspondence: Chao Wang, d2FuZ2NoYW9lZHVAbmphdS5lZHUuY24=
Disclaimer: All claims expressed in this article are solely those of the authors and do not necessarily represent those of their affiliated organizations, or those of the publisher, the editors and the reviewers. Any product that may be evaluated in this article or claim that may be made by its manufacturer is not guaranteed or endorsed by the publisher.
Research integrity at Frontiers
Learn more about the work of our research integrity team to safeguard the quality of each article we publish.