
95% of researchers rate our articles as excellent or good
Learn more about the work of our research integrity team to safeguard the quality of each article we publish.
Find out more
ORIGINAL RESEARCH article
Front. Phys. , 25 March 2025
Sec. Social Physics
Volume 13 - 2025 | https://doi.org/10.3389/fphy.2025.1557932
This article is part of the Research Topic Finance and Production Complex Systems View all 10 articles
 Yanfei Zhang1
 Qishen Chen1*Kun Wang1
 Qing Guan2Jiayun Xing1Tao Long1Guodong Zheng1Mei Li1Chenghong Shang3Jingwen Mao4*
Introduction: With the development of global industrialization, metal minerals have become a global focal point of great power competition. An in-depth investigation into the evolution of global mineral trade structures, alongside an analysis of the relationships between metal minerals trade, resource endowments, industrialization, regional dynamics, and geopolitical competition, is crucial for nations to formulate effective trade policies and enhance the stability of global mineral trade development.
Methods: This study explores the evolution trends of the global metal minerals trade structure from 1990 to 2022 based on complex network and further detect community structure using the Infomap algorithm.
Results and discussion: The results show that (1) There is a general upward trend in global metal minerals trade from 1990 to 2022, which can be segmented into phases of slow, rapid, and moderate growth. (2) The two major trading circles formed in the early stage with Japan and Europe as the center have changed, forming a dual pattern with China as the super demand center and Australia as the super supply center. (3) China, Australia, the U.S., Japan, Brazil, and the European Union play key roles in shaping the global trade network, with the structure of the global metal minerals trade network primarily being driven by demand centers. (4) According to the economic trends and the evolving resource demands, the global trade structure will translate from a concentrated bipolar model to a diversified network with multiple trade centers. The conclusion of this research helps specify international policies and maintain supply chain resilience.
Metal minerals are the raw materials for industrial development. With the development of global industrialization and the transfer of industrial centers, the trade structure of mineral resources has also changed. In recent years, black swan events such as the epidemic of the century, Sino-U.S. trade friction, the Russia-Ukraine conflict, and the Palestine-Israel conflict have occurred frequently, disrupting the stability of trade networks and impacting the trade of mineral products [1, 2]. For example, Russia is one of the largest exporters of copper resources, accounting for 4% of the world’s refined copper production. However, due to the ongoing fermentation of the Russia-Ukraine conflict, Russia’s copper exports have declined significantly, resulting in a rise in LME copper prices, and a supply shortage of 87,000 tons in the global refined copper market in 2023. Meanwhile, the import of copper from Russia by EU countries decreased by 79% compared with 2022, to 62,000 tons, and China’s import of copper from Russia increased by 14.8% compared with 2022 to 366,000 tons. As a result, exploring the evolution of the community structure of international metal minerals trade networks is essential for governments to adjust their development strategies. Previous studies on metal minerals trade networks usually focused on a single mineral, which cannot show the whole picture of the trade structure of mineral products. The complex network theory often be applied to carry out the supply chain network structure and risk of minerals such as copper [3, 4], lithium [5], nickel [6, 7], cobalt [8–11]and boron [12]. Additionally, models and methods such as multi-layer complex network construction, infectious disease spread models, and link prediction are widely used to characterize the evolution of global mineral resource supply risks and trade security [13–17]. Complex networks are typically composed of a few highly significant large nodes and numerous smaller nodes with less significance, often exhibiting community clustering phenomena. Community detection is a critical approach for investigating the internal structure and relationships within complex networks [18]. Three main algorithm types are widely employed in community detection for complex networks. The first includes hierarchical clustering-based algorithms, such as the Lawworth and Girvan-Newman algorithms [19, 20], which are suitable for communities with tree network structures. The second type is the greedy algorithm and Louvain algorithm based on maximum modularity-degree calculation [21–23], which are suitable for fast detection of undirected large complex network communities. The third type is an infomap algorithm based on random walks and data compression. The structure of the trading community of a single mineral species is often too simple, and only a few relevant studies have been carried out [24–27], using the second type of algorithm mentioned above, and the effect and explainability of the community division are not ideal. The infomap algorithm is a quality function for optimizing community recognition on directed and weighted networks, uses data compression for community detection, known as map equation [28, 29], which can be used for network visualization and dynamic evolution of community structure, and has developed rapidly in recent years. It is particularly effective for revealing hierarchical and overlapping communities in large-scale, weighted and directed networks [30–32]. This provides a robust framework for understanding the functional organization and resilience of the global metal minerals trade network. Therefore, this paper attempts to apply the infomap algorithm to the community detection research of mineral trade structure.
This paper selects the total trade values of 17 types of metal minerals products (trade code 2,601∼2,617) [33] as the research object. It first constructs a complex network of global trade of metal minerals products and then utilizes the map equation framework to detect and divide the community structure of international mineral trade. In the analysis of network community structure and evolution process, this paper combined the role importance of a single node and the characteristics of inter-regional trade structure analysis, to reveal the evolution process of metal minerals products trade structure.
In order to accurately divide trading communities, we integrate map equations with complex network theory into a new analytical framework. We conducted community surveys over multiple periods to explore the evolution of the global trade structure in metals and minerals. This article has two main contributions. First, unlike the traditional analysis of a single mineral, this paper analyzes all metal minerals with publicly available trade data, and for the first time explores the global trade structure of metal minerals from a holistic perspective. Secondly, this paper constructs a community network model of global metal minerals trade by infomap algorithm, analyzes the process of trade center transfer, and reveals the evolution characteristics of global metal minerals trade.
The remainder of this paper is organized as follows. Section 2 introduces the data source, structural indices of the complex network, and the algorithm for the map equation framework. Section 3 explores the top traders, important regions, important communities, and their evolution over time. Section 4 discusses the findings, and Section 5 offers conclusions.
All metal minerals trading data including the Harmonized System(HS) code from 2601 to 2617 (Table 1) were obtained from the UN Comtrade database (https://comtradeplus.un.org/), covering the period of 1990, 1995, 2000, 2005, 2010, and 2015-2022. This study has retrieved 72,311 records (Table 2), each of which includes exporters, importers, and trade value (the unit is dollars). These minerals collectively form the basis of our research object, which is to investigate the overall trade structure of metal minerals. Based on the data of 13 years, this study adds the total trade value of each metal minerals as the trade weight in each year, as shown in Equation 1:
where W represents the total trade value of all metal minerals in each year,
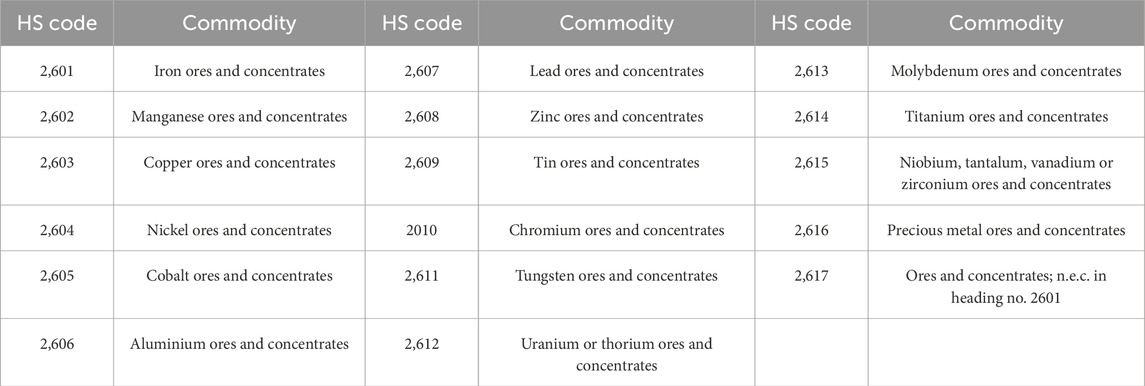
Table 1. The HS code and the commodity name.

Table 2. Trading records of each year.
Except the trading data, commodity price, GDP, GDP Per Capita, Manufacturing value added, minerals resource reserve, and production data are also used to analyze and interpret the results of the study, and the sources of these data are the World Bank (https://data.worldbank.org/), and United States Geological Survey (https://www.usgs.gov/centers/national-minerals-information-center).
Complex networks are ideal for analyzing trade patterns due to their ability to capture intricate interdependencies, non-linear interactions, and systemic structures in large-scale systems [34, 35]. This approach reveals key players, community dynamics, and resilience, offering insights beyond traditional models [36]. Compared with other methods, its strength lies in handling mutil-dimensional data and providing global perspectives, making it essential for understanding the evolution and efficiency of global trade.
Complex network model G = (V, E) consists of node set (V) and edge set (E). In V = {1, 2, … ,n}, n represents the number of nodes, and in E = {1, 2, … , m}, and m represents the number of edges. The complex network matrix is shown in Equation 2:
where wij represents the edge weights of nodes i to j.
Therefore, we use the complex network model to construct a total of 13 directed weighted networks for the international trade of metal ores and concentrates from 1995 to 2022, in which the trading country is the node, the trade relationship is the edge, and the sum of all metal ores and concentrates trade volume is the edge weight.
Based on the complex network model of international metal minerals trade patterns, structural indicators are always used to measure the global or local characteristics from different perspectives. In this study, according to the topological features of the nodes and the global network, we selected five indies to measure the change in the community structure. Predicated on the difference in the pattern structure, these indices can reflect the impact of countries in the trade patterns when removing specific countries or regions. Simplified definitions and descriptions are as follows.
The degree represents the total number of edges connected between nodes in a network. In a directed network, the degree is composed of in-degree and out-degree representing the total export and import relations between countries. The calculations are shown in Equations 3–5:
where
The weighted degree of nodes is the sum of the trade value of all the edges. In a directed network, the weighted degree can be divided into the weighted in-degree and the weighted out-degree, which are shown by Equations 6–8:
where
The centrality measures the importance and influence of nodes in a network and identifies the major active information channels. It is one of the core indices of network analysis. In this chapter, two types of centrality are considered: closeness centrality and betweenness centrality [37–39].
The betweenness centrality measures the importance of a node to the shortest paths through the network, which describes the capability of a node that make connections to other pairs of nodes in a network. It is measured by Equation 9:
where
The closeness centrality is the inverse of the average shortest distances from a node to all other nodes in a network. It measures how fast a node will take to spread information from the node to every other node that describe the influence of the node. It is defined as Equation 10:
Where
In brief, weighted degree, weighted in-degree, and weighted out-degree are used to describe countries’ total trade value, import, and export. The closeness centrality and betweenness centrality are selected to estimate the influence and importance of the network.
The map equation framework is an information-theoretic method that identifies communities by optimizing the random walker’s movement across the network to minimize its description length [29]. It is particularly effective for revealing hierarchical and overlapping communities in large-scale, weighted and directed networks [30–32]. This provides a robust framework for understanding the functional organization and resilience of the global metal minerals trade network. For a given network partition, denoted as
To capitalize on the regional structure of the network, one index codebook and m module codebooks are utilized, with each module in the network having its codebook, to articulate the movements of the random walker. The module codebooks contain codewords for nodes within each module, including exit codes to depart the module, derived from the node visit/exit frequencies of the random walker. The index codebook comprises codewords for the modules, derived from the module switch rates of the random walker. Thus, the average length of the code describing a step of the random walker is the average length of the codeword from the index and module codebooks, weighted by their rates of use, as shown in Equation 11:
The two-level average description length for a single step of the random walker within a network comprising
The
The
The
The
To investigate the evolutionary process of the global metal minerals trade structure, this study analyzes historical trade data from 1990 to 2022 in terms of trade volume, trade value, unit trade price, and the metal price index (Figure 1). According to the growth rate of value, and combined with the reality of global economy and mining development, this study divides the global metal minerals trade into three stages: (A) the slow development stage (1990–2000), (B) the rapid growth stage (2000–2010), and (C) the deceleration stage (2010–2022).

Figure 1. The trade value and metals price index, 1990–2022.
During Stage A (1990–2000), trade links doubled to 1949 in 2000, but trade value grew slowly, with new links contributing low value. Unit trade value declined slightly, while metal prices remained stable, indicating gradual trade volume expansion.
In Stage B (2000–2010), trade link growth slowed, but trade value surged nearly sevenfold to $232 billion, driven by rising unit trade values and metal prices, reflecting significant growth in both trade volume and value.
During Stage C (2010–2022), trade links stabilized (2,600–2,800), while trade value, unit value, and metal prices grew steadily. In 2021, the global economy rebounded post-pandemic, leading to a rise in metal prices and a new peak in trade value. By 2022, trade links declined and stabilized as industrial production normalized.
Overall, global trade in metals and minerals shows an upward trend in trade links, value, unit price, and the metal price index. Especially, the evolution process of trade value and unit price is similar.
Figure 2 illustrates the evolution of the global metal minerals trade network from 1990 to 2022, highlighting the weighted import and export of countries. It shows that a small percentage, about 10%–20%, of countries are responsible for 90% of the cumulative weighted indegree, while 11%–16% account for 90% of the cumulative weighted outdegree. This indicates that a minority of nations dominate global trade in metal minerals.
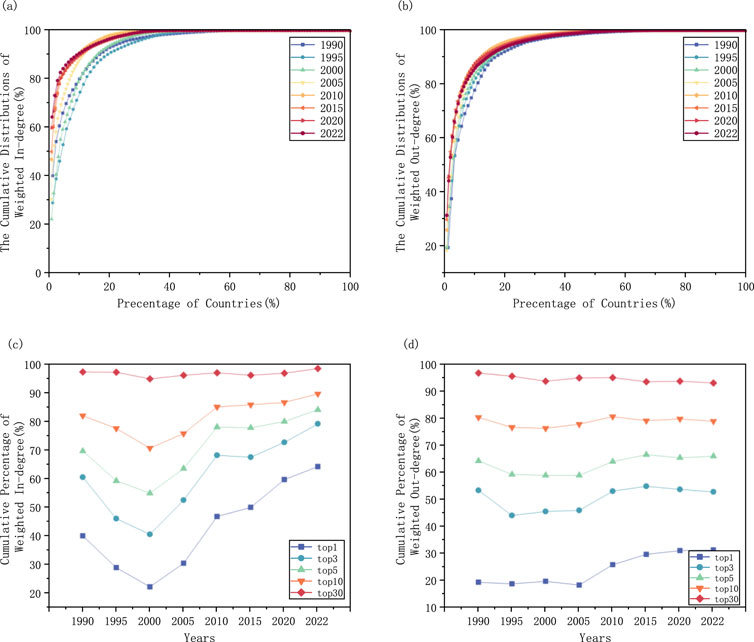
Figure 2. The cumulative distributions of the weighted in-degree and weighted out-degree, (A) cumulative percentage of weight in-degree, by years; (B) cumulative percentage of weight out-degree, by years; (C) cumulative percentage of weight in-degree, by top countries; (D) cumulative percentage of weight out-degree, by top countries.
This paper examines the shifting dominance in global metal minerals trade, focusing on the top importers by the proportion of trade value annually (Figures 2C, D). From 1990 to 2000, Japan led trade until 2000, when its demand stabilized post-industrialization. Then China emerged as the top 1 importer, with its import growth mirroring its industrialization phase—rapid at first, then slowing as industrialization neared completion. Since 2010, the top 10 importers have consistently accounted for around 85% of global imports, indicating a high concentration of trade, with the proportion of top importer was near 90% by 2022. This suggests that a small number of countries dominate metal minerals imports.
Compared with the change of the number of top countries, the cumulative weighted export ratio is stable, mainly caused by the change of the top 5 major exporting countries, among which Australia, Brazil and Chile are stable major exporting countries. Analyzed the evolution of the cumulative weighted outdegree ratio among the top 30 countries since 1990, there is a gradual decline, indicating an increasing participation of countries in the export trade of metal minerals. Nonetheless, the preponderance of exports remains concentrated within the top 10 exporting nations.
The global metal minerals trade from 1990 to 2022 was primarily driven by iron and copper, constituting over 65% of total trade (Figure 3). Iron ore (2,601) trade increased until 2010, peaking at 58% with a surge in iron prices, then declined to around 50%. Copper ore (2,603) trade remained steady at approximately 20%. Zinc ore (2,608) trade declined to a stable 5% post-2015, while molybdenum ore (2,613) experienced significant fluctuations, peaking at 6% in 1995 and 8% in 2000, before settling near 2%. Trade in precious metals (2,616) saw overall growth with substantial increases in 2000 and 2020. The trade share of other metal products remained largely consistent with minimal changes.
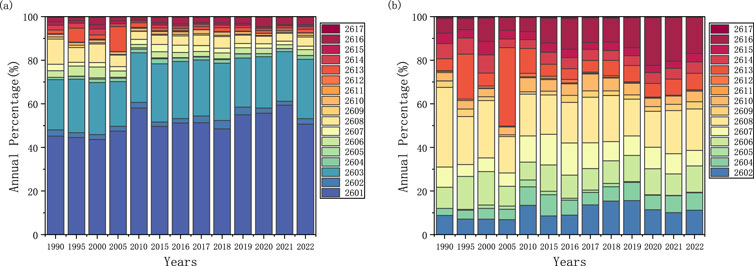
Figure 3. Commodity annual percentage, (A) included 2,601 and 2,603, (B) without 2,601 and 2,603.
In this study, the global metal minerals trade was categorized into 13 key regions, including North America (NA), South America (SA), Europe (EU), The Commonwealth of Independent States (CIS), the Middle East (MEA), Africa (AF), Oceania (OC), Southeast Asia (SAS), China (CHN), Japan (JPN), Korea (KOR), and India (IND). Among them, North America, South America, Africa, Oceania, and Southeast Asia were the primary exporters, comprising 88% of total exports in 2022. Meanwhile, Europe, China, Japan, South Korea, and India were the major importers, making up 92% of total imports in 2022. Figure 4 shows the evolution of trade flows, with the left axis indicating trade origins, the right axis showing destinations, line widths signifying trade volumes, and colors denoting distinct regions.
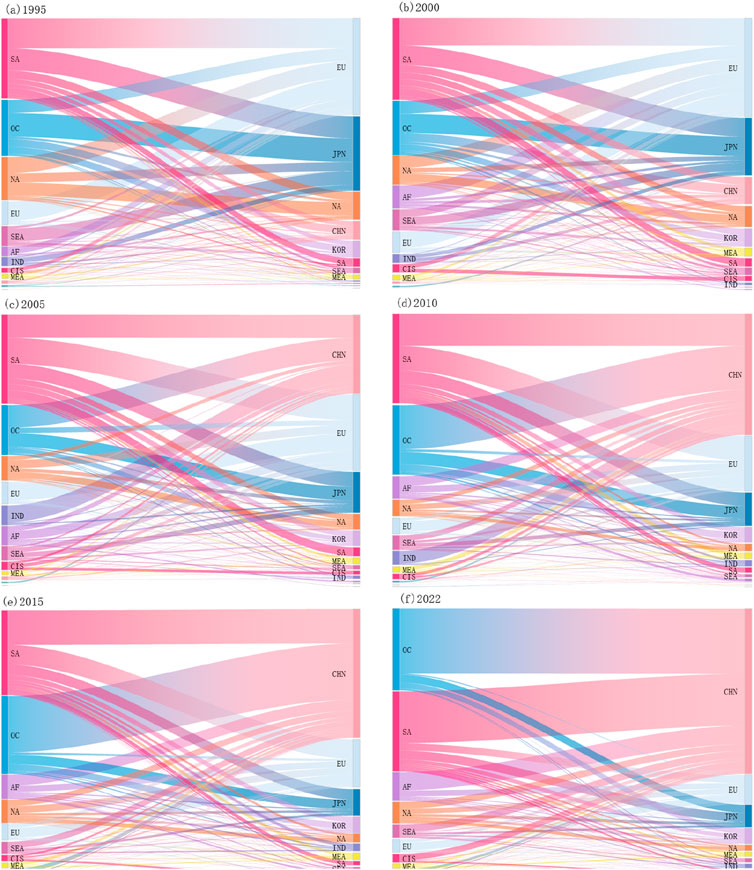
Figure 4. The evolution of metal minerals trade flows, by regions. (A–F) are the gobal metal minerals trade flows in 1995, 2000, 2005, 2010, 2015, 2022. The regions/countries in the left represent the exporter, and the regions/countries in the right represent the importer.
North America has historically been a key player in global metal minerals trade, with robust export capabilities, though its influence has waned in recent years. Between 1990 and 2000, Europe and Japan accounted for ∼60% of its exports, but post-2000, exports shifted toward China and South Korea. By 2015, China became the second-largest destination (∼28%), while South Korea’s share rose to ∼10%, matching Japan’s. Internal trade remains significant, comprising ∼20% of exports and ∼40% of imports, with the latter increasing since 2000, reflecting growing regional self-sufficiency.
South America, the largest global exporter, maintained ∼30% of global trade volume from 1990 to 2015. However, outdated policies and inefficiencies in major exporters like Chile and Brazil slowed production growth, leading to its overtaking by Oceania in 2019. Initially, Europe and Japan dominated as export destinations, but China’s industrialization shifted trade patterns, with its share rising from 9% (2000) to 65% (2022), marking a transition from multi-regional to concentrated trade.
Oceania, the second-largest exporter, saw its global export share rise from 22% (1995) to 30% (2015), surpassing South America in 2019. Initially, Japan and Europe were primary destinations (∼60% combined), but China’s demand surged post-2000, reaching 80% of Oceania’s exports by 2022. The Oceania-China trade flow became the largest globally, accounting for 24% of total trade in 2022, driven by the 2010 free trade agreement with Australia.
Africa emerged as a key supplier, with exports rising rapidly post-2000. Europe was the primary destination initially, but China’s share grew significantly, reaching 65% by 2022, while Europe’s stabilized at ∼20%. Exploration in Northwest and South Africa fueled this growth, solidifying China’s dominance.
Southeast Asia has been a stable exporter, contributing ∼7% of global exports (1990–2005), declining slightly to ∼5% (2005–2022). Japan and Europe were initially dominant (∼70% combined in 2005), but China’s share rose sharply, stabilizing at ∼55% post-2015, while Japan and Europe’s shares fell to 15% and 5%, respectively.
Europe, a major importer, saw its global import share drop from 38% (1995–2000) to 11% (2022). South America, North America, and Africa are key sources, with intra-European trade rising to 26% of imports by 2022. Europe reduced reliance on South America (44%–25%) while increasing imports from North America and Africa.
China became the largest importer, with its global import share surging from 1990. By 2022, it accounted for 64% of global imports ($224.3 billion), driven by industrialization and iron ore demand. Oceania (39%), South America (30%), and Africa (10%) are primary sources, with Oceania’s share growing significantly post-2010 due to Australia’s iron ore exports.
Japan’s import scale declined annually, falling to 9% of global imports by 2022 (from 40% in 1990). South America, Oceania, and North America are key sources, with imports from Southeast Asia dropping to 8% by 2022. Free trade agreements with South America, Oceania, and North America between 2010 and 2015 reshaped its import structure.
South Korea maintains steady imports (∼6% of global total), with Oceania and North America becoming dominant sources (∼56% combined by 2022) due to its participation in the Trans-Pacific Strategic Economic Partnership Agreement with Australia and the U.S. from 2010 to 2015.
India transitioned from a supplier to a major consumer. Exports peaked at 3.5% of global trade in 2010 but declined due to export tariffs and mining restrictions post-2009, particularly on iron ore. Imports rose during rapid economic growth (2000–2010), stabilizing at ∼2% of global imports by 2022. A production resurgence from 2014 helped recover mineral output and exports.
In summary, the global trade of metal minerals is centered around two main trade hubs: Europe, with North America and Africa as suppliers, and the Asia-Pacific, with China, Japan, and South Korea as demand centers and Oceania and Southeast Asia as suppliers. South America serves as a key mineral supplier to both trade circles. From 1990 to 2000, the trade was balanced between the Europe-America and Asia-Pacific circles, with Japan as a central player, leading to a diversified trade pattern. By 2000–2010, Japan’s trade diminished, shifting the Asia-Pacific hub to China, sparking competition with the Europe-America trade circle. From 2010 to 2022, China’s trade continued to grow, while Europe and Japan’s trade stabilized, leading to a decrease in their proportion of the total trade volume. By 2022, China accounted for over 60% of the trade, centralizing the trade circle around it. Overall, the trade pattern evolved from a diversified to a centralized system, increasing the instability of the global trade system. Additionally, India’s trade role shifted from supplier to demander due to increased domestic demand for iron ore during its industrialization phase, reducing exports to meet internal needs.
In order to further investigate the evolution of trading communities in the global metal minerals trade, this paper constructs a complex network model and employs the map equation framework for community detection and monitoring. The trade flow data representing 80%, 90%, 95%, and 99% of the accumulated trade weight were extracted annually and categorized accordingly. Utilizing the Infomap code base, the data were processed in Python to test community division by year. The analysis revealed that selecting trade data with a 95% cumulative trade weight yielded the most stable and realistic community division. Thus, the paper focuses on countries within this 95% threshold for community analysis.
This study utilized Gephi to visualize the global metal minerals trade network, and the node size indicating a country’s weighted degree and line thickness signifying trade value. Due to the large difference between the international situation in 1990 and today, the participating countries in the global metal minerals trade were incomplete. This study focused on the years 1995, 2000, 2005, 2010, 2015, and 2022 as key observation points, with detailed classifications displayed in Figure 5. Communities are divided as follows:
(1) In the early stage, the communities with Japan as the center and India, Malaysia, and other Southeast Asian countries as the main members are marked with orange;
(2) Those with China as the center and South Korea, Indonesia, Thailand, and other Asian countries as the main members in the later period are marked in yellow;
(3) Those with Australia as the center and Brazil, Chile, the United States, Canada and other countries in the Americas as the main members are marked in green;
(4) Communities centered in Germany with major members from Europe and some North African countries, such as Spain, Italy, the United Kingdom and Egypt, are marked in blue;
(5) The community with Russia as the center and Ukraine, Poland, Uzbekistan, Kazakhstan and other CIS countries as the main members, marked with cyan;
(6) Communities with Southern African members centered on South Africa, identified in pink;
(7) A transitory Brazil-centered trading community, marked in purple;
(8) And a trading community that appears briefly and centers on Chile, marked in red.
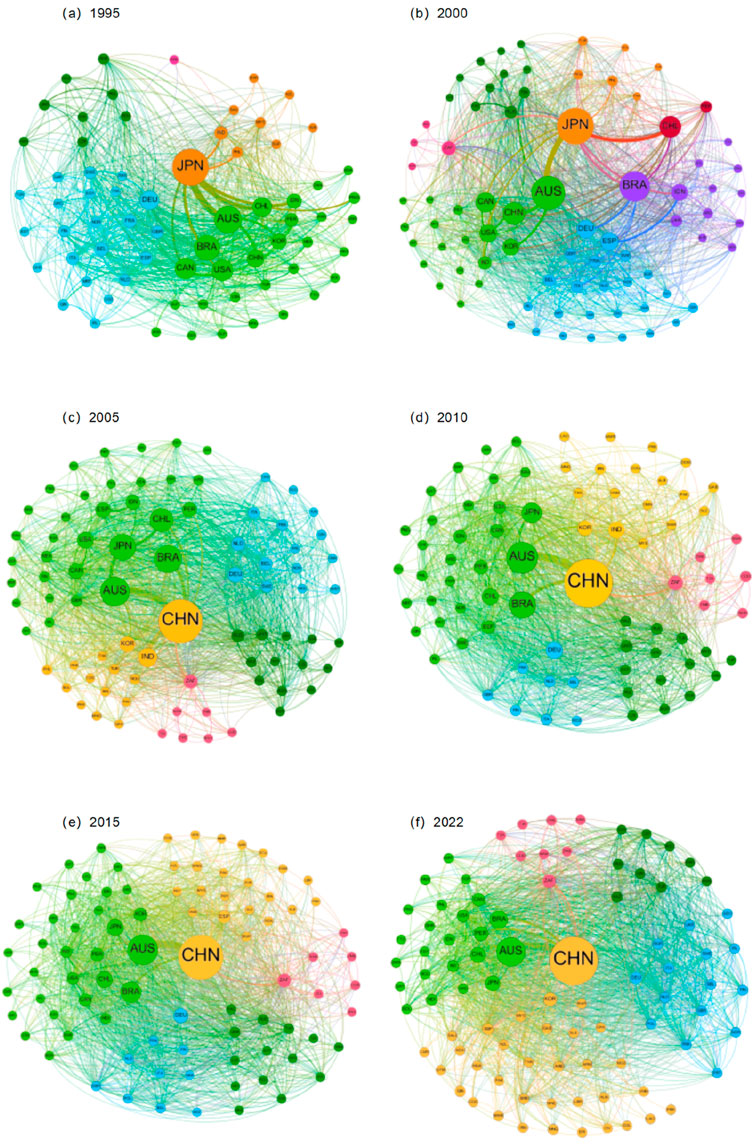
Figure 5. The evolution of gobal metal minerals trade community. (A–F) show the community division in 1900, 2000, 2005, 2010, 2015,2022. The different colors represent different communities, and the specific division is shown in the Section 3.3.
Between 1990 and 2000, Japan served as the largest global trade hub for metals and minerals. However, its prominence declined after 2005, as it became one of the top five centers within the Australia-Americas community. China, initially part of the Australia-Americas community, experienced rapid growth following its post-2000 economic reforms, emerging as the world’s largest metal minerals trader by 2005 and forming a new trade community centered on itself. From 2005 to 2022, this China-led community expanded significantly, becoming the largest trade group. The Australia-Americas community, characterized by abundant mineral resources, has consistently played a pivotal role in global trade, maintaining a relatively stable scale and membership. Countries such as Brazil and Chile temporarily formed a separate community in 2000 but rejoined the Australia-Americas community after 2005. The European community, primarily comprising EU member states and select North African countries, has remained relatively stable. However, between 2010 and 2015, some members temporarily transitioned to other communities before rejoining the German-led European community. The Russian community exhibited gradual growth until 2015 but experienced a contraction in 2022, as some members, including Ukraine, moved to the German European community. The South African community, while smaller in scale, has demonstrated remarkable stability, with its membership remaining largely unchanged over an extended period.
Globally, from 1990 to 2000, multiple trade centers coexisted, creating a competitive trade network pattern. From 2000 to 2010, China’s economic boom and Japan’s stable demand post-industrialization led to a shift in the trade network, with China and Australia emerging as the main trade centers. From 2010 to 2022, China became a super-demand center in the global metal minerals trade, with Australia as the main supply center, leading to a concentration of trade and a shift from a multi-centered to a dual-centered pattern dominated by China and Australia.
To further study the key factors of the evolution of the global metal minerals trade structure, this study analyzed the overall situation of the global metal minerals trade, the sub-regional evolution of the global metal minerals trade, and the evolution of the complex network community of the global metal minerals trade, and further collected the characteristic index data of each country in the complex network. And analyzed the leading countries in the numerical rankings.
The weighted in-degree percentage is a key measure of a country’s share in global metal and mineral trade imports (Figure 6A), indicating the trade network’s import center. Japan’s indegree percentage declined significantly from 1990 to 2000, then slowed until 2010, leveling off around 10% of global imports from 2010 to 2022. In contrast, China’s in-degree percentage showed gradual growth from 1990 to 2000, a sharp increase between 2000 and 2010, and a slower rise post-2010, eventually stabilizing at a higher share of global imports. Germany’s in-degree percentage also decreased, with a marked drop by 2000, followed by stabilization at around 8%. Meanwhile, countries such as the United States, South Korea, Spain, and Canada maintained relatively stable in-degree percentages throughout 1990–2022. Over this period, the trade network’s import hub shifted from Japan to China.
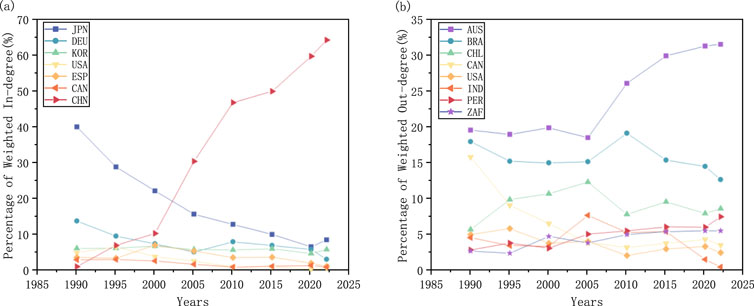
Figure 6. Percentage of weighted in-degree and weighted out-degree of major countries, 1990 to 2022. (A) Percentage of weighted in-degree of major countries; (B) Percentage of weighted out-degree of major countries. Where JPN-Japan, DEU- Germany, KOR- Korea, USA- United States, ESP- Spain, CAN- Canada, CHN-China, AUS- Australia, BRA- Brazil, CHL- Chile, IND- India, PER- Peru, ZAF- Zambia.
The weighted out-degree percentage is a crucial measure of a country’s contribution to global metal and mineral trade exports (Figure 6B). Historically, Australia has been the top exporter with a stable outdegree percentage of around 20% from 1990 to 2005, followed by rapid growth to 2015, and stabilization thereafter. Australia has consistently been the trade’s export hub from 1990 to 2022. Brazil, the second-largest exporter, maintained a roughly 15% share, with a spike in 2010 due to Chile’s decreased exports. Chile’s outdegree rose until 2005, then stabilized at 8%. Canada experienced a decline in 2005, followed by stabilization. The U.S. showed a steady decline, while South Africa trended gently upward, both achieving stability. Overall, Australia remains the central exporter, with other countries maintaining a steady proportionate structure in the global trade network.
Betweenness centrality evaluates a nation’s ability to influence trade network dynamics (Figure 7A). In 1990, Germany exhibited the highest betweenness centrality, reflecting significant network influence, although this influence fluctuated and diminished between 1995 and 2022. The United States maintained a high centrality index from 1995 to 2005, demonstrating stable control over global trade, but experienced a gradual decline after 2005 while retaining considerable international influence. China showed a sharp increase in betweenness centrality from 1990 to 2010, signaling its growing prominence in the global metal and mineral trade. It has remained the top-ranked country from 2010 to 2022, despite a slight decrease in its centrality value. Canada exhibited an upward trend until 2000, followed by a gradual decline, eventually stabilizing at a moderate level of influence. India’s centrality increased until 2010 before declining, while South Africa showed a slow but steady decline, maintaining a mid-tier position. Spain, by contrast, displayed consistent stability throughout the period.
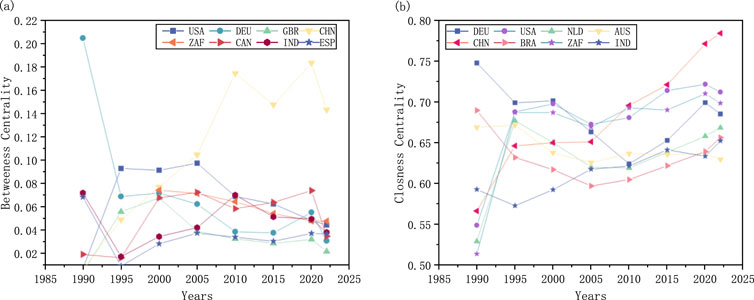
Figure 7. Betweenness centrality and closeness centrality of major countries, 1990 to 2022. (A) Betweenness centrality of major countries; (B) Closeness centrality of major countries. Where USA- United States, DEU- Germany, GBR- United Kingdom, CHN-China, ZAF- Zambia, CAN- Canada, IND- India, ESP- Spain, NLD- Netherlands , AUS- Australia, BRA- Brazil.
Closeness centrality indicates a node’s proximity to others, reflecting a country’s capacity to exert counter-influence within a network (Figure 7B). Germany’s closeness centrality declined from 1990 to 2010 but rebounded by 2022, indicating a recovery in counter-control ability. The US maintained a high and stable closeness centrality from 1995 to 2022, demonstrating strong counter-control and trade security, with extensive global trade ties and high trade freedom. China’s centrality was initially low but rose to the top after 2010, showing improved trade security and a continued upward trend to 2022. South Africa, with rich mineral resources and self-sufficiency, has a consistently high and stable closeness index, reflecting its stable counter-control ability. Australia, similarly resource-rich, has a lower overall closeness index. India’s index rose steadily, enhancing its counter-influence in global metal minerals trade, though still lagging behind top countries. Brazil’s closeness index followed a pattern of decline and recovery, with a gradual strengthening of counter-control after hitting a low in 2005.
According to the analysis of the value change of each node characteristic index, the study finds that Japan, China, Australia, Brazil, the United States, and some European countries play an important role in the structure evolution of the global metal minerals trade network. Japan, despite a declining import share from 1990 to 2022 and weak control in the trade network due to limited domestic resources, remains a key player. China, as the current trade network’s hub and import center, has closely intertwined development with the overall metal minerals trade from 1990 to 2022, enhancing its counter-control to safeguard trade security. Australia, the second-largest trading entity and export center, maintains a stable trade relationship with China and ensures its trade security through stable counter-control. Brazil, with a consistent export share and rich metal resources, is a major exporter and counter-control player. The United States, while not the center of imports or exports, exerts significant control and offers stability as a crucial trade network connector between countries.
Metal minerals are crucial for societal industrial development, with demand often rising alongside industrialization. The range of metal minerals needed for comprehensive industrial development is vast, and their distribution is typically uneven, meaning few nations can rely solely on domestic production. This creates a significant link between the scale of metal minerals trade and industrial development. Figure 8 shows that since 2000, the manufacturing industry’s value-added has declined in the U.S., Europe, and Japan, China’s rapid growth has correspondingly increased its import position in the global metal minerals trade.
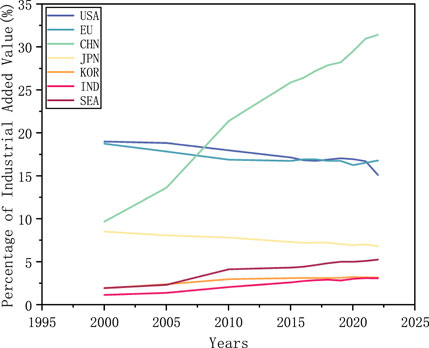
Figure 8. Percentage of industrial added value of major countries and regions, 2000–2022.
At present, the gap between the trade weight of other centrosomes and super centrosomes is wide, except for China and Australia, other countries’ trade changes are not obvious, but China 2021 proposed the “14th Five-Year Plan” [40], the domestic launch of the new steel policy, steel production has declined, iron ore demand growth will be limited. India has had the world’s highest GDP growth rate in recent years, the future steel demand will further increase, while domestic iron ore exports will also reduce, further to the demand-side role transformation. At the same time, investment in African mineral exploration projects is still advancing, and the production capacity of metal minerals in Africa will be further improved in the future [41]. In the future, the global metal minerals trade structure may change again, from the structure of China as the supercenter to the multi-center development of the trade structure, while Africa and India will become the new supply and demand centers, the global metal minerals trade structure from a highly concentrated state will once again turn to a diversified trade pattern.
Mineral resource trade is a crucial component of the metal minerals supply chain, and over-reliance on concentrated import sources can jeopardize a nation’s resource security. As the trade network becomes more intricate, nations have implemented policies to diversify trade and safeguard domestic resources. For instance, the U.S. formed the Mineral Security Partnership [42] with allies on June 14, 2022, aiming to curtail reliance on foreign adversaries for critical minerals and ensure national and economic security [43]. Concurrently, the European Union introduced the Critical Raw Materials Act on September 14, 2022, mandating that by 2030, reliance on a single third country for any strategic material should not surpass 65% of the EU’s annual consumption at any stage of processing [44]. These policies indicate a future trend where global metal minerals trade, under the influence of trade diversification, will evolve towards alliance-based structures, with developed nations and their allies forming closer trade communities, fostering a competitive environment with supercenters.
Indonesia, Chile, Peru, the Democratic Republic of Congo, Australia, and Canada, as major suppliers of metal minerals, have implemented policies to curb the direct export of raw minerals and bolster their economies. Indonesia’s 2014 ban on raw mineral exports, including nickel ore and bauxite, mandates local smelting or refining, attracting foreign investment in downstream industries and increasing export value [45]. Chile, Peru, and the DRC have raised export taxes on minerals like copper, lithium, and cobalt, and enforced national participation in mining to boost economic revenue [46, 47]. Australia and Canada promote domestic mining through key mineral lists, aiming to enhance economic growth, competitiveness, and employment [48, 49]. While China remains a significant export destination for Australian minerals, potential policy shifts influenced by the U.S. and its allies could encourage Australia to explore new markets in emerging economies like India and Southeast Asia, driving global trade structure evolution in metal minerals.
At the same time, the global energy transition is driving changes in the consumption structure of metal minerals. In the future, the energy consumption pattern dominated by clean energy such as wind power, photovoltaic, and hydrogen energy will greatly increase the demand for new energy metals such as copper, aluminum, nickel, cobalt, and lithium while the proportion of demand for iron will be reduced [50]. Moreover, the new energy sector also requires a more diverse range of metal minerals, particularly scarce minor metals such as gallium, germanium, indium, tellurium, and antimony, which will see a significant rise in demand, leading to a more diversified trade in metal minerals varieties globally [51].
Geopolitical events have had profound impacts on the global trade structure of metal minerals. Trade frictions and conflicts have led to short-term disruptions and long-term shifts in trade patterns. In the short term, geopolitical events can cause significant disruptions in supply chains, leading to supply shortages and price increases. In the long term, these events drive structural changes in trade networks. For example, The ongoing Russia-Ukraine conflict has hit the European key mineral supply chain. As a major global producer of key minerals such as nickel and palladium, the instability of Russia’s supply has prompted European companies to accelerate the search for alternative resources [52]. Such as Finland has reached cooperation with Canada and increased investment in the development of nickel ore resources in Canada to make up for the potential gap caused by changes in Russia’s supply. In the Middle East, the tense geopolitical situation have put the transportation of minerals passing through the region at potential risk. The conflicts have triggered concerns about supply disruptions. In response to this situation, many major Asian electronics - producing countries, such as Japan and South Korea, have strengthened cooperation with Australia and Brazil to ensure the stable import of key minerals such as rare earths, gallium, and germanium [53].
Combining resource endowment, national policy, industrialization process, energy transition, and other influencing factors, this study analyzes the evolution process and evolution characteristics of the global metal minerals trade structure from 1990 to 2022 by region, community, and country. The main conclusions of this paper are as follows:
(1) From 1990 to 2022, the global trade in metals and minerals shows an overall growth trend, which can be divided into three stages: A. Slow development period (1990–2000), B. Rapid growth period (2000–2010), C. Slow growth period (2010∼2022). With the development of international trade, an increasing number of countries have engaged in trade activities, while the concentration of metal minerals imports has gradually shifted toward the top 10 importing countries. A small number of nations dominate the majority of global metal minerals trade. Currently, iron and copper account for over 65% of the total trade volume, making them the most significant traded metal products. However, with the rise of the new energy sector, the demand for new energy metals is expected to rise, while the demand for traditional industry metals will diminish, leading to a more diversified trade in metal minerals.
(2) Great changes have taken place in the structure of global metal minerals trade from 1990 to 2022. In the first stage, competition primarily occurred between the Japan-centered trade circle and the Europe-centered trade circle. As Japan entered the later stages of industrialization, its demand for metal minerals stabilized. In the second stage, the structure gradually shifted to competition between the Europe-centered trade circle and the China-centered trade circle. In the third stage, after 2015, China’s demand for metal minerals continued to grow, and the global trade structure of metal minerals gradually evolved into a dual trade structure with China as the super demand center and Australia as the super supply center. On the whole, it shows an evolution from decentralization to centralization.
(3) Through the analysis of the numerical changes of each node characteristic index, the research finds that Japan, China, Australia, Brazil, the United States, and some European countries play an important role in the evolution of the structure of the global metal minerals trade network. Among countries with high import weight in metal minerals trade, those with higher betweenness centrality tend to have greater influence compared to nations with lower import weight. This indicates that the structure of the global metal minerals trade network is primarily shaped by demand centers. Conversely, countries with abundant domestic metal minerals resources exhibit relatively higher closeness centrality, suggesting that international metal trade has a comparatively smaller impact on their resource supply.
(4) The global metal minerals trade structure is poised for a shift towards a diversified network with multiple trade centers. This evolution is partly due to China’s peak demand for iron ore and its commitment to carbon neutrality, which will likely reduce foreign iron ore demand and increase the use of recycled steel. Meanwhile, the demand for copper, crucial for the new energy sector, will rise, enhancing trade with copper-rich nations like Chile and Peru. Additionally, emerging economies such as India and Southeast Asia are expected to grow their industrialization, potentially becoming new demand hubs. Developed countries like the U.S. and Europe are also forging diversified supply chains, fostering a multipolar trade landscape.
It should be noted that this study has examined metal minerals trade data only within HS codes 2,601 to 2,617 from UN Comtrade, yet it acknowledges limitations as spodumene and lithium carbonate trade data with 8-bit codes which do not open publish date, and the intermediate products of cobalt metallurgy by wet process (HS code: 8105201000) which dominated the cobalt trade is not included. The research could be enhanced by incorporating these elements. Additionally, the study applies a disjoint community rule in network analysis, which may overlook the multi-community influence of key nodes, such as bridge countries, that are instead absorbed into larger communities by more dominant nodes.
The raw data supporting the conclusions of this article will be made available by the authors, without undue reservation.
YZ: Conceptualization, Data curation, Formal Analysis, Funding acquisition, Methodology, Project administration, Software, Visualization, Writing–original draft, Writing–review and editing. QC: Conceptualization, Formal Analysis, Funding acquisition, Methodology, Project administration, Writing–original draft, Writing–review and editing. KW: Methodology, Writing–review and editing. QG: Methodology, Writing–review and editing. JX: Project administration, Supervision, Writing–review and editing. TL: Project administration, Supervision, Writing–review and editing. GZ: Project administration, Supervision, Writing–original draft. ML: Project administration, Supervision, Writing–original draft. CS: Formal Analysis, Writing–review and editing. JM: Supervision, Methodology, Writing–review and editing, Writing–original draft.
The author(s) declare that financial support was received for the research, authorship, and/or publication of this article. This work was supported by Deep Earth Probe and Mineral Resources Exploration - National Science and Technology Major Project [2024ZD1002001]; National Natural Science Foundation of China (NSFC) [grant numbers 42271281]; China Geological Survey, Ministry of Natural Resources [grant number DD20230040; DD20221694; DD20211405].
We are very grateful to the academic suggestions provided by Zhang Hongwei of Central South University.
The authors declare that the research was conducted in the absence of any commercial or financial relationships that could be construed as a potential conflict of interest.
The authors declare that no Generative AI was used in the creation of this manuscript.
All claims expressed in this article are solely those of the authors and do not necessarily represent those of their affiliated organizations, or those of the publisher, the editors and the reviewers. Any product that may be evaluated in this article, or claim that may be made by its manufacturer, is not guaranteed or endorsed by the publisher.
1. Song Y, Bai W, Zhang Y. Resilience assessment of trade network in copper industry chain and the risk resistance capacity of core countries: based on complex network. Resour Pol (2024) 92:105034. doi:10.1016/j.resourpol.2024.105034
2. Chen W, Zhang J, Yu Z, Zhao X. Structure and evolution of global lead trade network: an industrial chain perspective. Resour Pol (2024) 90:104735. doi:10.1016/j.resourpol.2024.104735
3. Kang X, Wang M, Wang T, Luo F, Lin J, Li X. Trade trends and competition intensity of international copper flow based on complex network: from the perspective of industry chain. Resour Pol (2022) 79:103060. doi:10.1016/j.resourpol.2022.103060
4. Li B, Li H, Dong Z, Lu Y, Liu N, Hao X. The global copper material trade network and risk evaluation: a industry chain perspective. Resour Pol (2021) 74:102275. doi:10.1016/j.resourpol.2021.102275
5. Hu X, Wang C, Zhu X, Yao C, Ghadimi P. Trade structure and risk transmission in the international automotive Li-ion batteries trade. Resour Conservation Recycling (2021) 170:105591. doi:10.1016/j.resconrec.2021.105591
6. Ma Y, Wang M, Li X. Analysis of the characteristics and stability of the global complex nickel ore trade network. Resour Pol (2022) 79:103089. doi:10.1016/j.resourpol.2022.103089
7. Shuxian Z, Xuanru Z, Pei Z, Wanli X, Yawen H, Hongchang H, et al. Impact of countries’ role on trade prices from a nickel chain perspective: based on complex network and panel regression analysis. Resour Pol (2022) 78:102930. doi:10.1016/j.resourpol.2022.102930
8. Shi Q, Sun X, Xu M, Wang M. The multiplex network structure of global cobalt industry chain. Resour Pol (2022) 76:102555. doi:10.1016/j.resourpol.2022.102555
9. Li Y, Huang J, Zhang H. The impact of country risks on cobalt trade patterns from the perspective of the industrial chain. Resour Pol (2022) 77:102641. doi:10.1016/j.resourpol.2022.102641
10. Sun X, Shi Q, Hao X. Supply crisis propagation in the global cobalt trade network. Resour Conservation Recycling (2022) 179:106035. doi:10.1016/j.resconrec.2021.106035
11. Liu M, Li H, Zhou J, Feng S, Wang Y, Wang X. Analysis of material flow among multiple phases of cobalt industrial chain based on a complex network. Resour Pol (2022) 77:102691. doi:10.1016/j.resourpol.2022.102691
12. Zhu M, Zhou X, Zhang H, Wang L, Sun H. International trade evolution and competition prediction of boron ore: based on complex network and link prediction. Resour Pol (2023) 82:103542. doi:10.1016/j.resourpol.2023.103542
13. Hao X, An H. Comparative study on transmission mechanism of supply shortage risk in the international trade of iron ore, pig iron and crude steel. Resour Pol (2022) 79:103022. doi:10.1016/j.resourpol.2022.103022
14. Sauer PC, Seuring S. Extending the reach of multi-tier sustainable supply chain management – insights from mineral supply chains. Int J Prod Econ (2019) 217:31–43. doi:10.1016/j.ijpe.2018.05.030
15. Ren B, Li H, Wang X, Shi J, Ma N, Qi Y. The flow of embodied minerals between China’s provinces and the world: a nested supply chain network perspective. Resour Pol (2022) 78:102853. doi:10.1016/j.resourpol.2022.102853
16. Chen Z, Wang H, Liu X, Wang Z, Wen S. Risk diffusion of international oil trade cuts: a network-based dynamics model. Energy Rep (2022) 8:11320–33. doi:10.1016/j.egyr.2022.08.244
17. Hao H, Xing W, Wang A, Song H, Han Y, Zhao P, et al. Multi-layer networks research on analyzing supply risk transmission of lithium industry chain. Resour Pol (2022) 79:102933. doi:10.1016/j.resourpol.2022.102933
18. Khawaja FR, Zhang Z, Memon Y, Ullah A. Exploring community detection methods and their diverse applications in complex networks: a comprehensive review. Social Netw Anal Mining (2024) 14(1):115. doi:10.1007/s13278-024-01274-1
19. Pastor-Satorras R, Vespignani A. Epidemic spreading in scale-free networks. Phys Rev Lett (2001) 86(14):3200–3. doi:10.1103/PhysRevLett.86.3200
20. Yang W, Chakrabarti D, Chenxi W, Faloutsos C. Epidemic spreading in real networks: an eigenvalue viewpoint. In: 22nd International Symposium on Reliable Distributed Systems, 2003. Proceedings; 06-08 October 2003; Florence, Italy. IEEE (2003). p. 25–34. doi:10.1109/RELDIS.2003.1238052
21. Wu L, Waber B, Aral S, Brynjolfsson E, Pentland S. Mining face-to-face interaction networks using sociometric badges: evidence predicting productivity in IT configuration (2008). Available from: http://dx.doi.org/10.2139/ssrn.1130251.
22. Lloyd-Smith JO, Schreiber SJ, Kopp PE, Getz WM. Superspreading and the effect of individual variation on disease emergence. Nature (2005) 438(7066):355–9. doi:10.1038/nature04153
23. Barabási A-L. The origin of bursts and heavy tails in human dynamics. Nature (2005) 435(7039):207–11. doi:10.1038/nature03459
24. Zuo Z, McLellan BC, Li Y, Guo H, Cheng J. Evolution and insights into the network and pattern of the rare earths trade from an industry chain perspective. Resour Pol (2022) 78:102912. doi:10.1016/j.resourpol.2022.102912
25. Xu-Guang Z, Xue-Hong Z, Jin-Yu C. Trade dependence network structure of tantalum trade goods and its effect on trade prices: an industry chain perspective. Resour Pol (2022) 79:103065. doi:10.1016/j.resourpol.2022.103065
26. Zhang H, Wang X, Tang J, Guo Y. The impact of international rare earth trade competition on global value chain upgrading from the industrial chain perspective. Ecol Econ (2022) 198:107472. doi:10.1016/j.ecolecon.2022.107472
27. Huang J, Ding Q, Wang Y, Hong H, Zhang H. The evolution and influencing factors of international tungsten competition from the industrial chain perspective. Resour Pol (2021) 73:102185. doi:10.1016/j.resourpol.2021.102185
28. Blöcker C, Nieves JC, Rosvall M. Map equation centrality: community-aware centrality based on the map equation. Appl Netw Sci (2022) 7(1):56. doi:10.1007/s41109-022-00477-9
29. Rosvall M, Bergstrom CT. Maps of random walks on complex networks reveal community structure. Proc Natl Acad Sci (2008) 105(4):1118–23. doi:10.1073/pnas.0706851105
30. Edler D, Bohlin L, Rosvall M. Mapping higher-order network flows in memory and multilayer networks with Infomap. Algorithms (2017) 10(4):112. doi:10.3390/a10040112
31. Rosvall M, Axelsson D, Bergstrom CT. The map equation. The Eur Phys J Spec Top (2009) 178(1):13–23. doi:10.1140/epjst/e2010-01179-1
32. Bohlin L, Edler D, Lancichinetti A, Rosvall M. Community detection and visualization of networks with the map equation framework. In: Measuring scholarly impact. Springer (2014). p. 3–34. doi:10.1007/978-3-319-10377-8_1
33. United Nations. UN comtrade (2024). Available from: https://comtradeplus.un.org/(Accessed July 22, 2024).
36. Serrano MÁ, Boguñá M. Topology of the world trade web. Phys Rev E (2003) 68(1):015101. doi:10.1103/PhysRevE.68.015101
37. Golbeck J. Network structure and measures. In: Analyzing the social web. Elsevier (2013). p. 25–44. doi:10.1016/B978-0-12-405531-5.00003-1
38. Bhattacharya S, Sinha S, Dey P, Saha A, Chowdhury C, Roy S. Online social-network sensing models. In: Computational intelligence applications for text and sentiment data analysis. Elsevier (2023). p. 113–40. doi:10.1016/B978-0-32-390535-0.00010-0
39. Hansen DL, Shneiderman B, Smith MA, Himelboim I. Calculating and visualizing network metrics. In: Analyzing social media networks with NodeXL. Elsevier (2020). p. 79–94. doi:10.1016/B978-0-12-817756-3.00006-6
40. Xinhua News Agency. People’s Republic of China outline of the 14th five-year plan for national economic and social development and the long-range objectives through the year 2035. Xinhua News Agency (2021). p. 79–126.
41. Wang QX, Shi JP, Yang RH, Yuan CH, Lian CY. The situation of solid mineral exploration in Africa and its influence on China’s “going out” strategy. China Mining (2022) 31:7–14. doi:10.12075/j.issn.1004-4051.2022.04.009
42. US Department of State. Minerals security partnership. US Department of State (2023). Available from: https://www.state.gov/minerals-security-partnership/(Accessed July 22, 2024).
43. Building Resilient Supply Chains. Revitalizing American manufacturing, and fostering broad-based growth the white house (2021). p. 1–250. Available from: https://whitehouse.gov/wp-content/uploads/2021/06/100-day-supply-chain-review-report.pdf?ref=hackernoon.com (Accessed July 22, 2024).
44. European Commission. Critical raw materials Act. European Commission (2022). Available from: https://commission.europa.eu/strategy-and-policy/priorities-2019-2024/european-green-deal/green-deal-industrial-plan/european-critical-raw-materials-act_en#:∼:text=The%20European%20Critical%20Raw%20Materials%20Act%20is%20an,supply%20of%20critical%20raw%20materials%20in%20the%20EU (Accessed July 22, 2024).
45. Indonesian Government Prohibition of the export of nickel ore. Indonesian Government (2020). Available from: https://www.iea.org/policies/16084-prohibition-of-the-export-of-nickel-ore (Accessed July 22 2024)
46. Lagos G. Mining nationalization and privatization in Peru and in Chile. Mineral Econ (2018) 31(1–2):127–39. doi:10.1007/s13563-017-0124-9
47. Bloomberg. Chile a step closer to nationalizing copper and lithium. Bloomberg (2022). Available from: https://www.mining.com/chile-a-step-closer-to-nationalizing-copper-and-lithium/(Accessed July 22, 2024).
48. Geoscience Australia. Critical minerals strategy 2023–2030. Geoscience Australia (2023). Available from: https://www.industry.gov.au/publications/critical-minerals-strategy-2023-2030 (Accessed July 22, 2024).
49. Government of Canada. Canada’s critical minerals. Government of Canada (2024). Available from: https://www.canada.ca/en/campaign/critical-minerals-in-canada/critical-minerals-an-opportunity-for-canada.html (Accessed July 22, 2024).
50. Li C, Li X, Zhang M, Yang B. Sustainable development through clean energy: the role of mineral resources in promoting access to clean electricity. Resour Pol (2024) 90:104675. doi:10.1016/j.resourpol.2024.104675
51. D’Orazio P. Assessing the fiscal implications of changes in critical minerals’ demand in the low-carbon energy transition. Appl Energy (2024) 376:124197. doi:10.1016/j.apenergy.2024.124197
52. Khurshid A, Chen Y, Rauf A, Khan K. Critical metals in uncertainty: how Russia-Ukraine conflict drives their prices? Resour Pol (2023) 85:104000. doi:10.1016/j.resourpol.2023.104000
Keywords: metal minerals, international trade, complex network, map equation framework, community detection
Citation: Zhang Y, Chen Q, Wang K, Guan Q, Xing J, Long T, Zheng G, Li M, Shang C and Mao J (2025) Evolutionary characteristics and community detection of the international metal minerals trade. Front. Phys. 13:1557932. doi: 10.3389/fphy.2025.1557932
Received: 09 January 2025; Accepted: 13 February 2025;
Published: 25 March 2025.
Edited by:
Ze Wang, Capital Normal University, ChinaReviewed by:
Siyao Liu, Chinese Academy of Sciences (CAS), ChinaCopyright © 2025 Zhang, Chen, Wang, Guan, Xing, Long, Zheng, Li and Shang. This is an open-access article distributed under the terms of the Creative Commons Attribution License (CC BY). The use, distribution or reproduction in other forums is permitted, provided the original author(s) and the copyright owner(s) are credited and that the original publication in this journal is cited, in accordance with accepted academic practice. No use, distribution or reproduction is permitted which does not comply with these terms.
*Correspondence: Qishen Chen, Y2hlbnFpc2hlbkAxMjYuY29t; Jingwen Mao, amluZ3dlbm1hb0AyNjMubmV0
Disclaimer: All claims expressed in this article are solely those of the authors and do not necessarily represent those of their affiliated organizations, or those of the publisher, the editors and the reviewers. Any product that may be evaluated in this article or claim that may be made by its manufacturer is not guaranteed or endorsed by the publisher.
Research integrity at Frontiers
Learn more about the work of our research integrity team to safeguard the quality of each article we publish.