
95% of researchers rate our articles as excellent or good
Learn more about the work of our research integrity team to safeguard the quality of each article we publish.
Find out more
ORIGINAL RESEARCH article
Front. Phys. , 18 March 2025
Sec. Social Physics
Volume 13 - 2025 | https://doi.org/10.3389/fphy.2025.1553788
This article is part of the Research Topic Finance and Production Complex Systems View all 10 articles
 Yuping Ma1,2
 Mingqian Xu3*
In the context of the financial crisis, this paper introduces an innovative approach to Data Envelopment Analysis (DEA) that is grounded in collaborative theory, aiming to assess the impact of financial factors, particularly fiscal allocations, on the efficiency of transforming research achievements into practical applications within Chinese universities. Based on this methodological framework, the paper constructs an interactive network framework that integrates government, industry, and academic institutions, conceptualizing research activities as a multi-agent, multi-stage complex system. Through an empirical analysis of 79 Chinese universities, we investigate the role of government fiscal grants as a key input factor in influencing the efficiency of research achievement transformation within this system. The findings reveal that strategic allocation of fiscal grants significantly enhances the efficiency of research application, while substantial variations in the efficiency of research achievement transformation exist across different universities. This study further elucidates the intrinsic link between fiscal allocations and the commercialization efficiency of research achievements, providing policymakers with critical insights into the effective distribution of financial resources to facilitate the transformation of research achievements into practical applications. This research not only enriches the application of complex systems theory in higher education but also offers a novel perspective on the role of financial support policies in the commercialization of scientific and technological achievements.
Set against the backdrop of a financial crisis, this paper introduces a new Data Envelopment Analysis (DEA) methodology, rooted in collaboration theory, to assess the financial crisis’s impact on the efficiency of transforming research achievements in Chinese universities into practical applications. Within this complex system, the collaborative network of universities, enterprises, and government is crucial for propelling significant advancements in science and technology, with fiscal elements, particularly fiscal allocations, playing a pivotal role in directly influencing the direction, scale, and outcomes of scientific research.
Collaborative innovation emerges as an advanced organizational paradigm that leverages the collective strength of these entities to catalyze major scientific and technological innovations, with value-added knowledge at its core and achieving extensive integration. The application of synergy theory is indispensable for enhancing the efficiency of scientific research innovation and achievement transformation. This theory focuses on the common characteristics and synergistic mechanisms among different systems, emphasizing the transition from disorder to order through the interaction of various systems.
Synergy theory comprises three principal elements: synergistic effect, servo principle, and self-organization. The synergistic effect, resulting from the interaction of different systems within an open system, is the internal driving force for the formation of organized structures. The servo principle dictates that fast variables are governed by slow variables and order parameters, which dominate system behavior and elaborate the process of system self-organization. Self-organization allows a system to automatically form certain structures or functions among its internal subsystems according to specific rules.
Given the characteristics of research universities, especially those directly under the administration of the Ministry of Education in China, evaluating their efficiency is crucial for advancing the construction of world-class universities, optimizing resource allocation, and fostering collaborative innovation among universities, enterprises, and government. Efficiency evaluation provides organizations with a potent quantitative tool to inform managerial decisions, with analysis results offering a scientific basis for enhancing organizational efficiency.
As a non-parametric approach, Data Envelopment Analysis (DEA) excels in assessing the efficiency of multi-input, multi-output systems. The fundamental principle of DEA is to compare the actual input-output levels of evaluated decision-making units (DMUs) with the ideal levels that could be improved, with this ratio serving as the efficiency measure of the evaluated units.
However, the assumption of independence among decision units is often violated in real-world scenarios due to mutual interference and interconnected production processes among decision units. Under non-shared fixed and input constraints, changes in the output level of one decision-making unit can affect others, altering the position of the efficient frontier and the desired input-output levels that could be enhanced. Thus, reassessing the comparative performance metrics of parallel interactive decision units with fixed and input constraints presents an efficiency evaluation challenge that demands reconceptualization.
Drawing on the connotations of synergy theory, this paper proposes a novel DEA efficiency evaluation method and applies it to assess the scientific research performance of China’s “Double First-Class” universities amidst financial crisis by the Refs. [1, 2], with particular emphasis on the role of fiscal grants in shaping research outcomes and efficiency. We measure the relative efficiency of research universities by proposing a parallel interactive network Data Envelopment Analysis (DEA) model with non-shared fixed inputs. The interactivity is reflected in the division of the university’s research activities into research development subsystems and research application subsystems, which interact with each other within the model. The outputs of the research development subsystems, such as papers and monographs, serve simultaneously as inputs for the research application subsystems for the transformation of research results. Conversely, the research funding obtained through enterprises by the research application subsystems is used as input for the research development subsystems. The fixed nature is represented by government funding, which is consumed as a fixed input solely by the research development subsystems. This approach allows us to capture the complex interdependencies and resource allocation within research universities, providing a more refined perspective on the efficiency analysis of higher education research.
The study reveals that under the influence of the 2015 Chinese stock market financial crisis, the strategic allocation of fiscal grants to universities significantly enhanced the efficiency of research outcome application during 2016–2017, offering policymakers critical insights into the effective distribution of financial resources to catalyze the transformation of research outcomes into practical applications. This research not only enriches the application of complex systems theory in higher education but also provides a novel perspective on the role of financial support policies in the commercialization of scientific and technological achievements within the context of financial crisis.
In recent years, the synergistic theory has garnered significant scholarly interest. Synergistic innovation, a pivotal outcome of this theory, redirects research focus towards the domain of collaborative technological innovation. The concept was initially introduced by Peter Gero from the Sloan Center at the Massachusetts Institute of Technology (MIT) in the U.S., who defined Synergistic innovation as the process by which a network of self-motivated individuals develops a shared vision, communicates ideas, information, and work progress, and collaboratively pursues a common objective [3]. supposed that the group members form a common vision and exchange ideas, information and work status through the network, working together to achieve common goals. Considering the current situation of innovation in China [3], redefined collaborative innovation as a way of guiding by national directional policies and mechanisms, enabling enterprises, universities and other innovation subjects to utilize their respective advantageous capabilities, readjust complementary resources, thus realizing complementary advantages, promoting the diffusion of innovative technologies and industrialization, and accelerating techno-logical innovation and the industrialization of technological achievements. The industrialization of technological innovation and scientific and technological achievements will be accelerated.
This paper posits that synergy theory enhances innovation and practicality during the research and development phase by fostering interdisciplinary collaboration. Specifically, research teams from different disciplines can integrate their respective knowledge and technological strengths through synergistic innovation, forming comprehensive research plans that provide a broader perspective for the generation of scientific achievements by the Ref. [3]. In the stage of application and transformation of research outcomes, synergy theory facilitates the close alignment of scientific achievements with market demands through collaboration between enterprises and universities. Considering the three major theoretical frameworks of synergy theory, the synergistic effect enables parties to pool their advantageous resources through resource sharing and information exchange, thereby improving the efficiency and quality of outcome transformation by the Ref. [4]. The servo principle guides research institutions to adjust their research directions and strategies in a timely manner according to market and policy changes, adapting to the demands of the external environment. The self-organization capability allows research teams to autonomously manage and optimize their internal operations, forming efficient organizational structures and operational mechanisms, thus enhancing the output and application efficiency of scientific achievements.
In academia, the traditional methodology for evaluating the efficiency of multi-input, multi-output decision-making units (MIMDU), known as Data Envelopment Analysis (DEA), has attracted significant global scholarly attention. Seminal research in this domain employed the standard DEA to evaluate the performance of higher education institutions, notably by quantifying the relative efficiency of 79 Chinese universities from 2003 to 2004 [5]. classified the departments were methodically sorted into quartets for the sake of cluster analysis and the breakdown of efficiency, taking into account their diverse characteristics. This approach diverges from the straightforward production framework depicted by the DEA model, which does not delve into the same granularity of features. Taking into account qualitative aspects within the DEA approach, Ref. [6] assessed the issue of fuzzy efficiency to aid in decision-making processes. Furthermore, Ref. [7] introduced an enhanced interval DEA model, which addressed the challenge of zero inputs when evaluating the efficiency of certain DMUs, and this model was subsequently applied to Iranian academic institutions. Similarly [8], evaluated the efficiency problem of private universities with the help of DEA modeling. The aforementioned studies indicate that the conventional DEA model, characterized by a “black box” design, has seen extensive application in the assessment of university efficiency. However, contemporary scholarly works frequently portray the production process of universities as a simple construct consisting only of initial inputs and final outputs. This rudimentary black box model is inadequate for capturing the complexity of actual production processes, potentially omitting crucial details within these activities. As a result, the development of the network DEA approach has emerged to overcome the limitations inherent in traditional DEA models, particularly in the context of university efficiency assessments.
[4] introduced a network DEA methodology with the objective of unveiling the “black box” of the production process, typically perceived as an aggregation of various subsystems. The network DEA methodology aims to reveal the internal workings of the production process by viewing it as an integrated system of distinct subsystems. By dissecting the internal production mechanisms, this approach enables a more comprehensive understanding of an organization’s efficiency, linking the overall performance directly to the efficacy of its individual subsystems. In today’s context, universities fulfill various critical roles, including teaching, research, and technology transfer, with each role representing a key subsystem that significantly impacts the institution’s overall efficiency.
The network DEA approach has been increasingly utilized to assess university efficiency by modeling the internal production processes, thereby providing new perspectives and broadening the scope of efficiency assessment research within the academic community [9]. assessed the educational, scholarly, and financial efficiency of Taiwanese universities, with the educational and scholarly stages incorporating outputs from the financial efficiency stage. The findings indicated that universities excelled in the cost efficiency phase [10]. introduced a two-stage network configuration DEA methodology for assessing the efficiency of travel and recreation departments across 34 universities [11]. developed a network DEA model that puts into perspective parallel interdependent systems and utilized it to evaluate the productivity of universities. Associated with the “985 project.” [12] employed a semidefinite programming method to compute a generalizable two-stage model, which was then applied to R&D activities within China. Concurrently, the efficiency of China’s regional R&D processes was also evaluated [13]. investigated the use of the Luenberger productivity indicator to gauge efficiency dynamics in Chinese universities. Notably, the research is grounded in a network framework that incorporates the element of time [14]. developed a multi-period DEA approach that accounts for feedback mechanisms, which was used to classify sociological inquiry into development and innovation phases [15]. introduced an additive DEA model to assess the efficiency of 38 academic departments within Chinese universities, considering the heterogeneity among university faculties [16]. employed an augmented two-step network configuration to appraise the efficiency of 52 Chinese universities, culminating in the finding that approximately two-thirds of these institutions are deemed inefficient [17]. built a decentralized and centralized model that includes networked institutions for the purpose of evaluating the efficiency of elite universities in China. In order to address the deficiencies of static systems [18], conceptualized university R&D activities as an intertemporal production process and constructed a parallel DEA model that captures the intertemporal dynamics. Considering the fairness between the leadership step and further steps [19], constructed a three-stage network with a tandem structure and applied it to the R&D innovation of China’s hightech industry. Echoing this trend, the network DEA approach has gained prominence due to its benefits in assessing organizational performance and has been extensively utilized to evaluate the efficiency of various entities, including universities and industrial firms. For example [20], used a two-stage network DEA model to measure energy efficiency and explored the differences with full efficiency [21]. advanced a progressive DEA model that surpasses earlier methods in detecting alterations in system efficiency.
Scholars, in their quest to refine the evaluation of production structures through various network DEA methods, have increasingly directed their focus towards the critical issues of input and output fixation and the interplay between decision-making units (DMUs). The oversight of fixation and the characteristics of inputs and outputs between DMUs can lead to imprecise efficiency valuations. This realization underscores the necessity for a nuanced approach that accounts for these intricacies, thereby enhancing the accuracy and reliability of efficiency assessments within academic research. In view of this [22], first investigated the problem of evaluating participating countries with a fixed total number of medals in Olympic competitions and proposed a zero sum gains (ZERO SUM Gains) DEA model. Subsequently [23], extended the zero-sum gains DEA model to consider the case of non-desired outputs and assessing the efficiency of carbon dioxide emissions among the parties to the Kyoto Protocol [24]. established a two-stage efficiency evaluation model with substage efficiency decomposition model that satisfies the shared output fixation and constraints, and applied it to the problem of evaluating the energy conversion and utilization efficiency in 30 provincial-level regions in China [25]. considering that government grants are consumed by two subsystems, scientific and technological research and results transformation, a parallel interaction network DEA method based on shared fixed inputs was established and evaluated the efficiency of 58 Chinese research universities. However, this paper argues that not all decision-making units have shared fixed sum constraints. Take universities, for example,. When measuring their performance, government grants are mostly used in scientific and technological research in reality, and the source of funding for the transformation of achievements does not include government grants, so the shared fixed-sum input condition does not hold.
Financial crises can significantly impact the efficiency of the complex production systems of university research activities, particularly the stage of transforming research outcomes into practical applications [1]. focused on the efficiency of Italian and German universities in converting public funding into multiple university outputs (i.e., graduating students, publishing research, and patenting activities) following the 2008 financial crisis [2]. considered the constraints on public funding after the economic crisis and empirically analyzed the impact of the economic crisis on the technical efficiency of research and development activities in state universities [26]. analyzed the significant impact of the financial crisis on various stakeholders in higher education activities, suggesting that the crisis may lead to reduced funding for education from governments, private sectors, and households [27]. explored the determinants of cost efficiency in public universities during the economic crisis, systematically quantifying the efficiency impact factors on universities [28]. considered the differences in the impact of the global financial crisis on private and public universities, indicating that reliance on public and endowment funds can significantly enhance the efficiency of university activities after the crisis. Unlike previous studies, this paper considers the actual context of Chinese universities, using government financial subsidies as a key input factor to assess the impact of financial elements (especially fiscal allocation) on the efficiency of Chinese universities in transforming research outcomes into practical applications.
Thus, this study tackles the two-stage efficiency evaluation challenge within a networked system, constrained by specific fixed inputs and limitations, and is rooted in synergy theory. Initially, the paper establishes an equilibrium efficiency frontier that adheres to the non-shared fixed and input constraints. Subsequently, it develops a two-system efficiency evaluation model predicated on this equilibrium efficient frontier. Recognizing that the efficiency evaluation of subsystems is influenced by various factors, including parameter settings and subjective roles, which can yield non-unique results, the paper addresses the holistic efficiency evaluation of the two systems. Ultimately, the study employs empirical data from 79 Chinese research universities to validate the methodology.
Consider homogeneous decision-making units with a two-system production structure as shown in Figure 1. In the first subsystem, each
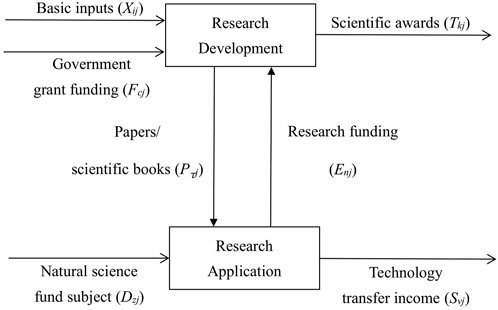
Figure 1. Structure of the two systems of research and development - results transformation and application.
Following the approach of previous studies [29], adopted the variable returns to scale (VRS) hypothesis, positing that for a given Decision-Making Unit (
Among them
Based on the theory of synergy,
In model (Equation 2), it is required that
Model (Equation 3) adheres to the condition that the weights allocated to each subsystem exceed a predetermined threshold, with the resultant efficiency
[33, 34] proposed the preceding DEA model of an integrated interconnected network with traditional shared inputs is particularly noteworthy: for one thing, the quantity of shared inputs in individual subsystems needs to be accurately measured, but based on the theory of synergy, in many production and life practices [35-37], only a total amount of shared inputs can be observed
For efficiency evaluation problems with fixed-sum input constraints, changes in the efficient frontier must be taken into account when calculating the relative efficiency because the production process still does not satisfy the independence requirement [38, 39]. introduced a framework that utilizes the equilibrium efficiency horizon in the black-box scenario of decision units to find such a common efficient frontier, which can make all decision units lie on the efficient frontier at the same time when output fixing and constraints are satisfied.
In assessing the efficiency of Decision-Making Units (DMUs), the conventional DEA approach establishes the optimal efficiency frontier using efficient DMUs. Nonetheless, it overlooks the scenario where certain DMUs are subject to fixed sum constraints. Consequently, leveraging the minimum adjustment quantity strategy [40], introduced the FSODEA (Fixed-Sum Output DEA) model, which puts into perspective the fixed-sum output constraint. In this FSODEA framework, the DMUs under evaluation are deemed efficient following the adjustment of outputs for other DMUs, with the optimal efficiency frontiers differing according to the DMU in question. Following this [41], crafted the EEFDEA (Equilibrium Efficiency Frontier DEA) model, capable of assessing all DMUs against a shared equilibrium efficiency frontier. However, EEFDEA is not without its limitations, such as the considerable computational complexity and the dependence of evaluation results on the pre-established “order” of DMUs. Building upon these [38], developed the GEEFDEA (Generalized Equilibrium Efficiency Frontier DEA) model, which retains the benefits of both FSODEA and EEFDEA and establishes a generalized equilibrium efficiency frontier. To evaluate parallel research activities with non-shared fixed and variable inputs, we constructed the parallel GEEFDEA network framework. To assess the efficiency of two systems with non-shared fixed and input constraints, we have developed model (Equation 4) to ascertain the common EEF.
Where
Since model (Equation 5) is still nonlinear, we developed a two-phase strategy to transform model (Equation 5) into model (Equation 6). In the first step, we let
H in model (Equation 6) ensures that the model’s ratio includes a positive lower fraction and that the efficiency value of the target unit being evaluated is greater than zero. In the second step, we let
A Data Envelopment Analysis (DEA) model has been developed to characterize a comprehensive equilibrium efficient frontier for network arrangements that interact concurrently, accounting for both fixed and variable inputs. By solving the model (Equation 7), the optimal tuning that enables all DMUs to be simultaneously effective in achieving a common EEF is computed
The previous section determines the common EEF, on the basis of which we can evaluate the efficiency of each DMU after obtaining the
The maximum value of the objective function at optimality of model (Equation 9) will be
In addressing the rationality of the model’s assumptions, this paper conducts a validation and discussion of the assumptions. Drawing on the theory of organizational interdependence, the interactions and dependencies between organizations influence their behavior and performance. In the context of research and development, the interdependence between universities, enterprises, and the government is particularly evident. For instance, universities provide foundational research outcomes, enterprises transform these outcomes into commercial products, and the government supports this process through policies and funding. This interdependence means that the decisions and activities of each organization are no longer independent but rather affect and constrain each other. This confirms the model’s assumption that decision-making units interfere with each other and that production processes are interdependent.
As China’s higher education sector experiences rapid growth, the evaluation of research efficiency and the commercialization of scholarly achievements in academic institutions have become focal points of interest. This assessment is integral to the national innovation system, capturing the attention of educational policymakers and scholars alike. The effectiveness of converting research outcomes into practical applications is a critical issue for those formulating educational strategies and academic discussions. Within the framework of China’s “double first-class” initiative, a scientific evaluation of the efficiency of 79 Chinese research universities, grounded in synergy theory, aids in the optimal allocation of resources and fosters the substantive development of these universities [42, 43]. This, in turn, bolsters the overall competitiveness of the nation’s educational landscape. This study aims to offer valuable insights for enhancing the management and educational quality of Chinese research universities and, concurrently, to contribute Chinese insights and solutions to the global discourse on higher education.
This section employs the efficiency evaluation of China’s research universities as a case study, utilizing the methodology outlined in the previous section to assess the academic efficiency of 79 such institutions. According to the synergy theory, the research process within universities encompasses three key stakeholders: universities, enterprises, and the government. This process can be conceptualized as an integrated network framework comprising a research and development (R&D) subsystem and a subsystem for the transformation and application of research outcomes. A distinctive feature of this framework is the fixed government funding allocated to the R&D subsystem, with outputs from the R&D subsystem—such as theses and monographs—serving as inputs back into the system. Additionally, research grants procured through enterprises are also considered inputs to the R&D subsystem. In this analysis, we focus on scenarios where the total government funding is a predetermined fixed amount. The structure of the two systems, namely, research and development and the translation and application of research results, is illustrated in Figure 1.
Taking into account the availability and recency of data, this study employs data from 79 Chinese research universities in 2016 to evaluate the efficiency of research and development (R&D) as well as the transformation of achievements. All of these institutions are participants in the “211 Project,” and they have managed a significant number of complex and demanding research projects. It is important to note that due to data accessibility limitations, a subset of these universities with a research focus was excluded from the study. The data was extracted from the Ministry of Education’s Basic Statistics Compendium for Universities and the Education Blue Book 2016–2017. To account for output lags, a 1-year lag period for outputs was applied in the analysis. The model was executed using MATLAB R2022b on a system equipped with an Intel Core i7 CPU, 16 GB of RAM, and Windows 11 operating system.
As shown in Figure 1, in the research development system, each of the
As shown in Figure 1, the core components of the research and development (R&D) process include faculty members and graduate students. The government offers grants, classified as inputs, with a 1-year term. To comprehensively evaluate the R&D subsystem’s performance, outputs are categorized as scientific awards, published monographs, and high-quality papers. Scientific awards include both national and provincial honors. High-quality papers are characterized by their presence in Chinese core journals and inclusion in the Science Citation Index. In the translation and application phases of research outcomes, the allocation of natural science funds serves as an input variable with two key functions: it indicates the capacity for scientific discovery transformation and highlights the national emphasis on the relevant field. Furthermore, the success of implementing research findings is largely contingent upon the resources provided by natural science funding, underscoring its critical role in the practical application of research achievements. Citing Refs. [39, 44], research funding and income from technology transfers are identified as the outputs of this activity. Specifically, income from technology transfer refers to the payments received by the university from enterprises or other organizations in exchange for the university’s provision of technical services. The selection of indicator data and the units for these indicators, which are essential for evaluating the overall efficiency of the R&D and research results transformation and application systems in this study, are presented in Table 1.
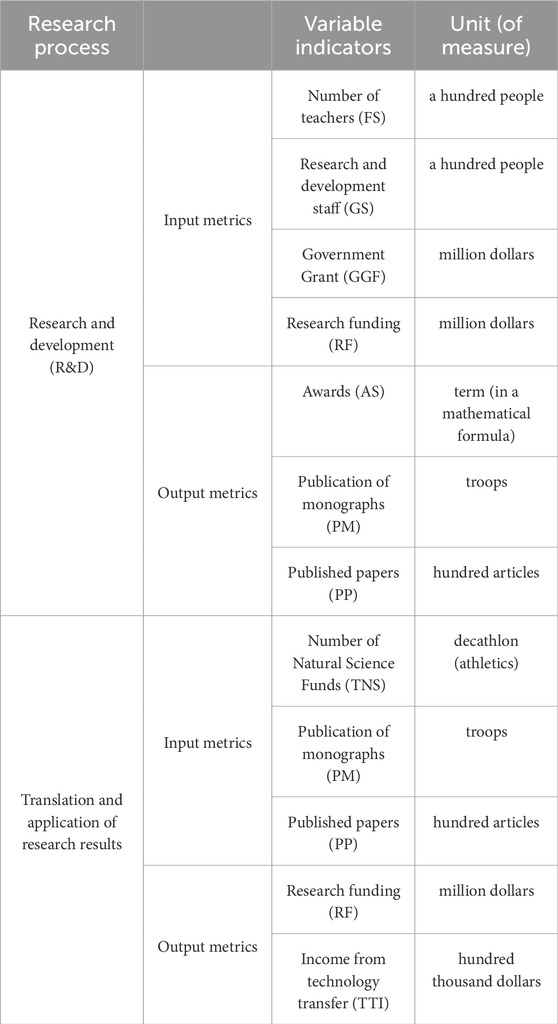
Table 1. Selection of indicators.
This paper selected the data of 79 research universities in China in 2016 for empirical research, and Table 2 lists the descriptive statistics of the relevant indicators, including the mean, median, standard deviation, maximum and minimum values.
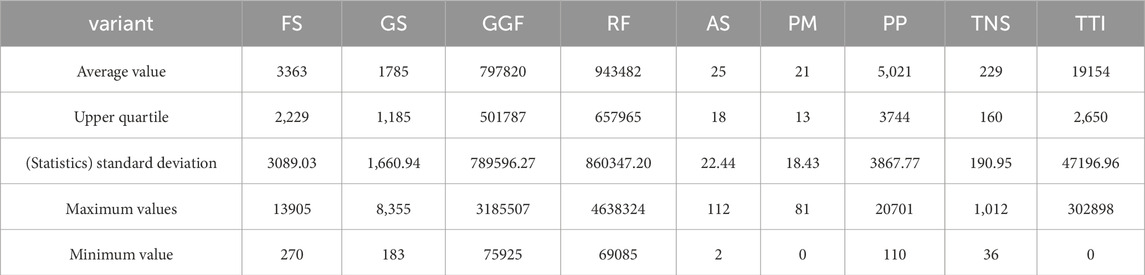
Table 2. Descriptive statistics of input-output indicators.
In this paper, the optimal efficiency of the application system for research development and translation of research results in 79 research universities is calculated by means of a DEA model featuring inputs. From column 2 of Table 4,
To determine the equilibrium efficiency frontier compliant with the non-shared fixed and variable input constraints as per synergy theory, Model (Equation 7) is utilized to compute the optimal adjustments for both the research and development system and the system for translating and applying research outcomes, with the results detailed in Table 3. A positive value in the table signifies that a region must augment its government grant input to align with the communal equilibrium efficiency frontier, while a negative value suggests a reduction is necessary, and zero indicates no adjustment is required. Table 3 reveals that 53 decision-making units require a decrease in government grant inputs, whereas 26 units necessitate an increase. The optimal adjustments, when summed, equal zero, fulfilling the criterion of maintaining a fixed total for government allocation inputs across all decision-making units [45].
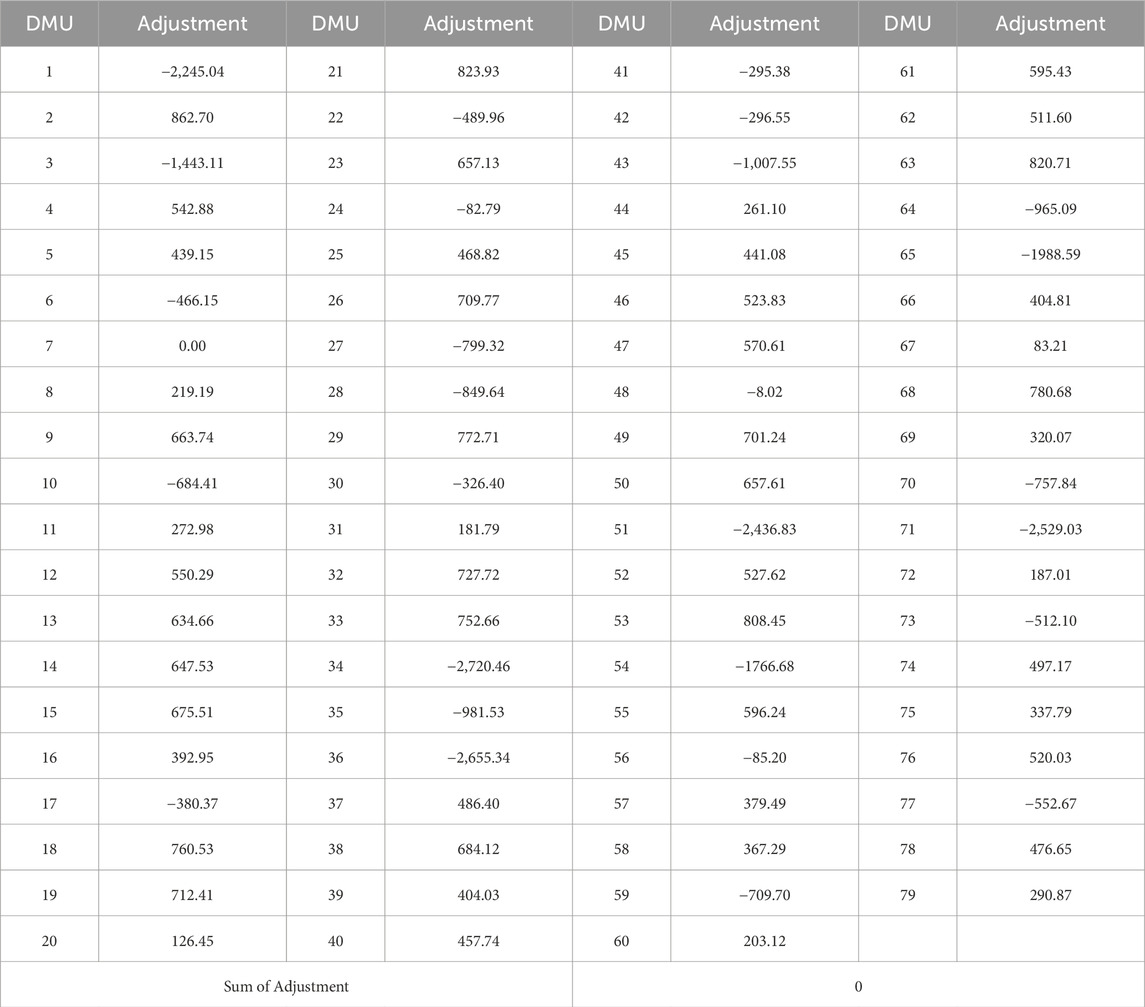
Table 3. Optimal adjustments.
The public equilibrium efficient frontier can be set based on the most favorable alteration and the efficiency of the two systems can be evaluated accordingly, and the results are shown in column 4 of Table 4.
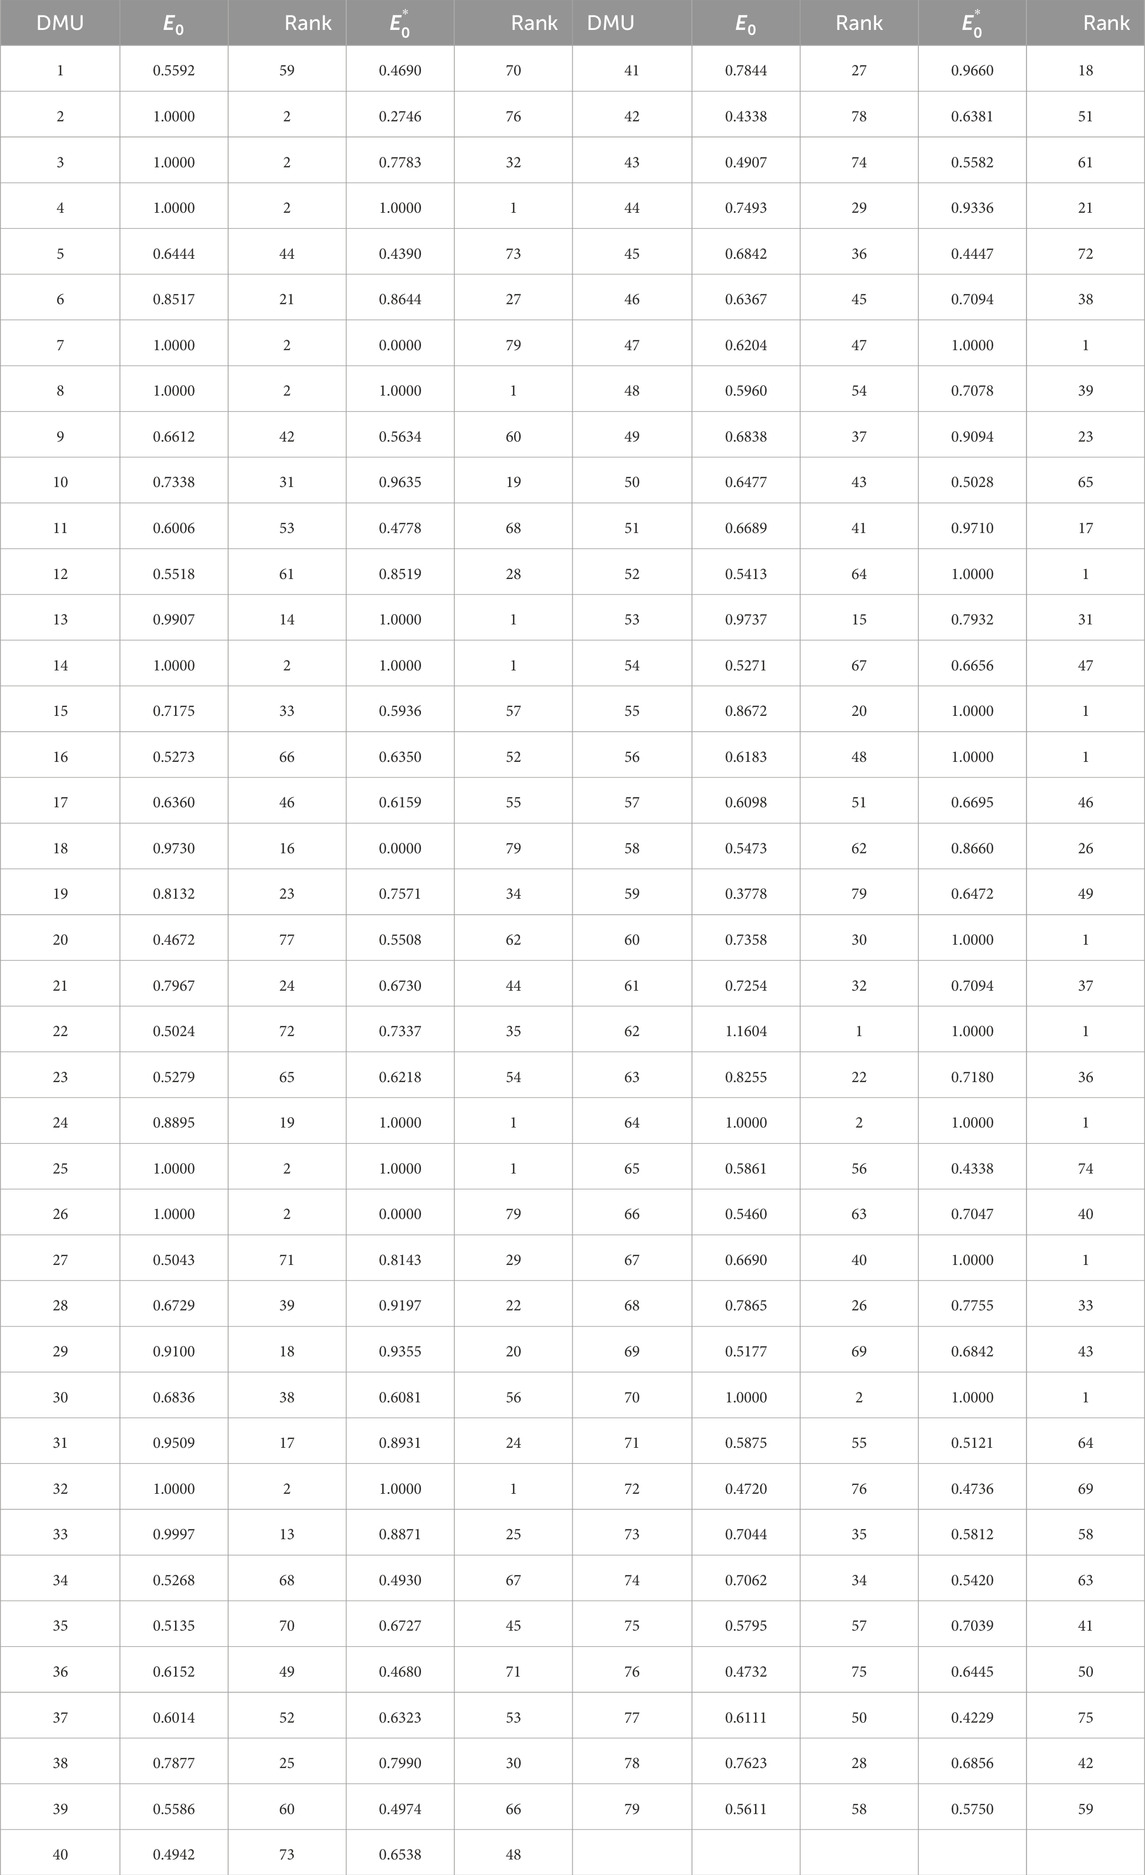
Table 4. Efficiency and ranking of model (Equation 3) and model (Equation 9).
In terms of the amount of funding allocated, “985 Project” colleges and universities receive more funding than “non-985 Project” colleges and universities. For example, “985 Project” colleges include Decision Unit 1 (2,245), Decision Unit 3 (3140.1), Decision Unit 54 (2,561.9), Decision Unit 7 (1740.2), and Decision Unit 4 (3185.5). “Non-985 Project” universities such as Decision Unit 19 (144.19), Decision Unit 21 (207.91) and Decision Unit 55 (201.24). This shows that there is a significant gap in government funding between “985-project” and “non-985-project” colleges and universities.
Several insights can be gleaned from the data presented in Table 4. Firstly, there is a pronounced disparity in the efficiency of Chinese research universities. Certain decision-making units (DMUs), such as 4, 8, and 13, achieve the maximum efficiency score of 1, indicating optimal performance. In contrast, DMU 2 has a significantly lower efficiency score of only 0.2746. The average efficiency across the 79 universities surveyed is 0.7125. The presence of super-efficiency scores inflates this average, suggesting that the actual potential for improvement in real-world scenarios is likely to be greater than the 28.75% implied by the average efficiency score. Secondly, the performance of “Project 985” universities does not always meet expectations. For instance, DMU 2 has an efficiency score of 0.2746, DMU 1 scores 0.4690, and DMU 11 scores 0.4778. Typically, “985 Project” universities are known for their academic prowess and prestige and are often tasked with managing national key R&D programs. These programs tend to focus on critical science and technology issues related to industrial competitiveness, independent innovation capabilities, and national security. The lengthy and challenging nature of these research endeavors could explain the lower efficiency scores observed. Finally, there is no clear correlation between geographic location and efficiency. Certain institutions located in regions with less robust economic development have been observed to surpass the performance of similar universities in economically affluent areas. This suggests that the level of economic development in a region does not serve as a direct indicator of the progress of its research universities. However, it is acknowledged that high-performing research universities can contribute to the economic development of their local regions.
This paper develops a specialized DEA method, grounded in synergy theory, to evaluate the efficiency of Chinese research universities, with a focus on outcome transformation. The model surmounts previous limitations by accounting for non-shared fixed and variable inputs within a network structure, providing a comprehensive assessment of DMUs in complex systems.
The study recommends that universities adhere to collaborative innovation theory to enhance research efficiency, involving all stakeholders. Governments should support and safeguard scientific achievements, while enterprises should leverage innovation to increase the application value of research. Financial institutions should back scientific endeavors, and technology transfer organizations should facilitate resource integration and innovation. A collaborative system involving these entities can improve evaluation services and drive economic progress through scientific applications.
To optimize Government Grant Funds (GGF) allocation, central administrators must accurately assess research activities and implement efficient funding mechanisms. Despite the suboptimal efficiency of some “985 Project” universities, their pursuit of advanced science and technology involves significant investments and risks. Administrators should monitor tech trends and understand the long cycles of innovation.
In conclusion, this study presents an innovative DEA approach for assessing Chinese research universities’ performance in outcome transformation, acknowledging the need for future research to address technological diversity and radial measure limitations in DEA methods.
The datasets presented in this study can be found in online repositories. The names of the repository/repositories and accession number(s) can be found in the article/supplementary material.
YM: Writing–review and editing. MX: Writing–original draft.
The author(s) declare financial support was received for the research, authorship, and/or publication of this article. This research is supported by the Double First-class Discipline Construction Project (PA2024GDGP0032) in Hefei University of Technology, the Provincial Quality Engineering Project of Colleges and Universities (2023jyjxggyjY034) and the Hefei University of Technology Teaching Quality and Teaching Reform Project (JYQN2216).
The authors are also grateful to Professor Tao Ding’s guidance on this paper.
Author YM was employed by Anhui Sanxiang Technology Consulting Co., Ltd.
The remaining author declares that the research was conducted in the absence of any commercial or financial relationships that could be construed as a potential conflict of interest.
The author(s) declare that no Generative AI was used in the creation of this manuscript.
All claims expressed in this article are solely those of the authors and do not necessarily represent those of their affiliated organizations, or those of the publisher, the editors and the reviewers. Any product that may be evaluated in this article, or claim that may be made by its manufacturer, is not guaranteed or endorsed by the publisher.
DEA, Data Envelopment Analysis; DMU, Decision-Making Unit; GGF, Government Grant Funds; FSODEA, Fixed-Sum Output DEA; EEFDEA, Equilibrium Efficiency Frontier DEA; GEEFDEA, Generalized Equilibrium Efficiency Frontier DEA; R&D, Research and Development; FS, Number of teachers; GGF, Government Grant Funds; RF, Research funding; AS, Awards; PM, Publication of monographs; PP, Published papers; TNS, Number of Natural Science Funds; TTI, Income from technology transfer.
1. Lehmann EE, Meoli M, Paleari S, Stockinger SA. Approaching effects of the economic crisis on university efficiency: a comparative study of Germany and Italy. Eurasian Business Rev (2018) 8:37–54. doi:10.1007/s40821-017-0091-7
2. Martínez-Campillo A, Fernández-Santos Y. The impact of the economic crisis on the (in) efficiency of public Higher Education institutions in Southern Europe: the case of Spanish universities. Socio-Economic Plann Sci (2020) 71:100771. doi:10.1016/j.seps.2019.100771
4. Cook WD, Liang L, Zhu J. Measuring performance of two-stage network structures by DEA: a review and future perspective. Omega (2010) 38(6):423–30. doi:10.1016/j.omega.2009.12.001
5. Kao C, Hung HT. Efficiency analysis of university departments: an empirical study. Omega (2008) 36(4):653–64. doi:10.1016/j.omega.2006.02.003
6. Kao C, Lin PH. Qualitative factors in data envelopment analysis: a fuzzy number approach. Eur J Oper Res (2011) 211(3):586–93. doi:10.1016/j.ejor.2010.12.004
7. Azizi H, Jahed R. Improved data envelopment analysis models for evaluating interval efficiencies of decision-making units. Comput and Ind Eng (2011) 61(3):897–901. doi:10.1016/j.cie.2011.04.017
8. Villano RA, Tran CDT. Performance of private higher education institutions in Vietnam: evidence using DEA-based bootstrap directional distance approach with quasi-fixed inputs. Appl Econ (2018) 50(55):5966–78. doi:10.1080/00036846.2018.1488077
9. Lu WM. Intellectual capital and university performance in Taiwan. Econ Model (2012) 29(4):1081–9. doi:10.1016/j.econmod.2012.03.021
10. Chang TY, Chung PH, Hsu SS. Two-stage performance model for evaluating the managerial efficiency of higher education: application by the Taiwanese tourism and leisure department. J Hospitality, Leis Sport and Tourism Education (2012) 11(2):168–77. doi:10.1016/j.jhlste.2012.04.003
11. An Q, Yang M, Chu J, Wu J, Zhu Q. Efficiency evaluation of an interactive system by data envelopment analysis approach. Comput and Ind Eng (2017) 103:17–25. doi:10.1016/j.cie.2016.10.010
12. Zhang L, Guo C, Wei F. Multistage network data envelopment analysis: semidefinite programming approach. J Oper Res Soc (2019) 70(8):1284–95. doi:10.1080/01605682.2018.1489348
13. Yang GL, Fukuyama H, Song YY. Measuring the inefficiency of Chinese research universities based on a two-stage network DEA model. J Informetrics (2018) 12(1):10–30. doi:10.1016/j.joi.2017.11.002
14. Wang X, Hu H, Xie C. Auditing the efficiency of the nation-funded social science research with data envelopment analysis. INFOR: Inf Syst Oper Res (2019) 57(2):165–86. doi:10.1080/03155986.2018.1533208
15. Ding T, Yang J, Wu H, Wen Y, Tan C, Liang L. Research performance evaluation of Chinese university: a non-homogeneous network DEA approach. J Management Sci Eng (2021) 6(4):467–81. doi:10.1016/j.jmse.2020.10.003
16. Chen Y, Ma X, Yan P, Wang M. Operating efficiency in Chinese universities: an extended two-stage network DEA approach. J Management Sci Eng (2021) 6(4):482–98. doi:10.1016/j.jmse.2021.08.005
17. Xiong B, Wu J. Performance measurement in the parallel interdependent processes systems under decentralized and centralized modes. J Oper Res Soc (2021) 72(11):2442–59. doi:10.1080/01605682.2020.1796534
18. Xiong X, Yang GL, Zhou DQ, Wang ZL. How to allocate multi-period research resources? Centralized resource allocation for public universities in China using a parallel DEA-based approach. Socio-Economic Plann Sci (2022) 82:101317. doi:10.1016/j.seps.2022.101317
19. Chen X, Liu X, Zhu Q, Jiang J. R&D innovation efficiency of Chinese high-tech industries: three-stage network approach with fairness consideration. J Oper Res Soc (2022) 73(7):1562–77. doi:10.1080/01605682.2021.1920346
20. Moon H, Min D. Assessing energy efficiency and the related policy implications for energy-intensive firms in Korea: DEA approach. Energy (2017) 133:23–34. doi:10.1016/j.energy.2017.05.122
21. Alizadeh R, Beiragh RG, Soltanisehat L, Soltanzadeh E, Lund PD. Performance evaluation of complex electricity generation systems: a dynamic network-based data envelopment analysis approach. Energ Econ (2020) 91:104894. doi:10.1016/j.eneco.2020.104894
22. Lins MPE, Gomes EG, de Mello JCCS, de Mello AJRS. Olympic ranking based on a zero sum gains DEA model. Eur J Oper Res (2003) 148(2):312–22. doi:10.1016/S0377-2217(02)00687-2
23. Gomes EG, Lins MPE. Modelling undesirable outputs with zero sum gains data envelopment analysis models. J Oper Res Soc (2008) 59(5):616–23. doi:10.1057/palgrave.jors.2602384
24. Li F, Wang Y, Liang L. A two-stage efficiency evaluation method for DEA with shared output fixed and constrained. China Management Sci (in Chinese) (2023) 31(11):268–78. doi:10.16381/j.cnki.issn1003-207x.2021.1432
25. Ding T, Zhang Y, Zhang D, Li F. Performance evaluation of Chinese research universities: a parallel interactive network DEA approach with shared and fixed sum inputs. Socio-Economic Plann Sci (2023) 87:101582. doi:10.1016/j.seps.2023.101582
26. Altundemir ME. The impact of the financial crisis on American public universities. Int J Business Soc Sci (2012) 3(8):190–8. doi:10.6017/ihe.2012.3.8.21
27. Marire J. Are South African public universities economically efficient? Reflection amidst higher education crisis. South Afr J Higher Education (2017) 31(3):116–37. doi:10.20853/31-3-1037
28. Wolinsky H. The crash reaches the universities: the global financial crisis threatens private and public university funding in the USA and Europe. EMBO Rep (2009) 10(3):209–11. doi:10.1038/embor.2009.17
29. Banker RD, Charnes A, Cooper WW. Some models for estimating technical and scale inefficiencies in data envelopment analysis. Management Sci (1984) 30(9):1078–92. doi:10.1287/mnsc.30.9.1078
30. Charnes A, Cooper WW, Rhodes E. Measuring the efficiency of decision making units. Eur J Oper Res (1978) 2(6):429–44. doi:10.1016/0377-2217(78)90138-8
31. Li F, Zhang D, Zhang J, Kou G. Measuring the energy production and utilization efficiency of Chinese thermal power industry with the fixed-sum carbon emission constraint. Int J Prod Econ (2022) 252:108571. doi:10.1016/j.ijpe.2022.108571
32. Chen L, Guo M, Li Y, Liang L, Salo A. Efficiency intervals, rank intervals and dominance relations of decision-making units with fixed-sum outputs. Eur J Oper Res (2021) 292(1):238–49. doi:10.1016/j.ejor.2020.10.024
33. Bian Y, Hu M, Xu H. Measuring efficiencies of parallel systems with shared inputs/outputs using data envelopment analysis. Kybernetes (2015) 44(3):336–52. doi:10.1108/k-04-2014-0067
34. Li L, Dai Q, Huang H, Wang S. Efficiency decomposition with shared inputs and outputs in two-stage DEA. J Syst Sci Syst Eng (2016) 25:23–38. doi:10.1007/s11518-016-5298-0
35. Liu JB, Zhang X, Cao J, Chen L. Mean first-passage time and robustness of complex cellular mobile communication network. IEEE Trans Netw Sci Eng(2024) 11:3066–76. doi:10.1109/tnse.2024.3358369
36. Liu JB, Zheng YQ, Lee CC. Statistical analysis of the regional air quality index of Yangtze River Delta based on complex network theory. Appl Energ(2024) 357:122529. doi:10.1016/j.apenergy.2023.122529
37. Liu JB, Wang X, Cao J. The coherence and properties analysis of balanced 2p-Ary tree networks. IEEE Trans Netw Sci Eng(2024) 11:4719–28. doi:10.1109/tnse.2024.3395710
38. Yang M, Li YJ, Liang L. A generalized equilibrium efficient frontier data envelopment analysis approach for evaluating DMUs with fixed-sum outputs. Eur J Oper Res (2015) 246(1):209–17. doi:10.1016/j.ejor.2015.04.023
39. Seiford LM, Zhu J. Modeling undesirable factors in efficiency evaluation. Eur J Oper Res (2002) 142(1):16–20. doi:10.1016/s0377-2217(01)00293-4
40. Yang F, Wu DD, Liang L, O’Neill L. Competition strategy and efficiency evaluation for decision making units with fixed-sum outputs. Eur J Oper Res (2011) 212(3):560–9. doi:10.1016/j.ejor.2011.02.029
41. Yang M, Li Y, Chen Y, Liang L. An equilibrium efficiency frontier data envelopment analysis approach for evaluating decision-making units with fixed-sum outputs. Eur J Oper Res (2014) 239(2):479–89. doi:10.1016/j.ejor.2014.05.013
42. Danowski JA. Identifying collaborative innovation networks: at the inter-departmental level. Procedia-Social Behav Sci (2010) 2(4):6404–17. doi:10.1016/j.sbspro.2010.04.050
43. Johnes J, Li YU. Measuring the research performance of Chinese higher education institutions using data envelopment analysis. China Econ Rev (2008) 19(4):679–96. doi:10.1016/j.chieco.2008.08.004
44. An Q, Wang Z, Emrouznejad A, Zhu Q, Chen X. Efficiency evaluation of parallel interdependent processes systems: an application to Chinese 985 Project universities. Int J Prod Res(2019) 57(17):5387–99. doi:10.1080/00207543.2018.1521531
Keywords: financial crisis, university performance evaluation, data envelopment analysis, synergy theory, complex systems
Citation: Ma Y and Xu M (2025) Financial crisis impact on the efficiency evaluation of university research achievements transformation: a study based on fixed and interactive network data envelopment analysis methods. Front. Phys. 13:1553788. doi: 10.3389/fphy.2025.1553788
Received: 31 December 2024; Accepted: 14 February 2025;
Published: 18 March 2025.
Edited by:
Brian Lucey, Trinity College Dublin, IrelandReviewed by:
Amar Oukil, Sultan Qaboos University, OmanCopyright © 2025 Ma and Xu. This is an open-access article distributed under the terms of the Creative Commons Attribution License (CC BY). The use, distribution or reproduction in other forums is permitted, provided the original author(s) and the copyright owner(s) are credited and that the original publication in this journal is cited, in accordance with accepted academic practice. No use, distribution or reproduction is permitted which does not comply with these terms.
*Correspondence: Mingqian Xu, MjAyMjIxMjc2NkBtYWlsLmhmdXQuZWR1LmNu
Disclaimer: All claims expressed in this article are solely those of the authors and do not necessarily represent those of their affiliated organizations, or those of the publisher, the editors and the reviewers. Any product that may be evaluated in this article or claim that may be made by its manufacturer is not guaranteed or endorsed by the publisher.
Research integrity at Frontiers
Learn more about the work of our research integrity team to safeguard the quality of each article we publish.