
94% of researchers rate our articles as excellent or good
Learn more about the work of our research integrity team to safeguard the quality of each article we publish.
Find out more
ORIGINAL RESEARCH article
Front. Phys., 02 April 2025
Sec. Social Physics
Volume 13 - 2025 | https://doi.org/10.3389/fphy.2025.1553640
 Quanlong Fan1
 Gang Xu2*
To address the challenge of efficiently integrating multi-source heterogeneous data to improve the accuracy of public safety event prediction, this study proposes and validates a novel public safety event prediction model, GATPNet, based on multi-source heterogeneous data. The model integrates Graph Attention Networks (GAT), Spatiotemporal Transformers, and Proximal Policy Optimization (PPO) to achieve effective data fusion, spatiotemporal feature extraction, and real-time decision support. Through experiments conducted on the Los Angeles Crime Data and CrisisLexT26 datasets, this study demonstrates that GATPNet outperforms other baseline models. On the Los Angeles Crime Data dataset, GATPNet achieved an accuracy of 90%, recall of 89%, Spatiotemporal Prediction Accuracy (STPA) of 80%, and a response time of 1.9 s, showing a 5% improvement in accuracy and a 10% improvement in STPA over the best baseline method. On the CrisisLexT26 dataset, it achieved an accuracy of 89%, recall of 88%, STPA of 78%, and a response time of 2.1 s, showing a 4% improvement in accuracy and a 6% improvement in STPA over the best baseline method. Additionally, ablation experiments further indicate that each module plays a critical role in improving overall performance. Despite the model’s high computational complexity when handling large-scale heterogeneous data and the limited coverage of the datasets, GATPNet still demonstrates its broad application potential in public safety event prediction and management, offering effective technical support for social governance and emergency management.
In today’s society, the frequent and complex nature of public safety incidents has made effective monitoring and prediction a critical issue. The occurrence of public safety events, such as crimes, natural disasters, and emergencies, often has significant impacts on social stability and economic development [1]. Traditional methods for monitoring public safety typically rely on a single data source or expert experience for predictions. These approaches are not designed to accommodate or leverage multiple data sources/types and cannot efficiently handle large volumes of information, which makes them inadequate in addressing the growing complexity and diversity of data in the modern era [2]. Therefore, constructing an intelligent system capable of analyzing multi-source heterogeneous data and predicting public safety incidents in real time is of great significance.
Public safety event data is highly heterogeneous and comes from diverse sources, such as real-time updates from social media, environmental data collected by sensors, historical crime records, news reports, and more [3]. These data sources are not only interconnected but also exhibit considerable differences. Effectively integrating and utilizing these multi-source data remains a major challenge in current research [4]. In recent years, the study of multi-source data fusion has gained increasing attention, especially with the use of GNN. By representing different data types as nodes and edges in a graph, GNNs can effectively capture the complex relationships between them [5]. However, issues such as data heterogeneity, noise, and redundancy in multi-source data fusion still pose significant challenges to existing techniques [6].
In addition to the fusion of multi-source heterogeneous data, public safety events have clear temporal and spatial characteristics. The occurrence of an event is influenced not only by a specific location but also by dynamic temporal factors [7]. This requires predictive models to have the capability to capture spatiotemporal features in order to improve the perception and prediction of event dynamics. Spatiotemporal Transformers, as a novel tool for modeling spatiotemporal sequences, can simultaneously handle temporal and spatial dependencies, making them well-suited for feature extraction in complex dynamic scenarios [8]. In public safety prediction, using transformers to capture spatiotemporal features can enhance the model’s sensitivity to complex spatiotemporal patterns and improve its predictive capability.
Predicting public safety events requires not only high accuracy but also real-time response capabilities to enable timely intervention and minimize potential losses [9, 10]. Therefore, effectively integrating decision optimization modules into the model to achieve real-time prediction and emergency management is a key issue in public safety research. Deep Reinforcement Learning (DRL), due to its ability to optimize strategies in dynamic environments, has become an ideal solution for real-time prediction and decision support [11, 12]. In particular, the Proximal Policy Optimization (PPO) algorithm, known for its excellent performance in complex scenarios, can be used to improve decision efficiency in real-time responses [13].
Based on these considerations, this study proposes a novel public safety event prediction model, called GATPNet (Graph-Transformer Proximal Network). Different from the existing technology, the GATPNet model has achieved important technical breakthroughs in multi-source data fusion, spatiotemporal feature extraction and real-time decision support by combining the graph attention network (GAT), spatiotemporal transformer and proximal policy optimization (PPO). The graph attention network (GAT) is used to process heterogeneous data from different data sources, and effectively captures the complex associations between data nodes through the graph structure; the spatiotemporal transformer can dynamically capture the spatiotemporal dependencies in the data, improving the ability to predict the evolution of events; the PPO algorithm optimizes the decision-making efficiency of the model in real-time response through deep reinforcement learning to ensure accurate and timely predictions and effective management of crises/events. The technical innovation of GATPNet is not only reflected in the combination of methods, but also in how to solve the shortcomings of traditional methods in multi-source data fusion and spatiotemporal feature modeling through collaborative optimization between modules.
The main contributions of this study are as follows:
• Proposing a framework for predicting public safety events by integrating multi-source heterogeneous data, overcoming the limitations of traditional single data source analysis.
• Innovatively combining Graph Attention Networks with Spatiotemporal Transformers to effectively capture complex spatiotemporal features.
• Using Deep Reinforcement Learning to optimize real-time decision support, offering a new solution for the dynamic response to public safety events.
Through these innovative designs, our research not only provides a new idea for public safety event prediction, but also provides scientific technical support for emergency management and social governance. Next, this paper will introduce the architecture design, experimental process and results of the proposed model in detail.
With the rapid development of information technology, the data sources in the field of public safety have become increasingly diversified and complex. The fusion of multi-source heterogeneous data has become one of the key technologies for effectively predicting public safety events [14, 15]. These data sources include social media texts, sensor data, historical records, geospatial data, and more, each offering insights into events from different perspectives. For instance, social media data can reflect public sentiment toward an event, while sensor data can provide real-time detection of environmental changes. The challenge lies in how to effectively fuse these diverse and format-different data sources into a comprehensive predictive model for public safety events [16, 17].
Graph Neural Networks (GNN) have gradually emerged as one of the main methods for multi-source heterogeneous data fusion due to their unique advantages in modeling complex data structures. By representing multi-source data as nodes and edges within a graph, GNNs can capture the intricate dependencies and interactions between various data sources. Specifically, GNNs model the interactions between data sources through the edges connecting different nodes [18, 19]. Interactions between data sources can also be represented at the node level, where a node can contain multiple attributes originating from different data sources. For example, GNNs can model how trending topics on social media influence crime rates in specific areas or how sensor data correlates with public sentiment. In particular, the GAT, which adaptively assigns attention weights to different nodes, effectively highlights the influence of key nodes, improving the accuracy of fusion and the model’s interpretability. In recent years, partial multi-label learning has received increasing attention in the field of recommendation systems. In particular, it can effectively improve the accuracy of recommendations by mining the correlation between instances and labels [20]. This method can achieve more accurate label predictions by utilizing the intrinsic correlation between data, thereby improving the multi-label prediction ability of the recommendation system. This method has shown great advantages when processing data with complex label structures, especially in the context of multi-source data fusion.
The application of self-supervised contrastive learning in itinerary recommendations has also gradually attracted the attention of researchers. In this field, researchers have further improved the performance of recommendation systems under limited label conditions by designing self-supervised tasks and using unlabeled data for learning [21]. Through contrastive learning, the model can better capture the potential characteristics of the data and show strong generalization ability in multiple tasks [22]. This method has important reference significance for the prediction of public safety events, especially in the absence of complete label information.
Despite the powerful capabilities of GNNs in multi-source data fusion, there remain several challenges in this domain. Multi-source data is often heterogeneous, with differences in data formats and features that make direct fusion difficult. Additionally, data quality issues, such as noise and redundant information, can negatively impact the fusion process. For example, false information and irrelevant content on social media may lead to model misjudgments [23]. Furthermore, computational complexity is a significant issue, especially when processing large-scale graph data. Balancing prediction performance with computational efficiency remains a critical challenge [24]. To address these issues, this paper combines GAT with Spatiotemporal Transformers and Deep Reinforcement Learning to effectively tackle the challenges in multi-source heterogeneous data fusion.
In public safety events, both temporal and spatial characteristics are crucial factors influencing the occurrence, spread, and evolution of events. Therefore, capturing the spatiotemporal dependencies within data is key to improving prediction accuracy [25]. Spatiotemporal prediction models aim to understand the dynamic changes of events from both temporal and spatial dimensions, enabling more accurate predictions of potential public safety incidents [26]. Traditional spatiotemporal prediction methods typically employ statistical methods or Recurrent Neural Networks (such as LSTM) to handle time series data, but these methods have limitations when capturing complex, long-range spatiotemporal dependencies.
In terms of spatial dependency, traditional GNN methods represent spatial relationships in data by constructing a graph structure, where each node represents a data point (such as a region or location), and the edge represents the relationship between nodes (such as distance or similarity). In this way, GNN can effectively capture spatial dependencies and help understand the interactions between different locations [27]. For example, GNN can effectively capture spatial features by modeling the relationship between regions by learning the edge weights between different nodes. This process enables GNN to provide accurate spatial dependency modeling when processing data with spatial structure.
In recent years, Spatiotemporal Transformers have attracted growing attention from researchers. This model, based on attention mechanisms, can effectively capture long-range spatiotemporal features without suffering from the long-term dependency issues associated with traditional RNNs. The attention mechanism enables the model to flexibly select the most relevant temporal and spatial information for the current prediction, thereby improving the understanding of the dynamic changes in events [28]. For example, in urban crime prediction, a Spatiotemporal Transformer can combine historical crime data, geographical information, and social media data to effectively identify the spatiotemporal evolution patterns of crime hotspots. Although Spatiotemporal Transformers show significant advantages in capturing complex spatiotemporal features, they also face several challenges. The diversity and dynamics of spatiotemporal data demand that the model exhibit a high degree of adaptability, and adjusting the model structure and parameters for different scenarios remains a problem to be solved [29]. Additionally, the computational complexity of the attention mechanism can be high, especially when dealing with large-scale spatiotemporal data, potentially leading to excessive resource consumption. Therefore, the application of Spatiotemporal Transformers requires balancing prediction accuracy with computational efficiency.
This paper uses the Spatiotemporal Transformer module to extract the spatiotemporal features of public safety events, combining them with the fusion results from GNNs to enhance the model’s ability to perceive and predict dynamic public safety events. This approach not only effectively fuses multi-source data but also captures the spatiotemporal variations in the data, providing a more precise solution for predicting public safety events.
Real-time response and intelligent decision-making present another key challenge in public safety event prediction, particularly when dealing with complex, dynamic environments where traditional static models often fail to respond effectively to emergencies. Deep Reinforcement Learning (DRL) has gradually become an important research direction in public safety due to its ability to optimize strategies in dynamic environments [30–32]. By using DRL, a system can learn the optimal strategy through continuous interaction with the environment, thus improving its efficiency in responding to sudden events and its decision-making capability.
Proximal Policy Optimization (PPO), an advanced algorithm in DRL, is particularly well-suited for real-time decision-making scenarios in public safety due to its computational stability and efficient policy updates. PPO limits the magnitude of policy updates to prevent instability caused by excessive changes, achieving high stability and convergence speed. In public safety event prediction, PPO can help the model quickly adjust its prediction and decision-making strategies after acquiring new data, ensuring timely responses to dynamic risk situations. However, applying DRL in public safety also presents challenges, such as dealing with high-dimensional state spaces and continuous decision problems, as well as addressing low sample efficiency during training [3, 33]. Moreover, the real-time requirements necessitate high efficiency in both training and inference processes to ensure that the system can make decisions at the moment an event occurs. To address this, this paper employs a strategy that combines DRL with edge computing, offloading some inference tasks to edge nodes for processing, thereby reducing latency and improving real-time response capabilities [34, 35].
Deep Reinforcement Learning, particularly PPO, has shown significant potential in the real-time prediction and emergency decision-making of public safety events [36–38]. By applying PPO to the real-time decision module of GATPNet, this study ensures that the model not only predicts public safety events accurately but also makes rapid and reasonable decisions in complex dynamic environments. Through this combination, the research offers a new solution for intelligent response and risk management in public safety events.
To achieve accurate prediction and real-time decision support for public safety events, this paper proposes a novel public safety event prediction model, GATPNet (Graph-Transformer Proximal Network). The model combines Graph Attention Networks (GAT), Spatiotemporal Transformers, and the Proximal Policy Optimization (PPO) algorithm, aiming to extract effective features from multi-source heterogeneous data, capture complex spatiotemporal dependencies, and provide real-time decision support. Figure 1 illustrates the overall architecture of GATPNet, which consists of three core modules: the multi-source data fusion module, the spatiotemporal feature extraction module, and the real-time decision module.
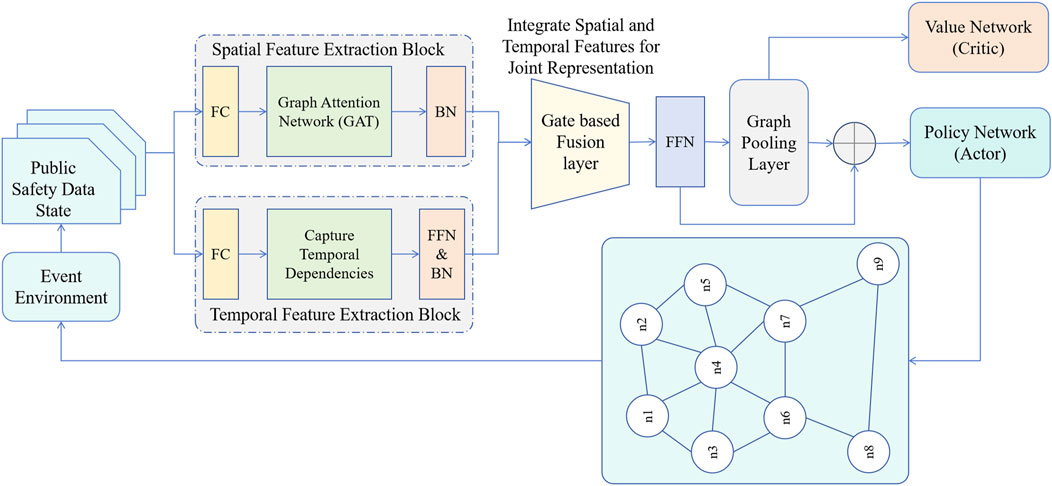
Figure 1. Overall architecture of GATPNet.
As shown in Figure 1, the overall process of GATPNet flows from data input to final prediction output. Data from multiple sources, including social media texts, sensor data, and historical crime records, are preprocessed and input into the multi-source data fusion module. In this module, Graph Attention Networks (GAT) are used to construct these heterogeneous data into a graph structure, where nodes represent different data types, and edges represent the relationships between them. Through the graph attention mechanism, the model assigns appropriate weights to each edge and node, emphasizing the influence of key nodes and effectively addressing the challenge of fusing heterogeneous data.
We preprocessed each data appropriately. Social media text data was first cleaned by removing noise, stop words, and punctuation, and then a pre-trained BERT model was used to convert each tweet into a 768-dimensional vector representation. For historical crime data, we standardized the location information and discretized the time data by hour. Sensor data was cleaned and normalized to ensure compatibility between different data sources. In this way, GAT is able to fuse data from different sources in a graph and capture the complex relationships between different data sources.
After the multi-source data fusion, the embedded features generated by the graph are fed into the spatiotemporal feature extraction module. The core of this module is the Spatiotemporal Transformer, which captures the temporal and spatial dependencies in public safety events. Time and space are two crucial dimensions in public safety events, often exhibiting specific spatiotemporal patterns, such as the trend of increased crime rates in a particular area during certain time periods. The Spatiotemporal Transformer, through the attention mechanism, flexibly selects the most relevant time points and geographical regions, allowing it to effectively extract long-range dynamic features and enhance sensitivity to complex spatiotemporal patterns.
The features extracted by the Spatiotemporal Transformer are then passed to the real-time decision module, which is based on the Proximal Policy Optimization (PPO) algorithm from Deep Reinforcement Learning. The introduction of the PPO algorithm ensures that the model can respond quickly to dynamically changing environments. By continuously interacting with the environment, the PPO model refines its strategies, enabling the system to provide timely warnings and action suggestions in the face of sudden public safety incidents. Additionally, to improve the speed of real-time response, some inference tasks are deployed to edge nodes, utilizing edge computing to reduce latency and ensure the model can react immediately when an event occurs.
Figure 1 also shows the feedback loop mechanism, where the prediction results are used to further adjust and optimize the parameters of each module. This feedback mechanism allows GATPNet to not only adapt to current data changes but also continuously learn and improve, enhancing both prediction accuracy and real-time responsiveness. The multi-source data fusion, spatiotemporal feature extraction, and real-time decision-making modules work in synergy, forming a powerful public safety event prediction system with strong analytical and real-time response capabilities. Through the coordinated operation of these three core modules, GATPNet addresses the key challenges in public safety event prediction, including multi-source data fusion, capturing spatiotemporal dependencies, and providing real-time responses, making it a promising intelligent prediction and decision-making system with broad applications in the field of public safety.
In GATPNet, the multi-source data fusion module forms the foundation of the entire model. It is responsible for effectively integrating data from different sources, providing a unified representation for subsequent spatiotemporal feature extraction and decision optimization. Figure 2 shows the specific structure of the multi-source data fusion module, where we use the Graph Attention Network (GAT) to perform multi-source data fusion and representation learning. The goal of this module is to construct a graph structure that connects data nodes of different types, and use the attention mechanism to assign different importance weights to each node, enabling efficient fusion of multi-source data.
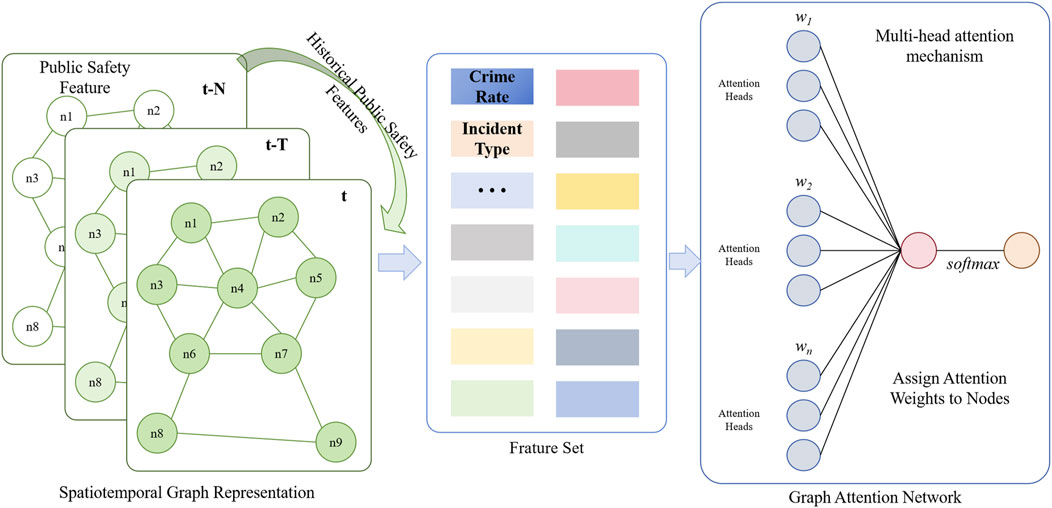
Figure 2. Multi-source Heterogeneous Data Fusion Process Using Graph Attention Network (GAT). This diagram includes the representation of each data node, the process of attention weight calculation, and the multi-head attention mechanism, illustrating the complete process from input to fused feature output.
As shown in Figure 2, each node represents a data source, such as social media data, sensor data, or historical crime data. The edges between nodes represent the potential relationships between these data sources [39]. After constructing the graph structure, the graph attention mechanism is used to learn the relationships between each node and its neighbors, focusing on the nodes that play a key role in the prediction task. The graph attention network calculates the attention weight between node
where
The feature update for each node is performed through a weighted sum, using the following formula:
where
To further improve the model’s expressive power, we employ a multi-head attention mechanism for node feature updates. We use
With the multi-head attention mechanism, the model can model node relationships from multiple perspectives, enhancing the robustness and accuracy of the fused features.
At the end of the multi-source data fusion module, the generated fused features are further input into the spatiotemporal feature extraction module to capture the spatiotemporal dependencies of public safety events. In this way, the Graph Attention Network achieves efficient fusion of heterogeneous data, not only improving the utilization of data but also providing more accurate and comprehensive inputs for subsequent spatiotemporal feature extraction and real-time decision-making.
In the GATPNet model, the spatiotemporal feature extraction module is one of the core components of the system. Its objective is to effectively capture the temporal and spatial dependencies from the data after multi-source fusion. Figure 3 illustrates the specific structure of the spatiotemporal feature extraction module, where we use a Spatiotemporal Transformer to handle the temporal and spatial features of the data, efficiently capturing dynamic changes over long time spans and across spatial dimensions through the attention mechanism.
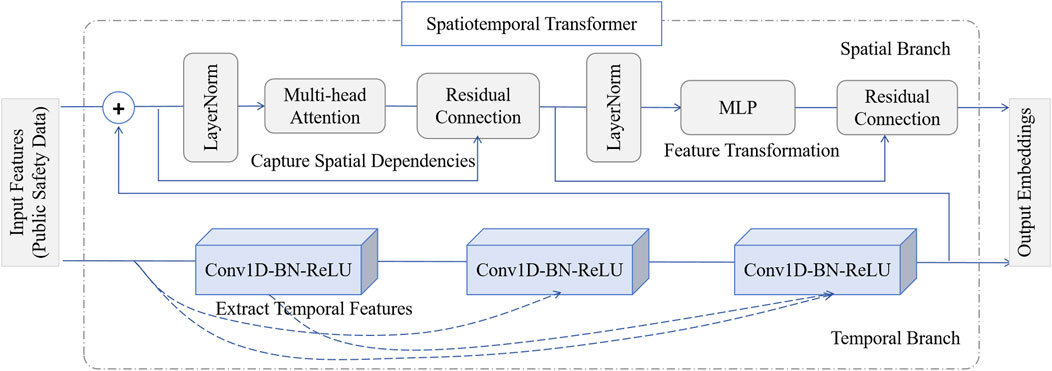
Figure 3. Spatiotemporal feature extraction module based on spatiotemporal transformer.
As shown in Figure 3, the feature representations output by the multi-source data fusion module are input into the spatiotemporal feature extraction module. The model first encodes the input fused features, representing the data at each time step as a high-dimensional vector, denoted as
The Spatiotemporal Transformer module retains the temporal order information using positional encoding [41, 42], which is formulated as follows:
where
Next, the input features undergo multi-head self-attention, extracting the importance of features across both time and space. For each time step
where
where each
To further enhance the model’s expressive power, the features after attention computation undergo a nonlinear transformation using a feed-forward neural network (FFN):
The feed-forward network allows for further nonlinear combination of the attention output features, improving the feature representation. Each layer of the Spatiotemporal Transformer includes residual connections and layer normalization to ensure smooth information flow and network training stability:
By stacking multiple layers of Spatiotemporal Transformers, the model progressively extracts deeper spatiotemporal features from the input data. The resulting feature representation not only captures the temporal evolution patterns of the data but also identifies spatial dependencies.
Finally, the output features of the spatiotemporal feature extraction module are input into the real-time decision module, which is used to make dynamic decisions in response to public safety events. The Spatiotemporal Transformer effectively models both temporal and spatial information, allowing GATPNet to better capture the complex dynamic features of public safety events, providing rich and accurate input features for the subsequent real-time decision module.
In GATPNet, the real-time decision module is a critical component for implementing model prediction and emergency response. Its primary goal is to quickly take the optimal action after detecting potential risks of public safety events, thereby minimizing the negative impacts of such events. Figure 4 illustrates the structure of the real-time decision module, which employs the Proximal Policy Optimization (PPO) algorithm. By continuously interacting with the environment, PPO learns the optimal strategy in dynamic scenarios, enabling efficient responses to public safety incidents.
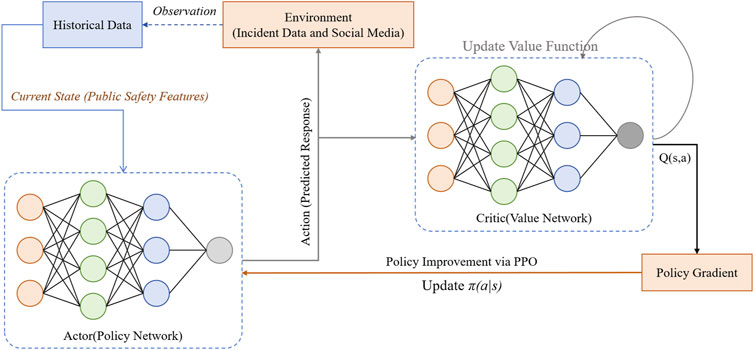
Figure 4. Real-time Decision Module Based on Proximal Policy Optimization (PPO). The PPO algorithm optimizes the policy by using a clipped objective function, ensuring stable learning.
The real-time decision module first receives the input features from the spatiotemporal feature extraction module, represented as a state vector
where
To ensure the stability of policy updates, PPO introduces a probability ratio constraint and optimizes the policy using a clipped objective function, limiting the magnitude of policy updates. This is defined as:
where
In the real-time decision module, estimating the advantage function
where
The PPO module uses a policy network and a value network to make decisions and evaluate the value of states. The policy network is responsible for generating the optimal action, while the value network estimates the long-term return for each state. Together, these networks enable the model to make real-time decisions by continuously interacting with the environment, considering both short-term and long-term rewards to choose the optimal action. This stability and efficiency enable GATPNet to make quick and reasonable decisions when facing sudden events, thus reducing the potential harm of the events.
In this paper, we selected two publicly available datasets for experimental validation: Los Angeles Crime Data and CrisisLexT26, which cover different aspects of public safety events, including crime data and social media data. Table 1 summarizes the basic information about the two datasets.

Table 1. Overview of the Los Angeles Crime Data and CrisisLexT26 Datasets, showing the source, data type, scale, and specific use of each dataset in the model.
The Los Angeles Crime Data is a crime dataset from the public data platform of the city of Los Angeles, containing historical crime records from recent years, specifically from 2018 to 2022. This dataset provides detailed information on crime types, time, location, etc., with a total of approximately 200,000 records [45]. Using this data, we can analyze the spatiotemporal distribution characteristics of crime events and identify high-crime areas and time periods. This information helps the model make efficient predictions in public safety and identify crime hotspots.
CrisisLexT26 is a social media dataset primarily consisting of tweets related to public safety from Twitter. This dataset includes tweets from 26 major crisis events, covering various types such as natural disasters, social unrest, etc., with a total of about 1 million tweets [46]. These tweets span from 2011 to 2020, corresponding to the timeframes of the respective crisis events. The dataset is labeled with sentiment and crisis-related tags, which can be used to capture public sentiment and reactions to emergencies. This information provides crucial input for the model’s application in emergency management, allowing the model to better understand social responses and assist in decision-making.
In the data preprocessing stage, the Los Angeles Crime Data and CrisisLexT26 datasets were first denoised. For the crime dataset, location information was standardized, and the latitude and longitude were rounded to six decimal places to ensure geographic precision. The time data was discretized by segmenting the crime events by hour to capture temporal pattern changes. For the CrisisLexT26 dataset, tweet data was first cleaned by removing URLs, punctuation, and stop words. Then, a pre-trained BERT model was used to encode the tweets, converting them into 768-dimensional vector representations for input into the Graph Attention Network. To further improve the data quality, a threshold method was applied to filter out noisy data. In the Los Angeles Crime Data, records with incomplete location information (such as events missing latitude and longitude) were removed, totaling approximately 2% of the data. In the CrisisLexT26 dataset, extremely short tweets (less than 5 characters) or tweets lacking useful information were deleted. After cleaning, the dataset size was reduced to about 950,000 tweets. The preprocessed datasets were then input into the Graph Attention Network (GAT) for multi-source data fusion, capturing the complex relationships between the data sources.
The hardware environment for this experiment uses high-performance GPUs for acceleration, specifically employing the NVIDIA Tesla V100 to handle the complex computations in model training. The software environment is based on the Python programming language and the PyTorch framework for implementing deep learning models. Additionally, for handling graph-structured data, the model utilizes DGL (Deep Graph Library) to build the graph neural network components. In terms of training parameters, the model uses an initial learning rate of 0.001, a batch size of 64, and 200 training epochs. The Adam optimizer is employed to ensure fast convergence. For the PPO module, a clipping range of
Table 2 summarizes the hardware and software environment, along with the parameter settings, for clarity and reproducibility of the experimental process.
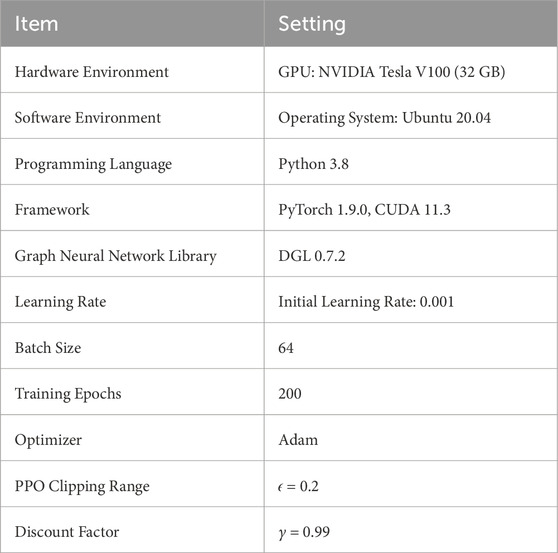
Table 2. Experimental environment and parameter settings.
To evaluate the model’s performance, the following key metrics were selected:
Accuracy is used to assess the overall correctness of the model in predicting public safety events:
Recall measures the model’s ability to correctly identify actual public safety events. The higher the recall, the better the model is at capturing real public safety incidents
Spatiotemporal Prediction Accuracy (STPA) evaluates the model’s accuracy in predicting events in both time and space, based on the deviations between predicted and actual locations and times:
where
Real-time Response Time measures the time it takes for the model to process input data and make a prediction, in seconds. Shorter response times indicate quicker predictions and decision-making.
These evaluation metrics cover the model’s prediction accuracy, event recognition ability, spatiotemporal prediction accuracy, and real-time performance. Together, they provide a comprehensive assessment of GATPNet’s performance in predicting public safety events. By examining the results of these metrics, we can gain a deeper understanding of the model’s performance across various aspects and further optimize the model.
Figure 5 shows the training and validation loss curves of the GATPNet model on the Los Angeles Crime Data and CrisisLexT26 datasets, with the blue and orange solid lines representing the training losses, while the blue and orange dashed lines represent the validation losses.
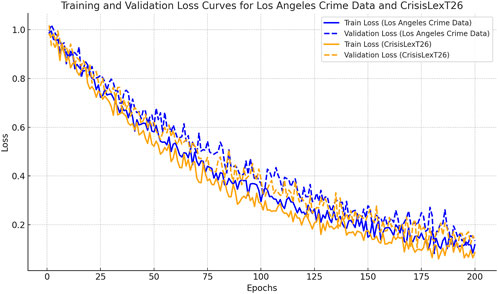
Figure 5. Training and validation loss curves on Los Angeles Crime data and CrisisLexT26 datasets.
As shown in the figure, the training and validation losses on both datasets gradually decrease with the increase in training epochs and stabilize in the later stages. This indicates that the model’s learning process is effective and has gradually reached a stable state. During the first 50 epochs, the loss decreases relatively quickly, which reflects the model’s ability to rapidly learn significant features from the data in the initial stages, leading to a quick reduction in training error. As training continues, the rate of loss reduction slows down, and after approximately 150 epochs, it stabilizes, indicating that the model has gradually converged. Further observation of the curves reveals that the overall trends of training and validation losses on both datasets are consistent, suggesting that the model has good generalization performance in both training and validation phases, without significant overfitting.
In particular, on the Los Angeles Crime Data, the training and validation losses remain very close throughout, indicating that the model has strong generalization ability in predicting crime data. On the CrisisLexT26 dataset, although the training loss is slightly lower than the validation loss, the gap between the two is minimal, suggesting that the model can maintain reasonable prediction performance on complex social media data.
However, noise in the loss curves is present throughout the entire training process. This is likely due to the heterogeneity and complexity of the data. The CrisisLexT26 dataset, sourced from social media, is often characterized by high randomness and noise, which can cause fluctuations in the loss during training. Despite some fluctuations, the overall loss trend continues to decrease, and the amplitude of the fluctuations gradually reduces in the later stages, reflecting the model’s gradual adaptation to and learning from these complex data features. The overall decrease and gradual convergence of the loss curves show that the training process on both datasets is effective and stable, successfully minimizing both training and validation errors during the parameter optimization process.
Table 3 presents the performance comparison between the GATPNet model and other baseline models on the Los Angeles Crime Data and CrisisLexT26 datasets. Through the comparative experiments, it can be observed that GATPNet outperforms other models across all evaluation metrics.
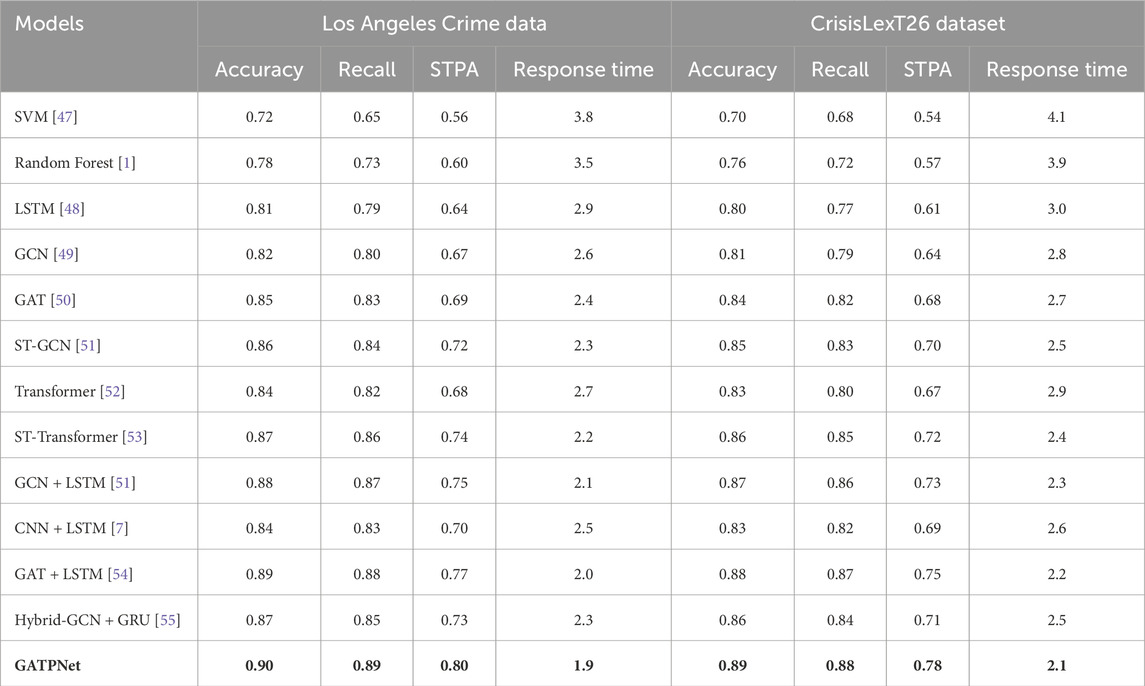
Table 3. Performance comparison of GATPNet model and other baseline models on Los Angeles crime dataset and CrisisLexT26 dataset (bold font indicates the best result).
In terms of Accuracy and Recall, GATPNet performs better than the other baseline models on both datasets. On the Los Angeles Crime Data dataset, GATPNet achieved an accuracy of 0.90 and a recall of 0.89, which are significantly higher than the other models. For example, compared to the hybrid model GCN + LSTM, GATPNet’s accuracy and recall were improved by 2% and 2%, respectively. This indicates that GATPNet is better at capturing the complex dependencies between different data sources, effectively fusing multi-source information, and improving the prediction accuracy of public safety events. Traditional machine learning methods, such as SVM and Random Forest, have relatively lower accuracy, indicating that traditional models lack sufficient feature extraction and data fusion capabilities when dealing with highly heterogeneous and complex data.
In terms of STPA, GATPNet also achieves significant advantages. The STPA for GATPNet on the Los Angeles Crime Data and CrisisLexT26 datasets are 0.80 and 0.78, respectively, which are significantly higher than those of other models. In contrast, graph-based models like GCN and GAT, due to their lack of in-depth modeling of temporal dynamics, have slightly lower STPA. While time series models like LSTM can effectively handle temporal dependencies, they fall short in capturing spatial features. Hybrid models such as ST-Transformer and GAT + LSTM enhance the STPA by combining both spatial and temporal feature extraction, but they still lag behind GATPNet. GATPNet, by integrating Graph Attention Networks, Spatiotemporal Transformers, and the PPO-based real-time decision mechanism, effectively addresses the challenges in modeling spatiotemporal dependencies, resulting in the best performance in the STPA metric.
In terms of Response Time, GATPNet also demonstrates outstanding performance. The response times on the Los Angeles Crime Data and CrisisLexT26 datasets are 1.9 s and 2.1 s, respectively, which are significantly lower than those of other models. This is primarily due to GATPNet’s strategy of integrating edge computing, which offloads some inference tasks to edge nodes, thus reducing response latency and improving real-time performance. In comparison, traditional deep learning models like LSTM and Transformer have response times over 2.7 s, while hybrid models such as GCN + LSTM and Hybrid-GCN + GRU also have response times exceeding 2.0 s. This indicates that GATPNet has a distinct advantage in real-time performance, especially in emergency scenarios, enabling faster responses to potential risks, thereby providing stronger support for public safety management.
Furthermore, hybrid models such as GAT + LSTM and ST-Transformer perform better than single models across multiple metrics because they can leverage both graph-based features and time series features, allowing for better modeling of complex relationships in the data. However, GATPNet, by integrating the three core modules (multi-source fusion, spatiotemporal feature extraction, and reinforcement learning-based decision making), not only performs excellently in accuracy and recall but also significantly improves spatiotemporal prediction accuracy and response time, showcasing a complete and efficient solution.
In the ablation experiments, we sequentially removed certain key modules from the GATPNet model to assess the contribution of each module to the overall performance. The experimental results are shown in Table 4.
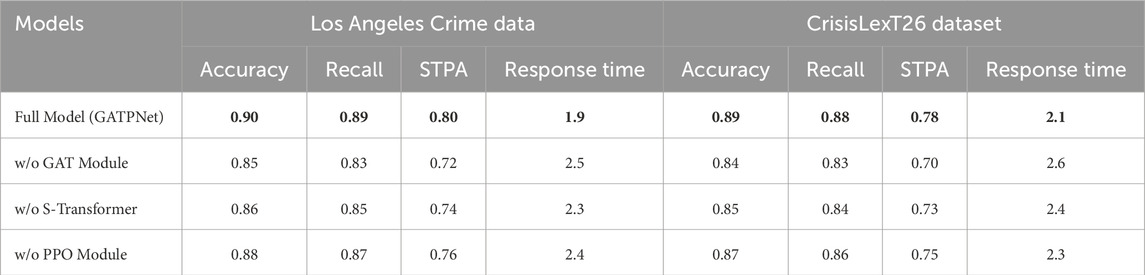
Table 4. Ablation experiment results of GATPNet model on Los Angeles crime dataset and CrisisLexT26 dataset (bold font indicates the best result).
By progressively removing different modules (including the GAT module, Spatiotemporal Transformer module, and PPO decision module), the results demonstrate that the complete GATPNet model outperforms all other configurations across all metrics. On the Los Angeles Crime Data dataset, GATPNet achieves an accuracy of 0.90, a recall of 0.89, an STPA of 0.80, and the shortest response time of 1.9 s. A similar trend is observed on the CrisisLexT26 dataset, where the complete model outperforms all configurations where any module is removed. This indicates that each module plays a critical role in improving GATPNet’s performance, and the combination of all modules achieves the best synergistic effect.
After removing the Graph Attention Network (GAT) module, the model’s performance significantly declined, especially in terms of accuracy and spatiotemporal prediction accuracy, which showed substantial degradation. The role of the GAT module is to enhance the model’s ability to handle multi-source heterogeneous data by using the attention mechanism to capture complex relationships between data nodes, thus improving the prediction accuracy of public safety events. After removing the Spatiotemporal Transformer module, the STPA dropped from 0.80 to 0.74, indicating that the Spatiotemporal Transformer plays a key role in modeling the temporal and spatial dependencies of public safety events. The Spatiotemporal Transformer enables the model to effectively capture spatiotemporal dynamics, allowing for a better understanding of the event evolution process. Additionally, removing the PPO decision module resulted in a drop in recall to 0.87, indicating that the PPO decision module is essential for improving the model’s response capability in dynamic environments. By leveraging reinforcement learning, PPO enables the model to adapt to sudden changes in the environment.
The ablation experiments demonstrate that the collaborative function of each module in the GATPNet model is crucial for achieving the best performance, and removing any module leads to a decline in overall performance. This validates the contribution of each module to GATPNet and proves the rationality of the model’s design. The complete design of GATPNet results in significant improvements in accuracy, spatiotemporal prediction accuracy, and response speed, fully demonstrating its potential in the application of public safety event prediction and management.
Figures 6, 7 display the spatiotemporal distribution prediction results of the GATPNet model on the Los Angeles Crime Data and CrisisLexT26 datasets, respectively.
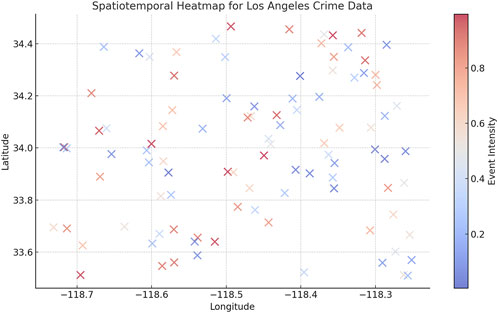
Figure 6. Spatiotemporal heatmap for Los Angeles Crime data.
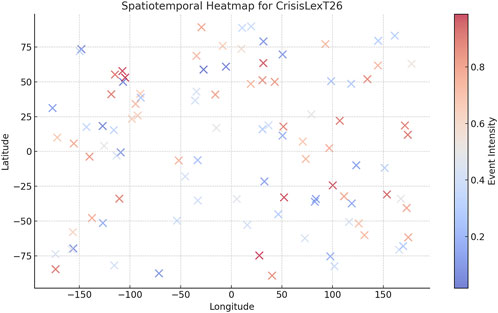
Figure 7. Spatiotemporal heatmap for CrisisLexT26 datasets.
In Figure 6 (Los Angeles Crime Data), the geographic distribution of crime events across Los Angeles is clearly visible. The red-marked areas represent locations with a high frequency of crime events, while the blue areas indicate locations with fewer incidents. The concentration of event intensity is highly correlated with specific regions of the city, particularly densely populated areas, where event intensity tends to be higher. This suggests that the GATPNet model can accurately identify high-crime areas when processing crime data with geographic features, revealing the geographical dependency of events. By identifying these high-risk areas, the model provides valuable insights for police force deployment, enhancing the efficiency of urban management in public safety.
In Figures 7 (CrisisLexT26), the spatiotemporal distribution of events shows clear heterogeneity. The heatmap, with different color markers representing event intensity, indicates that red corresponds to higher event intensity and blue to lower intensity. Areas with higher event intensity are concentrated in specific geographical regions, and their distribution shows a certain degree of concentration. This demonstrates that the GATPNet model successfully captures the geographic distribution characteristics of social crisis events in the CrisisLexT26 dataset and effectively distinguishes between high-intensity and low-intensity events. This has significant practical implications for emergency response, helping managers quickly locate high-risk areas and take timely actions.
Combining the spatiotemporal distribution maps of both datasets, the GATPNet model excels at capturing the spatial heterogeneity of event intensity. This is due to the effective integration of the Spatiotemporal Transformer and GAT modules in the model. The Spatiotemporal Transformer module captures the temporal dynamics in the data, while the GAT module handles the complex spatial dependencies of multi-source heterogeneous data, significantly enhancing the accuracy and detail in spatiotemporal predictions.
Figures 8, 9 present the predicted emotion fluctuation results of the GATPNet model on the Los Angeles Crime Data and CrisisLexT26 datasets. The variation in emotion intensity reflects the emotional fluctuations of the public during the development of the events, with the vertical axis representing emotion intensity and the horizontal axis representing training epochs. By analyzing these two figures, we can further understand GATPNet’s ability to capture the emotional evolution pattern when handling time-series data.
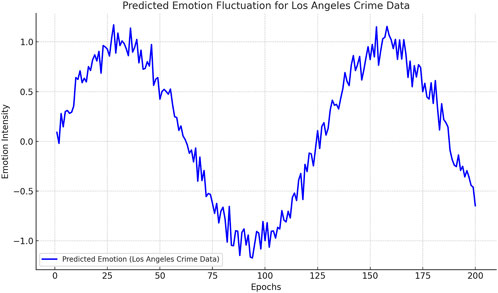
Figure 8. Predicted emotion fluctuation for Los Angeles Crime data.
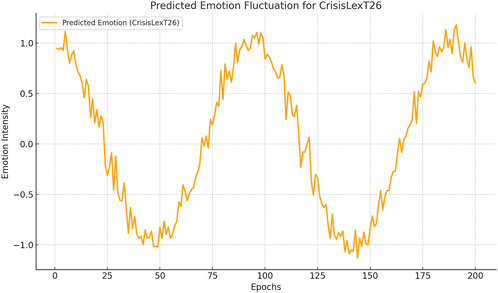
Figure 9. Predicted emotion fluctuation for CrisisLexT26 datasets.
In the figure for the Los Angeles Crime Data dataset, the emotion intensity exhibits clear cyclical fluctuations. The emotion intensity gradually rises in the early stages of training, reaches a peak, and then gradually declines, forming a distinct periodic curve. This phenomenon reflects the public’s emotional fluctuations in response to crime events: as high-intensity crime events occur, public emotions gradually rise, and after reaching a certain intensity, the emotional intensity begins to decrease due to the event subsiding or the public adapting to it. It is important to note that the amplitude and frequency of the emotional fluctuations are closely related to the timing and frequency of the crime events, indicating that the GATPNet model can effectively capture changes in public emotions at different stages and reflect the periodic nature of crime events.
For the CrisisLexT26 dataset, the changes in emotion intensity also show significant fluctuations, but compared to the crime dataset, the amplitude and frequency of the fluctuations are somewhat different. The figure shows that the emotion intensity quickly reaches a peak in the early stages of training, followed by a sharp decline, then hits a low point around the 50th epoch, and starts to rise again. Compared to the emotion fluctuations in the Los Angeles Crime Data, the fluctuations in the CrisisLexT26 dataset are more complex, with higher frequencies and more significant amplitude variations. This is mainly because the CrisisLexT26 dataset includes multiple major events from social media, which often have a strong and rapidly changing impact on public emotions. The GATPNet model, by learning from these time series, effectively captures the rapid changes in public sentiment on social media, reflecting the emotional fluctuations people experience in response to different events.
Overall, combining the emotion fluctuation predictions from both figures, the GATPNet model performs exceptionally well in capturing complex emotional fluctuation patterns. By integrating the Spatiotemporal Transformer and GAT modules, the model can effectively understand the impact of public safety events on public emotions in terms of both temporal dynamics and spatial relationships. This prediction of emotional fluctuations not only helps managers understand public reactions and attitudes toward events, but also provides valuable insights for emergency management, enabling more effective risk communication and intervention strategies. Overall, the GATPNet model performs excellently in handling different datasets (including crime data and social media data), fully demonstrating its adaptability and accuracy in emotion fluctuation prediction.
This study proposes a novel public safety event prediction model, GATPNet, based on multi-source heterogeneous data. By integrating Graph Attention Networks (GAT), Spatiotemporal Transformers, and Proximal Policy Optimization (PPO), the model achieves efficient fusion of multi-source data, precise extraction of spatiotemporal features, and optimized real-time decision-making. Experimental results show that GATPNet outperforms other baseline models on two publicly available datasets, demonstrating significant improvements in accuracy, recall, spatiotemporal prediction accuracy (STPA), and response time. Specifically, when handling complex public safety data, GATPNet’s multi-module collaborative design effectively enhances overall performance, showing relative improvements of 5% in accuracy and 10% in STPA over the best baseline method. This positions GATPNet as a promising new technological approach for public safety event prediction and management.
Although GATPNet has achieved remarkable results in public safety event prediction, there are still some limitations in this study. On one hand, the model’s computational complexity is relatively high when processing large-scale heterogeneous data, which requires considerable hardware resources and limits its application in resource-constrained environments. On the other hand, the datasets used in this study are relatively limited, especially in terms of covering different types of public safety events, which may affect the model’s generalization ability and adaptability in various scenarios.
In future research, we plan to make improvements in several areas. First, we will introduce more heterogeneous data sources, such as sentiment analysis data from social media and environmental sensor data, to enhance the model’s prediction accuracy for emergency events. Second, we aim to optimize the model’s computational efficiency, especially in applications with higher real-time requirements, to further reduce response time. Additionally, we will consider incorporating more complex reinforcement learning strategies to improve the decision-making quality of the model in dynamic environments, thus providing stronger intelligent support for public safety management. These improvements will further enhance GATPNet’s application potential and enable it to play a significant role in more real-world public safety scenarios.
The original contributions presented in the study are included in the article/supplementary material, further inquiries can be directed to the corresponding author.
QF: Formal Analysis, Methodology, Project administration, Supervision, Validation, Visualization, Writing – original draft, Software. GX: Data curation, Funding acquisition, Investigation, Project administration, Resources, Writing – review and editing, Conceptualization.
The author(s) declare financial support was received for the research, authorship, and/or publication of this article. This work is supported by the Major Science and Technology Research Projects in Wenzhou City in 2023, with project number ZZN2023005.
Author QF was employed by Zhejiang Cheng’an Big Data Co., Ltd.
The remaining author declares that the research was conducted in the absence of any commercial or financial relationships that could be construed as a potential conflict of interest.
The author(s) declare that no Generative AI was used in the creation of this manuscript.
All claims expressed in this article are solely those of the authors and do not necessarily represent those of their affiliated organizations, or those of the publisher, the editors and the reviewers. Any product that may be evaluated in this article, or claim that may be made by its manufacturer, is not guaranteed or endorsed by the publisher.
1. Chen Y, Zheng W, Li W, Huang Y. Large group activity security risk assessment and risk early warning based on random forest algorithm. Pattern Recognition Lett (2021) 144:1–5. doi:10.1016/j.patrec.2021.01.008
2. Anderljung M, Barnhart J, Korinek A, Leung J, O’Keefe C, Whittlestone J, et al. Frontier ai regulation: managing emerging risks to public safety. arXiv preprint arXiv:2307.03718 (2023).
3. Xie P, Li T, Liu J, Du S, Yang X, Zhang J. Urban flow prediction from spatiotemporal data using machine learning: a survey. Inf Fusion (2020) 59:1–12. doi:10.1016/j.inffus.2020.01.002
4. Atitallah SB, Driss M, Boulila W, Ghézala HB. Leveraging deep learning and iot big data analytics to support the smart cities development: review and future directions. Comput Sci Rev (2020) 38:100303. doi:10.1016/j.cosrev.2020.100303
5. Kim A, Park M, Lee DH. Ai-ids: application of deep learning to real-time web intrusion detection. IEEE Access (2020) 8:70245–61. doi:10.1109/access.2020.2986882
6. Chen J, Du C, Zhang Y, Han P, Wei W. A clustering-based coverage path planning method for autonomous heterogeneous uavs. IEEE Trans Intell Transportation Syst (2021) 23:25546–56. doi:10.1109/tits.2021.3066240
7. Ullah W, Ullah A, Haq IU, Muhammad K, Sajjad M, Baik SW. Cnn features with bi-directional lstm for real-time anomaly detection in surveillance networks. Multimedia tools Appl (2021) 80:16979–95. doi:10.1007/s11042-020-09406-3
8. Chen Y, Hu S, Mao H, Deng W, Gao X. Application of the best evacuation model of deep learning in the design of public structures. Image Vis Comput (2020) 102:103975. doi:10.1016/j.imavis.2020.103975
9. Kong X, Xing W, Wei X, Bao P, Zhang J, Lu W. Stgat: spatial-temporal graph attention networks for traffic flow forecasting. IEEE Access (2020) 8:134363–72. doi:10.1109/access.2020.3011186
10. Li H, Cao H, Feng Y, Li X, Pei J. Optimization of graph clustering inspired by dynamic belief systems. IEEE Trans Knowledge Data Eng (2023) 36:6773–85. doi:10.1109/tkde.2023.3274547
11. Xie Y, Niu J, Zhang Y, Ren F. Multisize patched spatial-temporal transformer network for short-and long-term crowd flow prediction. IEEE Trans Intell Transportation Syst (2022) 23:21548–68. doi:10.1109/tits.2022.3186707
12. Guo D, Chen H, Wu R, Wang Y. Aigc challenges and opportunities related to public safety: a case study of chatgpt. J Saf Sci Resilience (2023) 4:329–39. doi:10.1016/j.jnlssr.2023.08.001
13. Jayant AK, Bhatnagar S. Model-based safe deep reinforcement learning via a constrained proximal policy optimization algorithm. Adv Neural Inf Process Syst (2022) 35:24432–45.
14. Sun B, Li Y, Zhang Y, Guo T. Multi-source heterogeneous data fusion prediction technique for the utility tunnel fire detection. Reliability Eng and Syst Saf (2024) 248:110154. doi:10.1016/j.ress.2024.110154
15. Ping RB, Yue WZ. Strategic focus, tasks, and pathways for promoting China’s modernization through new productive forces. J Xi’an Univ Finance Econ (2024) 1:3–11.
16. Kamil MZ, Khan F, Amyotte P, Ahmed S. Multi-source heterogeneous data integration for incident likelihood analysis. Comput and Chem Eng (2024) 185:108677. doi:10.1016/j.compchemeng.2024.108677
17. Kodipalli A, Fernandes SL, Dasar SK, Ismail T. Computational framework of inverted fuzzy c-means and quantum convolutional neural network towards accurate detection of ovarian tumors. Int J E-Health Med Commun (Ijehmc) (2023) 14:1–16. doi:10.4018/ijehmc.321149
18. Cai L, Wang H, Sha C, Jiang F, Zhang Y, Zhou W. The mining of urban hotspots based on multi-source location data fusion. IEEE Trans Knowledge Data Eng (2021) 35:2061–77. doi:10.1109/tkde.2021.3109581
19. Sannidhan M, Martis JE, Nayak RS, Aithal SK, Sudeepa K. Detection of antibiotic constituent in aspergillus flavus using quantum convolutional neural network. Int J E-Health Med Commun (Ijehmc) (2023) 14:1–26. doi:10.4018/ijehmc.321150
20. Liang W, Gao G, Chen L, Wang Y. Partial multi-label learning via exploiting instance and label correlations. ACM Trans Knowledge Discov Data (2024) 19:1–22. doi:10.1145/3700879
21. Chen L, Zhu G. Self-supervised contrastive learning for itinerary recommendation. Expert Syst Appl (2025) 268:126246. doi:10.1016/j.eswa.2024.126246
22. Chen M, Zhang L. Application of edge computing combined with deep learning model in the dynamic evolution of network public opinion in emergencies. The J Supercomputing (2023) 79:1526–43. doi:10.1007/s11227-022-04733-8
23. Zhao Y, Zhao J, Lam EY. House price prediction: a multi-source data fusion perspective. Big Data Mining and Analytics (2024) 7:603–20. doi:10.26599/bdma.2024.9020019
24. Jing CX, Qing W. The logic and pathways of new productive forces driving high-quality development. J Xi’an Univ Finance Econ (2024) 37:12–20.
25. Li T, Zhang J, Bao K, Liang Y, Li Y, Zheng Y. Autost: efficient neural architecture search for spatio-temporal prediction. Proc 26th ACM SIGKDD Int Conf Knowledge Discov and Data Mining (2020) 794–802.
26. Jin G, Liang Y, Fang Y, Shao Z, Huang J, Zhang J, et al. Spatio-temporal graph neural networks for predictive learning in urban computing: a survey. IEEE Trans Knowledge Data Eng (2023) 36:5388–408. doi:10.1109/tkde.2023.3333824
27. Chen J, Li T, Zhang Y, You T, Lu Y, Tiwari P, et al. Global-and-local attention-based reinforcement learning for cooperative behaviour control of multiple uavs. IEEE Trans Vehicular Technol (2023) 73:4194–206. doi:10.1109/tvt.2023.3327571
28. Ali A, Zhu Y, Zakarya M. Exploiting dynamic spatio-temporal graph convolutional neural networks for citywide traffic flows prediction. Neural networks (2022) 145:233–47. doi:10.1016/j.neunet.2021.10.021
29. Xiao G, Wang R, Zhang C, Ni A. Demand prediction for a public bike sharing program based on spatio-temporal graph convolutional networks. Multimedia Tools Appl (2021) 80:22907–25. doi:10.1007/s11042-020-08803-y
30. Feng S, Sun H, Yan X, Zhu H, Zou Z, Shen S, et al. Dense reinforcement learning for safety validation of autonomous vehicles. Nature (2023) 615:620–7. doi:10.1038/s41586-023-05732-2
31. Wang J, Li F, Lv S, He L, Shen C. Physically realizable adversarial creating attack against vision-based bev space 3d object detection. IEEE Trans Image Process (2025) 34:538–51. doi:10.1109/tip.2025.3526056
32. Wang J, Li F, He L. A unified framework for adversarial patch attacks against visual 3d object detection in autonomous driving. IEEE Trans Circuits Syst Video Technol (2025) 1. doi:10.1109/tcsvt.2025.3525725
33. Zhang H, Wang C, Yu L, Tian S, Ning X, Rodrigues J. Pointgt: a method for point-cloud classification and segmentation based on local geometric transformation. IEEE Trans Multimedia (2024) 26:8052–62. doi:10.1109/TMM.2024.3374580
34. Mansour RF, Escorcia-Gutierrez J, Gamarra M, Villanueva JA, Leal N. Intelligent video anomaly detection and classification using faster rcnn with deep reinforcement learning model. Image Vis Comput (2021) 112:104229. doi:10.1016/j.imavis.2021.104229
35. Ning X, He F, Dong X, Li W, Alenezi F, Tiwari P. Icgnet: an intensity-controllable generation network based on covering learning for face attribute synthesis. Inf Sci (2024) 660:120130. doi:10.1016/j.ins.2024.120130
36. Aruna Kumari A, Bhagat A, Kumar Henge S. Classification of diabetic retinopathy severity using deep learning techniques on retinal images. Cybernetics Syst (2024) 1–25. doi:10.1080/01969722.2024.2375148
37. Nguyen LA, Micić I, Nguyen NT, Stanimirović S. Depth-bounded fuzzy bisimulation for fuzzy modal logic. Cybernetics Syst (2023) 1–18. doi:10.1080/01969722.2023.2296248
38. Yu L, Du B, Hu X, Sun L, Han L, Lv W. Deep spatio-temporal graph convolutional network for traffic accident prediction. Neurocomputing (2021) 423:135–47. doi:10.1016/j.neucom.2020.09.043
39. Wang J, Chen Q, Gong H. Stmag: a spatial-temporal mixed attention graph-based convolution model for multi-data flow safety prediction. Inf Sci (2020) 525:16–36. doi:10.1016/j.ins.2020.03.040
40. Li D, Lasenby J. Spatiotemporal attention-based graph convolution network for segment-level traffic prediction. IEEE Trans Intell Transportation Syst (2021) 23:8337–45. doi:10.1109/tits.2021.3078187
41. Zhou L, Yang D, Zhai X, Wu S, Hu Z, Liu J. Ga-stt: human trajectory prediction with group aware spatial-temporal transformer. IEEE Robotics Automation Lett (2022) 7:7660–7. doi:10.1109/lra.2022.3176064
42. Pu B, Liu J, Kang Y, Chen J, Philip SY. Mvstt: a multiview spatial-temporal transformer network for traffic-flow forecasting. IEEE Trans cybernetics (2022) 54:1582–95. doi:10.1109/tcyb.2022.3223918
43. Quang Tran D, Bae SH. Proximal policy optimization through a deep reinforcement learning framework for multiple autonomous vehicles at a non-signalized intersection. Appl Sci (2020) 10:5722. doi:10.3390/app10165722
44. Siboo S, Bhattacharyya A, Raj RN, Ashwin S. An empirical study of ddpg and ppo-based reinforcement learning algorithms for autonomous driving. IEEE Access (2023) 11:125094–108.
45. Hussain R, Vargas R, Le-Au HH, Gass W, Fenn M, Serna-Marquez B, et al. Crime patterns in los angeles county before and after covid19 (2018-2021). arXiv preprint arXiv:2204.04399 (2022).
46. Alam F, Sajjad H, Imran M, Ofli F. Crisisbench: benchmarking crisis-related social media datasets for humanitarian information processing. Proc Int AAAI Conf web Soc media (2021) 15:923–32. doi:10.1609/icwsm.v15i1.18115
47. Liu P, Xie M, Bian J, Li H, Song L. A hybrid pso–svm model based on safety risk prediction for the design process in metro station construction. Int J Environ Res Public Health (2020) 17:1714. doi:10.3390/ijerph17051714
48. Sun Y, Ortiz J. Machine learning-driven pedestrian recognition and behavior prediction for enhancing public safety in smart cities. J Artif Intelligence Inf (2024) 1:51–7.
49. Guan Z, Du J, Xue Z. Public safety event detection based on reinforcement federated client selection. In: 2024 IEEE International Conference on Big Data and Smart Computing (BigComp). IEEE (2024). p. 75–82.
50. Fang Y, Qin Y, Luo H, Zhao F, Zheng K. Stwave+: a multi-scale efficient spectral graph attention network with long-term trends for disentangled traffic flow forecasting. IEEE Trans Knowledge Data Eng (2023) 36:2671–85. doi:10.1109/tkde.2023.3324501
51. Han X, Hu X, Wu H, Shen B, Wu J. Risk prediction of theft crimes in urban communities: an integrated model of lstm and st-gcn. Ieee Access (2020) 8:217222–30. doi:10.1109/access.2020.3041924
52. Yin K, Yang Y, Yao C, Yang J. Long-term prediction of network security situation through the use of the transformer-based model. Ieee Access (2022) 10:56145–57. doi:10.1109/access.2022.3175516
53. Jin G, Liu C, Xi Z, Sha H, Liu Y, Huang J. Adaptive dual-view wavenet for urban spatial–temporal event prediction. Inf Sci (2022) 588:315–30. doi:10.1016/j.ins.2021.12.085
54. Kong W, Liu Y, Li H, Wang C. Egat: extended graph attention network for pedestrian trajectory prediction. Comput intelligence Neurosci (2021) 2021:9985401. doi:10.1155/2021/9985401
Keywords: public safety event, deep learning, real-time prediction, multi-source data fusion, graph neural networks (GNN), data integration, intelligent decision support
Citation: Fan Q and Xu G (2025) Real-time prediction model of public safety events driven by multi-source heterogeneous data. Front. Phys. 13:1553640. doi: 10.3389/fphy.2025.1553640
Received: 31 December 2024; Accepted: 06 March 2025;
Published: 02 April 2025.
Edited by:
Takayuki Mizuno, National Institute of Informatics, JapanReviewed by:
Lei Chen, Nanjing Forestry University, ChinaCopyright © 2025 Fan and Xu. This is an open-access article distributed under the terms of the Creative Commons Attribution License (CC BY). The use, distribution or reproduction in other forums is permitted, provided the original author(s) and the copyright owner(s) are credited and that the original publication in this journal is cited, in accordance with accepted academic practice. No use, distribution or reproduction is permitted which does not comply with these terms.
*Correspondence: Gang Xu, MjAwOTYzNDJAempjc3QuZWR1LmNu
Disclaimer: All claims expressed in this article are solely those of the authors and do not necessarily represent those of their affiliated organizations, or those of the publisher, the editors and the reviewers. Any product that may be evaluated in this article or claim that may be made by its manufacturer is not guaranteed or endorsed by the publisher.
Research integrity at Frontiers
Learn more about the work of our research integrity team to safeguard the quality of each article we publish.