 Yong Wang1,2
 Lei Dong
 Hongpeng Wu
- 1State Key Laboratory of Quantum Optics Technologies and Devices, Institute of Laser Spectroscopy, Shanxi University, Taiyuan, China
- 2Collaborative Innovation Center of Extreme Optics, Shanxi University, Taiyuan, China
This study presents a portable near-infrared laser heterodyne radiometer specifically designed for measuring the column abundance of atmospheric carbon dioxide (CO₂) in the Taiyuan area. The instrument modulates the solar radiation using a fiber optic switch and amplifies the solar radiation through a semiconductor optical amplifier. The local oscillator laser is progressively scanned at the strong absorption characteristic of 1572.02 nm. Two beams of light are mixed on the photodetector to produce a heterodyne signal. To enhance performance, the radio frequency (RF) circuit system of the radiometer was thoroughly optimized, including adjustments to the filter bandwidth and the integration time of the lock-in amplifier. These improvements significantly enhanced the spectral signal-to-noise ratio (SNR) to a high level of 130 and achieved a spectral resolution of 0.0083 cm⁻1. The laser heterodyne signals were demodulated using a lock-in amplifier. Furthermore, a forward model based on line-by-line integration and an iterative fitting algorithm were employed to achieve high-precision CO₂ column abundance calculations. Outdoor field measurements conducted at Shanxi University validated the feasibility and practicality of this approach, laying a solid foundation for its broader application.
1 Introduction
Carbon dioxide (CO2) is the most significant greenhouse gas in the atmosphere, and high-precision, full-range observations of atmospheric CO2 column concentration are crucial for identifying carbon sources and sinks, understanding carbon cycles, advancing carbon science applications, and supporting global climate change research [1–3]. There exist numerous methodologies for monitoring the vertical column concentration of the targeted gas within the atmosphere. For example, the Differential Optical Absorption Spectroscopy (DOAS) represents an advanced measurement technique for quantifying gas abundances within the visible spectral range. However, its progression is constrained by stringent environmental prerequisites and the necessity to mitigate intricate effects arising from turbulent scattering [4–6]. The Solar photometer, with its high-precision measurement capabilities, multispectral measurement functionality, integrated GPS and automatic tracking systems, as well as real-time data transmission and management, demonstrates broad application prospects across multiple fields. However, its relatively high equipment costs, technical complexity, and environmental dependency are drawbacks that merit attention in practical applications [7–9].
At present, the primary network for observing global greenhouse gas column concentrations is the Total Carbon Column Observing Network (TCOON) [10, 11], which mainly uses ground-based near-infrared spectrometer to obtain greenhouse gas concentration information and is also used for the verification of satellite product data [12], such as Japan’s GOSAT satellite [13]. The Fourier Transform Infrared Spectrometer (FTIR) serves as the cornerstone instrument within the TCCON. Its extensive spectral coverage and exceptional precision have led to its ubiquitous application in the realm of gas column abundance measurements [14]. However, the high manufacturing costs, intricate setup environment, and portability challenges associated with the Fourier Transform Infrared Spectrometer (FTIR) have limited its distribution. Consequently, there are only 70 TCCON sites globally, with merely two sites located in Hefei and Xianghe, China [15]. As an industrialized and modern metropolis nestled within the borders of Shanxi Province, Taiyuan is confronted with notably acute pollution challenges [16], giving rise to an environmental index that falls short of expectations and underscores the pressing need for comprehensive environmental improvement measures. At present, only some on-site fixed point measuring gas concentration measuring devices are effectively used [17–21], the measurement of vertical column concentration within the Taiyuan region represents a significant gap that needs to be addressed.
The novel Laser Heterodyne Radiometer (LHR) employ the heterodyne detection principle, integrating a stable laser source with atmospheric solar radiation to generate a beat frequency signal. This signal is directly proportional to the power of both the local oscillator laser and the atmospheric solar radiation, thereby furnishing an exceptionally precise methodology for measuring the concentration of trace gases, including carbon dioxide (CO₂) [22, 23]. LHR distinguished by their unparalleled spectral resolution, exceptional sensitivity, unwavering stability, compact portability, and broad applicability, have garnered increasing attention and utilization within domains like atmospheric science and environmental monitoring.
The development and choice of the local oscillator light source exert a profound influence on the evolutionary trajectory of the LHR. Based on Quantum Cascade Lasers (QCLs), extensive testing was conducted to evaluate the transmittance spectral lines of various gases, including Nitrous Oxide (N₂O), Ozone (O₃), Methane (CH₄), Dichlorodifluoromethane (CCl₂F₂), Water Vapor (H₂O), and Carbon Dioxide (CO₂) [24–26]. The detection bandwidth of the Interband Cascade Laser (ICL) is centered on the 3–5 μm range, and Wang et al. have introduced an advanced LHR equipped with a 3.5 μm ICL specifically designed for measuring the vertical concentrations of atmospheric CO₂ and CH₄ [27]. Lu et al. conducted measurements of the vertical concentrations of atmospheric deuterated HDO and CH₄ in Dunhuang [28]. Xue et al. employed ICLs operating at wavelengths of 3.53 μm and 3.93 μm to measure the concentrations of atmospheric CH₄, H₂O and N₂O [29]. With the sophisticated development of near-infrared fiber lasers, the fiber-optic LHR has emerged as a highly favored instrument for detecting gas abundances. This instrument boasts advantages such as cost-effectiveness, robustness, and a compact size. In recent years, Wilson et al. have done pioneering work in developing all-fiber near-infrared laser heterodyne (LHR) for atmospheric CO2 and CH4 total measurement [30]; Li et al. utilized a DFB laser operating at a wavelength of 1.55 μm to measure the concentrations of atmospheric H₂O and HDO [31]; Deng et al. conducted measurements of the column-averaged abundance of CO₂ by employing semiconductor optical amplifier, respectively [32].
This paper presents an optical fiber-based Laser Heterodyne Radiometer (LHR) specifically designed for monitoring the column abundance of carbon dioxide (CO₂). Utilizing this instrument, continuous heterodyne detection of the atmospheric CO₂ transmittance spectrum was conducted at Shanxi University, located at coordinates 37°79′N, 112°58′E in Taiyuan City. To accurately invert and calculate the actual column abundance of CO₂, the study employed the Line-By-Line Radiative Transfer Model (LBLRTM) as the forward model, complemented by an iterative method for precise determination.
2 Experimental system
In the CO₂ LHR system, the choice of the measurement window is of paramount importance. Based on data from the HITRAN database, it is evident that within the wavenumber range of 6359 cm⁻1–6363 cm⁻1, there exist three distinct absorption lines of carbon dioxide (CO₂), as illustrated in Figure 1. Given the intricate and ever-changing nature of the atmospheric environment, and with the aim of safeguarding the precision of our experimentation, we meticulously selected an absorption line that is devoid of any interference from other gases. More specifically, we opted for an absorption line positioned at a wavenumber of 6361.24 cm⁻1 to serve as the central wavelength for our heterodyne radiometer experiments.
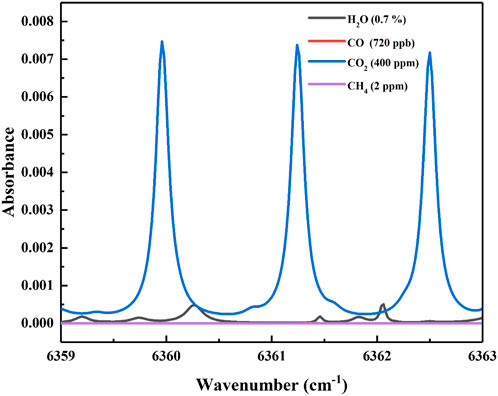
Figure 1. Absorption line of carbon monoxide, carbon dioxide, methane and water based on the HITRAN database.
We utilized a Distributed Feedback (DFB) laser operating near the wavelength of 1.57 μm as the local oscillator (LO) light source. The laser exhibited an output power of approximately 10 mW, with a temperature tuning rate of −0.396 cm⁻1/°C and a current tuning rate of −0.0248 cm⁻1/mA. Consequently, the performance of the laser fully met the requirements for serving as the LO in a LHR system. To further enhance the precision of wavelength control and facilitate subsequent field portability and system integration, we employed the LDTC0520 laser controller to drive the laser.
The principle of the developed CO2 LHR is depicted in Figure 2. In this system, solar radiation is located and tracked in real-time by a commercial solar tracker. It is then collected into a single-mode fiber via an optical collimator and modulated by an optical switch, whose drive circuit allows for flexible adjustment of the modulation frequency and duty cycle. Specifically, a modulation frequency of 120 Hz and a duty cycle of 50% are set in this paper. The modulated solar radiation is combined with local oscillator light in a fiber combiner. Subsequently, the combined optical signal is detected by a high-speed photodetector and converted into a photocurrent signal. Within the RF circuit module, the signal from the photodetector undergoes separation of the AC and DC signals through a bias tee (ZFBT-6G-FT, Mini-Circuits). The AC signal, which is the desired heterodyne signal, is isolated, while the DC signal is monitored on an oscilloscope with a matched impedance. Owing to the AC signal being weak, it undergoes gradual amplification through three RF amplifiers (ZX60-4016E-S, Mini-Circuits). Subsequently, a band-pass filter is utilized to remove noise components from the spectrum. A Schottky diode (DHM020BB, Herotek) is employed to convert the RF signal into a low-frequency voltage signal. This low-frequency voltage signal is then demodulated by a lock-in amplifier to obtain the measured spectrum of CO2. The obtained spectrum is subsequently recorded and stored in a computer using a LabView program.
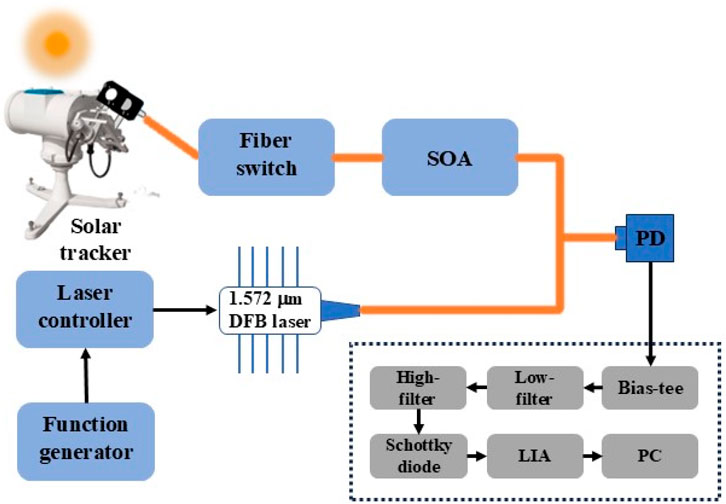
Figure 2. Schematic diagram of the CO2 LHR system. SOA: semiconductor optical amplifiers; PD:photodetector; LIA: lock-in amplifier.
3 Optimization and testing of sensing system
As depicted in Figure 3A, the selection of filter bandwidth in a radio frequency circuit plays a pivotal role in determining the resolution of signals. The Instrument Line Shape (ILS) stands as a crucial parameter in the data retrieval process of LHR. To identify an appropriate passband, we conducted a comprehensive spectrum analysis of various filter bandwidths utilizing an RF signal analyzer, enabling us to discern the LHR signal from extraneous noise. Figure 3B illustrates the amplitude and spectral resolution characteristics of the heterodyne signal across different electronic filtering bandwidths. The green dots signify the amplitude of the heterodyne signal, which exhibits a nonlinear increase with a widening bandwidth. The five-pointed star indicates the spectral resolution, with its value directly proportional to the bandwidth. Taking into account the balance between signal-to-noise ratio and spectral resolution, we opted for bandpass filters within the frequency range of 395–520 MHz for the detection of carbon dioxide in this study, yielding a double-sideband spectral resolution of approximately 250 MHz (0.0083 cm⁻1).
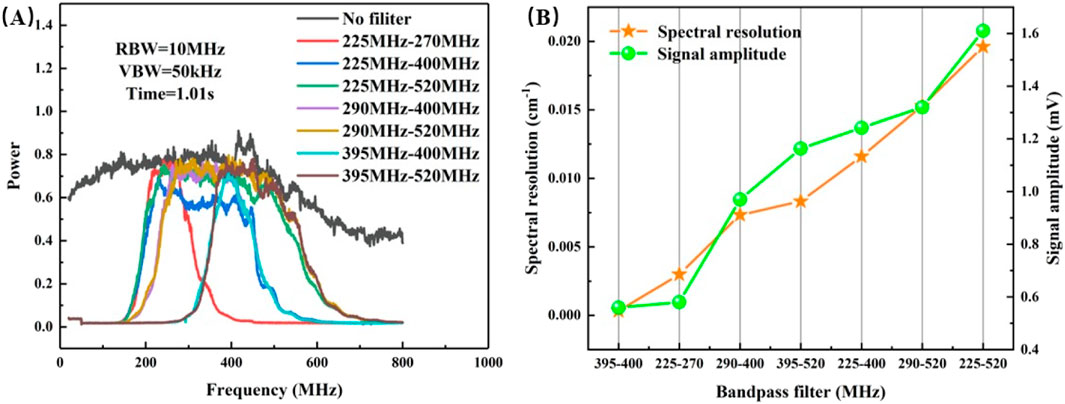
Figure 3. (A) System spectrum characterization of IF signal by different bandpass filter; (B) Heterodyne signal amplitude and spectral resolution obtained by using different bandpass filters.
In LHR systems, the demodulation of heterodyne signals with absorbed information depends on lock-in amplifiers. Integral time and filter slope are the two key parameters. The integral time determines the average degree of the signal and the noise suppression ability. The filter slope means the attenuation rate of the low-pass filter to the signals of different frequencies. Figure 4 shows heterodyne signals with different integration times and different filtering slopes. The laser wavelength is scanned by triangular wave at a scanning frequency of 18 mHz, and a total of 121 points are collected every period. The modulation frequency of the solar radiation is set to 120 Hz, and the signal is demodulated by adjusting the lock-in amplifiers parameter, and the corresponding result is obtained. Through the analysis of the data, when the integration time is consistent, such as 1s, the filter slope uses 6 dB and 24 dB, and the SNR of the latter is roughly 28 times higher than that of the former, which is a huge difference. When the filter slope remains constant, such as 24 dB, and the integration time is varied, our calculations reveal that a longer integration time leads to a higher SNR. However, as the integration time increases, while the non-absorbed portion of the spectrum becomes remarkably smooth, the absorbed part undergoes averaging, resulting in the loss of absorbed information and a subsequent decrease in SNR. These phenomena can also be visually observed in Figure 4. After conducting thorough calculations and optimizations, we ultimately chose the lock-in amplifier settings of 300 m and 24 dB for our tests, achieving an impressive SNR of 130. The signal value of the gas absorption line is used as the signal, and the signal standard deviation of the non-absorption area at both ends of the absorption line is used as the noise, and the SNR can be calculated.
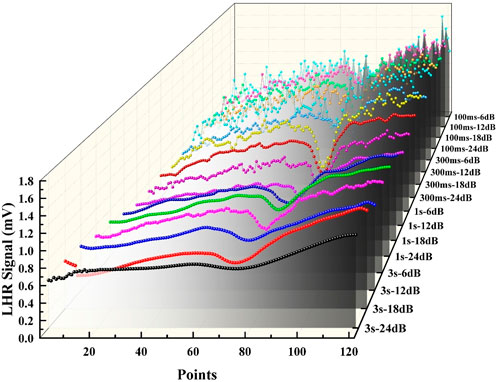
Figure 4. Heterodyne signal characteristics characterized by different integration times and filter slopes of lock-in amplifiers.
4 Results and discussion
On a crystal-clear day in July 2024, a continuous heterodyne signal test was conducted over a span of approximately two and a half hours, from 12:09 to 14:41, at the Yifu Building of Shanxi University, situated at the geographical coordinates of 37°79′N, 112°58′E as shown Figure 5. During the experiment, occasional interruptions from cumulus clouds blocking the sunlight caused interference to the heterodyne signal. To mitigate the impact of signal light instability in subsequent analyses, we synchronously monitored the fluctuations in solar intensity. The local oscillator light employed in this experiment had a scanning frequency of 18 mHz, with the signal acquisition interval set at 300 m. Regrettably, the experiment was prematurely terminated around 14:41 due to deteriorating weather conditions.
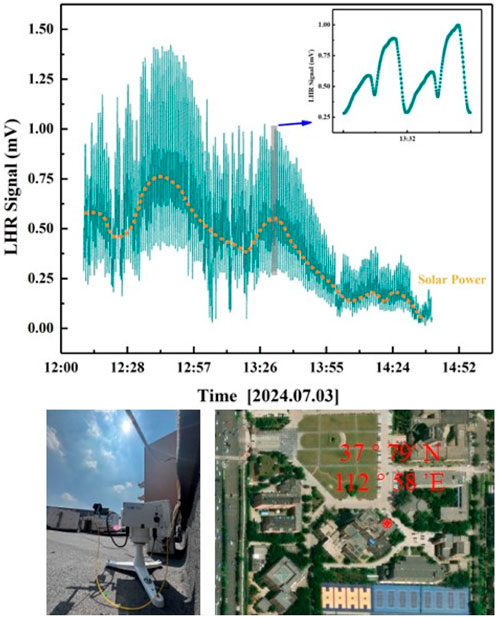
Figure 5. Continuous heterodyne signal was continuously tested at the Yifu Building of Shanxi University (37°79′N, 112°58′E).
A flow diagram of the data processing is illustrated in Figure 6. The obtained heterodyne signal first goes through data preprocessing, which mainly includes deducting the local light power base line and the solar power change, and then normalizing, so as to obtain the high-resolution CO2 transmissivity spectrum of the whole atmosphere. Then, the LBLRTM radiative transfer model is used to simulate the atmospheric transmittance for the selected CO2 gas window. The prior information of the transmission model includes temperature, pressure, water vapor and the profile concentration of the target gas. Here, we set the height as 80 km, height stratification, pressure, The typical Mid-Latitude, day-time (Extended MIPAS Model Atmospheres) prior profile of CO2 concentration in Taiyuan area was obtained from NCEP, and the Solar zenith Angle was calculated using NOAA Solar Calculator. During the simulation, data were sampled according to the spectral resolution of 0.0013 cm⁻1, and the simulated transmittance spectrum after sampling was compared with the measured transmittance spectrum. By iteration method, the prior concentration information of CO2 is constantly adjusted until the residual difference between simulated and measured transmittance is controlled within the range of ±0.02. In this case, the prior concentration profile used in the simulation is regarded as the concentration profile of the actual test.
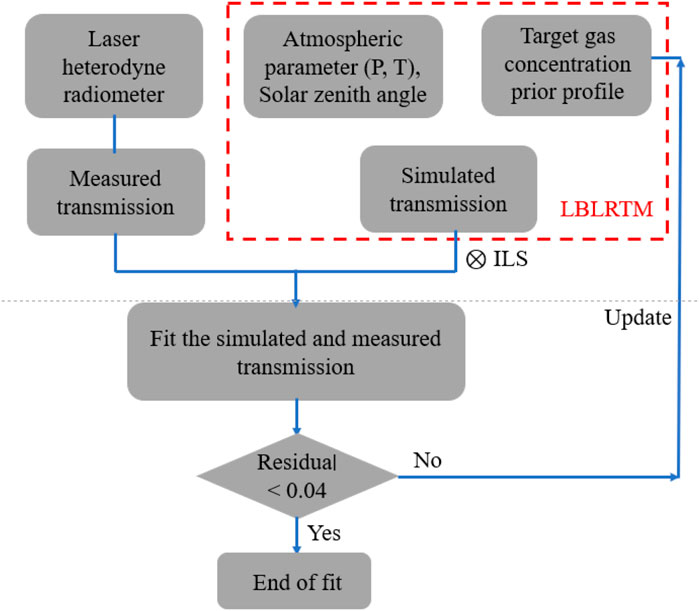
Figure 6. Flow-chart of the LHR retrieval.
Taking the observed data collected at 13:10 as a representative example, a comparison is presented in Figure 7, which illustrates the relationship between the measured transmittance, the simulated transmittance, and the residual. The transmission spectra derived from the original heterodyne test align well with the spectra obtained through the application of model inversion. Notably, the residual difference between the two sets of spectra is minimal, amounting to less than 0.04, indicating a high degree of accuracy and consistency between the experimental measurements and the simulated results.

Figure 7. Example of the LHR-detected transmission of CO2 and the model fitting results.
Additionally, the vertical column density of CO2 gas can be calculated by convolving the concentrations at different altitudes with their corresponding altitudes.
Where h represents the height, c(h) represents the concentration of the target gas at the height of h, and the unit is molecular/cm3; s(h) represents the profile concentration of the gas distributed with the height, and the unit is ppm.
For the inversion of atmospheric CO2 vertical column abundance below 80 km, we conducted an inversion of column abundance every 5 minutes using measured spectra. The results, as shown in Figure 8, reveal an intriguing observation: the CO2 column abundance increased between 12:09 and 12:49. This increase may be attributed to the heightened near-surface CO2 emissions from humans and vehicles during the midday traffic peak. Subsequently, fluctuations in column abundance values after 14:11 could be related to variations in solar radiation. Ultimately, at 14:41, solar radiation was completely obscured by clouds, forcing the heterodyne experiment to be terminated. Despite these challenges, the feasibility and stability of our experimental instrument were demonstrated, as this was the first test of CO2 vertical column concentration conducted in the Taiyuan area, yielding promising results.
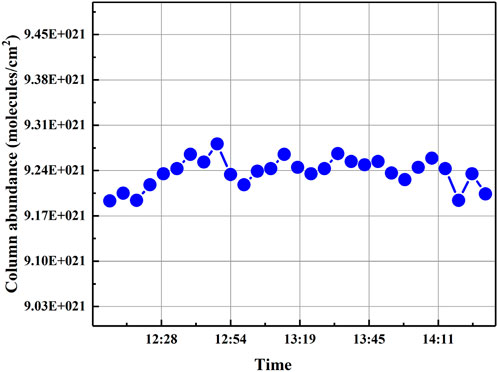
Figure 8. Retrieved column abundances of continuous measurements of CO2 on 3 July 2024.
5 Conclusion
In this paper, we introduce a novel LHR that leverages the interaction between broadband solar radiation and a local oscillator laser to generate a beating frequency. This sophisticated instrument has been employed to continuously monitor the atmospheric CO2 transmittance spectrum at Shanxi University, located at 37°79′N, 112°58′E. By utilizing inversion techniques, we have successfully obtained the column abundance of atmospheric CO2 at various times. These findings offer a solid theoretical foundation for exploring the spatial and temporal distribution patterns of greenhouse gases in the Taiyuan region. Furthermore, they serve as a valuable theoretical reference for calculating atmospheric radiation transfer, which is crucial for understanding climate change and global warming. Looking ahead, we are committed to further refining the stability of our instrument and continually enhancing the inversion model. Our ultimate goal is to dedicate ourselves to the rigorous monitoring and in-depth research of atmospheric vertical gas concentrations in the Taiyuan area. This endeavor will not only contribute to advancing our understanding of atmospheric science but also aid in the development of effective strategies for mitigating greenhouse gas emissions and combating climate change.
Data availability statement
The raw data supporting the conclusions of this article will be made available by the authors, without undue reservation.
Author contributions
YW: Writing–original draft, Writing–review and editing. MZ: Software, Writing–review and editing. JW: Investigation, Writing–review and editing. GW: Investigation, Writing–review and editing. RC: Investigation, Writing–review and editing. LD: Investigation, Writing–review and editing. HW: Investigation, Writing–review and editing.
Funding
The author(s) declare that financial support was received for the research, authorship, and/or publication of this article. The project is supported by National Natural Science Foundation of China (NSFC) [grant numbers 62475137, 62235010, 62105252]; The Shanxi Science Fund for Distinguished Young Scholars (20210302121003).
Conflict of interest
The authors declare that the research was conducted in the absence of any commercial or financial relationships that could be construed as a potential conflict of interest.
Generative AI statement
The author(s) declare that no Generative AI was used in the creation of this manuscript.
Publisher’s note
All claims expressed in this article are solely those of the authors and do not necessarily represent those of their affiliated organizations, or those of the publisher, the editors and the reviewers. Any product that may be evaluated in this article, or claim that may be made by its manufacturer, is not guaranteed or endorsed by the publisher.
References
1. Araki M, Morino I, Machida T, Sawa Y, Matsueda H, Ohyama H, et al. CO2 column-averaged volume mixing ratio derived over Tsukuba from measurements by commercial airlines. Atmos Chem Phys (2010) 10(16):7659–67. doi:10.5194/acp-10-7659-2010
2. Abshire J, Ramanathan A, Riris H, Mao J, Allan G, Hasselbrack W, et al. Airborne measurements of CO2 column concentration and range using a Pulsed direct-detection IPDA Lidar. Remote Sens (2014) 6(1):443–69. doi:10.3390/rs6010443
3. Zhang Y, Liu J, Chen X, Zhu X, Bi D, Chen W, et al. Sensitivity analysis and correction algorithms for atmospheric CO2 measurements with 1.57-µm airborne double-pulse IPDA LIDAR. Opt Express (2019) 27(22):32679–99. doi:10.1364/oe.27.032679
4. Li M, Gao J, Zhu R, Li X, Wu X, Gao Q, et al. An ultra-sensitive optical H2S sensor based on thermal conversion combined with UV-DOAS: Dynamic detection from ppm to ppb level. Sens Actuators B: Chem (2024) 414:135946. doi:10.1016/j.snb.2024.135946
5. Zhang Q, Mou F, Wei S, Luo J, Wang X, Li S. Vertical profiles of aerosol and NO2 based on mobile multi-axis differential absorption spectroscopy. Atmos Pollut Res (2023) 14(5):101732. doi:10.1016/j.apr.2023.101732
6. Frieß U, Kreher K, Querel R, Schmithüsen H, Smale D, Weller R, et al. Source mechanisms and transport patterns of tropospheric bromine monoxide: findings from long-term multi-axis differential optical absorption spectroscopy measurements at two Antarctic stations. Atmos Chem Phys (2023) 23(5):3207–32.
7. Bayat A, Assarenayati A. How to measure the amount of aerosol optical Thickness in the atmosphere in a simple way: a Calitoo Handheld Sun-photometer measurement. Atmos Environ (2023) 295:119570. doi:10.1016/j.atmosenv.2022.119570
8. Xia M, Li J, Li Z, Gao D, Pang W, Li D, et al. Research on calibration method in lab of direct solar channels of Sun photometer. Chin Opt Lett (2014) 12(12):121201–65. doi:10.3788/col201412.121201
9. Wu X, Yuan J, Wei T, Zhang Y, Wu K, Xia H. Variation of aerosol optical depth measured by Sun photometer at a Rural site near Beijing during the 2017–2019 Period. Remote Sens (2022) 14(12):2908. doi:10.3390/rs14122908
10. Liang A, Gong W, Han G, Xiang C. Comparison of satellite-observed XCO2 from GOSAT, OCO-2, and ground-based TCCON. Remote Sens (2017) 9(10):1033. doi:10.3390/rs9101033
11. Labzovskii L, Kenea S, Lindqvist H, Kim J, Li S, Byun Y, et al. Towards robust calculation of interannual CO2 growth signal from TCCON (total carbon column observing network). Remote Sens (2021) 13(19):3868. doi:10.3390/rs13193868
12. Schneider M, Hase F. Ground-based FTIR water vapour profile analyses. Atmos Meas Tech (2009) 2(2):609–19. doi:10.5194/amt-2-609-2009
13. Feng L, Palmer P, Parker R, Deutscher N, Feist D, Kivi R, et al. Estimates of European uptake of CO2 inferred from GOSAT X CO2 retrievals: sensitivity to measurement bias inside and outside Europe. Atmos Chem Phys (2016) 16(3):1289–302.
14. Frey M, Hase F, Blumenstock T, Groß J, Kiel M, Mengistu T, et al. Calibration and instrumental line shape characterization of a set of portable FTIR spectrometers for detecting greenhouse gas emissions. Atmos Meas Tech (2015) 8(7):3047–57. doi:10.5194/amt-8-3047-2015
15. Tian Y, Hong X, Shan C, Sun Y, Wang W, Zhou M, et al. Investigating the performance of carbon monoxide and methane observations from Sentinel-5 Precursor in China. Remote Sens (2022) 14(23):6045. doi:10.3390/rs14236045
16. Zhang D, Aunan K, Seip H, Larssen S, Liu J, Zhang D. The assessment of health damage caused by air pollution and its implication for policy making in Taiyuan, Shanxi, China. Energy. Policy (2010) 38(1):491–502. doi:10.1016/j.enpol.2009.09.039
17. Wu H, Dong L, Zheng H, Yu Y, Ma W, Zhang L, et al. Beat frequency quartz-enhanced photoacoustic spectroscopy for fast and calibration-free continuous trace-gas monitoring. Nat.Commun. (2017) 8(1):15331. doi:10.1038/ncomms15331
18. Wang J, Wu H, Sampaolo A, Patimisco P, Spagnolo V, Jia S, et al. Quartz-enhanced multiheterodyne resonant photoacoustic spectroscopy. Light Sci Appl (2024) 13(1):77. doi:10.1038/s41377-024-01425-1
19. Wei T, Zifarelli A, Russo S, Wu H, Menduni G, Sampaolo A, et al. High and flat spectral responsivity of quartz tuning fork used as infrared photodetector in tunable diode laser spectroscopy. Appl Phys Rev (2021) 8:041409. doi:10.1063/5.0062415
20. Kinjalk K, Paciolla F, Sun B, Zifarelli A, Menduni G, Giglio M, et al. Highly selective and sensitive detection of volatile organic compounds using long wavelength InAs-based quantum cascade lasers through quartz-enhanced photoacoustic spectroscopy. Appl Phys Rev (2024) 11:021427. doi:10.1063/5.0189501
21. Liu C, Wang G, Zhang C, Patimisco P, Cui R, Feng C, et al. End-to-end methane gas detection algorithm based on transformer and multi-layer perceptron. Opt Express (2024) 32(1):987–1002. doi:10.1364/oe.511813
22. Weidmann D, Wysocki G. High-resolution broadband (>100 cm-1) infrared heterodyne spectro-radiometry using an external cavity quantum cascade laser. Opt Express (2008) 17(1):248–59. doi:10.1364/oe.17.000248
23. Weidmann D, Reburn W, Smith K. Ground-based prototype quantum cascade laser heterodyne radiometer for atmospheric studies. Rev Sci Instrum (2007) 78(7):073107. doi:10.1063/1.2753141
24. Weidmann D, Perrett B, Macleod N, Jenkins R. Hollow waveguide photomixing for quantum cascade laser heterodyne spectro-radiometry. Opt Express (2011) 19(10):9074–85. doi:10.1364/oe.19.009074
25. Hoffmann A, Macleod N, Huebner M, Weidmann D. Thermal infrared laser heterodyne spectroradiometry for solar occultation atmospheric CO2 measurements. Atmos Meas Tech (2016) 9(12):5975–96. doi:10.5194/amt-9-5975-2016
26. Hoffmann A, Huebner M, Macleod N, Weidmann D. Spectrally resolved thermal emission of atmospheric gases measured by laser heterodyne spectrometry. Opt Lett (2018) 43(16):3810–3. doi:10.1364/ol.43.003810
27. Wang J, Wang G, Tan T, Zhu G, Sun C, Cao Z, et al. Mid-infrared laser heterodyne radiometer (LHR) based on a 3.53μm room-temperature interband cascade laser. Opt Express (2019) 27(7):9610–9. doi:10.1364/oe.27.009610
28. Lu X, Huang Y, Wu P, Liu D, Ma H, Wang G, et al. Distributed feedback interband cascade laser based laser heterodyne radiometer for column density of HDO and CH4 measurements at Dunhuang, Northwest of China. Remote Sens (2022) 14(6):1489. doi:10.3390/rs14061489
29. Xue Z, Shen F, Li J, Liu X, Wang J, Wang G, et al. A MEMS modulator-based dual-channel mid-infrared laser heterodyne radiometer for simultaneous remote sensing of atmospheric CH4, H2O and N2O. Opt Express (2022) 30(18):31828–39. doi:10.1364/oe.469271
30. Wilson E, DiGregorio A, Villanueva G, Grunberg C, Souders Z, Miletti K, et al. A portable miniaturized laser heterodyne radiometer (mini-LHR) for remote measurements of column CH4 and CO2. Appl Phys B (2019) 125:211–9. doi:10.1007/s00340-019-7315-8
31. Li J, Tan T, Shen F, Wang G, Liu K, Chen W, et al. Remote sensing of H2O/HDO in the atmospheric column based on a near-infrared laser heterodyne radiometer suppressing local oscillator relative intensity noise. Sens Actuators B: Chem (2024) 419:136405. doi:10.1016/j.snb.2024.136405
Keywords: laser heterodyne, carbon dioxide, column abundance, portable, greenhouse gas
Citation: Wang Y, Zhang M, Wang J, Wang G, Cui R, Dong L and Wu H (2025) Field measurement of atmospheric CO₂ column abundance based on portable laser heterodyne radiometer. Front. Phys. 13:1553252. doi: 10.3389/fphy.2025.1553252
Received: 30 December 2024; Accepted: 21 January 2025;
Published: 04 February 2025.
Edited by:
Kaijie Xu, University of Alberta, CanadaReviewed by:
Jingjing Wang, University of Shanghai for Science and Technology, ChinaZhiwei Liu, Zhejiang Laboratory, China
Copyright © 2025 Wang, Zhang, Wang, Wang, Cui, Dong and Wu. This is an open-access article distributed under the terms of the Creative Commons Attribution License (CC BY). The use, distribution or reproduction in other forums is permitted, provided the original author(s) and the copyright owner(s) are credited and that the original publication in this journal is cited, in accordance with accepted academic practice. No use, distribution or reproduction is permitted which does not comply with these terms.
*Correspondence: Hongpeng Wu, d3VocEBzeHUuZWR1LmNu; Lei Dong, ZG9uZ2xlaUBzeHUuZWR1LmNu