 Kuniyasu Saitoh
94% of researchers rate our articles as excellent or good
Learn more about the work of our research integrity team to safeguard the quality of each article we publish.
Find out more
ORIGINAL RESEARCH article
Front. Phys., 10 March 2025
Sec. Complex Physical Systems
Volume 13 - 2025 | https://doi.org/10.3389/fphy.2025.1548966
This article is part of the Research TopicDynamics of Complex FluidsView all 7 articles
The physics of granular materials, including rheology and jamming, is strongly influenced by cohesive forces between the constituent grains. Despite significant progress in understanding the mechanical properties of granular materials, it remains unresolved how the range and strength of cohesive interactions influence mechanical failure or avalanches. In this study, we use molecular dynamics simulations to investigate simple shear flows of soft cohesive particles. The particles are coated with thin sticky layers, and both the range and strength of cohesive interactions are determined by the layer thickness. We examine shear strength, force chains, particle displacements, and avalanches, and find that these quantities change drastically even when the thickness of the sticky layers is only 1% of the particle diameter. We also analyze avalanche statistics and find that the avalanche size, maximum stress drop rate, and dimensionless avalanche duration are related by scaling laws. Remarkably, the scaling exponents of the scaling laws are independent of the layer thickness but differ from the predictions of mean-field theory. Furthermore, the power-law exponents for the avalanche size distribution and the distribution of the dimensionless avalanche duration are universal but do not agree with mean-field predictions. We confirm that the exponents estimated from numerical data are mutually consistent. In addition, we show that particle displacements at mechanical failure tend to be localized when the cohesive forces are sufficiently strong.
Mechanics of granular materials is of great importance in technologies for sands, foods, and pharmaceutical products [1, 2]. Except for well controlled laboratory experiments, granular materials in nature are usually “wet” with water [3]. Wet granular materials consist of sticky particles, where interactions between them are cohesive due to liquid bridges formed at their contact points [4]. It is known that cohesive interactions strongly influence mechanical properties of granular materials [5]; the critical angle and the angle of repose for landslides significantly increase with the increase of amount of water (or layer thickness), the shear strength (stress) increases with the increase of suction1, the critical acceleration for fluidization of vibrated granular beds increases with the increase of liquid content, and segregation is suppressed and hysteresis is enhanced by the cohesive interactions. Furthermore, it has been suggested that, if granular materials are wet, jamming occurs at low packing fractions and inhomogeneity, i.e., localization of particle motions, is more pronounced [3].
One of the fundamental problems of granular matter is mechanical failure or avalanche which can be related to sediment disasters and earthquakes [6–8]. In seismology, the frequency of earthquake magnitude is explained by the celebrated Gutenberg-Richter (GR) law [7, 8]. As the GR law, statistical properties of mechanical failure are of central interest to physicists, where statistics of avalanches have been studied in the context of self-organized criticality (SOC) [9] or non-equilibrium phase transitions [10]. The SOC indicated by power-law distributions of avalanche (cluster) sizes is realized by a cascade of local failure. Associated the cascade of local mechanical failure with the depinning transition [11], power-law scaling of avalanche size distribution was suggested by a mean-field (MF) theory [12–15]. The MF theory also predicts several scaling laws for slip avalanches and its predictions (including the power-law scaling of avalanche size distribution) have been validated by many experiments of, e.g., granular materials under shear [16–19], compressed nano-crystals [20, 21], bulk metallic glasses [22–25], and light flux from a star [26]. Therefore, the statistics of avalanches have been said to be universal, in the sense that scaling exponents for the avalanche size distribution and other quantities do not depend on any details of materials on a microscopic scale.
In addition to experiments, the statistics of avalanches in granular materials have widely been studied by numerical simulations. Nevertheless, the avalanche size distributions extracted from numerical data quantitatively differ from the MF prediction. For example, the power-law exponents for avalanche size distribution found in molecular dynamics (MD) simulations of foams [27] and athermal quasi-static (AQS) simulations of amorphous solids [28–32] are much smaller than the MF prediction. Moreover, different from the MF theory, a mesoscopic elasto-plastic (EP) model was developed on the basis of yielding transition [33]. The EP model includes a “quadrupolar” elastic propagator in its governing equation and predicts a smaller power-law exponent for avalanche size distribution [34]. Thus, there still exist discrepancies in the theories, experiments, and simulations, and researchers have carefully examined the roles of system size [35], strain rate [36–39], particle inertia [40–43], friction [44, 45], and particle shapes [46, 47] in the statistics of avalanches. However, much less attention has been paid to the influence of cohesive interactions, which are crucial to real granular materials.
In this paper, we carry out numerical simulations of soft cohesive particles under shear. The main aim of our simulations is to clarify effects of cohesive forces (between the particles) on the statistics of avalanches. We employ a cohesive contact model which has been used for the studies of rheology [48–52] and jamming [53–55] of two-dimensional cohesive particles. We assume that our system is in a pendular state, i.e., liquid bridges are formed at contact points so that cohesive interactions are pairwise [4]. We show that not only the statistics of avalanches but also mechanical responses, force-chains, and particle rearrangements are affected by the cohesive interactions even if their range is only 1% of particle diameter. In the following, we explain our numerical methods (Section 2), show our results (Section 3), and discuss our findings (Section 4). All the details of our simulations and supporting data are summarized in Supplementary Material (SM).
In this section, we introduce our numerical methods. We study simple shear deformations of soft cohesive particles in two dimensions by MD simulations. Employing MD simulations, we can easily control the range and strength of cohesive forces, and directly calculate stress from numerical data. Thus, in contrast to the EP model [33] and other continuum models [56], the advantage of our method is that the effect of cohesive interactions on avalanches can be unambiguously examined. In the following, we explain our numerical model of soft cohesive particles (Section 2.1) and show how the system is prepared and applied simple shear deformations (Section 2.2).
In ordinary MD simulations of soft frictionless particles [57], a contact force between the particles,
In contrast, soft cohesive particles are modeled by coating the soft frictionless particles with sticky layers [48–55]. It is assumed that every particle is covered by a thin sticky layer with the thickness
Here,
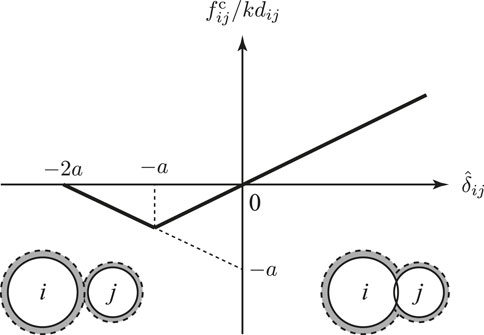
Figure 1. A schematic picture of the scaled magnitude of cohesive force, Equation 1. If the scaled overlap is positive,
We prepare our system as a
To apply simple shear deformations to the system, we employ the Lees-Edwards boundary condition. In each time step, we replace every particle position,
In the following, we analyze the system in a steady state, where the amount of shear strain
In this section, we show our numerical results of soft cohesive particles under shear. First, we examine how the cohesive forces alter force-chain networks (Section 3.1) and affect macroscopic mechanical responses (Section 3.2). Second, we analyze the effect of cohesive interactions on time-averaged stress (Section 3.3). Third, we introduce slip avalanches and examine their dependence on the cohesive interactions (Section 3.4). Then, we study how scaling laws (Section 3.5) and statistics of avalanches (Section 3.6) are changed by the cohesive forces. In addition, we show that localized non-affine displacements are characteristic of avalanches in soft cohesive particles (Section 3.7).
The structure of force-chain networks of soft cohesive particles under shear is strongly influenced by the range of cohesive interactions. Figure 2A displays snapshots of force-chain networks, where the systems are sheared (as indicated by the horizontal arrows in the top panel) and have reached steady states. In this figure, a small system size,

Figure 2. (A) Snapshots of soft cohesive particles under shear, where the particles (circles) are sheared along the horizontal arrows in the top panel. The system size and packing fraction of the particles are given by
We quantify mechanical responses of soft cohesive particles to simple shear deformations by shear stress. We calculate stress tensor of the system according to the Born-Huang expression [63],
Here,
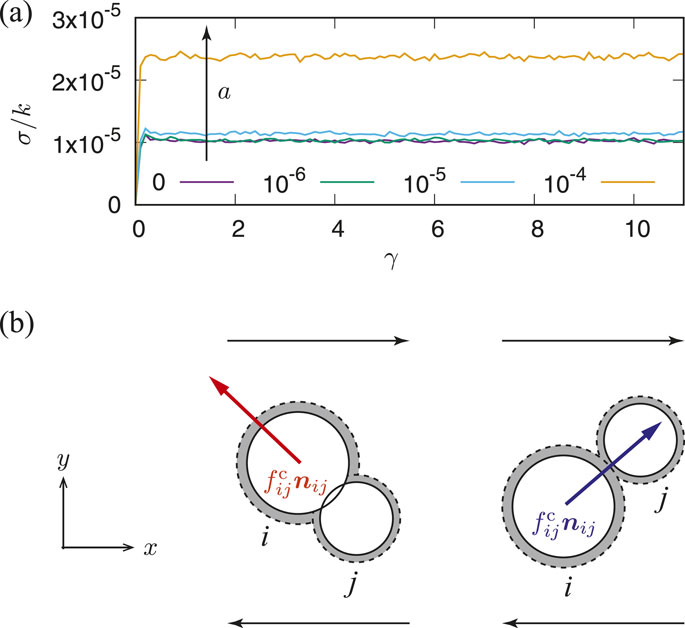
Figure 3. (A) Stress-strain curves,
The influence of cohesive force
To quantify the influence of cohesive forces on the shear stress
where
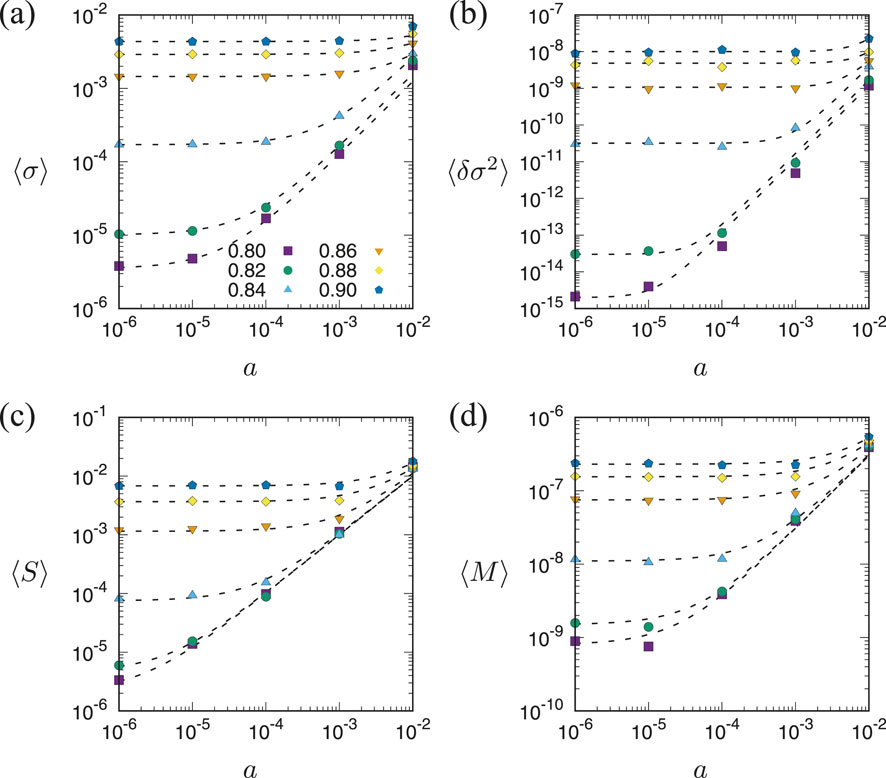
Figure 4. Double logarithmic plots of (A) the mean shear stress, (B) variance of the shear stress, (C) mean avalanche size, and (D) mean maximum stress drop rate as functions of the dimensionless parameter
In addition to the mean shear stress
In contrast to the mean shear stress and stress fluctuations (Section 3.3), slip avalanches characterize plastic responses of the system to simple shear deformations. Closely looking at the stress-strain curve in a steady state (Figure 3A), one observes that the shear stress increasing with the shear strain suddenly drops to a lower value. Such a stress drop event, or slip avalanche, makes the mean shear stress (in a steady state)
where the shear stress
We calculate an average of avalanche sizes as
The slip avalanche defined as Equation 4 can be rephrased as the stress drop rate is negative, i.e.,
Note that we cannot see a clear trend in the mean value of dimensionless avalanche duration
It was predicted by the MF theory of slip avalanches that both
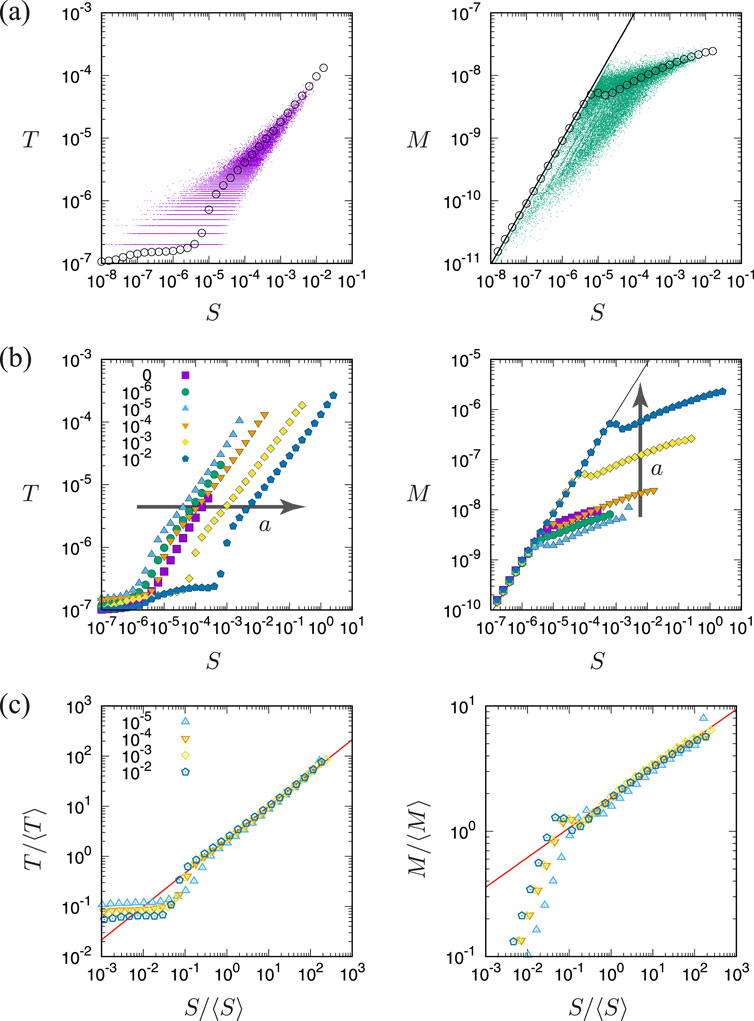
Figure 5. (A) (Left) A scatter plot of the avalanche size
We show that the scaling laws of
where the exponents,
In SM, we show that Equations 5, 6 hold for large avalanches,
In contrast to the mean values,
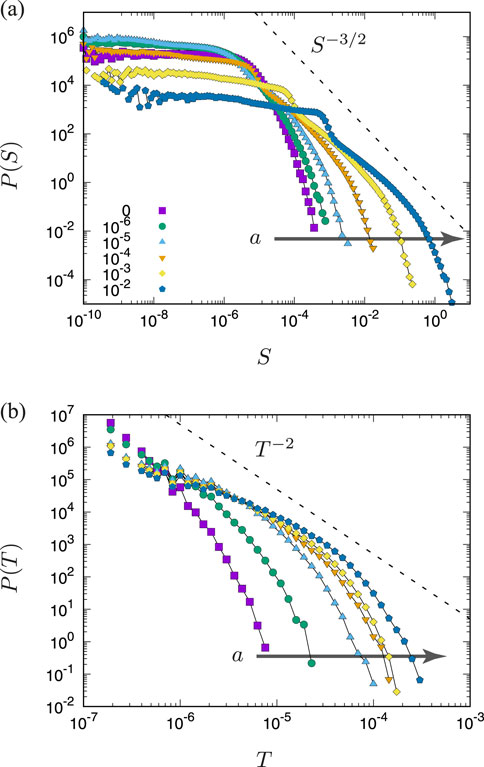
Figure 6. Double logarithmic plots of the PDFs of (A) avalanche sizes,
To analyze the shapes of
(solid line), where the cut-off value [32],
with
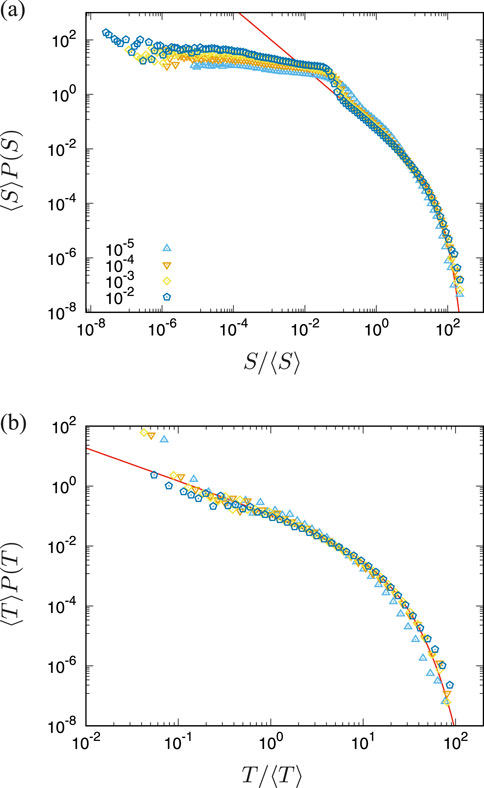
Figure 7. Double logarithmic plots of the scaled PDFs, (A)
Though the power-law exponents,
Because the dimensionless avalanche duration
The MF predictions, i.e.,
In SM, we analyze the effect of packing fraction
In addition, we examine finite size effects on the tails of the scaled PDFs, where Equations 7, 8 well explain our numerical results unless the system size is extremely small (see SM).
On a microscopic scale, a slip avalanche is triggered by rearrangements of the particles under shear. In our MD simulations, particle displacements (in each strain step) can be decomposed as
Note that particle rearrangements are directly linked to restructuring of force-chain networks [85, 86]. Because we calculate the stress tensor by the Born-Huang expression (Eq. (2)), a stress drop event is a consequence of restructuring of force-chains. Figure 2C visualizes the changes of force-chain networks during a slip avalanche. The red (blue) solid lines represent the increase (decrease) of the repulsive forces,
To quantitatively compare the non-affine displacements with the avalanche size
Figure 8A displays double logarithmic plots of the average of MSD
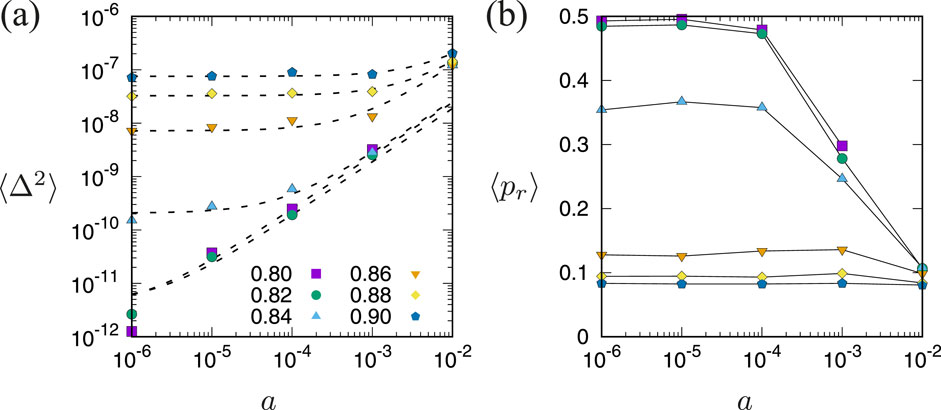
Figure 8. Double logarithmic plots of (A) the average of MSD and (B) mean participation ratio as functions of the dimensionless parameter
Figure 8B shows the mean participation ratio
Finally, we show that the MSD is relevant to the avalanche size
where the exponent estimated from the data of
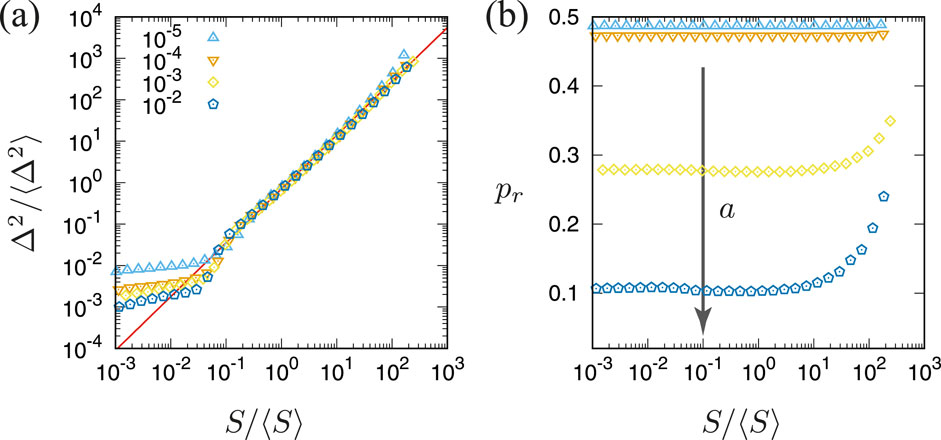
Figure 9. (A) Double logarithmic plots of the scaled avalanche size
In SM, we confirm that the scaling law, Equation 13, holds in
In this study, we have examined mechanical responses of soft cohesive particles to simple shear deformations by MD simulations. In our cohesive contact model [48–50, 53, 54], the range of cohesive interactions is controlled by the dimensionless parameter
One of the characteristic features of soft cohesive particles under shear is the localization of particle rearrangements. We quantified the localization by the participation ratio of non-affine displacements and found that, if the system is less dense as
In our MD simulations, we assumed that the system is in a pendular state, where the cohesive force between the particles is pairwise. However, if the liquid content increases, the system transitions to a funicular or capillary state, where more than two particles interact through the liquid [3,4]. We did not implement such many body interactions into our model though their effects on avalanches are interesting to know. In addition, in real granular materials, cohesive forces are intrinsically history-dependent [57]. Therefore, the influence of hysteresis in cohesive contacts has to be examined in future. Moreover, the effect of particle shapes [47] and simulations in three dimensions are important for practical applications of this work.
In conclusion, the shear strength, force-chains, and particle rearrangements are strongly affected by cohesive forces if the system is less dense. The statistics of avalanches, such as the scaling laws and power-law distributions, are well established even if the system is cohesive though the scaling exponents are distinct from the MF predictions.
The original contributions presented in the study are included in the article/Supplementary Material, further inquiries can be directed to the corresponding author.
KS: Conceptualization, Funding acquisition, Investigation, Visualization, Writing–original draft, Writing–review and editing.
The author(s) declare that financial support was received for the research, authorship, and/or publication of this article. This work was financially supported by the KAKENHI Grant No. 22K03459 from JSPS.
The author declares that the research was conducted in the absence of any commercial or financial relationships that could be construed as a potential conflict of interest.
The author(s) declare that no Generative AI was used in the creation of this manuscript.
All claims expressed in this article are solely those of the authors and do not necessarily represent those of their affiliated organizations, or those of the publisher, the editors and the reviewers. Any product that may be evaluated in this article, or claim that may be made by its manufacturer, is not guaranteed or endorsed by the publisher.
The Supplementary Material for this article can be found online at: https://www.frontiersin.org/articles/10.3389/fphy.2025.1548966/full#supplementary-material
1The suction is defined as the pressure difference between a liquid bridge and air.
2Substituting our estimates,
3We confirmed that
1. Jeager H, Nagel S, Behringer R. Granular solids, liquids, and gases. Rev Mod Phys (1996) 68:1259–73. doi:10.1103/revmodphys.68.1259
2. Bonn D, Denn MM, Berthier L, Divoux T, Manneville S. Yield stress materials in soft condensed matter. Rev Mod Phys (2017) 89:035005. doi:10.1103/revmodphys.89.035005
3. Mitarai N, Nori F. Wet granular materials. Adv Phys (2006) 55:1–45. doi:10.1080/00018730600626065
4. Mitarai N, Nakanishi H. Simple model for wet granular materials with liquid clusters. Eur Phys Lett (2009) 88:64001. doi:10.1209/0295-5075/88/64001
5. Castellanos A. The relationship between attractive interparticle forces and bulk behaviour in dry and uncharged fine powders. Adv Phys (2005) 54:263–376. doi:10.1080/17461390500402657
6. Uhl JT, Pathak S, Schorlemmer D, Liu X, Swindeman R, Brinkman BAW, et al. Universal quake statistics: from compressed nanocrystals to earthquakes. Sci Rep (2015) 5:16493. doi:10.1038/srep16493
7. Hatano T, Narteau C, Shebalin P. Common dependence on stress for the statistics of granular avalanches and earthquakes. Sci Rep (2015) 5:12280. doi:10.1038/srep12280
8. Lherminier S, Planet R, Vehel VL, Simon G, Vanel L, Måløy KJ, et al. Continuously sheared granular matter reproduces in detail seismicity laws. Phys Rev Lett (2019) 122:218501. doi:10.1103/physrevlett.122.218501
9. Bak P, Tang C, Wiesenfeld K. Self-organized criticality: an explanation of the 1/foise. Phys Rev Lett (1987) 59:381–4. doi:10.1103/physrevlett.59.381
11. Fisher DS. Collective transport in random media: from superconductors to earthquakes. Phys Rep (1998) 301:113–50. doi:10.1016/s0370-1573(98)00008-8
12. Dahmen KA, Ben-Zion Y, Uhl JT. A simple analytic theory for the statistics of avalanches in sheared granular materials. Nat Phys (2011) 7:554–7. doi:10.1038/nphys1957
13. Fisher DS, Dahmen K, Ramanathan S, Ben-Zion Y. Statistics of earthquakes in simple models of heterogeneous faults. Phys Rev Lett (1997) 78:4885–8. doi:10.1103/physrevlett.78.4885
14. Dahmen KA, Ben-Zion Y, Uhl JT. Micromechanical model for deformation in solids with universal predictions for stress-strain curves and slip avalanches. Phys Rev Lett (2009) 102:175501. doi:10.1103/physrevlett.102.175501
15. Dahmen KA, Ertaş D, Ben-Zion Y. Gutenberg-Richter and characteristic earthquake behavior in simple mean-field models of heterogeneous faults. Phys Rev E (1998) 58:1494–501. doi:10.1103/physreve.58.1494
16. Geller DA, Ecke RE, Dahmen KA, Backhaus S. Stick-slip behavior in a continuum-granular experiment. Phys Rev E (2015) 92:060201. doi:10.1103/physreve.92.060201
17. Denisov DV, Lörincz KA, Uhl JT, Dahmen KA, Schall P. Universality of slip avalanches in flowing granular matter. Nat Commun (2016) 7:10641. doi:10.1038/ncomms10641
18. Denisov DV, Lörincz KA, Wright WJ, Hufnagel TC, Nawano A, Gu X, et al. Universal slip dynamics in metallic glasses and granular matter – linking frictional weakening with inertial effects. Sci Rep (2017) 7:43376. doi:10.1038/srep43376
19. Long AA, Denisov DV, Schall P, Hufnagel TC, Gu X, Wright WJ, et al. From critical behavior to catastrophic runaways: comparing sheared granular materials with bulk metallic glasses. Granular Matter (2019) 21:99. doi:10.1007/s10035-019-0946-y
20. Friedman N, Jennings AT, Tsekenis G, Kim JY, Tao M, Uhl JT, et al. Statistics of dislocation slip avalanches in nanosized single crystals show tuned critical behavior predicted by a simple mean field model. Phys Rev Lett (2012) 109:095507. doi:10.1103/physrevlett.109.095507
21. Csikor FF, Motz C, Weygand D, Zaiser M, Zapperi S. Dislocation avalanches, strain bursts, and the problem of plastic forming at the micrometer scale. Science (2007) 318:251–4. doi:10.1126/science.1143719
22. Antonaglia J, Wright WJ, Gu X, Byer RR, Hufnagel TC, LeBlanc M, et al. Bulk metallic glasses deform via slip avalanches. Phys Rev Lett (2014) 112:155501. doi:10.1103/physrevlett.112.155501
23. Antonaglia J, Xie X, Schwarz G, Wraith M, Qiao J, Zhang Y, et al. Tuned critical avalanche scaling in bulk metallic glasses. Sci Rep (2014) 4:4382. doi:10.1038/srep04382
24. Coleman JP, Meng F, Tsuchiya K, Beadsworth J, LeBlanc M, Liaw PK, et al. Effect of annealing on nanoindentation slips in a bulk metallic glass. Phys Rev B (2017) 96:134117. doi:10.1103/physrevb.96.134117
25. Sun BA, Yu HB, Jiao W, Bai HY, Zhao DQ, Wang WH. Plasticity of ductile metallic glasses: a self-organized critical state. Phys Rev Lett (2010) 105:035501. doi:10.1103/physrevlett.105.035501
26. Sheikh MA, Weaver RL, Dahmen KA. Avalanche statistics identify intrinsic stellar processes near criticality in KIC 8462852. Phys Rev Lett (2016) 117:261101. doi:10.1103/physrevlett.117.261101
27. Tewari S, Schiemann D, Durian DJ, Knobler CM, Langer SA, Liu AJ. Statistics of shear-induced rearrangements in a two-dimensional model foam. Phys Rev E (1999) 60:4385–96. doi:10.1103/physreve.60.4385
28. Maloney C, Lemaitre A. Subextensive scaling in the athermal, quasistatic limit of amorphous matter in plastic shear flow. Phys Rev Lett (2004) 93:016001. doi:10.1103/physrevlett.93.016001
29. Maloney CE, Lemaitre A. Amorphous systems in athermal, quasistatic shear. Phys Rev E (2006) 74:016118. doi:10.1103/physreve.74.016118
30. Bailey NP, Schiøtz J, Lemaitre A, Jacobsen KW. Avalanche size scaling in sheared three-dimensional amorphous solid. Phys Rev Lett (2007) 98:095501. doi:10.1103/physrevlett.98.095501
31. Heussinger C, Chaudhuri P, Barrat JL. Fluctuations and correlations during the shear flow of elastic particles near the jamming transition. Soft Matter (2010) 6:3050. doi:10.1039/b927228c
32. Shang B, Guan P, Barrat JL. Elastic avalanches reveal marginal behavior in amorphous solids. Proc Natl Acad Sci USA (2020) 117:86–92. doi:10.1073/pnas.1915070117
33. Nicolas A, Ferrero EE, Martens K, Barrat JL. Deformation and flow of amorphous solids: insights from elastoplastic models. Rev Mod Phys (2018) 90:045006. doi:10.1103/revmodphys.90.045006
34. Lin J, Lerner E, Rosso A, Wyart M. Scaling description of the yielding transition in soft amorphous solids at zero temperature. Proc Natl Acad Sci USA (2014) 111:14382–7. doi:10.1073/pnas.1406391111
35. Dubey AK, Hentschel HGE, Procaccia I, Singh M. Statistics of plastic events in post-yield strain-controlled amorphous solids. Phys Rev B (2016) 93:224204. doi:10.1103/physrevb.93.224204
36. White RA, Dahmen KA. Driving rate effects on crackling noise. Phys Rev Lett (2003) 91:085702. doi:10.1103/physrevlett.91.085702
37. Behringer RP, Bi D, Chakraborty B, Henkes S, Hartley RR. Phys Rev Lett (2008) 101:268301. doi:10.1103/physrevlett.101.268301
38. Lootens D, VanDamme H, Hébraud P. Giant stress fluctuations at the jamming transition. Phys Rev Lett (2003) 90:178301. doi:10.1103/physrevlett.90.178301
39. Liu C, Ferrero EE, Puosi F, Barrat JL, Martens K. Driving rate dependence of avalanche statistics and shapes at the yielding transition. Phys Rev Lett (2016) 116:065501. doi:10.1103/physrevlett.116.065501
40. Khfifi M, Loulidi M. Scaling properties of a rice-pile model: inertia and friction effects. Phys Rev E (2008) 78:051117. doi:10.1103/physreve.78.051117
41. Salerno KM, Maloney CE, Robbins MO. Phys Rev Lett (2012) 109:105703. doi:10.1103/physrevlett.109.105703
42. Salerno KM, Robbins MO. Effect of inertia on sheared disordered solids: critical scaling of avalanches in two and three dimensions. Phys Rev E (2013) 88:062206. doi:10.1103/physreve.88.062206
43. Karimi K, Ferrero EE, Barrat JL. Inertia and universality of avalanche statistics: the case of slowly deformed amorphous solids. Phys Rev E (2017) 95:013003. doi:10.1103/physreve.95.013003
44. Barés J, Wang D, Wang D, Bertrand T, O’Hern CS, Behringer RP. Local and global avalanches in a two-dimensional sheared granular medium. Phys Rev E (2017) 96:052902. doi:10.1103/physreve.96.052902
45. Saitoh K. The role of friction in statistics and scaling laws of avalanches. Eur Phys J E (2021) 44:85. doi:10.1140/epje/s10189-021-00089-8
46. Peña AA, McNamara S, Lind PG, Herrmann HJ. Avalanches in anisotropic sheared granular media. Granular Matter (2009) 11:243–52. doi:10.1007/s10035-009-0136-4
47. Murphy KA, Dahmen KA, Jaeger HM. Transforming mesoscale granular plasticity through particle shape. Phys Rev X (2019) 9:011014. doi:10.1103/physrevx.9.011014
48. Irani E, Chaudhuri P, Heussinger C. Impact of attractive interactions on the rheology of dense athermal particles. Phys Rev Lett (2014) 112:188303. doi:10.1103/physrevlett.112.188303
49. Irani E, Chaudhuri P, Heussinger C. Athermal rheology of weakly attractive soft particles. Phys Rev E (2016) 94:052608. doi:10.1103/physreve.94.052608
50. Irani E, Chaudhuri P, Heussinger C. Discontinuous shear-thinning in adhesive dispersions. Phys Rev Fluids (2019) 4:074307. doi:10.1103/physrevfluids.4.074307
51. Chaudhuri P, Berthier L, Bocquet L. Inhomogeneous shear flows in soft jammed materials with tunable attractive forces. Phys Rev E (2012) 85:021503. doi:10.1103/physreve.85.021503
52. Zheng W, Liu H, Xu N. Shear-induced solidification of athermal systems with weak attraction. Phys Rev E (2016) 94:062608. doi:10.1103/physreve.94.062608
53. Koeze DJ, Tighe BP. Sticky matters: jamming and rigid cluster statistics with attractive particle interactions. Phys Rev Lett (2018) 121:188002. doi:10.1103/physrevlett.121.188002
54. Koeze DJ, Hong L, Kumar A, Tighe BP. Elasticity of jammed packings of sticky disks. Phys Rev Res (2020) 2:032047. doi:10.1103/physrevresearch.2.032047
55. Lois G, Blawzdziewicz J, O’Hern CS. Jamming transition and new percolation universality classes in particulate systems with attraction. Phys Rev Lett (2008) 100:028001. doi:10.1103/physrevlett.100.028001
56. Herrera-Valencia EE, Sánchez-Villavicencio ML, Soriano-Correa C, Bautista O, Ramírez-Torres LA, Hernández-Abad VJ, et al. Study of the electroosmotic flow of a structured fluid with a new generalized rheological model. Rheol Acta (2024) 63:3–32. doi:10.1007/s00397-023-01418-8
57. Luding S. Anisotropy in cohesive, frictional granular media. J Phys Condens Matter (2005) 17:S2623–40. doi:10.1088/0953-8984/17/24/017
58. van Hecke M. Jamming of soft particles: geometry, mechanics, scaling and isostaticity. J Phys Condens Matter (2010) 22:033101. doi:10.1088/0953-8984/22/3/033101
59. O’Hern CS, Silbert LE, Liu AJ, Nagel SR. Jamming at zero temperature and zero applied stress: the epitome of disorder. Phys Rev E (2003) 68:011306. doi:10.1103/physreve.68.011306
60. Radjai F, Roux S. Turbulentlike fluctuations in quasistatic flow of granular media. Phys Rev Lett (2002) 89:064302. doi:10.1103/physrevlett.89.064302
61. Mizuno H, Hachiya M, Ikeda A. Structural, mechanical, and vibrational properties of particulate physical gels. J Chem Phys (2021) 155:234502. doi:10.1063/5.0072863
62. Mizuno H, Hachiya M, Ikeda A. Phonon transport properties of particulate physical gels. J Chem Phys (2022) 156:204505. doi:10.1063/5.0090233
64. MiDi GDR. On dense granular flows. Eur Phys J E (2004) 14:341–65. doi:10.1140/epje/i2003-10153-0
65. da Cruz F, Emam S, Prochnow M, Roux JN, Chevoir F. Rheophysics of dense granular materials: discrete simulation of plane shear flows. Phys Rev E (2005) 72:021309. doi:10.1103/physreve.72.021309
66. Hatano T. Power-law friction in closely packed granular materials. Phys Rev E (2007) 75:060301. doi:10.1103/physreve.75.060301
67. Azéma E, Radjaï F. Internal structure of inertial granular flows. Phys Rev Lett (2014) 112:078001. doi:10.1103/PhysRevLett.112.078001
68. Rognon PG, Roux JN, Naaïm M, Chevoir F. Dense flows of cohesive granular materials. J Fluid Mech (2008) 596:21–47. doi:10.1017/s0022112007009329
69. Singh A, Magnanimo V, Saitoh K, Luding S. Effect of cohesion on shear banding in quasistatic granular materials. Phys Rev E (2014) 90:022202. doi:10.1103/physreve.90.022202
70. Olsson P, Teitel S. Herschel-bulkley shearing rheology near the athermal jamming transition. Phys Rev Lett (2012) 109:108001. doi:10.1103/physrevlett.109.108001
71. Andreotti B, Barrat JL, Heussinger C. Shear flow of non-brownian suspensions close to jamming. Phys Rev Lett (2012) 109:105901. doi:10.1103/physrevlett.109.105901
72. Vågberg D, Olsson P, Teitel S. Universality of jamming criticality in overdamped shear-driven frictionless disks. Phys Rev Lett (2014) 113:148002. doi:10.1103/physrevlett.113.148002
73. Kawasaki T, Coslovich D, Ikeda A, Berthier L. Diverging viscosity and soft granular rheology in non-Brownian suspensions. Phys Rev E (2015) 91:012203. doi:10.1103/physreve.91.012203
74. Olsson P. Dimensionality and viscosity exponent in shear-driven jamming. Phys Rev Lett (2019) 122:108003. doi:10.1103/physrevlett.122.108003
75. Lerner E, Procaccia I. Locality and nonlocality in elastoplastic responses of amorphous solids. Phys Rev E (2009) 79:066109. doi:10.1103/physreve.79.066109
76. Karmakar S, Lerner E, Procaccia I. Statistical physics of the yielding transition in amorphous solids. Phys Rev E (2010) 82:055103. doi:10.1103/physreve.82.055103
77. Hentschel HGE, Karmakar S, Lerner E, Procaccia I. Size of plastic events in strained amorphous solids at finite temperatures. Phys Rev Lett (2010) 104:025501. doi:10.1103/physrevlett.104.025501
78. Karmakar S, Lerner E, Procaccia I, Zylberg J. Statistical physics of elastoplastic steady states in amorphous solids: finite temperatures and strain rates. Phys Rev E (2010) 82:031301. doi:10.1103/physreve.82.031301
79. Dasgupta R, Karmakar S, Procaccia I. Universality of the plastic instability in strained amorphous solids. Phys Rev Lett (2012) 108:075701. doi:10.1103/physrevlett.108.075701
80. Talamali M, Petäjä V, Vandembroucq D, Roux S. Avalanches, precursors, and finite-size fluctuations in a mesoscopic model of amorphous plasticity. Phys Rev E (2011) 84:016115. doi:10.1103/physreve.84.016115
81. Saitoh K, Mizuno H. Anomalous energy cascades in dense granular materials yielding under simple shear deformations. Soft Matter (2016) 12:1360–7. doi:10.1039/c5sm02760h
82. Saitoh K, Mizuno H. Exstrophy cascades in two-dimensional dense granular flows. Phys Rev E (2016) 94:022908. doi:10.1103/physreve.94.022908
83. Saitoh K, Mizuno H. Anisotropic decay of the energy spectrum in two-dimensional dense granular flows. Phys Rev E (2017) 96:012903. doi:10.1103/physreve.96.012903
84. Mizuno H, Saitoh K, Silbert LE. Elastic moduli and vibrational modes in jammed particulate packings. Phys Rev E (2016) 93:062905. doi:10.1103/physreve.93.062905
85. Saitoh K, Magnanimo V, Luding S. A Master equation for the probability distribution functions of forces in soft particle packings. Soft Matter (2015) 11:1253–8. doi:10.1039/c4sm02452d
86. Saitoh K, Oyama N, Ogushi F, Luding S. Transition rates for slip-avalanches in soft athermal disks under quasi-static simple shear deformations. Soft Matter (2019) 15:3487–92. doi:10.1039/c8sm01966e
Keywords: granular materials, avalanche, plasticity, cohesive interaction, molecular dynamics
Citation: Saitoh K (2025) Shear strength, avalanches, and structures of soft cohesive particles under shear. Front. Phys. 13:1548966. doi: 10.3389/fphy.2025.1548966
Received: 20 December 2024; Accepted: 20 February 2025;
Published: 10 March 2025.
Edited by:
Francisco Vega Reyes, University of Extremadura, SpainReviewed by:
Edtson Emilio Herrera Valencia, National Autonomous University of Mexico, MexicoCopyright © 2025 Saitoh. This is an open-access article distributed under the terms of the Creative Commons Attribution License (CC BY). The use, distribution or reproduction in other forums is permitted, provided the original author(s) and the copyright owner(s) are credited and that the original publication in this journal is cited, in accordance with accepted academic practice. No use, distribution or reproduction is permitted which does not comply with these terms.
*Correspondence: Kuniyasu Saitoh, ay5zYWl0b2hAY2Mua3lvdG8tc3UuYWMuanA=
Disclaimer: All claims expressed in this article are solely those of the authors and do not necessarily represent those of their affiliated organizations, or those of the publisher, the editors and the reviewers. Any product that may be evaluated in this article or claim that may be made by its manufacturer is not guaranteed or endorsed by the publisher.
Research integrity at Frontiers
Learn more about the work of our research integrity team to safeguard the quality of each article we publish.