 Ruihan Wu
- 1School of Software, Taiyuan University of Technology, Taiyuan, China
- 2School of Information, Shanxi University of Finance and Economics, Taiyuan, China
The Internet of Vehicles, as a new generation of information infrastructure that integrates multiple industries such as automotive, information communication, and transportation, is currently in a rapid development stage. However, its data supply chain involves numerous stakeholders and faces severe challenges in terms of data sharing, security, and regulation. To address this issue, this paper utilizes evolutionary game theory, setting key variables such as the strategy set, probability combination, and game behavior of each stakeholder to construct a tripartite evolutionary game model and its replicator dynamic equations, involving the Internet of Vehicles data sharing platform, vehicle manufacturers, and sellers. We studied the equilibrium solutions of this model and conducted an in-depth analysis of the local stability of the equilibrium state. Through simulation analysis, we explored the interference factors and their mechanisms of action in the interaction and dynamic changes during the evolutionary process and analyzed the impact of different parameters on the system’s evolution. The experimental results show that compensation mechanisms and the risk of information leakage have a significant impact on decision-making behavior; enhancing the security technology of the data-sharing platform and the construction of the data governance system, as well as implementing corresponding incentive and punitive measures, can promote the system to reach a stable state. The results of this study provide a scientific and reasonable decision-making basis for core enterprises in the Internet of Vehicles data supply chain, helping them to more effectively supervise and coordinate the data sharing behavior of downstream enterprises, thereby enhancing the collaborative effect of the entire supply chain system and improving the overall competitiveness and stability of the supply chain.
1 Introduction
As a new generation of information infrastructure that links multiple industries such as the automotive industry, information and communication, transportation, and electric power, the Internet of Vehicles has become an important driving force for promoting the transformation and upgrading of the automotive industry. Not only has it promoted the vigorous development of the digital economy, but it has also improved the efficiency of data resource utilization. With the integration of cutting-edge technologies such as smart cars and the Internet of Things, vehicles are no longer merely simple means of transportation but have become huge data generation terminals. This development trend has not only posed new demands on transportation systems and urban planning but has also made the scientific management and efficient utilization of Internet of Vehicles data urgent. Currently, the Internet of Vehicles not only involves the massive data generated by built-in and external vehicle devices but also includes numerous data processing entities such as intelligent connected vehicle manufacturers, Internet of Vehicles service platforms, and operating enterprises. Moreover, data collaboration among various institutions in the industry chain has gradually exposed difficulties such as data sharing, data security, and data regulation [1–3].
To address these issues, scholars have conducted extensive work in areas such as privacy protection in vehicular networks, data classification and grading, and trust mechanisms. In terms of privacy protection, He et al. [4] proposed a method based on blockchain technology and local differential privacy, aiming to protect the location data privacy in vehicular networks. Han et al. [5] utilized an NDN-based IoV architecture combined with mobile edge computing technology to address issues related to data transmission, security, and privacy protection in IoV. Xu et al. [6] proposed a secure privacy protection communication protocol based on elliptic curve cryptography to tackle various security threats and attacks that may arise in vehicular network systems. Wang et al. [7] proposed a blockchain-based privacy-preserving federated learning scheme, on which they developed a reputation-based incentive mechanism to encourage vehicular network users to actively participate in federated learning and remain honest. In terms of data classification and grading, Chen et al. [8] proposed a blockchain model based on master-slave multi-chains, aiming to address the challenges of data classification, grading, storage, and access control. This model, based on data stakeholders, master-slave chain networks, and IPFS, enables data owners to classify and manage sensitive data. Bai et al. [9] proposed a hierarchical model for transportation administrative data, which is based on factors such as scale, precision, and depth. This model establishes data levels through security risk analysis, addressing the classification and grading issues in transportation administrative data management, and helps prevent data leakage and illegal use. Feng et al. [10] introduced the development of data security classification and grading, analyzed the principles of data security classification and grading in some fields and shared practices, and finally put forward ideas and development suggestions for data security classification and grading. In terms of trust mechanisms, Chen et al. [11] adopted a deep reinforcement learning approach and proposed an algorithm called deep policy gradient action quantization (DPGAQ) to address trust and security issues in intelligent vehicular networks. Rathee et al. [12] proposed a vehicular network trust framework based on the tidal trust mechanism (TTM) and contract theory (CT). TTM evaluates the trustworthiness between devices, and CT verifies the reliability of context predictions, improving the trust and accuracy of data sharing. Haseeb et al. [13] proposed an autonomous vehicle routing protocol for vehicular networks based on 6G technology, employing simulated annealing optimization technology to establish the routing process, and improving the energy optimization of IoT vehicles. Wang et al. [14] proposed a federated learning-based trust evaluation scheme for vehicular cloud collaborative systems, constructing a hierarchical trust model. Through federated learning, they achieved personalization at the device, data, and model levels, addressing the issue of node trust changes caused by network topology changes.
Most of the aforementioned literature has partially achieved the security and governance of vehicular network data sharing from a technical perspective. However, these solutions have some limitations and ignore the impact and constraints of different stakeholders’ behavioral strategies on other participants. They fail to use dynamic system theory to analyze the decision-making behaviors of each participant [15]. From an economic perspective, vehicular networks involve data processing entities composed of multiple stakeholders, and data sharing in vehicular networks is a continuous and bounded rationality process in which all parties seek to maximize their own interests [16]. For example, vehicle manufacturers may choose not to share or provide false information services to evade legal responsibilities for data security governance. Vehicle sales companies may choose not to share or upload distorted data to avoid the leakage of trade secrets, which will hinder the development of the vehicular network industry.
Evolutionary game theory [17, 18] can analyze the costs, benefits, and losses of each stakeholder’s decision-making behavior in the system and dynamically reflect the evolutionary trends of each party’s strategic choices [19]. Therefore, this paper constructs a game model based on evolutionary game theory to model the behavioral interactions of the three stakeholders in the vehicular network data sharing platform (core enterprises), manufacturing enterprises, and sales enterprises (downstream enterprises). Through numerical simulations, the possibility of the existence of game equilibrium and its evolutionary trends are verified, focusing on the impact of factors such as data leakage risk, compensation mechanisms, and synergistic effects on each party’s strategic choices. This paper provides reasonable suggestions for the core enterprises in the vehicular network data supply chain to better regulate and coordinate the data sharing behaviors of downstream enterprises, in order to achieve synergistic effects among downstream enterprises, improve the connectivity of the supply chain system, and enhance the overall benefits of the supply chain.
2 Basic assumptions
2.1 Basic assumptions
Assumption 1. The game participants consist of three behavioral entities, namely, the Internet of Vehicles Data Sharing Platform (core enterprise), manufacturing enterprises (equipment manufacturers, car manufacturers, etc.), and sales enterprises (4S stores, insurance companies, etc.). The three parties play different roles in the supply chain game, with the Internet of Vehicles Data Sharing Platform serving as the core, holding a leadership position, and being responsible for the distribution of benefits and the supervision of downstream enterprises.
Assumption 2. The strategy sets of manufacturing enterprises and sales enterprises are both either to share data or not to share data. Not sharing data will lead to information lag. The core enterprise needs to share information with other members of the supply chain and monitor their data-sharing behavior. Its strategy set is either to supervise or not to supervise.
Assumption 3. The core enterprise encourages downstream enterprises to share data through management mechanisms to improve supply chain efficiency. If downstream enterprises fail to share key information in a timely manner and cause damage to the overall interests of the supply chain, the platform will impose penalties, reducing their benefits and compensating other enterprises that share data. This mechanism is only activated when the platform implements a supervision strategy.
Assumption 4. When both manufacturing enterprises and sales enterprises share data, a synergistic effect is triggered, meaning the total revenue of the entire supply chain will exceed the sum of the revenues of each enterprise. Conversely, if either party or both parties do not share data, the synergistic effect cannot be achieved.
Assumption 5. The probability of the core enterprise choosing the “supervision” strategy is
Based on the aforementioned assumptions, the profit and loss analysis for the core enterprise encompasses its fundamental revenue, synergistic gains from supply chain collaboration, data sharing incentives, supervision costs, sharing costs, and the potential risks associated with data leakage. Similarly, the profit and loss analysis for downstream enterprises includes their basic revenue, synergistic benefits, data sharing rewards, sharing costs, and information leakage risks. Evidently, synergistic gains exhibit a positive correlation with the synergy coefficient, the enterprises’ data utilization efficiency, and the sufficiency of data sharing. Specifically, the synergistic gains for the IoV platform, manufacturing enterprises, and sales enterprises are denoted as
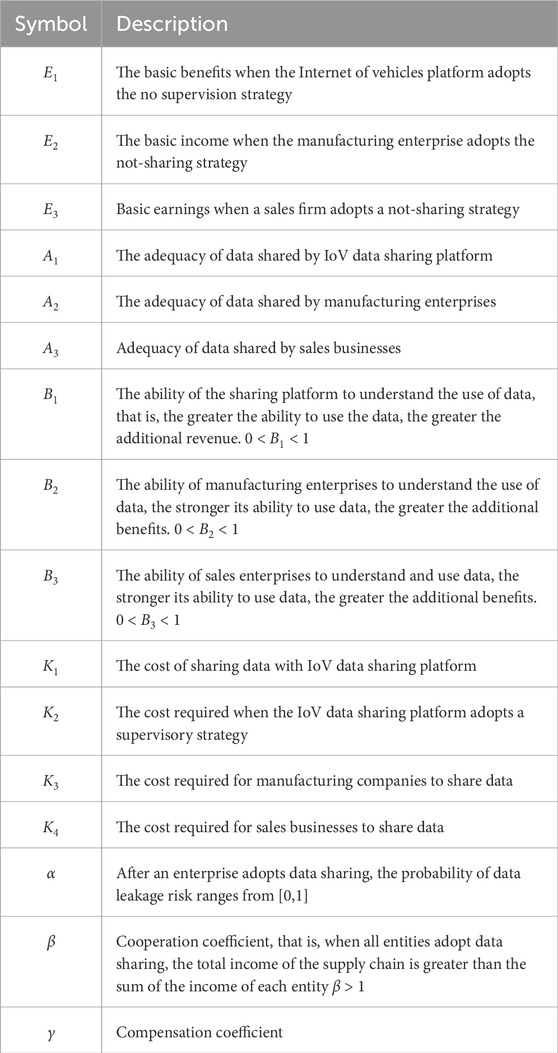
Table 1. Description of model parameters.
2.2 Payoff matrix
In this paper, the strategy combination of the three parties will be represented in the form of a set, denoted as
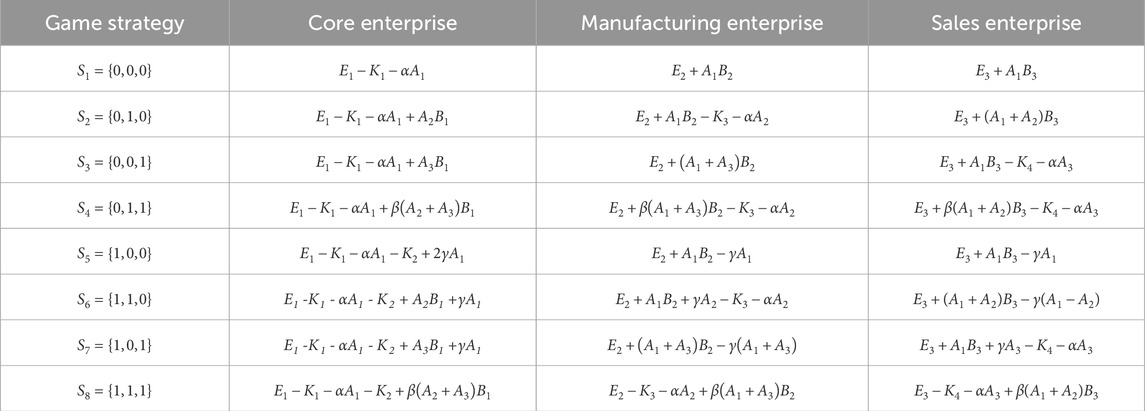
Table 2. The profit matrix of the three participants.
3 Model establishment
3.1 Replicator dynamics equation and phase diagram of the internet of vehicles platform
When the Internet of Vehicles (IoV) platform selects “no supervision”, the expected return is
The replication dynamic equation of the IoV platform is
Take the first derivative of
The probability that the IoV platform chooses supervision is in a stable state, it needs to satisfy condition
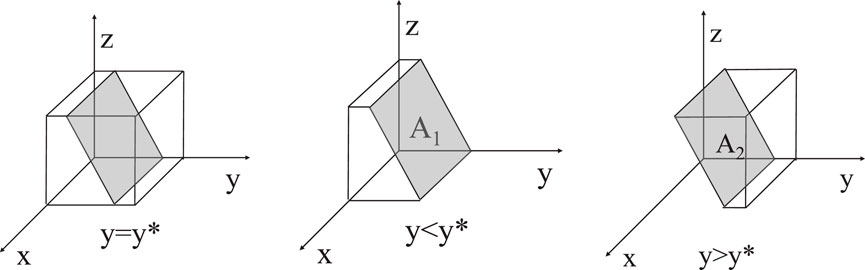
Figure 1. Phase diagram of IoV data sharing platform.
3.2 Replicator dynamics equation and phase diagram of manufacturing enterprise
The expected return of the manufacturing enterprise when it selects “not sharing” is
The replication dynamic equation of a manufacturing firm is:
By taking the derivative of y, can obtain
Based on the stability theorem of differential equation, the probability that the manufacturing enterprise chooses to share is in a stable state must meet the following conditions:
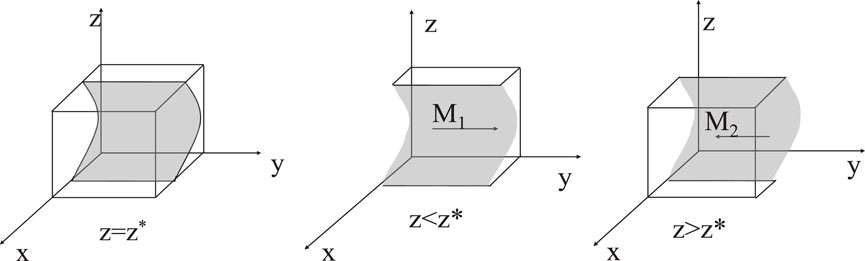
Figure 2. Phase diagram of manufacturing enterprise.
3.3 Replicator dynamics equation and phase diagram of sales enterprise
The expected return of a selling firm when it selects “Not share” is
The replication dynamic equation for a sales enterprise is:
For derivation
Based on the stability theorem of differential equation, the probability that the sales enterprise chooses to share is in a stable state must meet the following conditions:
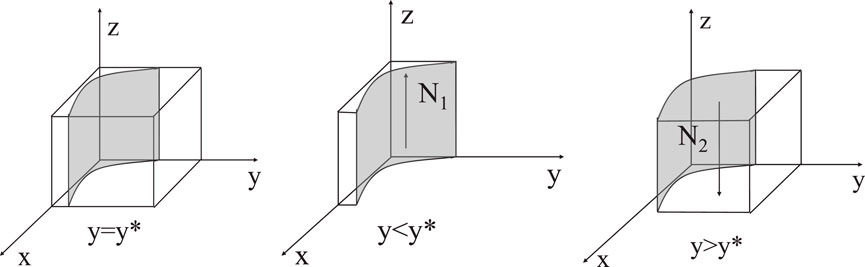
Figure 3. Sales enterprise phase diagram1.
4 Stability analysis of the model’s equilibrium points
4.1 Jacobian matrix
The asymptotically stable solution of the replicator dynamics equation is a strict Nash equilibrium. In the evolutionary game system, eight pure strategy equilibrium solutions can be obtained. According to Lyapunov’s stability theory [20], when all eigenvalues of the Jacobian matrix are negative, the corresponding equilibrium point is the asymptotically stable point of the system. The Jacobian matrix is shown as (12).
Among them,
4.2 Stability analysis
By substituting the eight equilibrium points into the Jacobian matrix, the eigenvalues of each equilibrium point can be obtained, as shown in Table 3. From the above analysis, it can be seen that when the parameters change, the evolutionary stability strategy of the system will also change. The stability of the equilibrium points is shown in Table 4. Among them, there are three unstable points, and the remaining uncertain points will be discussed next.
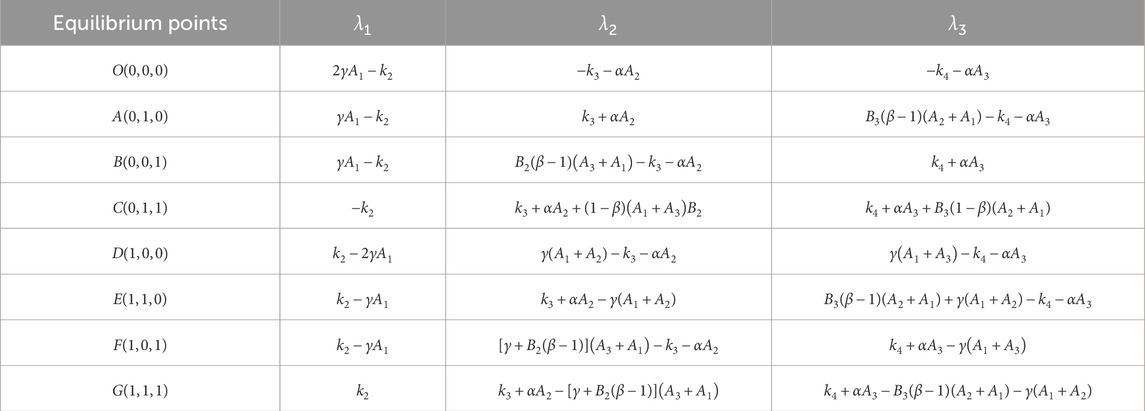
Table 3. System equilibrium points and eigenvalues.
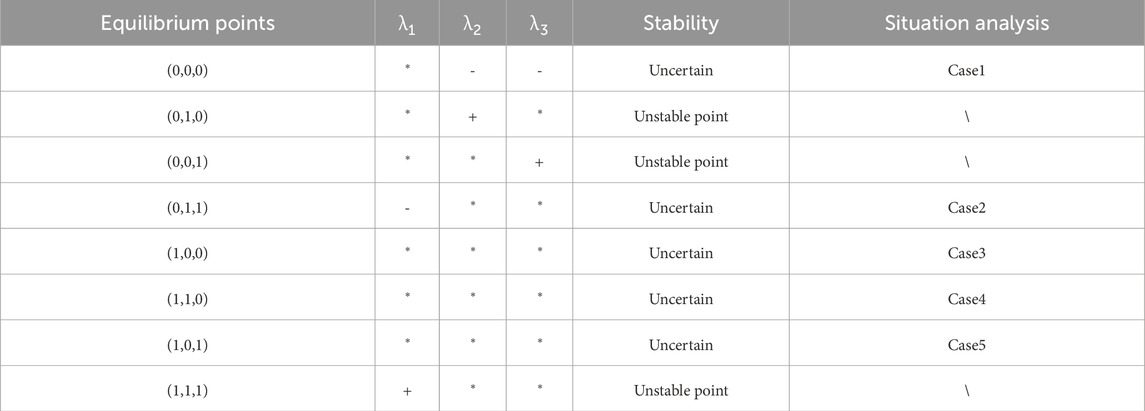
Table 4. Stability analysis of equilibrium points.
Case1: When

Figure 4. Diagram of the evolution path under case1.
Case 2: when
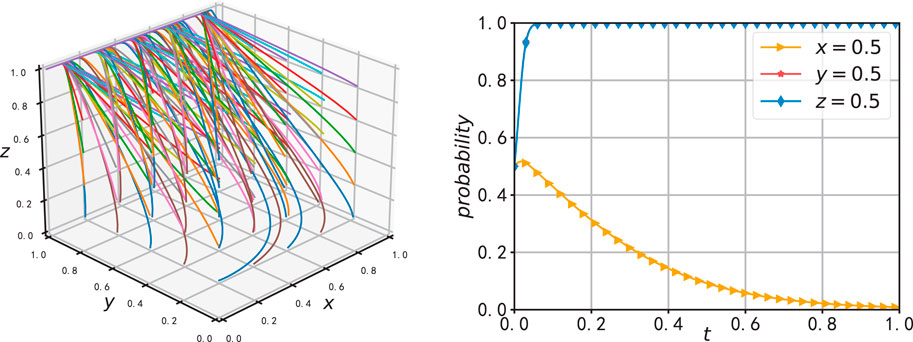
Figure 5. Diagram of the evolution path under case 2.
Case 3: When
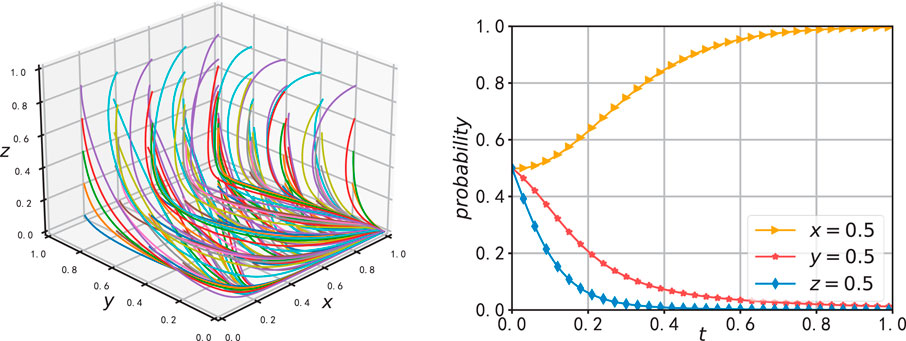
Figure 6. Diagram of the evolution path under case 3.
Case 4: when
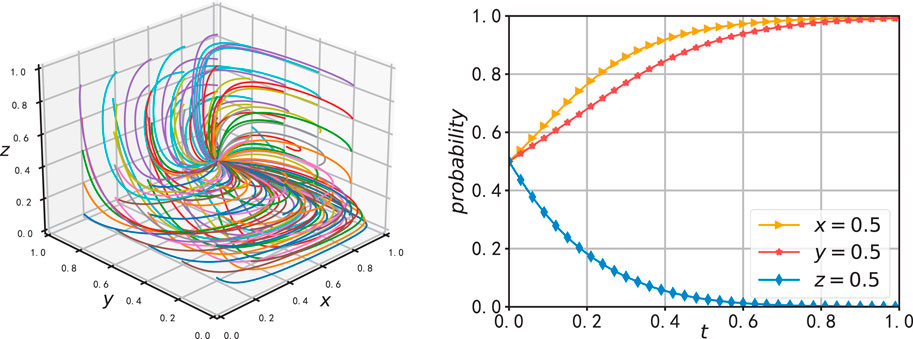
Figure 7. Diagram of the evolution path under case 4.
Case 5: when
5 Simulation analysis
5.1 The impact of various initial strategies on evolution
Due to the interconnected nature of the data-sharing platform for vehicle networks, manufacturing enterprises, and sales enterprises within the same dynamic system, the stability of strategies from one side will affect the other two. In the simulation experiment, the same initial parameters as in Case 2 were used. The initial selection probabilities of the three stakeholders were incrementally increased to analyze the impact of these changes on the evolutionary path.
In Figure 8, the initial selection probabilities of
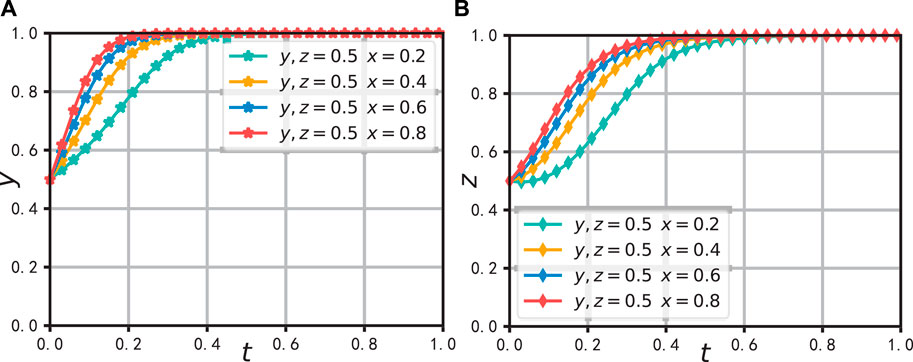
Figure 8. The effect of a change in x on the evolution of system. (A) Effect on the evolution of y (B) Effect on the evolution of z.
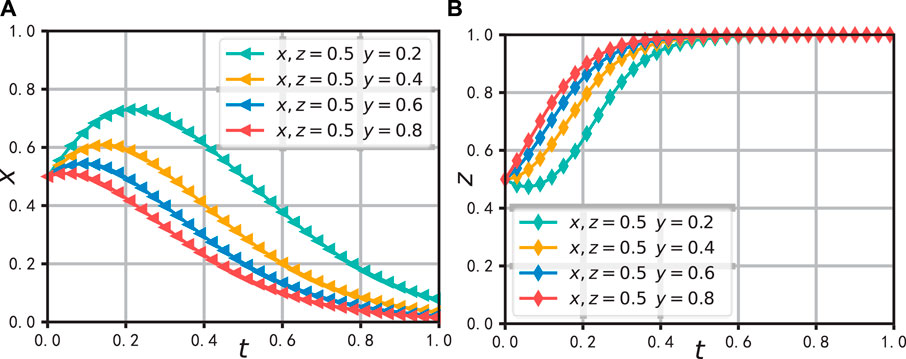
Figure 9. The effect of a change in y on the evolution of system. (A) Effect on the evolution of x (B) Effect on the evolution of z.
In Figure 9, the probability of strategy selection by manufacturing enterprises was increased from 0.2 to 0.8 to observe the evolution trend of the entire system. As shown in Figure 10A, the data-sharing platform of the Internet of Vehicles would quickly converge to an unsupervised strategy and remain relatively stable, while sales enterprises would adopt an active data sharing strategy, as illustrated in Figure 9B. This indicates that the active data sharing behavior of manufacturing enterprises would prompt sales enterprises to select data sharing strategies, thereby achieving synergistic benefits. Similarly, it would also encourage the sharing platform to reduce the intensity of supervision, thereby achieving the goal of saving supervision costs.
In Figure 10, the probability of strategy selection by sales enterprises is increased from 0.2 to 0.8 to observe the evolution trend of the entire system. Similar to Figure 9, the proactive data sharing behavior of sales enterprises will induce manufacturing enterprises to choose a data sharing strategy, thereby achieving collaborative benefits, and will likewise prompt the data sharing platform to reduce the supervision intensity, thus achieving the goal of saving supervision costs.
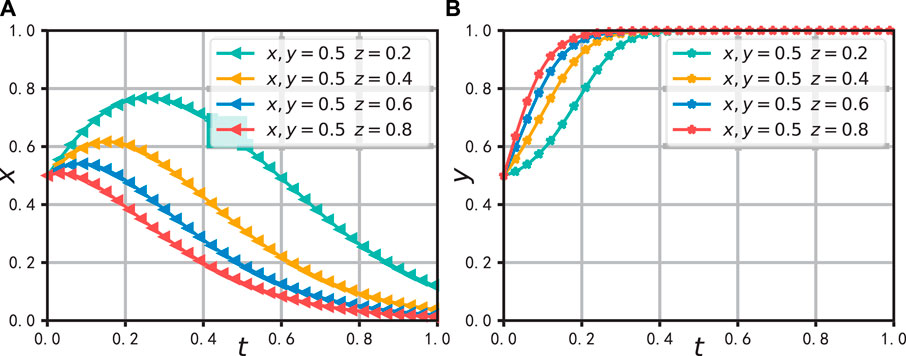
Figure 10. The effect of a change in z on the evolution of system. (A) Effect on the evolution of x (B) Effect on the evolution of y.
5.2 Influence of compensation coefficient γ on system evolution at equilibrium point (0, 0, 0)
When
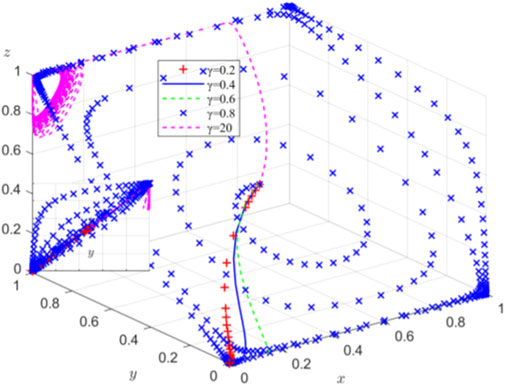
Figure 11. Simulation analysis of γ-value in case 1.
5.3 Influence of cooperation coefficient β on system evolution at equilibrium point (0,1,1)
When
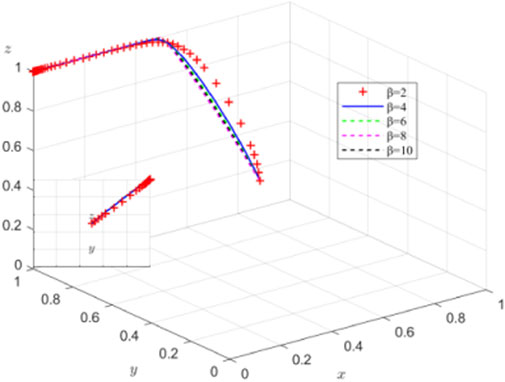
Figure 12. Simulation analysis diagram of βvalues in case 2.
5.4 Effects of compensation coefficient and cost on system evolution at equilibrium point (1,0,0)
When
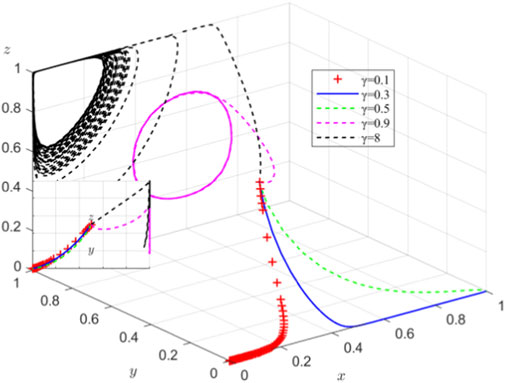
Figure 13. Simulation analysis diagram of values
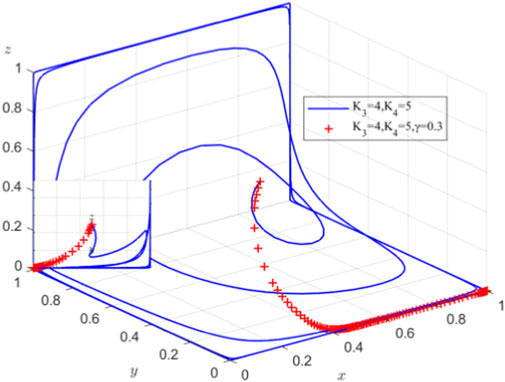
Figure 14. Simulation analysis diagram of
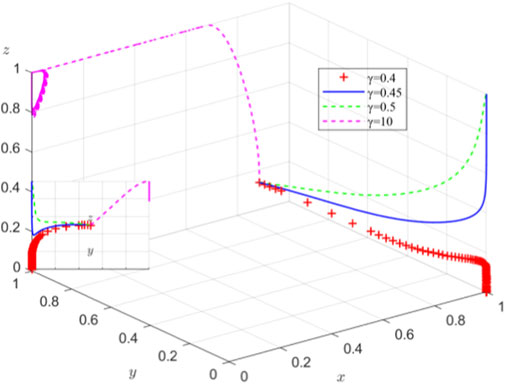
Figure 15. Simulation analysis diagram of
5.5 Effects of compensation coefficient and cost on system evolution at equilibrium point (1,0,1)
When
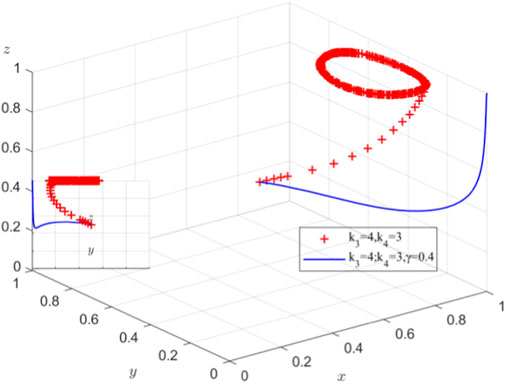
Figure 16. Simulation analysis diagrams of
6 Conclusion
In this paper, we investigate the dynamic game process of data sharing behaviors among shared platforms, manufacturing enterprises, and sales enterprises in the Internet of Vehicles data supply chain. We establish an evolutionary game model for the data sharing behavior decisions of the three game participants and conduct an in-depth analysis of the model to determine the key factors affecting stable cooperation among supply chain decision-makers. By summarizing the previous content, the following conclusions are drawn.
(1) Clarifying the positive and negative impacts of key factors is crucial for the effective management of the Internet of Vehicles (IoV) data supply chain. Studies have shown that improving the adequacy of data sharing, enhancing the understanding and utilization capabilities of data by various entities in the supply chain, increasing reasonable compensation coefficients, and enhancing collaborative coefficients can all positively promote the optimization of the IoV data supply chain game system. Conversely, an increase in the supervision costs of the sharing platform, an increase in the data sharing costs of manufacturing and sales enterprises, and an increase in the risk coefficient of data leakage will negatively affect system optimization. Therefore, in practical applications, the positive effects of favorable factors should be actively amplified, and the negative effects of unfavorable factors should be effectively controlled within a reasonable range. This will stimulate the cooperation willingness of all entities in the industry chain and promote the coordinated and sustainable development of the IoV data supply chain.
(2) In the IoV data supply chain, the decision-making behaviors of various participating entities are intertwined and influence each other. To comprehensively and deeply analyze the evolutionary game process, it is necessary to organically combine theoretical analysis with numerical simulation experiments. In terms of theoretical analysis, we used Lyapunov stability theory to derive the inequality conditions that ensure the asymptotic stability of each equilibrium point. These inequality conditions preliminarily reveal the intrinsic rules of strategy evolution for participants in the IoV data supply chain. However, due to the interdependence of participants’ decisions, relying solely on theoretical analysis makes it difficult to accurately judge the overall evolutionary trend of the system. Therefore, combining numerical simulation experiments can not only verify the correctness of theoretical analysis but, more importantly, vividly show the specific paths and trends of system evolution, thereby obtaining more comprehensive and in-depth research conclusions.
(3) The strategy combination {No supervision, Share data, Share data} (i.e., strategy set {0,1,1}) has been proven to be the optimal strategy choice for the tripartite game entities in the IoV data supply chain. The optimization analysis results of the equilibrium point indicate that the system’s final evolutionary trend stabilizes at the equilibrium point (0,1,1). This suggests that, ideally, the IoV data sharing platform does not need to invest excessive supervision costs, while manufacturing and sales enterprises can still actively and proactively share data and maintain high enthusiasm for cooperation without external supervisory constraints. Under this positive interaction, the entire IoV data supply chain system is expected to generate robust synergistic effects with the active collaboration of all participants, ultimately achieving long-term stability and high-quality development of the supply chain. This research conclusion provides valuable theoretical insights and practical guidance for constructing an efficient and stable IoV data supply chain system.
In summary, this paper delves into the dynamic game mechanism of data sharing behavior in the IoV data supply chain and, through the construction and analysis of an evolutionary game model, reveals the key factors affecting stable cooperation in the supply chain and the realization path of the optimal strategy combination. The research results not only provide new perspectives for the academic community to deeply understand the data sharing behavior in the IoV data supply chain but also offer valuable decision-making references for the industry to enhance data supply chain management levels.
Data availability statement
The original contributions presented in the study are included in the article/supplementary material, further inquiries can be directed to the corresponding author.
Author contributions
RW: Conceptualization, Data curation, Formal Analysis, Funding acquisition, Investigation, Methodology, Project administration, Resources, Software, Supervision, Validation, Visualization, Writing–original draft, Writing–review and editing. JY: Formal Analysis, Writing–review and editing.
Funding
The author(s) declare that no financial support was received for the research, authorship, and/or publication of this article.
Conflict of interest
The authors declare that the research was conducted in the absence of any commercial or financial relationships that could be construed as a potential conflict of interest.
Generative AI statement
The author(s) declare that no Generative AI was used in the creation of this manuscript.
Publisher’s note
All claims expressed in this article are solely those of the authors and do not necessarily represent those of their affiliated organizations, or those of the publisher, the editors and the reviewers. Any product that may be evaluated in this article, or claim that may be made by its manufacturer, is not guaranteed or endorsed by the publisher.
References
1. Hemmati A, Zarei M, Rahmani AM. A systematic review of congestion control in internet of vehicles and vehicular ad hoc networks: techniques, challenges, and open issues. Int J Commun Syst (2024) 37(1):e5625. doi:10.1002/dac.5625
2. Guo J, Bilal M, Qiu Y, Qian C, Xu X, Raymond Choo KK. Survey on digital twins for Internet of Vehicles: fundamentals, challenges, and opportunities. Digital Commun Networks (2024) 10(2):237–47. doi:10.1016/j.dcan.2022.05.023
3. Sahu BL, Chandrakar P. Blockchain-oriented secure communication and smart parking model for internet of electric vehicles in smart cities. Peer-to-Peer Networking Appl (2025) 18(1):51–17. doi:10.1007/s12083-024-01872-y
4. Han X, Tian D, Duan X, Sheng Z, Zhou J, Leung VC. A dual mode privacy-preserving scheme enabled secure and anonymous for edge computing assisted internet of vehicle networks. Proc 11th ACM Symp Des Anal Intell Vehicular Networks Appl (2021) 65–70. doi:10.1145/3479243.3487310
5. He M, Bai F, Zhang C, Shen T, Gong B. A blockchain-enabled location privacy-preserving under local differential privacy for internet of vehicles. Proc 2022 4th Blockchain Internet Things Conf (2022) 84–91. doi:10.1145/3559795.3559807
6. Xu J, Li M, He Z, Anwlnkom T. Security and privacy protection communication protocol for Internet of vehicles in smart cities. Comput Electr Eng (2023) 109:108778. doi:10.1016/j.compeleceng.2023.108778
7. Wang N, Yang W, Wang X, Wu L, Guan Z, Du X, et al. A blockchain based privacy-preserving federated learning scheme for Internet of Vehicles. Digital Commun Networks (2024) 10(1):126–34. doi:10.1016/j.dcan.2022.05.020
8. Chen M, Yuan L, Xia T. Data classified and graded access control model based on master-slave multi-chain. J Comput Appl (2024) 44:1148–57. doi:10.11772/j.issn.1001-9081.2023040529
9. Bai Z, Wang T, Guo M. Classification and grading method of transportation government data. J Inf Security Res (2023) 9(8):808. doi:10.12379/j.issn.2096-1057.2023.08.13
10. Feng Z, Yu L, Ma Y, Zhong H, Jiang W. Research and practice of data security classification and grading. Inf Commun Technol Pol (2021) 47(8):45. doi:10.12267/j.issn.2096-5931.2021.08.007
11. Chen M, Yi M, Huang M, Huang G, Ren Y, Liu A. A novel deep policy gradient action quantization for trusted collaborative computation in intelligent vehicle networks. Expert Syst Appl (2023) 221:119743. doi:10.1016/j.eswa.2023.119743
12. Rathee G, Garg S, Kaddoum G, Choi BJ, Benslimane A, Hassan MM. A secure and trusted context prediction for next generation autonomous vehicles. Alexandria Eng J (2023) 78:131–40. doi:10.1016/j.aej.2023.07.020
13. Haseeb K, Rehman A, Saba T, Bahaj SA, Wang H, Song H. Efficient and trusted autonomous vehicle routing protocol for 6G networks with computational intelligence. ISA Trans (2023) 132:61–8. doi:10.1016/j.isatra.2022.09.035
14. Wang D, Yi Y, Yan S, Wan N, Zhao J. A node trust evaluation method of vehicle-road-cloud collaborative system based on federated learning. Ad Hoc Networks (2023) 138:103013. doi:10.1016/j.adhoc.2022.103013
15. Gao Y, Zhu Z, Yang J. An evolutionary game analysis of stakeholders’ decision-making behavior in medical data sharing. Mathematics (2023) 11(13):2921. doi:10.3390/math11132921
16. Hu C, Yang J, Gao P, Zhang Y. Evolutionary game analysis of three stakeholders in big data trading market. J Ind Manage Optimization (2024) 20(6):2135–52. doi:10.3934/jimo.2023159
17. Feng L, Zhang L, Wang J, Feng J. How to promote the participation of enterprises using open government data? Evolutionary game analysis by applying dynamic measures. Expert Syst Appl (2024) 238:122348. doi:10.1016/j.eswa.2023.122348
18. Lv Y, Yang J, Sun X, Wu H. Evolutionary game analysis of stakeholder privacy management in the AIGC model. Operations Res Perspect (2025) 14:100327. doi:10.1016/j.orp.2025.100327
19. Tang J, Wu W, Zhao D, Chen X. Evolutionary game and simulation analysis of intelligent connected vehicle industry with cross-border collaborative innovation. IEEE Access (2023) 11:17721–30. doi:10.1109/access.2023.3245078
Keywords: internet of vehicles, data sharing, stakeholders, evolutionary game, simulation analysis
Citation: Wu R and Yang J (2025) A tripartite evolutionary game analysis of stakeholder decision-making behavior in the internet of vehicles data supply chain. Front. Phys. 13:1542666. doi: 10.3389/fphy.2025.1542666
Received: 10 December 2024; Accepted: 24 February 2025;
Published: 28 March 2025.
Edited by:
Dun Han, Jiangsu University, ChinaReviewed by:
Yasuko Kawahata, Rikkyo University, JapanMin Xu, Chinese Academy of Fishery Sciences, China
Copyright © 2025 Wu and Yang. This is an open-access article distributed under the terms of the Creative Commons Attribution License (CC BY). The use, distribution or reproduction in other forums is permitted, provided the original author(s) and the copyright owner(s) are credited and that the original publication in this journal is cited, in accordance with accepted academic practice. No use, distribution or reproduction is permitted which does not comply with these terms.
*Correspondence: Ruihan Wu, 2023005562@link.tyut.edu.cn