 Guoping Zhang
 Yali Li1,2*
 Abdul Rauf
 Muhammad Aamir Afzal
 Parvez Ali
 Adnan Aslam
- 1School of Software, Pingdingshan University, Pingdingshan, China
- 2Henan International Joint Laboratory for Multidimensional Topology and Carcinogenic Characteristics Analysis of Atmospheric Particulate Matter PM2.5, Pingdingshan, China
- 3Department of Mathematics, Air University Multan Campus, Multan, Pakistan
- 4Department of Mechanical Engineering, College of Engineering, Qassim University, Buraydah, Saudi Arabia
- 5Department of Natural Sciences and Humanities, University of Engineering and Technology, Lahore, Pakistan
Lyme disease, caused by the bacterium Borrelia burgdorferi and transmitted through infected black-legged ticks, remains a significant health concern due to its potential for severe complications, including arthritis, neurological disorders, and cardiac issues. Early diagnosis and treatment are essential to prevent these outcomes. This study explores the predictive potential of reverse degree-based entropy indices for analyzing the molecular structures of therapeutic compounds used in Lyme disease treatment. While the use of topological indices for predicting physicochemical properties is well-established, our research uniquely integrates reverse entropy indices with a computational framework to refine the prediction process. We focus specifically on antibiotic drugs such as doxycycline, ceftriaxone, Doxy 100, cefotaxime, Ceftin, Cefuroxime, Erythromycin, EryPed, Erythrocin Lactobionate, Ofloxacin, Moxifloxacin, amoxicillin, and penicillin G potassium—commonly used to treat Lyme disease—and leverage a novel Maple-based algorithm for calculating reverse degree-based entropy indices. SPSS software was employed to assess correlations between these indices and critical physicochemical properties, such as molecular weight (MW), complexity (C), molar volume (MV), and XLog P. Unlike traditional experimental methods mandated by regulatory authorities for Chemistry, Manufacturing, and Controls (CMC) processes, our approach provides a supplementary predictive framework to streamline early-stage drug property estimation. The results reveal that first reverse Zagreb entropy effectively predicts molecular weight, reverse atom bond connectivity entropy effectively predicts complexity, reverse augmented Zagreb entropy effectively predicts molar volume and reverse geometric arithmetic entropy effectively predicts molecular XLog P. This study not only advances the computational methodology by employing novel combinations of entropy indices but also builds on existing work by focusing on a specific subset of Lyme disease drugs. While this framework offers a cost-effective preliminary tool for predicting physicochemical properties, it complements rather than replaces rigorous experimental validation required for regulatory reporting. These findings lay the groundwork for integrating computational and experimental methods, potentially accelerating drug development and enhancing therapeutic precision for Lyme disease.
1 Introduction
Lyme disease is a disease spread by ticks. Because of a complex interplay of ecological, medicinal, and environmental elements, tick bites are the primary means of transmitting bacteria under the skin, where they can cause severe illness. The common symptoms include rash, headache, and fever. If left untreated, this disease can lead to more severe problems with the heart, joints, and brain. Thus, Lyme disease is being identified more frequently in patients with symptoms that are medically inexplicable [1, 2], as well as in individuals with more clearly recognized diseases [3, 4].
A new chapter in understanding of this sickness was opened in 1982 [5] when the causative agent was found in Ixodes ticks. Lyme disease is the most prevalent vector-borne illness (transmitted by mosquitoes, ticks, or fleas) in the United States. In recent years, the Centers for Disease Control and Prevention have reported approximately 20,000 to 30,000 confirmed cases annually [6]. Additionally, children and individuals who spend a lot of time outside in wooded areas are at risk. Once an Ixodes tick bite has occurred, humans become infected. For the disease-causing bacteria, Borrelia burgdorferi, to proliferate, the tick must feed for a minimum of 36 h. The most common sign of infection is erythema migrants, a developing red rash that appears at the site of the tick bite and usually appears a week or more after the incident [7]. Most often, the rash is not uncomfortable or annoying.
In roughly 70%–80% of the cases, a rash develops. Fatigue, headaches, and fever are possible symptoms. The total number of cases has been smoothly increasing, with cases recorded not only from endemic regions but increasingly from other Regional locations [8].
Prolonged, untreated Lyme disease can result in serious complications affecting multiple systems. Neurological issues may include facial palsy (Bell’s palsy), meningitis, encephalitis, and peripheral neuropathy. Cardiac complications can involve irregular heartbeat and inflammation of the heart muscle. Joint problems, such as arthritis, are also common. To reduce the risk of tick-borne infections, preventive measures are crucial. Wearing protective clothing, such as long-sleeved shirts, long pants tucked into socks, and closed-toe shoes, can help minimize skin exposure to ticks. Applying insect repellents containing DEET or picaridin to exposed skin provides an additional layer of protection. Regularly performing tick checks on yourself, your family, and pets after outdoor activities is vital for early detection. If a tick is found, it should be removed promptly and carefully using fine-tipped tweezers. Showering soon after being outdoors can also help wash away unattached ticks and make it easier to spot those that may have latched on. These simple precautions can significantly reduce the likelihood of tick infections [9]. A variety of antibiotics, including cefuroxime, amoxicillin, and doxycycline, are effective in treating Lyme disease and preventing complications when administered promptly.
In conclusion, the fusion of multiple scientific domains has prompted the creation of cutting-edge methodologies and analytical instruments that deepen our understanding of complex systems. Returning to the medical field, Lyme disease is still an issue that needs to be addressed on a regular basis due to its complexity and long-term consequences [10, 11]. Education and prevention efforts are also needed.
A graph
Topological indices are widely used in chemistry, nanotechnology, and medicine to explore and quantify the relationships between molecular structure and properties, as well as structure and biological or chemical activity. These indices are essential as numerical molecular descriptors in quantitative structure-activity relationship (QSAR) and quantitative structure-property relationship (QSPR) models, which help in predicting molecular behaviors [14, 15].
The Wiener index, introduced by Wiener [16], was the first topological index to demonstrate a clear correlation between the boiling points of alkane molecules and the values of this index. Further research into quantitative structure-activity relationships has shown that such correlations extend to other molecular properties, including dimensions [17], density, surface tension, liquid-phase viscosity [18], and van der Waals surface area [19]. These relationships enable the prediction of molecular properties and behaviors based on structural characteristics.
Applications of graph invariant (topological indices) to QSPR and QSAR studies have garnered significant attention in recent years. Topological indices are employed in many fields of study, including arithmetic, physics, chemistry, biology, and informatics [20–22]. This thorough and systematic basis makes it easier to comprehend how a chemical molecule’s molecular structure influences its physical, chemical, and biological properties. Nonetheless, their most important applications to date have been the non-empirical Quantitative Structure-Property Relationships (QSPR) and Quantitative Structure-Activity Relationships (QSAR) [23–26]. These days, the main focus of computational chemistry is on the investigation of QSPRs, or quantitative structure-property correlations. Classifications of topological indices can be based on a graph’s structural attributes, including matching, spectrum, vertex degree, and vertex separation. The indices that are most commonly used are the Wiener index [16], which measures the separation between the vertices, the Zagreb and Randi
Many topological indices having applications in QSPR/QSAR have been developed since 1947 [31, 32]. Some examples of topological indices include the 1stZagreb index [33], the 2ndZagreb index, redefined first Zagreb index [34], redefined second Zagreb index [35], geometric arithmetic index [36], augmented Zagreb index [37], the atom-bond connectivity index [38], forgotten index [39], hyper-Zagreb index [40], redefined third Zagreb [41], and Balaban index [42].
Reverse degree-based indices employ a cutting-edge technique that challenges conventional wisdom and offers a distinct perspective in computing and mathematical domains [43]. Entropy indices derived from information theory, provides a method for quantifying disorder and uncertainty, with applications in environmental science and data science. In mathematical and computational contexts, reversing the traditional degree ordering in polynomial or numerical expressions yields a distinctive approach known as reverse degree-based indices [44]. This contemporary indexing method has applications in fields such as signal processing, mathematics, and computer science. Within mathematics, one particularly intriguing area is the development of techniques for solving equations by employing reverse degree-based indices.
Shannon introduced the concept of entropy in 1948 [45], providing a foundation for estimating a system’s uncertainty through the entropy of a probability distribution. The concept of graph entropy was first introduced by Rashevsky in 1955 [46] in relation to the classification of vertex orbits. Recently, graph entropies have been extensively utilized in the fields of biology, ecology, chemistry, and sociology [47]. In graph entropy, a graph element associated with a probability distribution can be divided into embedded and external measurements [48]. Dehmer’s information-based function graph entropy examines the characteristics and structural data of these graphs [45, 49].
In this work, we have considered eight graph entropy measures based on reverse degree of a graph. These graph entropy measures include reverse Randic entropy, reverse atom-bond connectivity entropy, reverse geometric arithmetic entropy, reverse first Zagreb entropy, reverse second Zagreb entropy, reverse hyper Zagreb entropy, reverse forgotten entropy, and reverse augmented Zagreb entropy. The values of these entropy indices are computed for thirteen drugs structures using MAPPLE software. Additionally, the regression models are developed to estimate the four key physical properties of these drugs.
The paper is structured as follows: In Section 2, we provide the definitions of the eight entropy indices based on the reverse degree of a graph. Section 3 outlines the research methodology, which is illustrated with a flow chart. In Section 4, we compute the entropy indices for the drug structures using MAPPLE software. Section 5 presents the development of the regression model for the physical properties of the drug structures, along with the calculation of correlation coefficients and other regression parameters using SPSS software. A detailed discussion of the results obtained from the regression models is presented in Section 6. The validation of the regression models is performed in Section 7. Limitations and future directions are discussed in Section 8 and finally, Section 9 concludes the article.
2 Reverse degree based entropy indices
In this section, we define some basic definitions related to graph theory.
2.1 Reverse degree
The degree of a vertex
here in this manuscript, we considered the special case when k = 1, we represent the reverse degree of a vertex v simply by
2.2 Reverse degree-based entropy of graph
Assume that a connected graph
Now if
Using the fundamental theorem of graph theory, we formulate the following relation for the sum of reverse degrees
As a result, the above equation for ENTΨ (H) takes the form
2.3 Edge weight-based entropy of a graph
Chen et al. (2014) introduced the edge weight graph’s entropy. For an edge weight graph H = (V(H); E(H): Ψ(xy)), where V(H) is the vertex set, E(H) is the edge set and Ψ(xy) is the edge weight of the edge (xy) in H, the entropy function is defined as:
2.4 Reverse Randi
If Ψ(xy)=(
Incorporating it in Equation 2 gives the reverse Randi
We use the notations RE to denote the Reverse Randi
2.5 Reverse atom bond connectivity entropy
If Ψ(xy) =
This leads to the reverse atom bond connectivity entropy by using Equation 2 as
2.6 The reverse geometric arithmetic entropy
If Ψ(xy) =
Now, Equation 2 reduces to the reverse geometric arithmetic entropy, which is as follows:
2.7 The reverse first zagreb entropy
If Ψ(xy) =
For the reverse first Zagreb entropy, we use this value in Equation 2. This gives
2.8 The reverse second zagreb entropy
If Ψ(xy) =
Now for the reverse second Zagreb entropy, we use this value in Equation 2. This gives
2.9 The reverse hyper zagreb entropy
If Ψ(xy)= (
Now for the reverse hyper Zagreb entropy, we use this value in Equation 2. This gives
2.10 The reverse forgotten entropy
If Ψ(xy)= (
By using Equation 2, the reverse forgotten entropy is expressed in the form of
2.11 The reverse augmented zagreb entropy
If Ψ(xy)=(
By using Equation 2, the reverse augmented Zagreb entropy has the form
Despite extensive efforts in Quantitative Structure-Property Relationship (QSPR) analysis, much of the existing work relies heavily on classical degree-based topological indices to model the physicochemical properties of molecules. While these indices have demonstrated utility, they often fail to capture the full complexity and intricacies of molecular structures, particularly when dealing with drugs exhibiting diverse structural and functional characteristics, such as those used in the treatment of Lyme disease. This limitation creates a significant research gap in developing more accurate and statistically robust predictive models. The novelty of this study lies in the use of reverse degree-based entropy indices, which combine the principles of molecular topology and information theory. Unlike classical indices, entropy indices provide a richer quantification of structural variability and disorder within molecular graphs. The reverse formulation further enhances their sensitivity to subtle differences in molecular architecture.
3 Research methodology
This research employs a structured approach to investigate the relationship between graph entropy measures and the physical properties of drug structures. Eight graph entropy measures based on the reverse degree of a graph are considered in this study. These entropy measures are selected for their relevance to structural descriptors in cheminformatics and their ability to capture complex topological properties of molecular graphs. Thirteen drug structures, which represent various pharmacological classes, are selected for the analysis. The molecular graphs of these drugs are constructed based on their chemical structure, where atoms are represented as nodes and bonds as edges. The structures are obtained from standard chemical databases pubchem, ensuring that accurate molecular representations are used. The entropy indices for each drug structure are computed using MAPPLE software, which is capable of efficiently handling graph-based computations. Each of the eight entropy measures is calculated for the molecular graphs of the thirteen drug structures. These entropy values are then used as descriptors for further analysis and correlation with physical properties of the drugs. Regression models are developed to estimate four key physical properties of the drugs, including properties such as molecular weight (MW), complexity (C), XLog P, and molar volume (MV). The property XlogP is a measure of the molecule’s lipophilicity (molecules with high XlogP are lipophilic and will reside in the cell membrane) and solubility (molecules with high XlogP tend to be insoluble). The physicochemical properties of drugs, such as complexity, molar volume, molecular weight, and lipophilicity (e.g., XLogP), play a pivotal role in determining their biological activity, pharmacokinetics, and overall therapeutic effectiveness in treating Lyme disease. These properties influence critical factors such as drug solubility, bioavailability, and tissue penetration, which are essential for targeting the bacterial pathogen Borrelia burgdorferi effectively.
Linear regression analysis is employed to develop the models, using the entropy indices as independent variables and the physical properties as dependent variables. The regression analysis is conducted using SPSS software, where the correlation coefficients and other regression parameters (such as R-squared, p-values, and standard errors) are computed to assess the strength of the relationships between the entropy measures and the physical properties. These statistical metrics are crucial for evaluating the predictive power and reliability of the regression models. The flow chart of the research is shown in Figure 1.
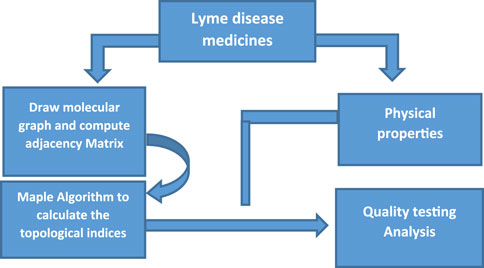
Figure 1. Flow diagram.
4 Computation of reverse degree entropy indices
In this study, we examine a set of thirteen drugs commonly used in the treatment of Lyme disease. These drugs include doxycycline, ceftriaxone, Doxy 100, cefotaxime, Ceftin, Cefuroxime, Erythromycin, EryPed, Erythrocin Lactobionate, Ofloxacin, Moxifloxacin, amoxicillin, and penicillin G potassium. The molecular structures of these drugs, illustrated in Figure 2, form the basis for the subsequent computational analysis. To compute the reverse degree entropy indices, we utilized the MAPPLE code, a specialized computational tool for deriving molecular entropy indices from the structural data. For each drug, the molecular structure was transformed into a graph where atoms are treated as vertices, and chemical bonds as edges. These graphs were then analyzed to determine the distribution of connectivity degrees, which serve as input for entropy calculations. The pseudocode of the MAPPLE code is presented in Algorithm 1. The computed values of these entropy indices are presented in Table 2.
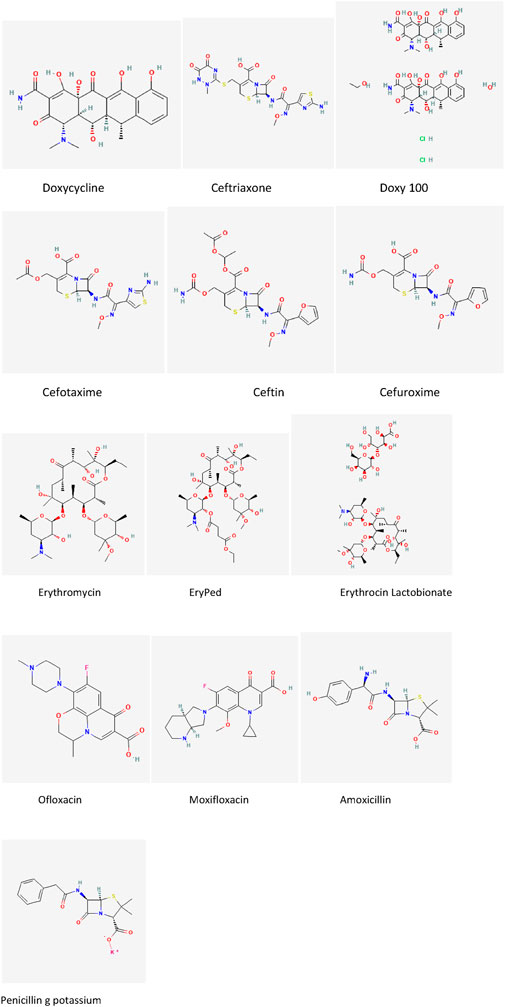
Figure 2. Molecular structure for Lyme disease drugs.
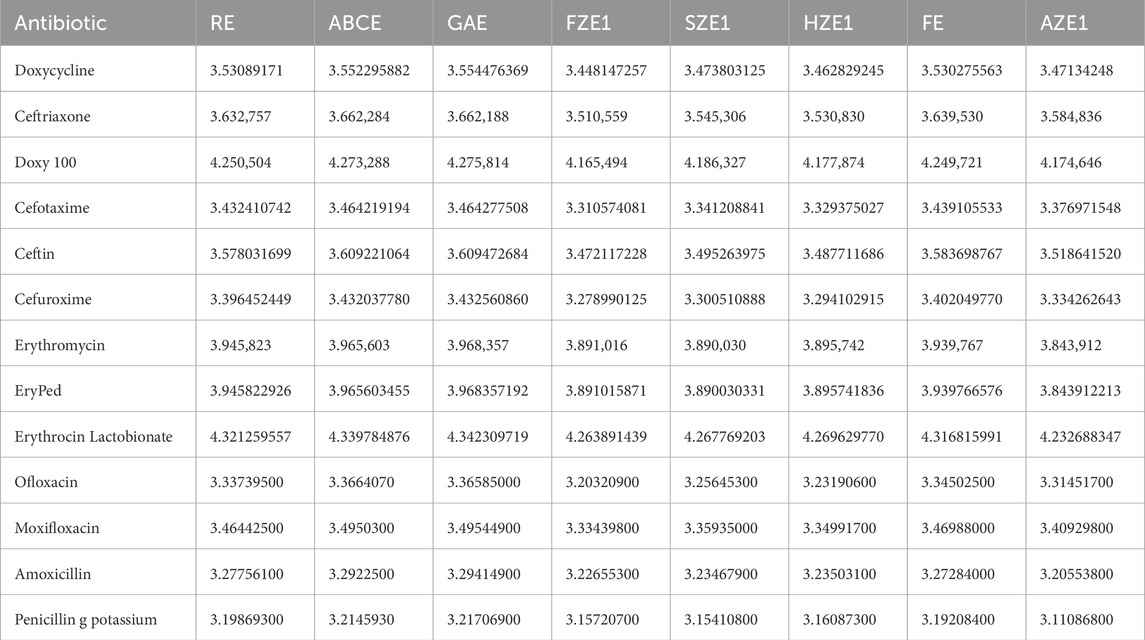
Table 2. Values of entropy indices of Lyme disease drugs.
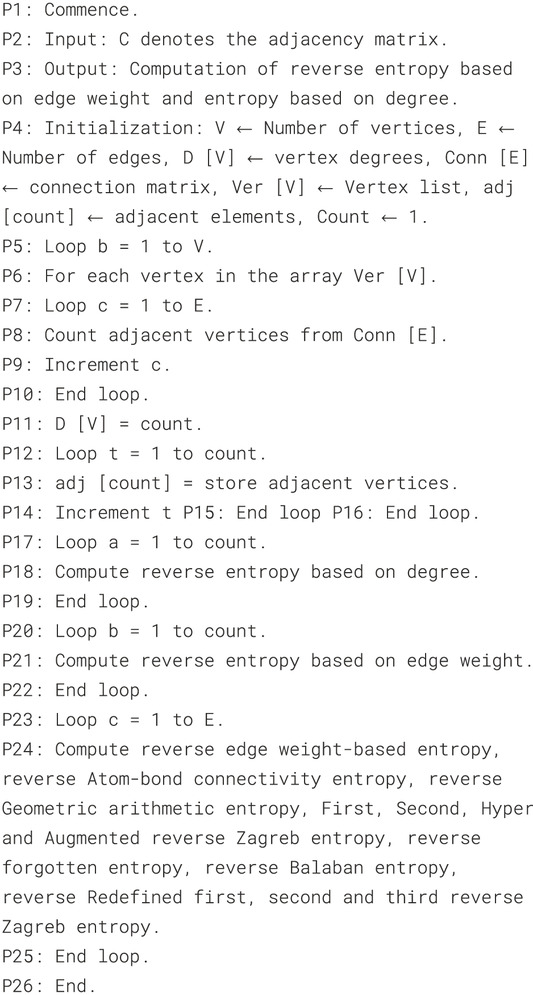
Algorithm 1. Pseudocode to compute reverse degree entropy indices.
5 Linear regression models
Linear regression is the simplest form of regression that assumes a direct proportional relationship between the independent and dependent variables. It is typically chosen as a baseline model due to its interpretability and minimal risk of overfitting. By starting with a linear model and gradually exploring higher-order models based on visual inspection and statistical criteria, this approach ensures that the selected model achieves a balance between accuracy and generalizability while minimizing the risk of overfitting. In this section, we develop linear regression models to estimate the physicochemical properties of thirteen drugs used for the treatment of Lyme disease. The degree-based entropy indices are utilized as independent variables, while the physicochemical properties of the drugs serve as dependent variables. The linear regression model under consideration is of the form:
where
A linear regression model is used to describe the relationship between a dependent variable
The performance of this regression model is assessed using metrics such as
We used SPSS software to develop the linear regression models. The physicochemical properties of the drugs were obtained from PubChem and are listed in Table 1. The entropy indices were computed using the MAPPLE-based code, and their values are shown in Table 2. Regression parameters were calculated for each case, and the results for the physicochemical properties—molecular weight, complexity, molar volume (MV), and XLogP are presented in Table 3 through 6, respectively. The regression model plots for each physicochemical property are generated against two entropy indices, illustrating their respective relationships. These plots are presented in Figures 3–6, providing a visual representation of the models and highlighting the trends and correlations observed in the data.
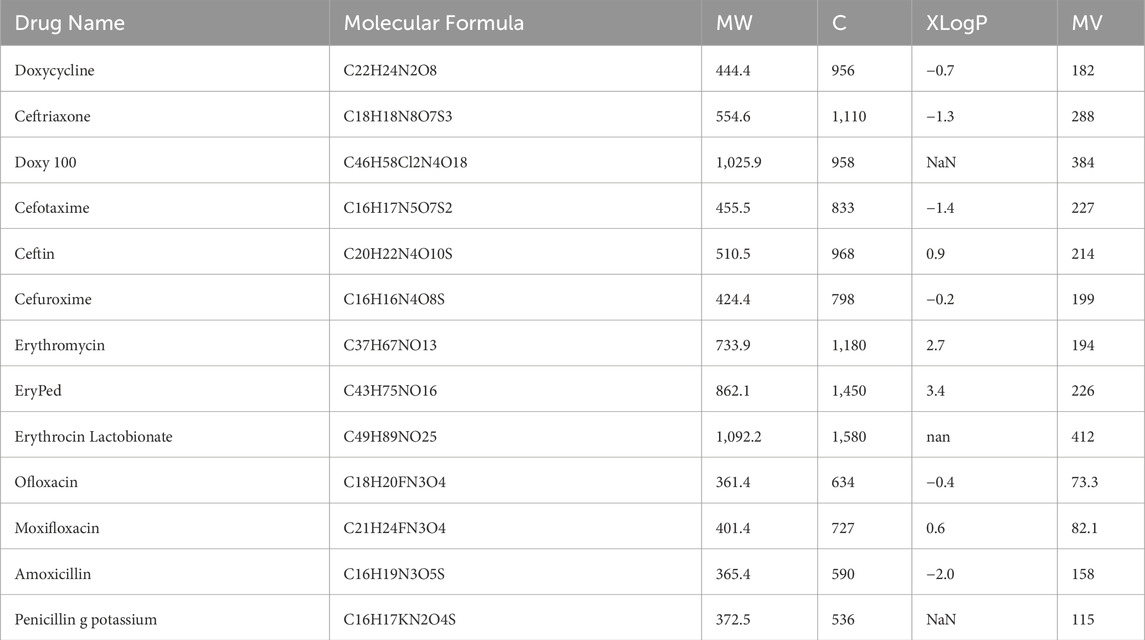
Table 1. Physicochemical characteristics of Lyme disease medication.
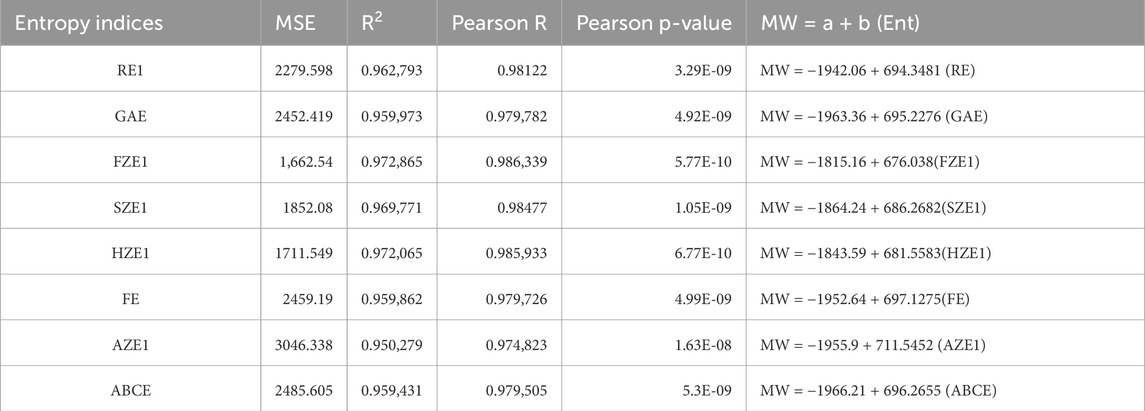
Table 3. Relation of entropy indices with molecular Weight (MW).
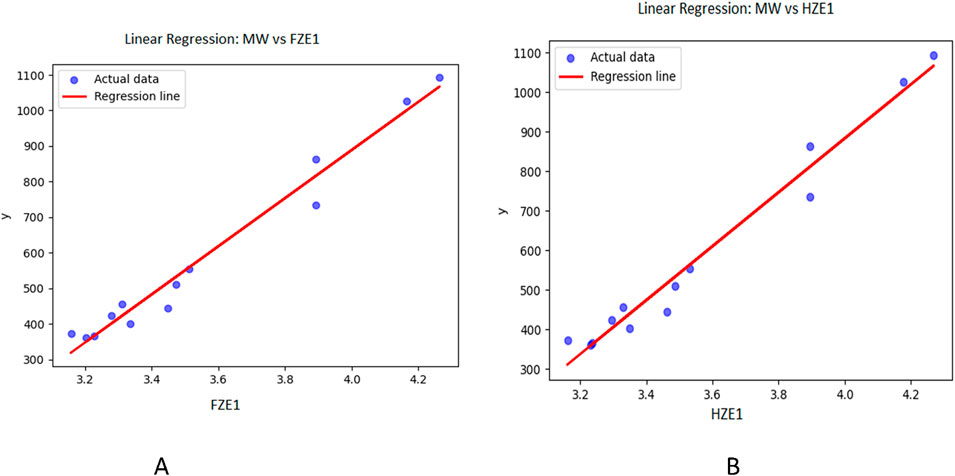
Figure 3. Graphical representation of linear regression model between entropy indices and molecular weight (A) Relation between molecular weight and FZE1 with regression model MW = −1815.16 + 676.038(FZE1) (B) Relation between molecular weight and HZE1 with regression model MW = −1843.59 + 681.5583(HZE1).
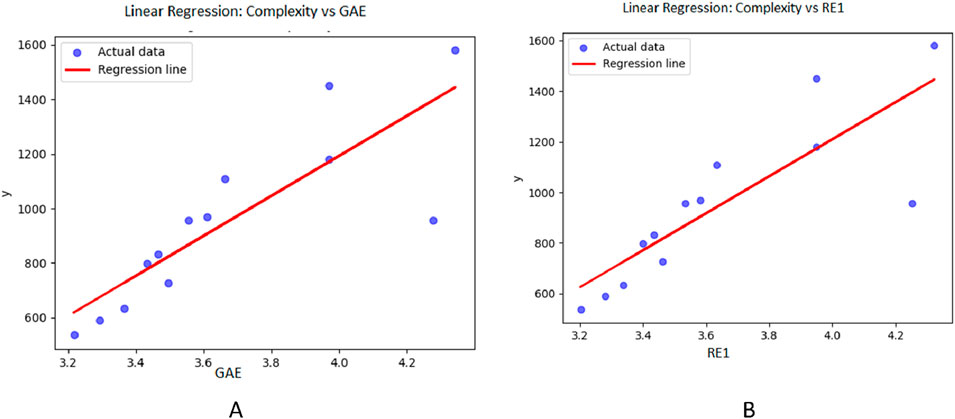
Figure 4. Graphical representation of regression model between entropy indices and Complexity (A) Relation between complexity and GAE with regression model C = −1742.52 + 733.9461 (GAE) (B) Relation between complexity and RE1 with regression model C = −1714.8 + 731.577 (RE).
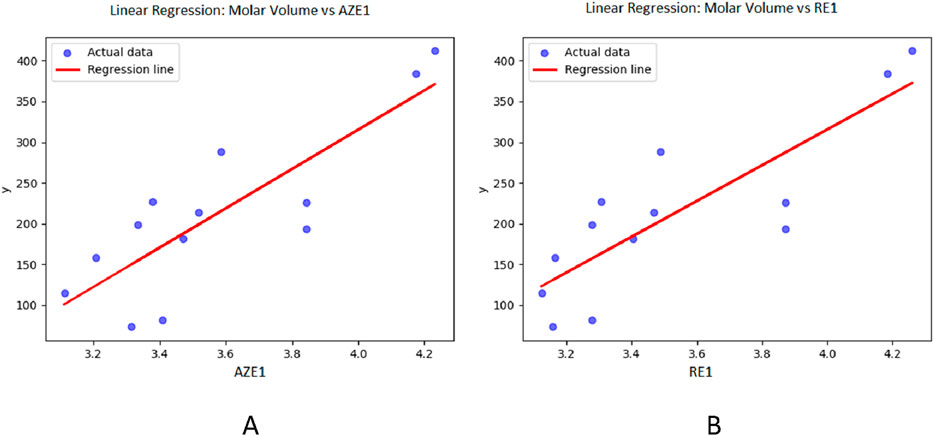
Figure 5. Graphical representation of linear regression model between entropy indices and Molar volume (A) Relation between Molar volume and AZE1 with regression model MV = −648.323 + 240.893 (AZE1) (B) Relation between Molar volume and RE1 with regression model MV = −634.346 + 232.5181 (RE).
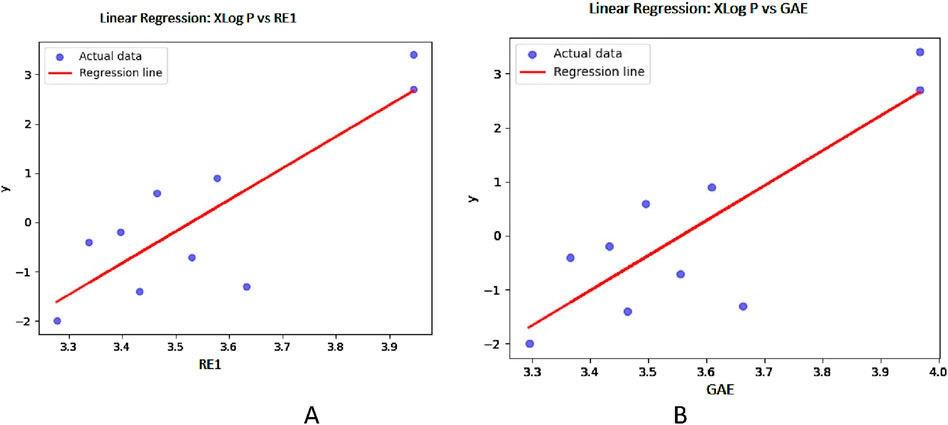
Figure 6. Graphical representation of linear regression model between entropy indices and XLog P (A) Relation between XLog P and RE1 with regression model XLog P = −22.6356 + 6.413,784 (RE) (B) Relation between XLog P and GAE with regression model XLog P = −22.9996 + 6.466,432 (GAE).
6 Results and discussion
The results of the linear regression analysis provide valuable insights into the relationship between the degree-based entropy indices and the physicochemical properties of the drugs used to treat Lyme disease. By examining the regression parameters, we can assess the strength and direction of these relationships, as well as the predictive capability of the entropy indices for key properties such as molecular weight, complexity, XLogP, and molar volume.
Table 3 through 6 present the linear regression models and their corresponding parameters for the selected physicochemical properties of the drugs. From Table 3, it is evident that molecular weight is best predicted by the reverse first Zagreb entropy index, yielding a high
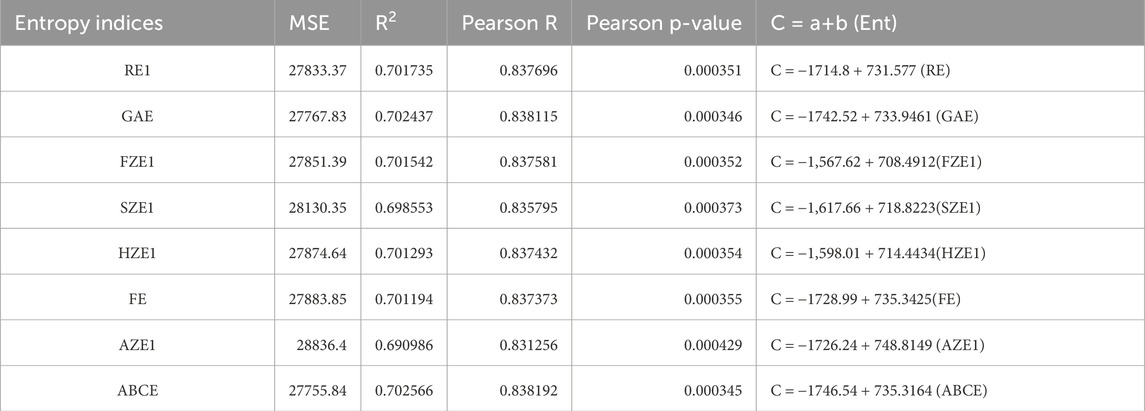
Table 4. Relation of entropy indices with complexity (C).
For molar volume, as depicted in Table 5, the reverse augmented Zagreb entropy index provides the best approximation, achieving an
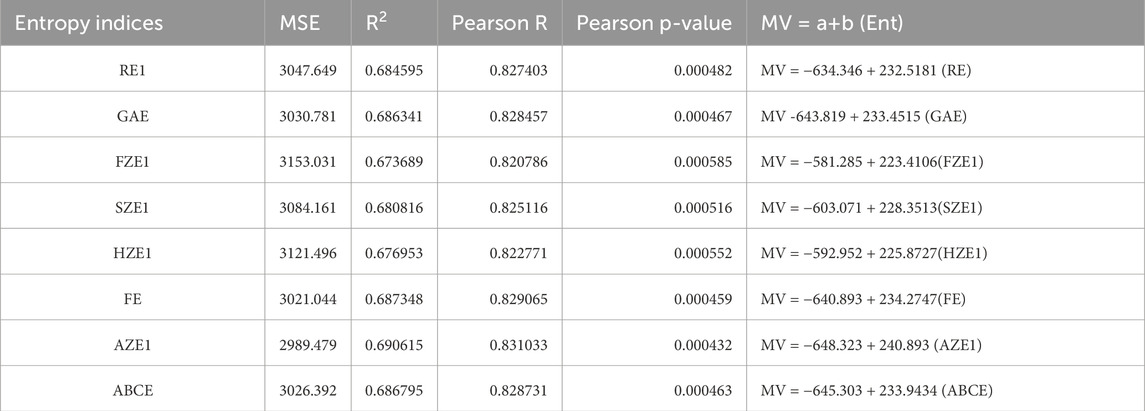
Table 5. Relation of entropy indices with molar volume (MV).
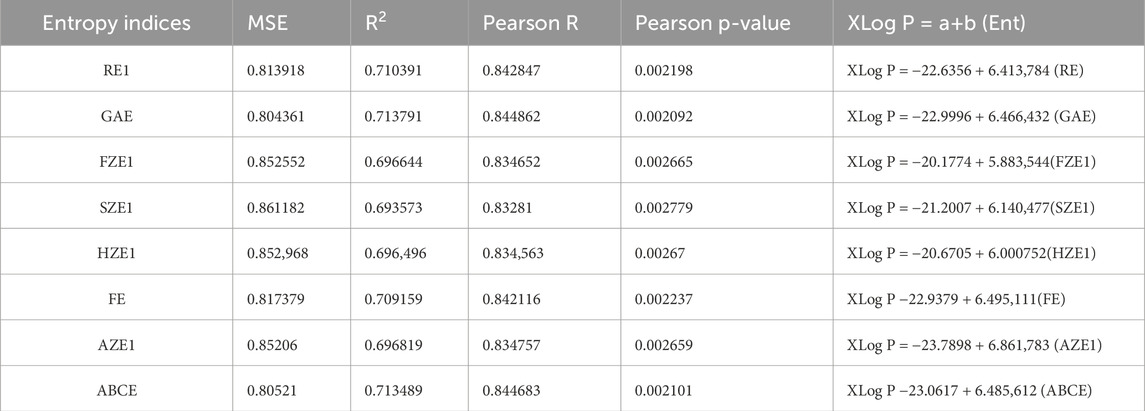
Table 6. Relation of entropy indices with XLog P.
Huang et al. [50] conducted a Quantitative Structure-Property Relationship (QSPR) analysis on eleven drugs used in the treatment of Lyme disease. In their study, the authors utilized classical degree-based topological indices to construct regression models for predicting physicochemical properties. However, a comparison of their results with the findings in this study reveals that the regression parameters derived using reverse degree entropy indices are more statistically significant. Specifically, the
7 Validation of regression models
In this section, we validate the accuracy of the regression models by comparing the experimental values of the drugs with the predicted values obtained from the models. For this validation, we selected two drugs: Penicillin G Sodium and Pfizerpen. The corresponding entropy indices are calculated and presented in Table 7. A comparison of the experimental and predicted values is provided in Table 8. It can be observed that the physicochemical properties, such as molecular weight and molar volume, of these two drugs are predicted with high accuracy by the regression models.
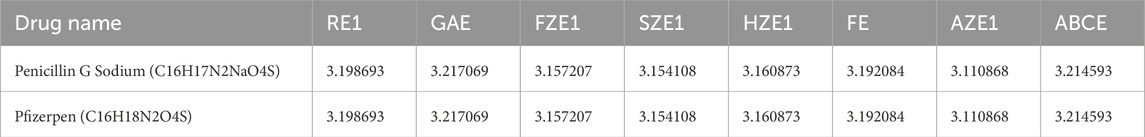
Table 7. Values of Entropy indices of Penicillin G Sodium and Pfizerpen.
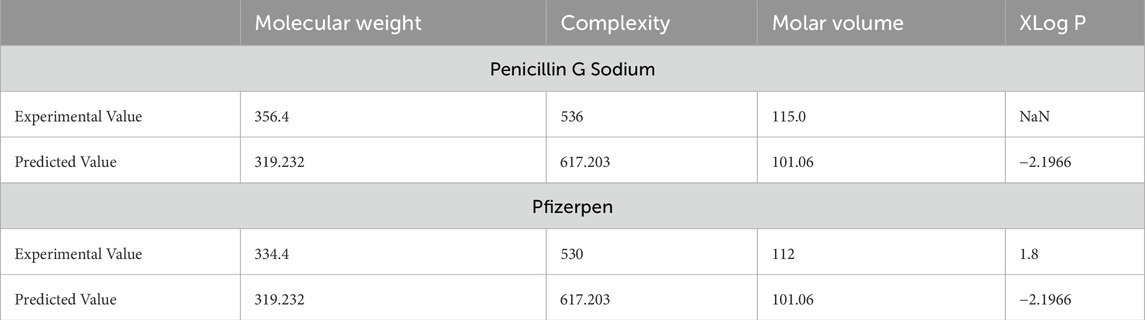
Table 8. Comparison between the expected values and the experimental values.
Potential sources of error in the predictions include inaccuracies in the computed entropy indices, which may arise from numerical approximations in the MAPPLE-based code or sensitivity to slight variations in molecular structure. Additionally, the regression models rely on assumptions of specific functional relationships (e.g., linear or quadratic), which may not fully capture the complexity of the underlying interactions. Experimental variability in physicochemical property data, arising from differences in measurement conditions or techniques, introduces noise that can affect model reliability. Furthermore, the relatively small dataset of thirteen drugs and limited structural diversity may hinder generalizability and increase the risk of overfitting. Addressing these challenges through incorporation of advanced models, and expansion of the dataset can enhance the robustness and accuracy of the predictions.
8 Limitations and future directions
Despite promising results, the study has certain limitations. First, the dataset includes only thirteen drugs specifically used for Lyme disease, which restricts the generalizability of the regression models. A larger and more diverse dataset is essential to validate the methodology across different therapeutic areas. Second, the analysis focuses on a limited set of physicochemical properties. Finally, the computational workflow involves using separate software tools like MAPPLE and SPSS, which may be cumbersome for users unfamiliar with these platforms, limiting accessibility.
To improve the generalizability of the models, future studies should include a broader dataset encompassing drugs used for other diseases. Furthermore, exploring a wider range of physicochemical properties, such as solubility, lipophilicity, and drug-likeness scores, alongside additional entropy indices and other molecular descriptors, could provide a more comprehensive understanding of drug behavior. By addressing these limitations and pursuing these directions, the methodology could evolve into a versatile framework for predictive drug design, accelerating the development of safer and more effective therapeutics across diverse medical conditions.
9 Conclusion
This study explored the use of degree-based entropy indices to model and predict the physicochemical properties of thirteen drugs commonly used in the treatment of Lyme disease. Linear regression models were developed using entropy indices as independent variables and physicochemical properties, such as molecular weight, complexity, molar volume, and XLogP, as dependent variables. The results demonstrate strong and statistically significant correlations between specific entropy indices and these properties, indicating their effectiveness as predictors.
Notably, the reverse first Zagreb entropy index emerged as the best predictor for molecular weight, while the reverse atom bond connectivity index and reverse augmented Zagreb entropy index showed strong associations with complexity and molar volume, respectively. Additionally, the first Zagreb entropy index was identified as the most suitable predictor for XLogP. These findings underscore the potential of entropy indices to provide meaningful insights into molecular characteristics and their relevance to drug design and evaluation. Future work could extend these models to other classes of drugs or incorporate additional entropy indices to further enhance predictive accuracy and applicability.
Data availability statement
The original contributions presented in the study are included in the article/supplementary material, further inquiries can be directed to the corresponding author.
Author contributions
GZ: Conceptualization, Investigation, Methodology, Validation, Writing–original draft. YL: Conceptualization, Investigation, Validation, Writing–review and editing. AR: Conceptualization, Methodology, Validation, Writing–review and editing. MA: Conceptualization, Investigation, Validation, Writing–original draft. PA: Conceptualization, Investigation, Validation, Writing–review and editing. AA: Conceptualization, Investigation, Methodology, Validation, Writing–original draft.
Funding
The author(s) declare that financial support was received for the research, authorship, and/or publication of this article. This work is partially supported by the Key Scientific and Technological Project of Henan Province, China (grant no. 242102521023), and China Henan International Joint Laboratory for Multidimensional Topology and Carcinogenic Characteristics Analysis of Atmospheric Particulate Matter PM2.5.
Conflict of interest
The authors declare that the research was conducted in the absence of any commercial or financial relationships that could be construed as a potential conflict of interest.
Generative AI statement
The author(s) declare that no Generative AI was used in the creation of this manuscript.
Publisher’s note
All claims expressed in this article are solely those of the authors and do not necessarily represent those of their affiliated organizations, or those of the publisher, the editors and the reviewers. Any product that may be evaluated in this article, or claim that may be made by its manufacturer, is not guaranteed or endorsed by the publisher.
References
1. Rizzoli A, Hauffe HC, Carpi G, Vourc’h GI, Neteler M, Rosa R. Lyme borreliosis in europe. Eurosurveillance (2011) 16(27):19906. doi:10.2807/ese.16.27.19906-en
2. Hassett AL, Radvanski DC, Buyske S, Savage SV, Gara M, Escobar JI, et al. Role of psychiatric comorbidity in chronic Lyme disease. Arthritis Care and Res (2008) 59(12):1742–9. doi:10.1002/art.24314
3. Auwaerter PG, Bakken JS, Dattwyler RJ, Dumler JS, Halperin JJ, McSweegan E, et al. Scientific evidence and best patient care practices should guide the ethics of Lyme disease activism: Table 1. J Med Ethics (2011) 37(2):68–73. doi:10.1136/jme.2009.032896
4. Feder Jr HM, Johnson BJ, O'Connell S, Shapiro ED, Steere AC, Wormser GP. A critical appraisal of “chronic Lyme disease”. New Engl J Med (2007) 357(14):1422–30. doi:10.1056/NEJMra072023
5. Reid MC, Schoen RT, Evans J, Rosenberg JC, Horwitz RI. The consequences of overdiagnosis and overtreatment of Lyme disease: an observational study. Ann Intern Med (1998) 128(5):354–62. doi:10.7326/0003-4819-128-5-199803010-00003
6. CDC (Centers for Disease Control and Prevention). Lyme disease data and statistics (2015). Available from: www.cdc.gov/lyme/stats/index.html (Accessed December, 2015).
7. Burgdorfer W, Barbour AG, Hayes SF, Benach JL, Grunwaldt E, Davis JP. Lyme disease—a tick-borne spirochetosis? Science (1982) 216(4552):1317–9. doi:10.1126/science.7043737
8. Depietropaolo DL, Powers JH, Gill JM, Foy AJ. Diagnosis of lyme disease. Am Fam Physician (2005) 72(2):297–304.
9. Thompson A, Mannix R, &Bachur R. Acute pediatric monoarticular arthritis: distinguishing Lyme arthritis from other etiologies. Pediatrics (2009) 123(3):959–65. doi:10.1542/peds.2008-1511
10. Silver HM. Lyme disease during pregnancy. Infect Dis Clin (1997) 11(1):93–7. doi:10.1016/s0891-5520(05)70343-3
11. Strobino BA, Williams CL, Abid S, Ghalson R, &Spierling P. Lyme disease and pregnancy outcome: a prospective s of two thousand prenatal patients. Am J Obstet Gynecol (1993) 169(2):367–74. doi:10.1016/0002-9378(93)90088-z
13. Estrada E, &Bonchev D. Section 13.1. chemical graph theory. In: Handbook of graph theory (2013). p. 1538–58.
14. Rauf A, Naeem M, Aslam A. Quantitative structure–property relationship of edge weighted and degree-based entropy of benzene derivatives. Int J Quan Chem (2022) 122(3):e26839. doi:10.1002/qua.26839
15. Vukičević D. Bond additive modeling 4. QSPR and QSAR studies of the variable Adriatic indices. CroaticaChemicaActa (2011) 84(1):87–91. doi:10.5562/cca1666
16. Wiener H. Structural determination of paraffin boiling points. J Am Chem Soc (1947) 69(1):17–20. doi:10.1021/ja01193a005
17. Stiel LI, &Thodos G. The normal boiling points and critical constants of saturated aliphatic hydrocarbons. AIChE J (1962) 8(4):527–9. doi:10.1002/aic.690080421
18. Rouvray DH, &Crafford B. The dependence of physico-chemical properties on topological factors. South Afr J Sci (1976) 72(2):47.
19. Gutmana I, &Körtvélyesi T. Wiener indices and molecular surfaces. ZeitschriftfürNaturforschung A (1995) 50(7):669–71. doi:10.1515/zna-1995-0707
20. Balaban AT. Applications of graph theory in chemistry. J Chem Inf Comput Sci (1985) 25(3):334–43. doi:10.1021/ci00047a033
21. Randić M. Hosoya matrix-a source of new molecular descriptors. CroaticaChemicaActa (1994) 67(4):415–29.
22. Trinajstić N. The characteristic polynomial of a chemical graph. J Math Chem (1988) 2(3):197–215. doi:10.1007/bf01167201
23. Devillers J, Balaban AT. Topological Indices and Related Descriptors in QSAR and QSPR (1st ed.) (1999). CRC Press. doi:10.1201/9781482296945
24. Randić M. Quantitative structure-property relationship. Boiling points of planar benzenoids. New J Chem (1996) 20(10):1001–9.
25. Randić M. Comparative structure-property studies: regressions using a single descriptor. Croat Chem Acta (1993) 66:289–312.
26. Randić M, &ompe M. On characterization of the CC double bond in alkenes. SAR QSAR Environ Res (1999) 10(5):451–71. doi:10.1080/10629369908039111
27. Matejić M, Zogić E, Milovanović E, &ilovanović I. A note on the Laplacian resolvent energy of graphs. Asian-European J Mathematics (2020) 13(06):2050119. doi:10.1142/s1793557120501193
28. Ghorbani M, Klavžar S. Modified Wiener index via canonical metric representation, and some fullerene patches. Ars Mathematica Contemporanea (2015) 11(2):247–54. doi:10.26493/1855-3974.918.0b2
29. Gutman I, Trinajstić N, Wilcox CF. Graph theory and molecular orbitals. XII. Acyclic polyenes. J Chem Phys (1975) 62(9):3399–405. doi:10.1063/1.430994
30. Furtula B, Graovac A, &Vukičević D. Augmented zagreb index. J Math Chem (2010) 48:370–80. doi:10.1007/s10910-010-9677-3
31. Gutman I, &Trinajstić N. Graph theory and molecular orbitals. Total φ-electron energy of alternant hydrocarbons. Chem Phys Lett (1972) 17(4):535–8. doi:10.1016/0009-2614(72)85099-1
32. Randić M. Characterization of molecular branching. J Am Chem Soc (1975) 97(23):6609–15. doi:10.1021/ja00856a001
33. Estrada E. Characterization of 3D molecular structure. Chem Phys Lett (2000) 319(5-6):713–8. doi:10.1016/s0009-2614(00)00158-5
34. Hosoya H. Topological index. A newly proposed quantity characterizing the topological nature of structural isomers of saturated hydrocarbons. Bull Chem Soc Jpn (1971) 44(9):2332–9. doi:10.1246/bcsj.44.2332
35. Nikolić S, Kovačević G, Miličević A, &Trinajstić N. The Zagreb indices 30 years after. Croatica chemica acta (2003) 76(2):113–24.
36. Vukicevic D, &Gasperov M. Bond additive modeling 1. Adriatic indices. Croatica chemica acta (2010) 83(3):243.
37. Fajtlowicz S. On conjectures of Graffiti. Ann Discrete Mathematics (1988) 38:113–8. doi:10.1016/0012-365x(88)90199-9
38. Estrada E, Torres L, Rodriguez L, Gutman I (1998). An atom-bond connectivity index: modelling the enthalpy of formation of alkanes.
39. Furtula B, Gutman I. A forgotten topological index. J Math Chem (2015) 53(4):1184–90. doi:10.1007/s10910-015-0480-z
40. Shirdel GH, Rezapour H, Sayadi AM The hyper-Zagreb index of graph operations. Iranian J Math Chem (2013) 4(2):213–222. doi:10.22052/ijmc.2013.5294
41. Ranjini PS, Lokesha V, Usha A. Relation between phenylene and hexagonal squeeze using harmonic index. Int J Graph Theor (2013) 1(4):116–21.
42. Havare ÖÇ. Topological indices and QSPR modeling of some novel drugs used in the cancer treatment. Int J Quan Chem (2021) 121(24):e26813. doi:10.1002/qua.26813
44. Sabirov DS, &Shepelevich IS. Information entropy in chemistry: an overview. Entropy (2021) 23(10):1240. doi:10.3390/e23101240
45. Dehmer M. Information processing in complex networks: graph entropy and information functionals. Appl Mathematics Comput (2008) 201(1-2):82–94. doi:10.1016/j.amc.2007.12.010
46. Shannon CE. Communication in the presence of noise. Proc IRE (1949) 37(1):10–21. doi:10.1109/jrproc.1949.232969
47. Rashevsky N. Life, information theory, and topology. Bull Math Biophys (1955) 17:229–35. doi:10.1007/bf02477860
48. Ulanowicz RE. Quantitative methods for ecological network analysis. Comput Biol Chem (2004) 28(5-6):321–39. doi:10.1016/j.compbiolchem.2004.09.001
49. Mowshowitz A, &Dehmer M. Entropy and the complexity of graphs revisited. Entropy (2012) 14(3):559–70. doi:10.3390/e14030559
Keywords: quantitative structure-property relationship, reverse degree degree-based entropy, lyme disease drugs, statistical model, human health
Citation: Zhang G, Li Y, Rauf A, Afzal MA, Ali P and Aslam A (2025) Estimating the prediction ability of reverse degree-based entropy indices for the physicochemical properties of lymes disease drugs. Front. Phys. 13:1536995. doi: 10.3389/fphy.2025.1536995
Received: 29 November 2024; Accepted: 27 January 2025;
Published: 28 February 2025.
Edited by:
Xingxing Jiang, Chinese Academy of Sciences (CAS), ChinaCopyright © 2025 Zhang, Li, Rauf, Afzal, Ali and Aslam. This is an open-access article distributed under the terms of the Creative Commons Attribution License (CC BY). The use, distribution or reproduction in other forums is permitted, provided the original author(s) and the copyright owner(s) are credited and that the original publication in this journal is cited, in accordance with accepted academic practice. No use, distribution or reproduction is permitted which does not comply with these terms.
*Correspondence: Yali Li, bGl5YWxpQHBkc3UuZWR1LmNu; Adnan Aslam, YWRuYW5hc2xhbTE1QHlhaG9vLmNvbQ==