- Princeton Plasma Physics Laboratory, Princeton, NJ, United States
Gyrokinetic simulations of plasma microturbulence in tokamaks are challenging to visualize because the compute grid follows the magnetic field lines that spiral around the torus. We have overcome this challenge by developing three new approaches that improve visualization of gyrokinetics. Our techniques work directly with the topology of magnetic flux surfaces where the simulation stores variables in concentric rings on poloidal planes (vertical cross sections of the torus). Our visualization preview step triangulates each consecutive pair of rings to display the data on a poloidal plane. The second visualization technique follows spiral field lines around the torus and constructs polygons to visualize a flux surface. Third, the poloidal triangles are connected between planes to form prisms that compose a 3-D model of the entire torus. The visualization workflow produces detailed geometry that matches the high resolution, irregular compute grid for every time step. The surface and solid models are displayed in scientific visualization programs to effectively explore and communicate the results, including fluctuation of electron density, ion temperature, and electrostatic potential. Highly detailed renderings verify plasma behavior along magnetic field lines over time.
1 Introduction
The 3-D visualization of magnetic confinement fusion data from tokamak experiments and simulations has always been a challenge due to the complex toroidal geometry and irregular computational grids. This is particularly true for gyrokinetic codes, such as the Gyrokinetic Tokamak Simulation code (GTS), which solve the gyrophase-averaged Valsov-Maxwell set of equations in 5-D phase space to study plasma microturbulence in tokamak devices [1]. While the visualization methods described here can be adapted to most gyrokinetic and 3-D MHD codes, our tools were originally developed for GTS data. GTS uses the particle-in-cell (PIC) algorithm to solve the Vlasov-Maxwell equations by advancing particles along the characteristics and solving for the self-consistent electromagnetic field on a 3D toroidal grid, under the confining forces of an imposed equilibrium magnetic field (generated by external coils in the actual experiment). As a way to greatly increase the accuracy and computational efficiency of the numerical scheme, all the calculations in GTS are carried out in straight-field-lines magnetic coordinates [2]. In these coordinates, elongated “D-shaped” cross sections of the equilibrium magnetic flux surfaces become concentric circles, and the complex, twisted magnetic field lines become straight lines. Since the lowest order guiding center motion of charged particles in a magnetic field is to follow the field lines, the straight-field-line coordinates allow for a much larger time step for the same numerical accuracy. Furthermore, GTS implements a field-aligned toroidal grid, which reduces the required grid resolution by two orders of magnitude in the toroidal direction. Typical GTS simulations only require 32 toroidal grid points (poloidal planes) while maintaining the full resolution of toroidal modes of much higher “n” numbers (higher wavenumbers). This is made possible through the coupling of the toroidal and poloidal directions in the straight-field-line coordinates [3]. The number of toroidal modes that the grid can resolve is linked to the poloidal plane grid resolution, which is very high in GTS. The distance between two grid points on the poloidal planes is given by the local ion Larmor radius (also called “gyroradius”), so it can be very small compared to the system size, which is the whole tokamak being studied. The larger the tokamak, the more grid points are required. A typical simulation of the DIII-D or CMOD tokamaks requires about 10 million grid points (∼300,000 poloidal grid points) and 1.6 billion particles. A very large scale run on a big cluster can easily require 20 billion particles on a mesh with 400 million grid points throughout the torus.
Being a fully kinetic code that evolves particles in 5D phase space, GTS has a significant run-time and generates large datasets. Moments of the particle distribution function (ions and electrons) are calculated and accumulated at each grid point. A comprehensive suite of visualization tools is needed to examine, explore, and communicate the results. We have developed techniques for rapidly displaying variables throughout the compute grid at all time steps.
Another large simulation program, the Gyrokinetic Toroidal Code (GTC), produces electron and ion data on a similar toroidal grid [4]. We have integrated GTC output with our workflow to create visualizations from this very large scale particle-in-cell code.
2 Prior work
Volume rendering, particle rendering, and connecting particles into trajectory paths have previously been applied to visualizing gyrokinetic simulation data. A hardware-accelerated technique for interactive volume visualization of fieldline following data from GTC is described in [5]. Significant results were achieved by drawing a set of view-aligned polygon slices that sample a 3-D texture containing the volume data. Another volume rendering approach worked with data on a Cartesian coordinate system to show heat flux in a gyrokinetic simulation [6].
The magnetic coordinates of particle-in-cell gyrokinetic codes can be challenging to display. However, most of the codes provide the Cartesian coordinates of the particles. Therefore particle rendering can be an effective way to look at some of the simulation data [7]. The discrete nature of the particles can make it difficult to follow changes over time. Improved results were achieved by connecting particles into paths, including trapped electrons. Particle trajectories provide more visual coherence as described in [8] and advanced filters were developed for selecting trajectories to display.
Our approach constructs displayable geometry directly from the field lines and flux surfaces of the simulated plasma. Scalar values are assigned to the vertices which correspond to the compute grid. Current graphics GPUs can display very large amounts of polygonal data which provide much more details than prior visualization efforts that had to sub-sample the simulation data. By formatting the geometry for general purpose scientific visualization systems, such as Visit and Paraview, we can utilize their filtering, selection, and viewing functions to explore and present all of the data from the simulation. Our workflow contains three techniques of increasing complexity to examine the data and automate animation:
A. Rapid preview of a variable at compute grid resolution for all time steps of one poloidal plane.
B. Constructing highly detailed toroidal flux surfaces to display all time steps for a variable.
C. Generating a comprehensive 3-D model that follows the toroidal grid of the entire torus to display all time steps for a variable.
3 Interactive visualization of poloidal plane data
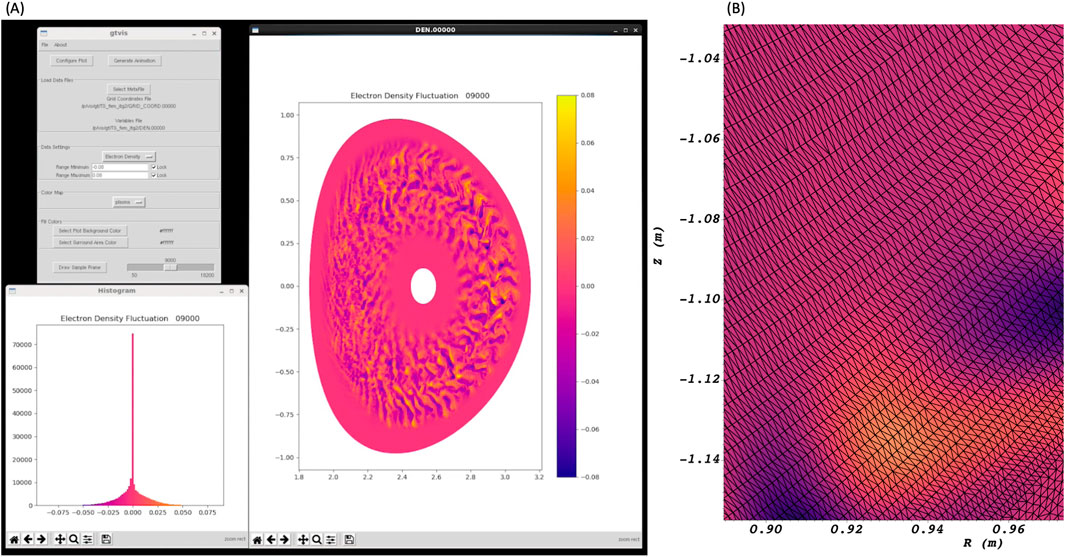
Our interactive program runs on a workstation or visualization node, reads the vertex and variable files, and displays the data for a poloidal plane as shown in Figure 1. Each time step is rendered automatically to produce a movie. The GTS run can be over 1 TB in file size while the movie is only 20 MB. This significantly reduces the amount of data transfer from a remote cluster in order to visually verify the simulation run quickly. The intrinsic rotation and turbulence-generated zonal flows produce clockwise and counterclockwise flows that are visualized within the plasma as f(x,y,t). The visualization settings are saved in a configuration file so subsequent movies can be rendered in batch using the command line option of the workflow. This automates production for a campaign of simulation runs.

Figure 1. (A) The GUI renders one variable per time step. A color-coded histogram guides the range selection from a simulation of electron density fluctuation based on a DIII-D shot. (B) Close-up view of triangulated mesh geometry from an NSTX-U simulation underlying the color-coded electron density fluctuation.
GTS creates an unstructured grid of a torus within the tokamak. The cross section of the torus is shaped to the geometry of the machine; it is not limited to circular cross sections. Figure 1B shows the concentric rings of the grid that are based on flux surfaces within the magnetic field. GTS creates grid points along each ring and stores the XYZ coordinates in the vertex file along with the number of vertices per ring. The number of points per ring increases with distance from the center resulting in an unstructured grid. Visualizing variables on the grid has been a challenge. Applying a triangulation algorithm to all the points in a plane can result in poorly conditioned triangles. Long, thin triangles can detract from the quality of the rendering. Consider each pair of consecutive rings to form a “band.” We have improved the triangulation by applying the Delaunay algorithm to each concentric band. This approach produces uniformly sized triangles within a band. The physics variable file contains the data computed at each grid point, typically electron and ion density fluctuation, temperature fluctuation, and electrostatic potential fluctuation. Interpolated shading between the three vertices of each triangle yields smooth shading even for extreme zoom-in factors.
Triangulating each band not only solves poloidal plane rendering but also forms the basis for well-conditioned 3-D solid models described in Section 5.
The time slider in the user interface enables the researcher to look at any time step in the simulation. There are fields for setting the global minimum and maximum of the color bar scale for all time steps. This provides a stable range for each frame throughout the movie. The bars in the histogram are color-coded to match the color map of the poloidal plane. The zoomed-in view in Figure 1B shows the interpolated shading of electron density fluctuation on the triangle grid using the same color scale as Figure 1A. The graphical user interface is implemented with the Python Tkinter package for menus, buttons, and other widgets. Tkinter is included with all distributions of Python so the GUI has been easily ported to visualization nodes on different clusters. It is a lightweight interface so it can run in a remote desktop. This enables previewing results computed on a remote cluster.
Physicists have benefitted from this interactive program to quickly review the data from a simulation run. The code will automatically generate an image of a plane for each time step and combine the images into a movie. This enables an initial verification before starting surface and solid model visualizations. The human visual system is quite skilled at noticing anomalies or irregularities in the structure of the visualization over time. Any aberration can lead the physicist directly to a time and location to investigate more closely and has enabled the detection of problems in the simulation code or input parameters.
4 Surface modeling
The next part of the workflow creates flux surface models from the entire plasma for any set of time steps. The GTS output typically contains 32 poloidal planes in Cartesian coordinates, generated by a coordinate transformation from magnetic coordinates. The unstructured geometric grid corresponds to the magnetic fieldlines of the externally imposed equilibrium field. The particles follow the magnetic field lines in a spiral path around the torus, due to the poloidal component of the magnetic field generated by the plasma current. Each poloidal plane in the grid has the same ring structure. However, the location of the vertices along a ring changes from one plane to another. Each plane has the same concentric rings (in magnetic coordinates), but the vertex locations change from one plane to another due to the magnetic spiral. GTS provides the vertex index offset so the field lines can be followed from one plane to the next. The inner ring is masked off because that region is not in the compute grid. The geometry of the grid does not change over time so it can be calculated once. Each time step is independent so models are calculated in parallel to increase performance. New variables are interpolated for each time step and rendered to image files.
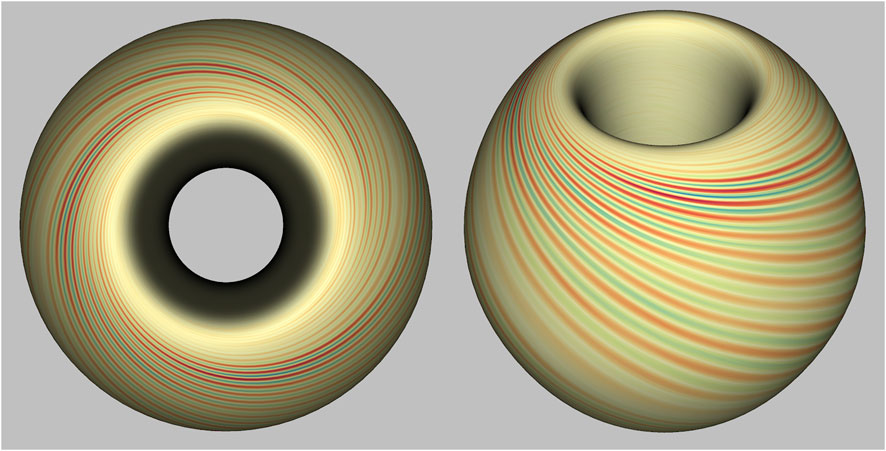
Modeling and rendering a surface based on 32 planes shows facets when displayed with more than 1200 pixels horizontally. To overcome this artifact, our 3-D modeling algorithm applies cubic splines that follow the magnetic field lines and interpolate between planes to create smooth geometric surfaces composed of small, shaded quadrilaterals as shown in Figure 2. Interpolating to 64 or 96 planes provides enough detail for high resolution displays, including views that zoom in to the surface. Interpolation improves the appearance of the curved surface but it does not increase the resolution of the physics data. Red indicates positive fluctuation and blue is negative fluctuation of electrostatic potential from equilibrium (yellow).

Figure 2. Highly detailed models of a variable on a 3D flux surface produce top and side views from a simulation of electrostatic potential fluctuation based on a shot from NSTX-U. The geometric model contains 1.1 million smooth-shaded quadrilaterals from a large GTS run.
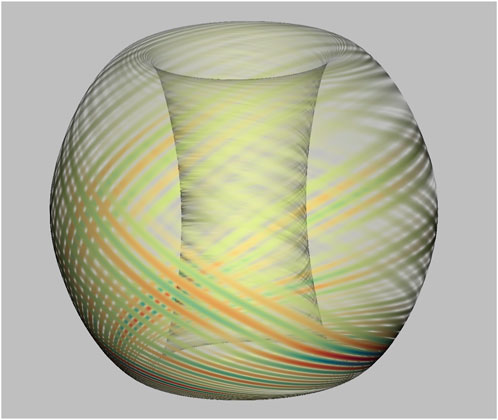
The workflow creates binary VTK format data files that can be displayed in Paraview, VisIt, and Omniverse, freely available applications for scientific visualization, as shown in Figure 3. Working with the compact visualization files eliminates copying the entire GTS output from a remote cluster to a local workstation. As the resolution of the physics increases it is important to consider the size of the visualization files.

Figure 3. Selective transparency in the color map eliminates areas of low fluctuation to show significant plasma behavior throughout the surface geometry of the torus.
The workflow automates the creation of each surface at one time step or one or more surfaces at several time steps. Rendering and creating animation enables checking the consistency among surfaces and over time around the torus. We have utilized the ffmpeg software to accurately combine images into movies. The program applies effective compression to the movie without perceptible loss of detail. MPEG-4 file format, with the H.264 codec and YUV420p color space plus chroma sampling, produces movie files that are portable across current operating systems, movie players, and browsers.
5 Solid models
We model the entire f(x,y,z) compute region with an unstructured grid of triangular prisms. The 3-D solid model is based on the spiral magnetic fieldline grid. The elements of the model consist of triangular prisms between two poloidal planes. Each triangle of the poloidal plane described in Section 3 is one end cap of a prism. Delaunay triangularization between each consecutive pair of flux rings incorporates every grid point and avoids long, thin triangles that would be problematic to render. The other end cap is the corresponding triangle in the next plane. The vertices of this triangle are found by following the fieldlines from one poloidal plane to the next, applying the ring offset provided by GTS. The three sides of the prism connect the two end caps. The sides are defined with quadrilaterals aligned to the toroidal direction. Interpolating additional planes makes the prisms shorter and contributes to a smooth shaded appearance on high resolution displays.
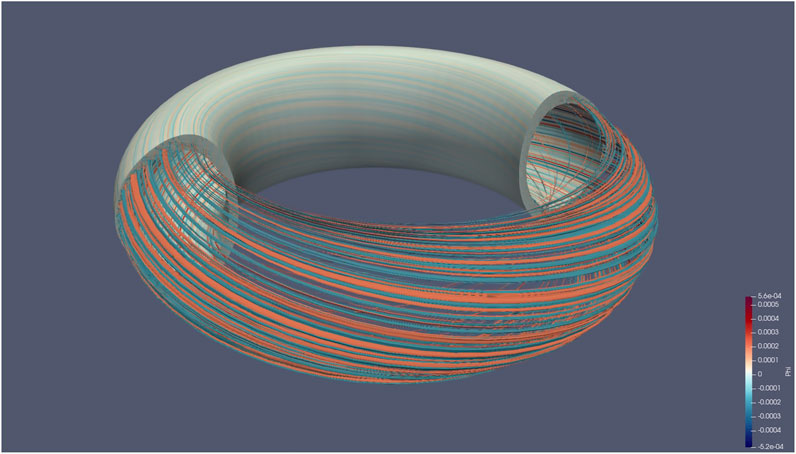
The 3-D model is written to a VTK file so it can be examined in VisIt and Paraview. Applying geometric and numerical filters in VisIt or Paraview enables looking at arbitrary cutting planes or identifying flux tubes and isovolumes within the plasma. Applying isovolume filters to the fluctuation of the electrostatic potential variable assigned to the 3-D model yields the flux tubes shown in Figure 4. The VTK based display programs smooth shade between the color-coded vertices of the prisms representing variables. The workflow automates file generation for all time steps so sequential rendering can produce an animation of the entire torus.

Figure 4. Rendering the upper and lower quartiles of electrostatic potential fluctuation from a GTS run based on a shot from Alcator C-Mod.
Time steps are independent datasets so the VTK files can be computed in parallel. Our modules for creating surfaces and solid models have been adapted to use Python Multiprocessing. This spawns processes on all cores of the visualization compute node to accelerate visualization pre-processing.
6 Applications
The Tokamak Digital Twin [9] is designed to provide a high performance simulation coupled with an operating tokamak. The twin incorporates CAD geometry, data acquired from the experiment, and gyrokinetic simulation data. The Omniverse software environment is used to display the combination of data, including realistic rendering of the CAD model. A full-scale gyrokinetic run is orders of magnitude too slow for a digital twin so an AI surrogate program has been developed. Several thousand GTC runs have served as training material for the surrogate, SGTC. We have created surface and solid models to illustrate the digital twin. The Paraview connector in Omniverse reads VTK files and renders them in context with the CAD model and magnetic field. Optimization can be achieved when the flux surfaces do not change during the shot of plasma. Their geometry is calculated and loaded once. Only the scalar value at each vertex has to be computed and sent to Omniverse to display the next time step.
Combining our visualization geometry with CAD models is also useful for engineering applications. Designers and physicists are interested in seeing the location of the last closed flux surface relative to the plasma facing components of the vacuum vessel. Seeing the effect of the magnetic field is important in the design of new tokamaks. There is increasing demand for Virtual Reality and Augmented Reality in the design process. Having our visualization models in well-known file formats has facilitated direct import to the Unreal Engine software which drives the headsets.
7 Conclusion
We have developed three techniques that improve the visualization of gyrokinetic simulations. By generating geometric models that follow the toroidal geometry of the plasma we can generate highly detailed representations of computed variables. Displaying data on magnetic flux surfaces and deriving flux tubes is important for understanding plasma behavior in a tokamak. Storing the models in well-known file formats enables interoperability with scientific visualization programs and Virtual Reality systems. Our poloidal plane rendering capability provides a rapid preview of the simulation data. It can create an animated sequence on a remote cluster where the data was computed. The visualizations are effective for exploring and communicating microturbulence over time in magnetically confined plasmas.
Data availability statement
The raw data supporting the conclusions of this article will be made available by the authors, without undue reservation.
Author contributions
EF: Conceptualization, Data curation, Investigation, Methodology, Software, Supervision, Validation, Visualization, Writing–original draft, Writing–review and editing. SE: Data curation, Funding acquisition, Investigation, Project administration, Resources, Supervision, Writing–review and editing. JY: Investigation, Methodology, Software, Validation, Visualization, Writing–review and editing. AY: Investigation, Methodology, Software, Validation, Visualization, Writing–review and editing.
Funding
The author(s) declare that financial support was received for the research, authorship, and/or publication of this article. This work was supported by the U.S. Department of Energy Contract DE-AC02-09CH11466.
Conflict of interest
The authors declare that the research was conducted in the absence of any commercial or financial relationships that could be construed as a potential conflict of interest.
Generative AI statement
The author(s) declare that no Generative AI was used in the creation of this manuscript.
Publisher’s note
All claims expressed in this article are solely those of the authors and do not necessarily represent those of their affiliated organizations, or those of the publisher, the editors and the reviewers. Any product that may be evaluated in this article, or claim that may be made by its manufacturer, is not guaranteed or endorsed by the publisher.
Supplementary material
The Supplementary Material for this article can be found online at: https://www.frontiersin.org/articles/10.3389/fphy.2025.1535042/full#supplementary-material
SUPPLEMENTARY VIDEO S1 | An overview of a gyrokinetic simulation for the NSTX-U experiment, including high speed camera imaging of an actual plasma shot is shown first. Then a high resolution surface model of electrostatic potential fluctuations is visualized. This shows how the fluctuation follows magnetic fieldlines.
SUPPLEMENTARY VIDEO S2 | The solid model visualization technique is applied first to a simulation of the Alcator C-Mod tokamak. Poloidal and toroidal cutting planes are applied to show the geodesic acoustic mode plus clockwise and counter-clockwise flow of electrostatic potential fluctuations in this data set. Then flux surfaces for one time step are shown. Finally, the evolution of flux tubes is visualized from the solid model.
References
1. Wang WX, Lin Z, Tang WM, Lee WW, Ethier S, Lewandowski JLV, et al. Gyro-kinetic simulation of global turbulent transport properties in tokamak experiments. Phys Plasmas (2006) 13(9):092505. doi:10.1063/1.2338775
2. Grimm RC, Greene JM, Johnson JL. Computation of the magnetohydrodynamic spectrum in axisymmetric toroidal confinement systems. Methods Comput Phys (1976) 16:253–80. doi:10.1016/B978-0-12-460816-0.50012-9
3. Scott B. Global consistency for thin flux tube treatments of toroidal geometry. Phys Plasmas (1998) 5(6):2334–9. doi:10.1063/1.872907
4. Lin Z, Hahm TS, Lee WW, Tang WM, White RB. Turbulent transport reduction by zonal flows: massively parallel simulations. Science (1998) 281:1835–7. doi:10.1126/science.281.5384.1835
5. Crawford D, Ma K-L, Huang M-Y, Klasky S, Ethier S. Visualizing gyrokinetic simulations. IEEE Visualization (2004) 59–66. doi:10.1109/visual.2004.122
6. Stantchev G, Juba D, Dorland W, Varshney A. Confluent volumentric visualization of gyrokinetic turbulence. IEEE Trans Plasma Sci (2008) 36(4):1112–3. doi:10.1109/TPS.2008.924509
7. Jones C, Ma K-L, Ethier S, Lee W-L. An integrated exploration approach to visualizing multivariate particle data. Comput Sci and Eng (2008) 10(4):20–9. doi:10.1109/mcse.2008.88
8. Sauer F, Zhang Y, Wang W, Ethier S, Ma K-L. Visualization techniques for studying large-scale flow fields from fusion simulations. Comput Sci and Eng (2016) 18(2):68–77. doi:10.1109/mcse.2015.107
9. Tang W. AI-machine learning-enabled tokamak digital twin. arXiv (2024). Available from: https://arxiv.org/abs/2409.03112 (Accessed on September 4, 2024).
Keywords: scientific visualization, gyrokinetic tokamak simulation, plasma physics, geometric models, python workflow
Citation: Feibush E, Ethier S, Yan J and Yao A (2025) Visualization techniques for the gyrokinetic tokamak simulation code. Front. Phys. 13:1535042. doi: 10.3389/fphy.2025.1535042
Received: 26 November 2024; Accepted: 11 February 2025;
Published: 26 February 2025.
Edited by:
Didier Mazon, CEA Cadarache, FranceReviewed by:
Yasuhiro Suzuki, Hiroshima University, JapanBingjia Xiao, Chinese Academy of Sciences (CAS), China
Copyright © 2025 Feibush, Ethier, Yan and Yao. This is an open-access article distributed under the terms of the Creative Commons Attribution License (CC BY). The use, distribution or reproduction in other forums is permitted, provided the original author(s) and the copyright owner(s) are credited and that the original publication in this journal is cited, in accordance with accepted academic practice. No use, distribution or reproduction is permitted which does not comply with these terms.
*Correspondence: Eliot Feibush, ZWZlaWJ1c2hAcHBwbC5nb3Y=
 Eliot Feibush
 Stephane Ethier