 Yair Neuman
- Head, The Functor Lab, Department of Cognitive and Brain Sciences, Ben-Gurion University of the Negev, Beer-Sheeva, Israel
Armed conflicts are characterized by changes in the number of fatalities that may span different orders of magnitude. A change in fatalities, crossing an order of magnitude, may be accompanied by surprise. The paper suggests estimating the probability of extreme changes in fatality (i.e., the surprise) using a physics-informed approach. More specifically, the paper aims to estimate the probability of an unseen event where the increase in the death toll crosses an order of magnitude. The perspective is presented and illustrated with a single case: the postmortem analysis of the 7 October 2023 attack on Israel.
1 Introduction
On 7 October 2023, Hamas militants invaded Israel in a surprising blitz attack in which 1,180 Israelis were killed, 3,400 were wounded, and 251 were taken captive [1]. To understand the meaning of the attack, one has to examine the death toll in Israel since 1989 [2]. The deadliest year in Israel’s history of armed conflicts (1989–2022) resulted in 309 casualties, with an average daily death count of less than one. In logarithmic terms, a single day on 7 October 2023 resulted in a death toll higher than the rounded average of the previous most bloody year by three orders of magnitude.
The psychological surprise that followed this blitz attack and its consequences are undeniable. For instance, a senior Israeli official compared the surprise to observing a submarine in a desert’s creek [3]. From a statistical point of view, it is difficult to quantify the surprise of observing such an extreme value of fatalities given the small size of the data set and the difficulty of extrapolating far beyond the maximum observed value of fatalities before October 7 (i.e., 309). Given this context, one may ask, how surprising is this surprise? In this paper, and adopting the perspective of social physics [4], I argue that the surprise is less surprising than might have been naively assumed.
This perspective paper is structured as follows:
1. The challenge of estimating the probability of observing an unprecedented increase in the death toll, measured in orders of magnitude, is introduced.
2. The Boltzmann distribution is proposed as a model to estimate the distribution of fatalities across varying orders of magnitude.
3. A method for estimating the energy states required for the Boltzmann distribution is outlined.
4. The application of the Boltzmann distribution in computing the posterior distribution of changes in fatalities is discussed.
5. The probability of a change in the death toll, as observed on October 7, is shown to be higher than assumed.
2 Preprocessing
I analyze the annual sequence of fatalities in Israel (1989–2022) [2], comprising 34 data points. All zero values in the dataset were replaced with one to support logarithmic transformation. The year-over-year change in fatalities was calculated as the ratio of fatalities in a given year to those in the preceding year. This ratio was then transformed with Equation 1 using a base-10 logarithmic scale (log10):
Figure 1 presents Δ as a function of time:
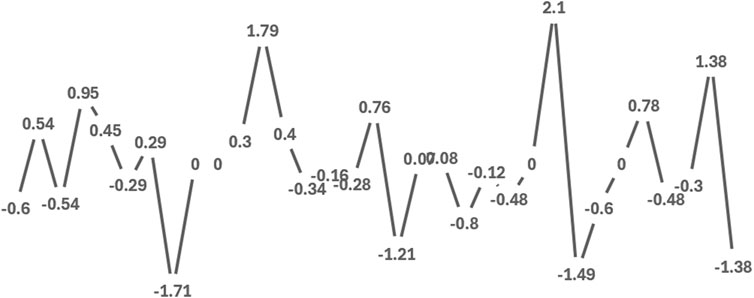
Figure 1. Change in the fatalities ratio as a function of time.
I focused on an increase in the death toll and analyzed N = 13 data points where Δx > 0. The measurements are classified into the following levels, each representing an order of magnitude in the observed Δ:
Level 1: 0.1–1
Level 2: 1–2
Level 3: 2–3
Table 1 presents the number of Δ events per level (Ni) and their probability:
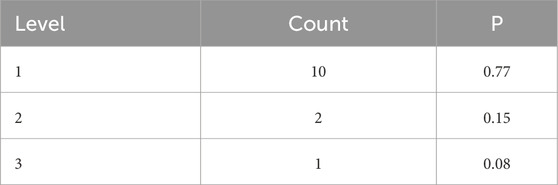
Table 1. The distribution of increases in fatalities per level (Ni).
Ten Δ were observed for the first level, two for the second level, and only one Δ was at the third level. This means there was only one measurement in which the Δ in the death toll for 2 consecutive years was at a scale of two to three orders of magnitude.
Table 1 presents the distribution of changes in the death toll. Given this distribution, I aim to estimate the probability of observing a change in the death toll with a higher order of magnitude than previously observed. Therefore, the major challenge I aim to address is to estimate the probability of the yet unseen event of October 7, where the ratio of fatalities is 3–4 orders of magnitude. More specifically, I propose using the Boltzmann distribution to estimate the probability of a Δ (i.e., an increase in the death toll) with a magnitude never observed before.
3 The Boltzmann distribution of changes in fatalities
The Boltzmann distribution is a fundamental tool in statistical mechanics for describing the probability distribution of states in a system at thermal equilibrium. In this study, the Boltzmann distribution is adapted to model the distribution of change in fatalities across orders of magnitude. Equation 2 presents the mathematical expression for the Boltzmann distribution:
where Z is the normalizing function. For simplicity, kB and T are set to 1. The Boltzmann distribution is particularly suitable for addressing the paper’s main challenge for the following reasons:
1. Energy State Representation: The next section explains that Δ can be conceptualized as corresponding with transitions between energy states. Larger changes in the death toll trivially correspond to higher energy states as more energy is required to generate more fatalities. This makes the Boltzmann distribution an ideal framework for modeling the probability of an increase in the death toll.
2. Capturing Rare Events: The Boltzmann distribution naturally accounts for the rarity of high-energy states, aligning with the observed distribution of fatalities where extreme events are less frequent but not negligible. This is a highly important point, as using the Boltzmann distribution may allow us to model unseen events in a higher order of magnitude.
3. Prior for Bayesian Analysis: Given that our data set includes a limited sample of cases (i.e., N = 13 events of an increase in the death toll), the distribution of changes in the death toll cannot be trusted to represent the real population. Using the Boltzmann distribution of Δ provides a principled way of incorporating the data structure into the Bayesian framework for estimating posterior probabilities of extreme events, specifically, extreme increases in the death toll.
Given the justification of using the Boltzmann distribution to address the main challenge of the paper, I first use the distribution of changes in fatalities as presented in Table 1 and determine the energy state of each level of
4 Representing the energy states of the distribution
We are given a distribution of change in the death toll across three levels (i.e., levels 1–3). A reasonable assumption is that each level corresponds with a different energy level used by the opponent to generate a certain increase in the death toll. In other words, each level may be considered to correspond with an energy state, as different energy levels are required to scale up the death toll.
The next phase is to assign an energy state to each level of change in the death toll. I assume a power law underlying the scales of the death toll. The assumption of a power-law distribution for the death toll scale is supported by both theoretical and empirical evidence. From a theoretical perspective, it is well known that power-law distributions are prevalent in complex systems where extreme outcomes emerge from non-linear, scale-free processes [5]. Empirically, it has been shown in the classical work of [6] and concerning the Israeli case [7] that fatalities in armed conflict follow a power-law distribution.
This power-law assumption, supported theoretically and empirically, enables the proposed framework to capture the tail behavior of the distribution, which is critical for modeling extreme events and understanding the energy states associated with significant changes in fatalities.
Assuming a power law underlying the scales of the death toll, the energy states of levels 1–3 are defined using Equation 3:
where Ei-1 is the energy level of the previous level, Si is the Ei value for the current level, Si-1 is the E value in the prior level, and k is a scaling constant that modulates the base level of energy growth.
E1 is set to 1, p = 1.5, and k = 0.5 for simplicity. Therefore, E1 = 1, and E2 is computed using Equation 4, where Si is always the midpoint value of the ∆ level:
Using the midpoint of each level’s range to calculate the energy levels, the E levels associated with states 1–3 are 1, 16.81, and 32.62, respectively. In all results, scores are rounded to two places after the decimal point.
At the end of this phase, we have (1) the distribution of change in the death toll across three levels (i.e., orders of magnitude) and (2) the energy state associated with each level.
5 Using the Boltzmann distribution for a Bayesian analysis
Given the energy state associated with each level of increase in the death toll, I calculated the Boltzmann distribution of ∆. This move allows us to leverage the analysis by estimating the probability distribution of an increase in fatality. The move is necessary because the Boltzmann distribution is then used to define our prior beliefs about the probability of observing ∆ at each level. Setting the
where Ei is the energy state associated with each level of increase in the death toll. Using the equation, we can compute the probability of observing an event, an increase in fatalities within each level. For example, the probability of observing an increase in the death toll within one order of magnitude is ≈ 1 because using the Boltzmann distribution, P(Ei = 1) ≈ 1. In contrast, the probability of observing increased fatalities in levels 2 and 3 is estimated to be approximately 0.
The Boltzmann distribution is used to define our prior beliefs about observing an event at each level of increase in the death toll. It is used to define our prior beliefs given the assumption about the energy required to cause a change in the order of magnitude of fatalities. However, the Boltzmann distribution only sets our prior beliefs under reasonable assumptions. We aim to estimate the probability of observing an event in each level of change by updating our prior beliefs through the actual distribution we observed in the 13 data points (as seen in Table 1).
Therefore, I used the Boltzmann distribution to compute the Dirichlet conjugate prior in order to estimate the posterior multinomial distribution of the levels in the death toll. In other words, I performed a Bayesian analysis, updating the prior using the observed distribution of ∆.
Using the Boltzmann distribution to compute the conjugate prior offers an approach well-suited to rare-event modeling in small samples. The Boltzmann distribution leverages the data structure of changes across categories to inform the Dirichlet distribution’s alpha parameters, allowing the model to capture both low and high-energy events despite limited data. This approach provides a more flexible alternative to traditional distributions, which may underestimate extreme events due to a lack of prior weight given to higher-magnitude changes.
In summary, using the Boltzmann distribution, we can estimate the probability of observing an increase in fatalities within each order of magnitude. This distribution is used as a conjugate prior to estimate the posterior distribution of ∆ across different orders of magnitude.
6 Estimating the probability of an extreme event that has not been observed
Using the Bayesian analysis, we may revise our prior beliefs that changes in death toll will occupy energy states scaling over orders of magnitude. In other words, we revise our beliefs concerning the probability of observing an increase in the death toll within each order of magnitude (i.e., level). For example, there were N = 13 events of increase in the death toll, and their distribution for categories 1 to 3 was 0.77, 0.15, and 0.08, respectively. Updating the prior, the posterior multinomial probability distribution is now [0.37, 0.51, 0.11]. In other words, the probability of observing an increase in fatalities for each order of magnitude has been updated, where the probability of observing an increase within 2–3 orders of magnitude has changed from 0.08 to 0.11:
Our interest, though, is not in updating our prior beliefs per se but in estimating the probability of observing an event in an order of magnitude not observed before. In other words, we are interested in the question: What is the probability of observing a ∆, which is between three and four orders of magnitude (i.e., level 4)? Such a ∆ does not exist in the data set of fatalities that ends in 2022, a year before the Hamas blitz attack.
To answer this question, I computed the Boltzmann probability distribution for a system with four energy states. I also revised the sample to include four levels, where the fourth level includes one event: [10, 2, 1, 1]. This sample (N = 14) represents a “what if” scenario and allows us to estimate the probability of observing a change within an order of magnitude (i.e., 3–4) that has not been observed in the real dataset. In other words, I built a hypothetical scenario where the original distribution of changes in the death toll includes the observation of one extreme event where the increase in the death toll is within the level of 3–4 orders of magnitude.
In this hypothetical scenario, and using the same procedure as presented before, I performed the following procedure. I used the Boltzmann distribution as a vector of probabilities [p1 ≈ 1, p2 ≈ 0, p3 ≈ 0, p4 ≈ 0]. The observed counts are [N1 = 10, N2 = 2, N3 = 1, N4 = 1], representing the sample data in each level. I used the Boltzmann distribution as a prior, interpreting each probability in the Boltzmann distribution as proportional to a Dirichlet parameter. Next, I multiplied each probability in the Boltzmann distribution by a scaling factor, s, equal to the size of the hypothetical sample (N = 14) to create a Dirichlet parameter vector α: [1 × 14, 0 × 14, 0 × 14, 0 × 14], updated the Dirichlet prior with the observed data: [10 + 14, 2 + 0, 1 + 0, 1 + 0], and computed the posterior: [24/28, 2/28, 1/28, 1/28] to gain the final (rounded) posteriors: [p1 = 0.86, p2 = 0.07, p3 = 0.04, p4 = 0.04]. Therefore, the chance of observing an increase in the death toll, which is of three to four orders of magnitude [i.e., p(Ei=4)], is 4% and not 0, as might have been naively assumed.
Using standard norms of rare events [8], such a change in the estimated number of fatalities moves the scale from “extremely rare” to “very rare.” While the probability of observing a 3–4-order-of-magnitude increase in the death toll is still low (i.e., very rare), it is not in the realm of the black swans or the unimagined, as naively believed [2].
7 Discussion
Armed conflicts have been studied from the perspective of complex systems (e.g., [7, 9, 10]). The current perspective aligns with this literature and introduces a social physics approach to armed conflicts, specifically estimating the probability of observing an extreme change in the death toll. I suggested that the Boltzmann distribution may be valuable in understanding how fatalities are distributed across the severity scales because it provides a framework to model the energy associated with different magnitudes. When using it to form the conjugate prior for a Bayesian analysis, we can better estimate the probability of an unseen extreme change in the death toll. Moreover, the probability of observing a change in fatalities in three to four orders of magnitude has been estimated using a Boltzmann distribution with T = 1. Using a model with different temperature levels produced some interesting insights that cannot be detailed here, given the limits of a perspective article.
Data availability statement
The original contributions presented in the study are included in the article/Supplementary Material; further inquiries can be directed to the corresponding author.
Author contributions
YN: Conceptualization, Data curation, Formal Analysis, Funding acquisition, Investigation, Methodology, Project administration, Resources, Software, Supervision, Validation, Visualization, Writing–original draft, and Writing–review and editing.
Funding
The author(s) declare that financial support was received for the research, authorship, and/or publication of this article.
Acknowledgments
YN would like to thank Boaz Tamir for helpful feedback on the previous version and the reviewer for his constructive reading of the paper.
Conflict of interest
The authors declare that the research was conducted without any commercial or financial relationships that could be construed as a potential conflict of interest.
Generative AI statement
The author(s) declare that no Generative AI was used in the creation of this manuscript.
Publisher’s note
All claims expressed in this article are solely those of the authors and do not necessarily represent those of their affiliated organizations, or those of the publisher, the editors and the reviewers. Any product that may be evaluated in this article, or claim that may be made by its manufacturer, is not guaranteed or endorsed by the publisher.
References
1. Available from: https://en.wikipedia.org/wiki/7_October_Hamas-led_attack_on_Israel
2. Available from: https://www.kaggle.com/datasets/saurabhbadole/countries-in-conflict-dataset?select=countries-in-conflict-data.csv
4. Jusup M, Holme P, Kanazawa K, Takayasu M, Romić I, Wang Z, et al. Social physics. Phys Rep (2022) 948:1–148. doi:10.1016/j.physrep.2021.10.005
5. West BJ. Simplifying complexity: life is uncertain. In: Unfair and unequal: life is uncertain, unfair and unequal. Bentham Science Publishers (2016).
6. Richardson LF. Variation of the frequency of fatal quarrels with magnitude. J Am Stat Assoc (1948) 43(244):523–46. doi:10.2307/2280704
7. Neuman Y. Betting against the crowd: a complex systems approach. Singapore: Springer Nature (2024).
8. Shyalika C, Wickramarachchi R, Sheth AP. A comprehensive survey on rare event prediction. Surveys (2025) 57(3):1–39. doi:10.1145/3699955
9. Lee ED, Daniels BC, Myers CR, Krakauer DC, Flack JC. Scaling theory of armed-conflict avalanches. Phys Rev E (2020) 102:042312. doi:10.1103/physreve.102.042312
Keywords: social physics, armed conflicts, fatalities, surprise, uncertainty
Citation: Neuman Y (2025) Extreme events in armed conflicts: a perspective. Front. Phys. 13:1528716. doi: 10.3389/fphy.2025.1528716
Received: 15 November 2024; Accepted: 09 January 2025;
Published: 20 February 2025.
Edited by:
Haroldo V. Ribeiro, State University of Maringá, BrazilReviewed by:
Cesar I. N. Sampaio Filho, Federal University of Ceara, BrazilCopyright © 2025 Neuman. This is an open-access article distributed under the terms of the Creative Commons Attribution License (CC BY). The use, distribution or reproduction in other forums is permitted, provided the original author(s) and the copyright owner(s) are credited and that the original publication in this journal is cited, in accordance with accepted academic practice. No use, distribution or reproduction is permitted which does not comply with these terms.
*Correspondence: Yair Neuman, eW5ldW1hbkBiZ3UuYWMuaWw=