
95% of researchers rate our articles as excellent or good
Learn more about the work of our research integrity team to safeguard the quality of each article we publish.
Find out more
ORIGINAL RESEARCH article
Front. Phys. , 04 February 2025
Sec. Optics and Photonics
Volume 13 - 2025 | https://doi.org/10.3389/fphy.2025.1526350
This article is part of the Research Topic Advanced High Power Solid-State Laser Technology, Volume II View all articles
 Ke Wang1
 Zhenrong Zhang1*Sheng Wang1Yamin Wang1Yangyang Liu1Haolong Wu1Jun Shao1Jingfeng Ye1Jianghuai Cai2
A compact and stable diagnostic system is established using Raman scattering to measure parameters such as major species concentration and temperature in the combustion flow field. Despite an engine’s huge vibration, the prototype works stably and has an uncertainty level below 5%. A standard Hencken burner validates the results. From our perspective, the prototype represents a novel practical application of mature Raman spectroscopy technology, warranting interaction with engineering experts in relevant fields. The background and signal are distinguished with the half-wave plate. The orthogonality and angle between excitation and signal contribute to a good signal-to-noise ratio (SNR). The compactness of the device is fully considered. The device exhibits good resistance to adverse environments. The system’s temperature is minimally affected by external conditions, and it has good vibration resistance features. The temporal resolution of a single pulse of the device is 10 ns. The spatial resolution is 3 mm × 0.2 mm × 0.2 mm with one-dimension measurement available.
Laser diagnosis technology for combustion flow fields is a multifaceted and intricate field that relies heavily on spectral technology, photoelectric detection, and data image processing [1–3]. The time-resolution measurement of gas components in the impact vibration environment, such as combustion and explosion, is of great significance to the understanding of its internal state and reaction process. However, the characteristics of rapid change, high temperature, large impact, and strong environmental vibration bring great challenges to the measurement [4–7].
In recent years, laser spectroscopy has been widely applied in the diagnosis and measurement of complex environments due to its advantages, which include real-time, fast, qualitative, and quantitative analysis. Laser diagnosis technology has the feature of no disturbance to the combustion flow field because of non-intrusive measurement, which makes it more reliable to reflect the real results of the combustion process without influencing the flow. In addition, high temporal and spatial resolutions can reach a magnitude of ns or fs, while spatial resolution can evenly reach a magnitude of microns [8, 9]. It is possible to accomplish the precise task of measuring the combustion flow field. Furthermore, laser diagnosis technology can acquire abundant information to measure combustion. Temperature, pressure, velocity, component, and concentration distribution of the combustion field can be measured to improve a comprehensive understanding of the combustion process [10–12]. Lastly, some measuring techniques can reveal the state throughout the combustion field via the two-dimensional or three-dimensional quantitative measurement, which is visible and direct. Combined with techniques of image processing and image display, laser diagnosis technology can simulate and show various characteristics of the combustion field. However, using laser diagnosis technology is more expensive and complex than using a physical probe to measure combustion flow in the aspect of equipment and processing methods [13–17].
Using advanced non-contact optical measurement technology, a quantitative measurement of combustion flow field parameters is conducted at the exit of the near-real main combustion chamber. The accurate measurement of parameters such as exit temperature and component concentration of the engine combustion chamber can provide solid support for the emission control of combustion pollutants, the calculation of combustion efficiency, and the combustion of fuel. The data play an essential role in promoting the design, quality control, and optimization of the engine [18–20].
At present, laser diagnosis technology has been widely used in temperature measurement of combustion flow fields, including coherent anti-Stokes Raman scattering (CARS), planar laser-induced fluorescence (PLIF), Rayleigh scattering (RS), and tunable diode laser absorption spectroscopy (TDLAS) [21–23]. Spontaneous Raman scattering (SRS), one of the important branches of laser combustion diagnostics, is produced by the weak inelastic interaction of photons with molecules, including vibrations or rotational transitions of matter [24–42]. The important parameters of the flow field, such as temperature, major species, and their concentration, can be observed. Spontaneous Raman spectroscopy can detect almost all species of gases (except inert gases) at the same wavelength, which effectively compensates for the deficiency of the infrared absorption spectrum. It is widely used in the petrochemical industry, environmental protection, and food identification due to its advantages, which include no special preparation, no damage to samples, and no sample consumption. It can also be used to diagnose the combustion flow field of an engine under a wide range of operating conditions. Difficulties in diagnosing aero-engines due to multi-parameter interleaved coupling in the turbulence can be researched [43–45]. Due to the harsh operating conditions, the state of a near-real engine combustor is rarely reported, according to Chen’s work. The maximum deviation of temperature is approximately ±150 K [46].
A compact and steady device is established in this article to solve the difficulties of multiple parameters in turbulence and overcome the challenges from harsh environments accompanied by engine starting. The spontaneous Raman scattering technique serves to measure a single-head aero-engine. When the temperature and major species concentration of the chamber outlet are obtained under conditions of various typical statuses of combustion, real-time experimental data can be provided to improve engine design and analysis of combustion. The performance of the integrated Raman scattering measuring device configured by the operators is also tested to analyze and evaluate the feasibility and reliability of the device applied in the engine test site.
Adolf Smekal foresaw Raman scattering in 1923, which was experimentally discovered by C. V. Raman in 1928. The scattering level transition process is shown in Figure 1. Spontaneous Raman spectroscopy is a method of detecting the scattering light produced by the inelastic scattering of photons and matter molecules.
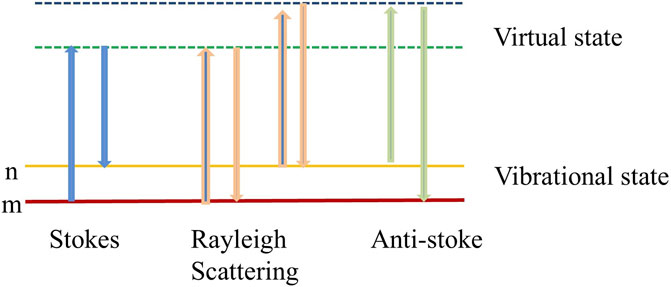
Figure 1. Schematic illustration of the principle of Raman scattering.
Assuming that the gas molecule is in the state of thermal equilibrium and obeys the Boltzmann statistical distribution, the intensity Si of Q-branch Stokes Raman scattering produced by the laser irradiation can be expressed as:
where i indicates the kind of gas species, and
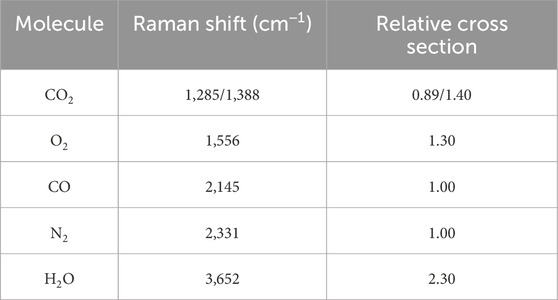
Table 1. Raman shift and relative Raman cross section of major species in the flame excited by 355 nm. All the values are normalized by the Raman cross section of N2.
The intensity of Raman spectra of different molecules in the gas medium under different conditions can be obtained by experimental measurement. When the spectral signal-to-noise ratio is high and there is no coupling, the spectral area, a calculating method, can be used to calculate intensity directly. Although the signal-to-noise ratio is poor and the Raman spectra of different components are coupled, the spectral intensity calculation needs to be done by spectral fitting. The “concentration of the corresponding components” parameter can be calculated by inversion of Equation 1. The Raman spectrum of typical combustion-relevant gas molecules is shown in Figure 2A [47]. Comparing the theoretical spectrum with the experimental spectrum, the corresponding components of the experimental spectrum can be quickly determined and analyzed. A conclusion can be drawn from theoretical calculations that the spectral line profile of the Raman scattering spectra of most molecules is very sensitive to temperature. Figure 2B shows the theoretical line profiles of vibrational Raman spectra of N2 at different temperatures. When the gas state reaches thermal equilibrium, the number of particles in the rotational energy level of the molecular ground state obeys the Boltzmann distribution. As the temperature increases, the intensity of Raman spectra corresponding to the high vibration-rotational state is strengthened, leading to the change of the spectral line profile.
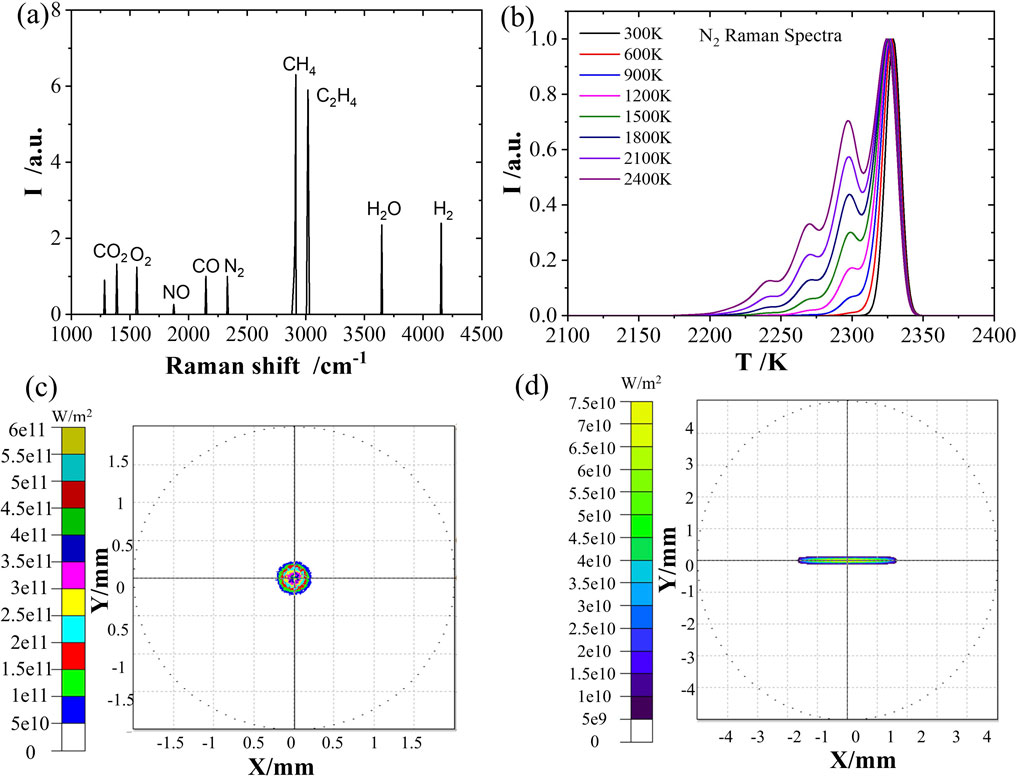
Figure 2. (A) Raman shift of typical gas species, (B) vibrational-rotational Raman spectroscopy of N2 in different temperatures, and (C) simulated results of focal spot when one spherical lens with a focusing length of 500 mm is used. (D) Simulated results of focal spots when two cylindrical lenses with focal lengths of 300 mm and 500 mm are used.
Theoretical calculations can predict the appearance of the Raman spectra under different temperatures, and the experimental data can be fitted by theoretical spectra. Eventually, the temperature of the measured gas can be obtained by inversion. The spectral fitting method is used to invert the gas temperature, which is not affected by variation of laser energy and has high temperature measurement accuracy. By measuring the Raman spectra of the gas, we can not only analyze the component information of the gas but also obtain the parameters, including component concentration and the temperature of the gas.
Generally, the Raman signal is detected from the focusing spot of the excited laser because of its weakness. In order to avoid the detected Raman signal degenerating from the phenomenon of laser-induced breakdown and damage to the optical window, the morphology of the focal spot and optical window in different modes is simulated (TracePro). In the simulation, two optical windows are placed at a distance of 140 mm in parallel to represent optical windows in the practical detection region. The focal spot is designed to be the center of the two windows. When the focusing lens is chosen as one spherical lens with a focusing length of 500 mm, the power density of the focal spot is more than 1011 W/cm2, as shown in Figure 2C, which is too high to tolerate laser-induced breakdown. When two cylindrical lenses with focal lengths of 300 mm and 500 mm are placed tightly, the simulation results show that the focal spot is in a long elliptical distribution with an area of approximately 0.5 mm2 and a power density of 9 × 10⁹ W/cm2, as shown in Figure 2D. The density is calculated according to the ratio of the energy of the experimental laser and the simulated area of the spot. When the lens ridges are perpendicular to each other, laser-induced breakdown will not occur, and the optical window will not be damaged.
Based on the experiment and principle, a spontaneous Raman scattering device is configured as shown in Figure 3A and is used to complete the test of a single-head engine. The measuring area is a longitudinal 10 mm area. The device is made up of two layers. The lower layer includes a laser module and spectrum detection module, while the upper layer contains a signal collection and transmission module. The shorter the wavelength of excitation, the higher the intensity of the signal [48]. A longer-wavelength laser is not suitable to avoid submerging the signal in background emissions. An Nd:YAG laser (Q-Smart 850, Quantel, France) serves as the excited laser whose wavelength is 355 nm generated by tripling the frequency of the fundamental wavelength (1,064 nm) with polarized output. The repetition frequency is 10 Hz. The pulse width is approximately 6 ns. The beam divergence angle is less than 0.5 mrad with a line width of 1 cm−1. The beam diameter is 8 mm. Single pulse energy maximizes at 180 mJ at 355 nm. After laser operation, the beam is selected by a half-wave plate to change the direction of polarization, avoiding fluorescence affection.
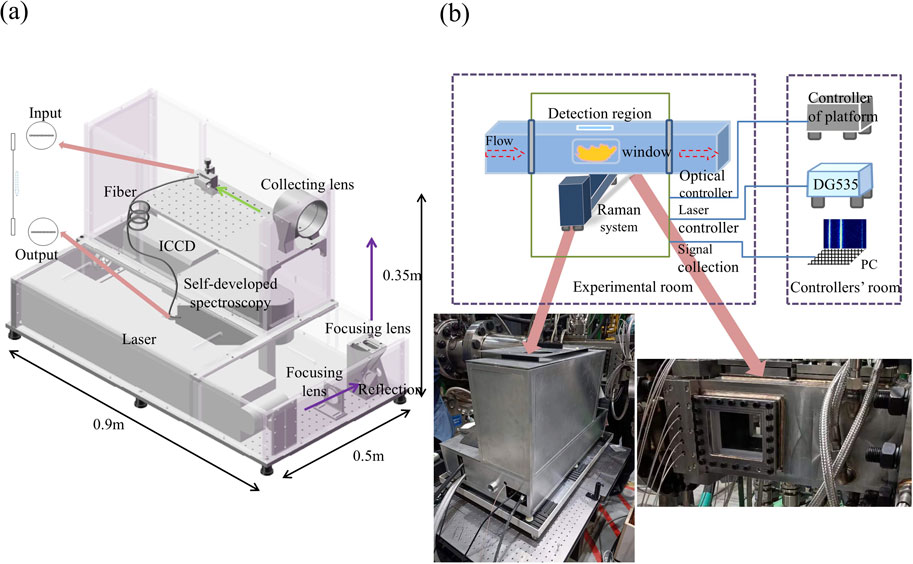
Figure 3. (A) Prototype of original SRS to diagnose combustion of an engine and (B) practical layout of system and engine. The inset is a photograph of the device and the flow chamber of a jet engine.
The laser is focused on the center of the detection area by a focusing lens. In the system used in this paper, two cylindrical lenses with focal lengths of 300 mm and 500 mm are placed tightly after comparison. The collection system consists of a collecting lens and signal-transmitting fiber. The fiber is at the vertical position of the direction of laser propagation. The collection lens group consists of two anastigmatic lenses with an aperture of 100 mm, object and image distances of 200 mm, and an F-number of 2, which can effectively improve the efficiency of collecting signals. The membrane system of the collection mirror is specially designed for high transmittance to signal and high reflection to excitation. The signal transmission fiber bundle is arranged in a linear sequence code [49]. As shown in Figure 3A, 48 fibers are used. Each fiber is multi-mode fiber, 200/220 μm, NA 0.2. The diameter of the single fiber is 0.22 mm. Therefore, the overall size of the fiber line arrangement is 10.5 mm, and the signal collection is in 1:1 imaging mode. Thus, the size of the detectable area is equal to the size of the fiber line arrangement, approximately 10.5 mm.
The input end of the fiber is connected to the signal collection module, while the output end is connected to the spectrum detection module. The detection module includes a self-developed monochromator and an enhanced charge coupler [47] (ICCD, 0.1 nm resolution, 2–3 ns gate, 450 ns dual image feature inter-frame time–high speed, 40–64 lp/mm resolution limit). The self-developed spectrometer has the characteristics of high luminous flux (F/2.0), small volume (0.5 m × 0.25 m × 0.13 m), high stability, and good matching with the spectral band of the detector (corresponding to a Raman shift of 1,200–4,200 cm−1, including Raman spectra of all the main components in the combustion field).
Compared with an existing commercial spectrometer, the luminous flux is increased about 10 times, effectively enhancing the signal and making the integration of the measuring system more convenient. This also increases the environmental adaptability of the device. The one-dimensional spatial distribution of the combustion field is measured by using different optical fiber images in different areas of the vertical direction of the camera.
During the on-site test of the single-head engine, the testers should be far away from the field and stay in the controller room to complete the equipment operation and data acquisition because of the bad working environment, high noise, and hidden danger. The field layout is shown in Figure 3B. When the engine works, combustion is formed. The flow propagates inside the tunnel. A certain detection region is chosen for measurement, sealed by the optical glass window at the periphery. The Raman scattering measuring device is located at the outlet of the combustion chamber of the single-head engine, near the glass window. Thus, the excitation light passes through the window, the signal is transmitted through the fire and collecting system, and pictures are shot. Once the engine operates, fuel and air are mixed, and the temperature rises. Noise and vibration can be harmful to operators. The remote controller is only necessary if the device is exposed to adverse conditions. The device is connected to the optical extender, the net wire, the transmission fiber, DG535, and so on to make the remote control possible.
To eliminate the strong background interference, a remote adjustment module of laser polarization direction is set up. Changing the polarization direction of the excited laser during the measurement process enables a switch between signal measurement and background measurement. The real-time background parameters in the measurement are obtained, contributing to a high signal-to-noise ratio (SNR) and improving the accuracy of the measurement. The signal intensity attenuation caused by optical misalignment is attributed to high ambient temperature rise and strong vibration in the experimental field. The remote optical calibration system is set up and can realize the remote calibration of signal reception and ensure the signal collection efficiency in the adverse testing environment of an engine.
On the one hand, the SRS device is used to diagnose the flame of the standard burner. The main parameters of the flame under several different combustion conditions are obtained and are applied to analyze and evaluate the performance of the device. By controlling the flow rates of methane and air, the combustion flames are formed under six different working conditions, as shown in Table 2. The flame temperatures and the concentrations of the main components are measured by Raman scattering techniques. The pressure in the chamber is adjusted by a pump with a maximum pressure of 3 atm.
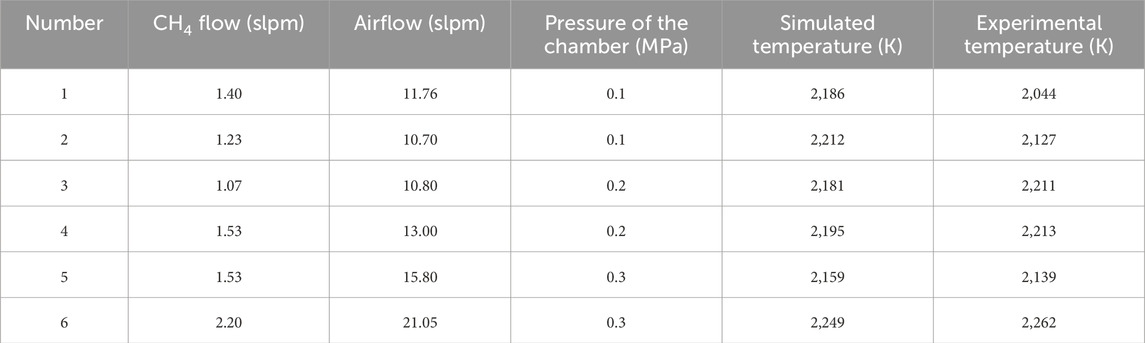
Table 2. Combustion of CH4 and air generated by a Hencken burner.
Taking status number 4 as an example, the air-rich state, we can tell from the Raman spectrum that CO2, O2, N2, and H2O are included in the standard combustion flame shown in Figure 4A. The spectral intensity of the Raman spectra in the flame is simply equal to the area under spectral curves when there is no overlap. Another scheme involves calculating by the method of spectral fitting according to the theoretical Equation 1, taking into account spectral coupling and unknown noise, which obeys the Voigt profile. The concentration of major species is determined by combining calibration coefficients. Figures 4B–F are the fitting results of Raman spectra for several components in the Hencken burner when the flame is produced by a mixture of methane and air.
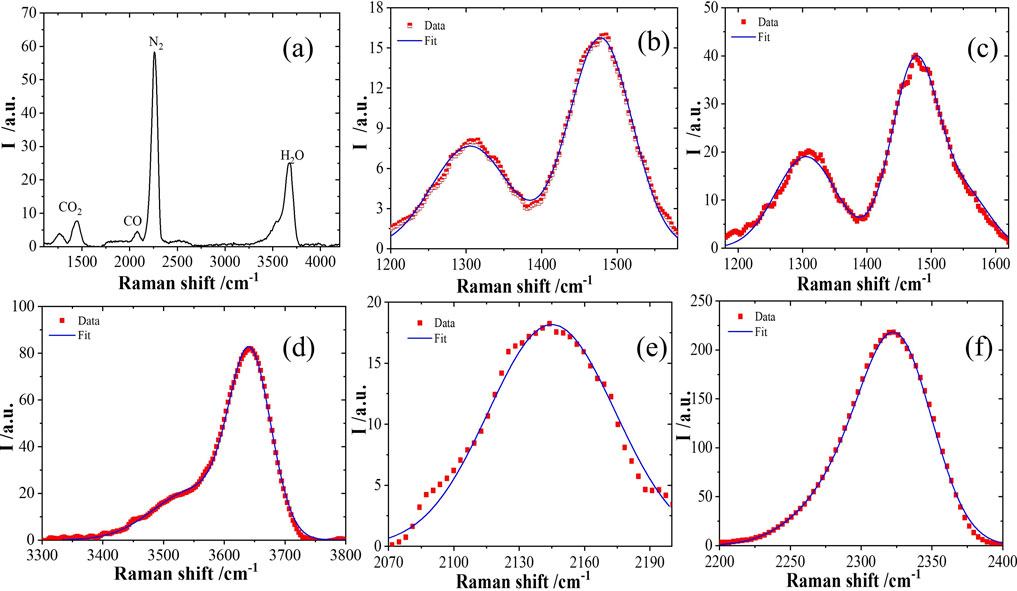
Figure 4. (A) Raman spectra of standard fuel-rich flame, (B) Raman spectra and fitting results of CO2, (C) results of CO2/O2, (D) results of H2O, (E) results of CO, and (F) results of N2.
The temperature and concentration of the main components in the methane/air flame of the Hencken burner are inversely measured according to the spectral data. In order to determine the accuracy of the Raman scattering technique, the temperatures and concentrations of main components measured under different combustion conditions of the Hencken burner are compared with the theoretical results. The concentration can be calculated as Equation 2:
Si refers to the intensity of Q-branch Stokes Raman scattering. C represents the calibration coefficient. As mentioned in Figure 2B, the line profile is related to temperature. When both the theoretical and measured spectra are acquired, the temperature can be inversed by comparing the height and profile of the spectral line. Figures 5A–C show the results of concentration comparisons. Figure 5D shows the temperature result. In the legends, the experimental component (EC) represents the experimental component concentration calculated by spectral inversion, while the simulation component (SC) represents the theoretical component concentration obtained through simulation. Experimental temperature (ET) denotes the temperature calculated by experimental data, while simulation temperature (ST) is the temperature acquired by simulation. The results show that the measured values of the flame temperature and the concentration are in good agreement with the theoretical values, and the deviation between the measured values of the main components and the theoretical values is less than 5%. The results reveal that the Raman scattering technique accurately measures component concentration. Measurement of major species in various combustion flows can be satisfied through the device.
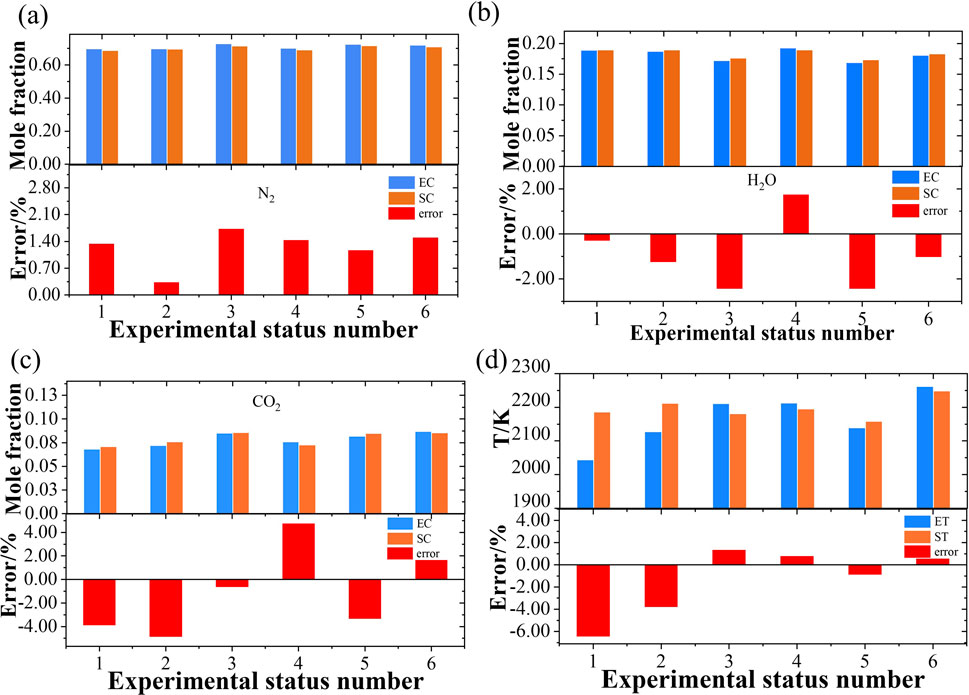
Figure 5. (A–C) Comparison of experimental and simulating concentration in flame under different combustion situations (N2/H2O/CO2) and (D) comparison of experimental and simulating temperatures of flame in different combustion situations.
However, when pressure is high, the simulated temperature is closer to the experimentally inversed temperature. The higher the pressure, the lower the deviation is acquired. The average deviation is below 50 K. It is necessary to further study the factors contributing to the differences in the combustion field under the same gas ratio but different pressures. The combustion coefficient needs to be corrected when pressure is low. Our system can be improved by optimizing the excitation and collection system. A more stable prototype can be selected as the excitation laser, resulting in a higher SNR for the generated spectra. Improved design of the coating film on the focal lens can be considered to reduce signal loss. The theoretical temperature calculated in this work is the adiabatic flame temperature. Due to approximately one-dimensional flow with high flow velocities from the burner surface, the Hencken burner supports a flat flame that is nearly adiabatic, as reported by Ombrello [50]. The primary mode of heat transfer from the flame to the burner surface is radiation, which has been suggested to be negligible through simulations. The simulation results from the Hencken burner are widely acknowledged to represent the adiabatic temperature. More adjustments need to be made to narrow the deviation. According to the results, the mole fraction of N2 and H2O matches well. As for CO2, the Raman spectra of CO2 and O2 partly overlap. We are trying to distinguish the overlapping spectra in Figure 4. The method of fitting is used. Software processing the spectra is under development. When the specific software is completed, the mole fraction can be more accurate because of good exfoliation between the spectra of O2 and CO2. We assume that when the pressure is low, the combustion is not sufficient, and in an ideal case, the spectra of O2 have a larger influence on the spectra of CO2. Therefore, the deviation is relatively smaller at high pressure. The simulation results are acquired based on the hypothetical that the reaction is complete, which is idealized. When pressure is high, the status of the practical flame is more approximate to the assumption. Deviation of temperature is smaller at high pressure.
The SRS device was applied to the outlet diagnosis of the combustion chamber of a single-head engine after verification of the standard combustion furnace. The concentration of the major species of combustion flow field under different working conditions of multi-cycle experiments was observed. Taking one cycle of the experiment into discussion, the methods of analysis and treatment are the same as the standard combustion flame. The Raman spectra of flame at the outlet of the engine combustion chamber were obtained. The main components consisted of CO2, N2, H2O, and CO. The concentrations and temperature parameters were calculated. Eleven different working conditions are shown in Table 3. The intake parameters of the combustion chamber are provided by the engine developer. The highest pressure peaks at 12 atm, which is four times higher than that of Hencken burner.
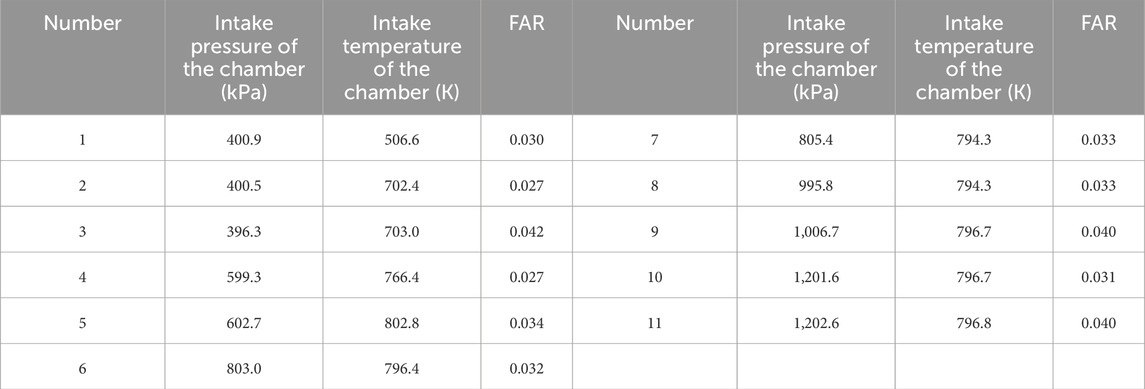
Table 3. Combustion in a single-head engine.
Obvious vibrations and very loud noises exist when the engine operates. Operators cannot be in the same room with the prototype. The detection region will move forward because of a strong thrust when the fire is triggered. The system is servo-driven as detection goes forward, generating a displacement of 7 cm. The system can still perform well in a hostile environment.
Figure 6A shows the Raman spectrum of flame measured in different working conditions of the engine. It shows that the spectral line broadens and the peak moves upward as the intake pressure and temperature of the combustion chamber increase, indicating that the Raman spectrum signal strengthens gradually. The insert represents the 2-D image of the Raman signal obtained by the camera under condition number 10, showing a clear spectral line with good resolution. Figure 6B shows the concentration and uncertainty of the main components in the different statuses of flame in the engine. Figure 6C shows the comparison between the concentration of the components measured in this experiment and the corresponding combustion conditions.
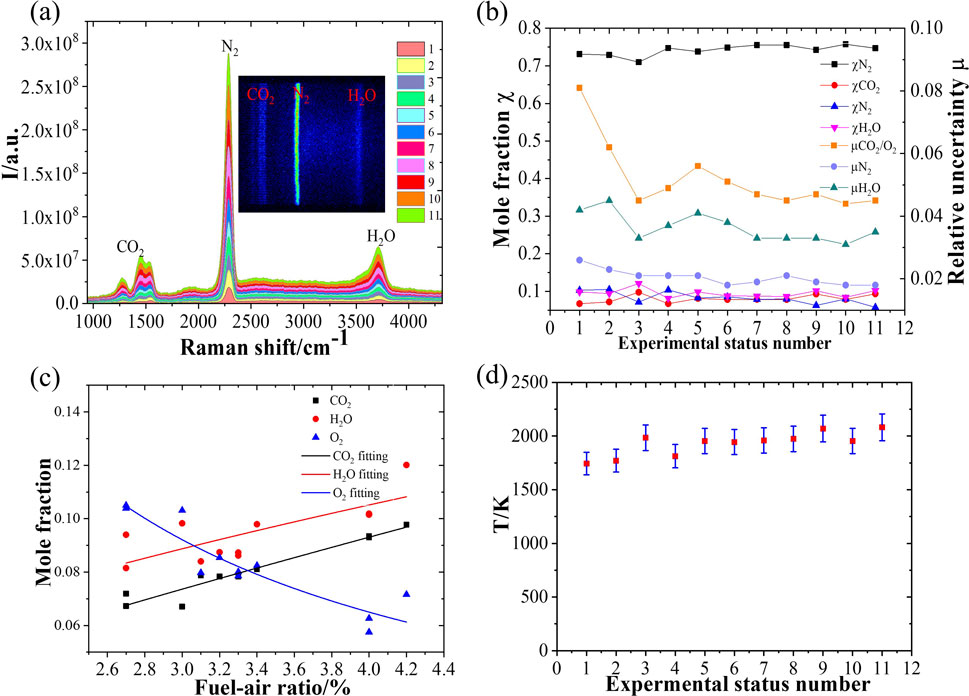
Figure 6. (A) Raman spectra in different statuses, (B) concentration of main species in the flame when the engine operates in 11 different statuses and relative uncertainty of concentration, (C) relationship between species (CO2/H2O/O2) and fuel-air ratio, and (D) temperature changes under different statuses.
In Raman scattering, the signal intensity is proportional to the molecular density of the components. So, the larger the density is, the better the spectral signal quality and signal-to-noise ratio are. The smaller the residual error of the fitting is, the less uncertainty there is in the measurement of the corresponding component concentration. For example, the relative concentration of N2 is the highest (over 70%), and its spectral intensity is the strongest with the smallest uncertainty of measurement. Although the relative concentration of CO2 and H2O is generally less than 10%, the corresponding spectral intensity is small, with a poor signal-to-noise ratio and a large uncertainty of concentration measurement. A conclusion can be drawn that the concentration of CO2 and H2O, as combustion products, has a strong positive correlation with the fuel-air ratio (FAR) in combustion conditions. In contrast, the molar fraction of O2, as an oxidant, has a strong negative correlation with the FAR in the combustion process. The temperature of the combustion field is obtained by fitting the H2O Raman spectra measured under different conditions in the same round of experiments. Figure 6D is the calculated results of temperature under different operating conditions. The temperature from the outlet is higher than that of the intake parameter. The higher the fuel-to-air ratio is, the higher the combustion temperature reaches. When the ratio is around 0.04, the mean temperature can reach 2000 K, while for a ratio of 0.027, the mean temperature is approximately 250 K lower. As pressure increases, the deviation between the outlet and intake temperature goes down, revealing the stability and sufficiency of flame.
According to the analysis, under most working conditions, the uncertainty of measurement of concentration of several main components is better than 5%. On the whole, the parameters such as pressure, temperature, and combustion efficiency of the combustion field increase gradually. Therefore, the quality of Raman spectra obtained by the SRS device tends to improve with the uncertainty of measurement decreasing gradually.
To date, many reports are still created in a laboratory where the environment is friendly to an optical setup. A compact and stable diagnostic prototype is established. The system and prototype demonstrated in this paper operate well both in the laboratory and in adverse circumstances, unveiling their strong value as industrial sensors. The temporal resolution of a single pulse is 10 ns. For the accuracy, the average pulse is used. The temporal resolution is about several seconds, while the spatial resolution reaches 3 mm × 0.2 mm × 0.2 mm. The detection sensitivity of a single pulse is below 1%.
Based on a deep analysis of the basic principle of Raman scattering technology, an SRS spectra processing method and an SRS device with good performance for standard burners are established and applied to the Hencken standard burner. When the SRS device is under configuration, the influence of the optical window, laser-induced breakdown, and vibration of the site are taken into consideration. Arranged focusing lenses degenerate the influence of breakdown spectra. Orthogonality is considered to obtain background and signal, boosting the SNR. The result is a thoughtfully designed compact device that can measure the parameters of standard flame, temperature, and main component concentration.
High-quality Raman scattering signals under various types and different combustion conditions are obtained, and the deviation between the experiment and theory is analyzed. The deviation between calculation and simulation is less than 5%. Then, the established SRS spectra processing method and the integrated SRS device are applied to the online diagnosis of the engine, whose combustion flow field of the chamber outlet is monitored to acquire high-quality Raman scattering signals under various conditions when pressure is high. SRS spectra are shown with a pressure of 12 atm.
The parameters of the combustion field, temperature, and concentration of main components under different operating conditions are given by inversion of spectral data. The results show that the method of measuring the exit parameters of the engine combustion chamber by Raman scattering and the developed SRS device can well complete the diagnosis of the engine combustion flow field. The data of temperature and the high-precision component concentration of the engine combustion chamber outlet are given, which provides solid support for the evaluation of the engine combustion performance.
The developed SRS device can play a significant role in extremely adverse environments by diagnosing the species with concentration and temperature calculated. At present, the measuring system of flow field parameters at the outlet of the combustion chamber of the engine does not have high time-resolved characteristics. This needs to be done to improve the measurement method and measuring device when the time-space resolution of the measurement process is optimized, providing a diagnosis of the combustion flow field of the engine, and promoting the development and application of SRS technology. The window is still necessary for the engine when the signal is collected. Improvements can be made to combine the collecting lens with fiber, boosting the compactness and practicality. It is urgent to develop functional software to process the data and deliver the results more quickly.
The original contributions presented in the study are included in the article/supplementary material; further inquiries can be directed to the corresponding authors.
KW: Data curation, Validation, Writing–original draft, Writing–review and editing. ZZ: Funding acquisition, Investigation, Supervision, Validation, Writing–review and editing. SW: Formal Analysis, Methodology, Resources, Writing–review and editing. YW: Conceptualization, Methodology, Writing–review and editing. YL: Investigation, Methodology, Writing–review and editing. HW: Conceptualization, Data curation, Investigation, Writing–review and editing. JS: Data curation, Formal Analysis, Writing–review and editing. JY: Funding acquisition, Project administration, Resources, Supervision, Visualization, Writing–review and editing, Writing–original draft. JC: Data curation, Formal Analysis, Methodology, Writing–review and editing, Writing–original draft.
The author(s) declare that financial support was received for the research, authorship, and/or publication of this article. The authors acknowledge the financial support from the National Natural Science Foundation of China (91841303) and the National Science and Technology Major Project of the Ministry of Science and Technology of China (J2019-v-0005-0097).
The authors are grateful to the reviewers for their suggestions and comments, which significantly improved the quality of this paper. They thank Prof. Wenjiang Xu, Mingcheng Ma, Weiming Huang, and Shaokun Wang (Xiamen University) for their advice. They also thank for the support of Xingwang Hu and Jiakang Wan (AECC Sichuan Gas Turbine Research Establishment). They also acknowledge the help of Lijun Wang, Mengmeng Tao, Zhenjie Wu, Guohua Li, and Huilin Cao (Northwest Institute of Nuclear Technology). The authors thank Prof. Hongbin Zhou for language polishing. The authors would like to thank the reviewers for their recommendations and comments.
The authors declare that the research was conducted in the absence of any commercial or financial relationships that could be construed as a potential conflict of interest.
The author(s) declare that no Generative AI was used in the creation of this manuscript.
All claims expressed in this article are solely those of the authors and do not necessarily represent those of their affiliated organizations, or those of the publisher, the editors and the reviewers. Any product that may be evaluated in this article, or claim that may be made by its manufacturer, is not guaranteed or endorsed by the publisher.
1. Grosjean DF. Advanced laser diagnostics development and application. Wright Laboratory (1996) 2081, 2.
4. Wang K, Zhang ZR, Wu ZJ, Wang S, Li G, Shao J, et al. Diagnosis of multiple gases using a multi-pass ring cavity to enhance Raman scattering. Opt Comm (2024) 559:130438. doi:10.1016/j.optcom.2024.130438
5. Petrov DV, Matrosov II, Zaripov AR, Tanichev AS, Kostenko MA, Nekhoroshev AO. Evaluation of the metrological characteristics of Raman analyzer of natural gas. Meas Tech (2021) 64:261–6. doi:10.1007/s11018-021-01927-z
6. Sieburg A, Schneider S, Yan D, Popp J, Frosch T. Monitoring of gas composition in a laboratory biogas plant using cavity enhanced Raman spectroscopy. Analyst (2018) 143:1358–66. doi:10.1039/c7an01689a
7. Petrov DV, Ivan IM, Alexey RZ, Aleksandr ST. Raman natural gas analyzer: effects of composition on measurement precision. Sensors (2022) 22:3492. doi:10.3390/s22093492
8. Gondal IA. Hydrogen integration in power-to-gas networks. Int J Hydrog Energ (2019) 44:1803–15. doi:10.1016/j.ijhydene.2018.11.164
9. Gao Y, Dai L-K, Zhu H-D, Chen Y-L, Zhou L. Quantitative analysis of main components of natural gas based on Raman spectroscopy. Chin J Anal Chem (2019) 47:67–76. doi:10.1016/s1872-2040(18)61135-1
10. Wu WJ, Ranasinghe JC, Chatterjee A, Huang SX. Recent advances on Raman spectroscopy of graphene: towards biosensing applications. Mater Chem Phys (2024) 318:129281. doi:10.1016/j.matchemphys.2024.129281
11. Jin SH, Kim GS. Simultaneous measurements of burning velocity and temperature distribution of combustion using UV laser Rayleigh scattering. Measurement (2021) 169:108505. doi:10.1016/j.measurement.2020.108505
12. Wu ZJ, Wang S, Shao J, Wang K, Zhang Z, Tao M, et al. Study of Raman scattering enhancement method based on optical multiplexing for online detection of gas components in strong-impact environments. Opt Express (2023) 5:31. doi:10.1364/OE.485144
13. Efremov EV, Ariese F, Gooijer C. Achievements in resonance Raman spectroscopy: review of a technique with a distinct analytical chemistry potential. Analytica Chim Acta (2008) 606:119–34. doi:10.1016/j.aca.2007.11.006
14. Kerekes A, Veres M, Himics L, Tóth S, Czitrovszky A, Oszetzky D, et al. Determination of the deposited amount of inhalation drugs in realistic human airways by Raman and infrared spectroscopy. Measurement (2017) 104:237–42. doi:10.1016/j.measurement.2017.03.029
15. Zhu WK, Yuan MF, Axt C, Li X, Maßmeyer A, Sun R. Structural evolution of solid-fuel combustion using laser-induced breakdown spectroscopy and Raman spectroscopy. Combustion and Flame (2024) 263:113399. doi:10.1016/j.combustflame.2024.113399
16. Liu S, He R. Decision-level fusion detection method of hydrogen leakage in hydrogen supply system of fuel cell truck. Fuel (2024) 367:131455. doi:10.1016/j.fuel.2024.131455
17. Zheng S, Cai WG, Sui r., Luo Z, Lu Q. In-situ measurements of temperature and emissivity during MSW combustion using spectral analysis and multispectral imaging processing. Fuel (2022) 323:124328. doi:10.1016/j.fuel.2022.124328
18. Gubarev FA, Chulkov AO, Mostovshchikov AV. Laser tracking system for real-time monitoring the combustion of energetic nanomaterials. Opt Lasers Technology (2024) 175:110835. doi:10.1016/j.optlastec.2024.110835
19. Tang H, Yang CB, Wang GQ, Guiberti TF, Magnotti G. Raman spectroscopy for quantitative measurements of temperature and major species in high-pressure non-premixed NH3/H2/N2 counterflow flames. Combustion and Flame (2022) 237:111840. doi:10.1016/j.combustflame.2021.111840
20. Zhang W, Jiang GS, Sun JH, Liu YC. Measurement the 3D temperature distribution in the combustion zone using acoustic tomography and nolinear wavefont tracing. Measurement (2024) 229:114439. doi:10.1016/j.measurement.2024.114439
21. Hanson RK. Applications of quantitative laser sensors to kinetics, propulsion and practical energy systems. Proc Combustion Inst (2011) 33:1–40. doi:10.1016/j.proci.2010.09.007
22. Okojie RS, Danehy PM, Watkins AN. An over-view of NASA hypersonic experimental diagnostic and instrumentation. Tech Ground Flight Test AIAA (2009) 7279. doi:10.2514/6.2009-7279
23. Depciuch J, Czarny W, Plonka A, Podgórski R, Bajorek W, Dziadek B, et al. Investigation of novel methods for stress level measurements in athletes employing FTIR and Raman spectroscopy techniques. Measurement (2023) 220:113316. doi:10.1016/j.measurement.2023.113316
24. Weber A. Raman spectroscopy of gases and liquids. Top Curr Phys (1979) 123. doi:10.1007/978-3-642-81279-8
25. Eckbreth AC. Laser diagnostics for combustion temperature and species. Gordon and Breach (1987) 281. doi:10.1201/9781003077251
26. Nemets VM, Petrov AA, Solov'ev AA. Application of Raman scattering spectroscopy in analysis in organic gases. Trans Zhurnal Prikladnoi Spektroskopii (1987) 47:536. doi:10.1007/BF00667685
27. Koch A, Chryssostomou A, Andresen P, Bornscheuer W. Multi-species detection in spray flames with tunable excimer lasers. Appl Phys B (1993) 56:165–76. doi:10.1007/bf00332196
28. Wehrmeyer A, Cheng TS, Pitz RW. Raman scattering measurements in flames using a tunable KrF laser. Appl Opt (1992) 31:1495. doi:10.1364/ao.31.001495
29. Burrows MD, Bormann F, Andresen P. Tunable, sub-nanosecond KrF-Raman laser in the ultraviolet. Appl.Phys B (1995) 61:451–60. doi:10.1007/bf01081273
30. Parr T, Hanson-Parr D, Smooke M, Yetter R, Tanoff M. Spontaneous Raman spectroscopy applied to propellant flames. LosAngeles, USA: AIAA (1999) p. 2360. doi:10.2514/6.1999-2360
31. Dreyer C, Parker T, Linne MA. Raman scattering at 532 and 355 nm in atmospheric pressure propane/air Flames,with and without liquid fuels. Appl Phys B (2004) 79:121–30. doi:10.1007/s00340-004-1509-3
32. Egermann J, Seeger T, Leipertz A. Application of 266nm and 355nm Nd:YAG laser radiation for the investigation of fuel-rich sooting hydrocarbon flames by Raman scattering. Appl Opt (2004) 43:5564. doi:10.1364/ao.43.005564
33. Tang H, Yang C, Wang G, Guiberti TF, Magnotti G. Raman spectroscopy for quantitative measurements of temperature and major species in high-pressure non-premixed NH3/H2/N2 counter flow flames. Combust Flame (2022) 237:111840. doi:10.1016/j.combustflame.2021.111840
34. Wu ZJ, Zhang ZR, Ye JF, Shao J, Tao MM, Wang S, et al. Study on time-resolution measurement of gas components under strong impact vibration. Proc SPIE Sixth Int Symp Laser Interaction Matter (2022):12459. doi:10.1117/12.2639977d
35. Dunn MJ, Macfarlane A, Barlow RS, Geyer D, Dieter K, Masri AR. Spontaneous Raman–LIF–CO–OH measurements of species concentration in turbulent spray flames. Proc Combust Inst (2021) 38:1779–86. doi:10.1016/j.proci.2020.07.037
36. Petrov DV. Comment on hydrogen and C2–C6 alkane sensing in complex fuel gas mixtures with fiber-enhanced Raman spectroscopy. Anal Chem (2021) 93:16282–4. doi:10.1021/acs.analchem.1c03358
37. Petrov DV, Matrosov II, Zaripov AR, Maznoy AS. Application of Raman spectroscopy for determination of syngas composition. Appl Spectrosc (2020) 74:948–53. doi:10.1177/0003702820917222
38. Niklas C, Wackerbarth H, Ctistis G. A short review of cavity-enhanced Raman spectroscopy for gas analysis. Sensors(Basel) (2021) 21:1698. doi:10.3390/s21051698
39. Velez GJ, Muller A. Trace gas sensing using diode-pumped collinearly detected spontaneous Raman scattering enhanced by a multipass cell. Opt Lett (2020) 45:133. doi:10.1364/ol.45.000133
40. Yang DW, Guo JJ, Liu QS, Zhao L, Yan JW, Zheng RE. Highly sensitive Raman system for dissolved gas analysis in water. Appl Opt (2016) 55:7744. doi:10.1364/ao.55.007744
41. Yang DW, Liu QS, Guo JJ, Wu LL, Kong A. Cavity enhanced multi-channels gases Raman spectrometer. Sensors (2021) 21:3803. doi:10.3390/s21113803
42. Petrov DV, Matrosov II, Kostenko MA. Multipass Raman gas analyzer for monitoring of atmospheric air composition. Opt Laser Technol (2022) 152:108155. doi:10.1016/j.optlastec.2022.108155
43. Liu JR, Hu ZY. Applications of measurement techniques based on lasers in combustion flow field diagnostics. Chin Opt (2018) 11:531–49. doi:10.3788/co.20181104.0531
44. Wedr L, Meier W, Kutne P. Single-pulse 1D laser Raman scattering applied in a gas turbine model at elevated pressure. Proceeding Combustion Inst (2007) 2:31. doi:10.1016/j.proci.2006.07.148
45. Dieter K, Koschnick K, Lill J, Magnotti G, Weinmann A, Dreizler A, et al. Development of a Raman spectrometer for the characterization of gaseous hydrocarbons at high temperatures. J Quantitative Spectrosc Radiative Transfer (2022) 277:107978. doi:10.1016/j.jqsrt.2021.107978
46. Chen S, Lin B, Shen L, Cai J, Xu W, You Y. Diagnostic in a reverse-flow aeroengine model combustor under elevated inlet pressure and temperature using spontaneous Raman. Appl Phys B (2022) 128:48. doi:10.1007/s00340-022-07775-1
47. Liu JR, Hu ZY, Ye JF, Zhang ZR, Wang S, Li GH, et al. Development of laser-based quantitative diagnostic techniques for turbulent combustion flow field of jet-engines. J Propulsion Technology (2022) 43:3. doi:10.11729/syltlx20170135
48. Zhang ZZ, Li GH, Ye JF, Wang S, Hu ZY. The effect of light source parameters on spontaneous Raman scattering. Proc Sixteenth Natl Conf Shock Waves Shock Tubes (2014) 369–74.
49. David S, Nattias R, Mark L. Visualization of acceleration in multiphase fluid interaction. Opt Lett (2016) 41:7. doi:10.1364/OL.41.001404
Keywords: Raman spectroscopy, SRS, jet engine, combustion diagnostics, sensor
Citation: Wang K, Zhang Z, Wang S, Wang Y, Liu Y, Wu H, Shao J, Ye J and Cai J (2025) A compact and stable diagnostic system for major species concentration and temperature in the combustion flow field by Raman scattering. Front. Phys. 13:1526350. doi: 10.3389/fphy.2025.1526350
Received: 11 November 2024; Accepted: 06 January 2025;
Published: 04 February 2025.
Edited by:
Rumao Tao, China Academy of Engineering Physics, ChinaReviewed by:
Zhengbo Qin, Anhui Normal University, ChinaCopyright © 2025 Wang, Zhang, Wang, Wang, Liu, Wu, Shao, Ye and Cai. This is an open-access article distributed under the terms of the Creative Commons Attribution License (CC BY). The use, distribution or reproduction in other forums is permitted, provided the original author(s) and the copyright owner(s) are credited and that the original publication in this journal is cited, in accordance with accepted academic practice. No use, distribution or reproduction is permitted which does not comply with these terms.
*Correspondence: Zhenrong Zhang, emhhbmd6aGVucm9uZ0BuaW50LmFjLmNu
Disclaimer: All claims expressed in this article are solely those of the authors and do not necessarily represent those of their affiliated organizations, or those of the publisher, the editors and the reviewers. Any product that may be evaluated in this article or claim that may be made by its manufacturer is not guaranteed or endorsed by the publisher.
Research integrity at Frontiers
Learn more about the work of our research integrity team to safeguard the quality of each article we publish.