- 1School of Optoelectronic Engineering, Xi’an Technological University, Xi’an, China
- 2State Key Laboratory of Transient Chemical Effects and Control, Shaanxi Applied Physics and Chemistry Research Institute, Xi’an, China
The motion trajectory of the flyer plays a crucial role in evaluating the shock detonation performance in detonator experiments. We used a multi-point Photon Doppler Velocimetry device to measure the flyer’s motion trajectory. When the flyer’s free surface deforms, the optical axis forms an instantaneous angle with the normal velocity at the reflected spot, causing the spot to undergo a moving displacement. The average velocity of this displacement has components both along and perpendicular to the optical axis. The velocity component perpendicular to the optical axis does not affect the beat frequency of the reflected spot along the beam path. However, the optical phase difference changes with the displacement on the surface, representing the instantaneous average velocity of the normal displacement. The tilt angle can be obtained by combining the velocity vector along the beam path with the normal velocity vector. The normal displacement and tilt angle from the detection point, along with the detection azimuth of each laser probe, are used to calculate the multi-point three-dimensional coordinates of the flyer as it changes in space over time. The coordinates affected by noise are corrected using Kalman filtering, and curved surfaces are drawn to obtain the motion trajectory as it changes with time. Based on the flyer’s deformation characteristics and the limitations of the Doppler shift, we analyze and model the signal data obtained from the detonator explosion experiment. This algorithm provides theoretical support for evaluating the shock detonation performance of different micro-charged columns by studying the explosively driven flyer.
1 Introduction
The detonator, as the most representative example of the new high-security detonation class of pyrotechnics, plays a crucial role in detonation dynamics. With the evolution of detonator charges towards passivation and quantification of micro-charges, the motion trajectory of the flyer has become increasingly important for both research and practical applications [1]. However, due to its small size (typically on the millimeter scale) and high-speed, instantaneous nature, conventional measurement methods struggle to accurately capture the flyer’s dynamic parameters [2]. Current studies on flyer shapes mainly rely on numerical simulations [3], which cannot directly measure dynamic changes. Photon Doppler Velocimetry (PDV), however, offers great potential for these studies, providing accurate, non-contact measurements of velocity, displacement, and acceleration on moving surfaces. PDV is particularly well-suited for high-speed temporal analysis and visualization of velocity fields in transient conditions like blasting [4] and other high-speed measurement scenarios [5].
PDV is sensitive to the surface reflectivity characteristics and motion state of the target, and it is necessary to select an appropriate measurement method that considers the specific measurement requirements and environmental conditions. A measurable Doppler shift is generated only when the velocity of the target changes along the optical axis [6]. The measured velocity of the Doppler shift is the projection of the actual velocity onto the incoming and outgoing direction vectors of the optical path. The integral of the measured velocity will only accurately reflect the change in distance if the normal velocity at the reflected spot is exactly parallel to the optical axis [7]. In explosively-driven flyer experiments, the surface shape of the flyer constantly changes, and this change of direction is not entirely parallel to the optical axis [8], causing the reflected spot to undergo displacement on the flyer’s surface. The average velocity of this displacement includes components along and perpendicular to the optical axis, with the perpendicular component not affecting the measurable Doppler shift. However, the time-dependent phase of the Doppler signal contains the optical phase difference generated by the displacement of the reflected spot on the flyer’s surface [9]. Angular information can be obtained from the time-dependent phase of the Doppler signal according to the deformation characteristics of the flyer and the limitation that the Doppler shift only measures the motion of the portion arising from the velocity component along the beam. This angle information represents the bending degree of the flyer’s surface during flight.
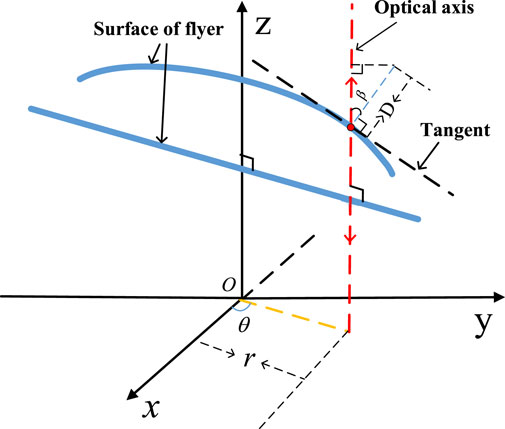
A multi-point PDV device can synchronously detect the surface of the flyer. As shown in Figure 1, the three-dimensional motion trajectory of the detection point can be calculated based on the detection azimuth θ and detection radius r of the probe, the surface tilt angle β of the flyer, and the normal displacement D. The flyer’s surface is fitted based on motion trajectories detected by the multi-point. This method provides a valuable reference for evaluating the impact initiation performance of different micro-charged columns by analyzing the explosively driven flyer. It also contributes to a better understanding of the motion characteristics of the flyer during explosion dynamics.
2 Motion trajectory measurement based on multi-point PDV device
2.1 Based on the beat frequency and phase PDV measurement principle
The measured velocity of the PDV is the projection of the actual velocity onto the incoming
Where
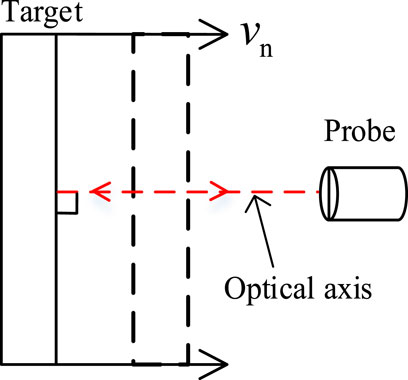
As shown in Figure 2, when the angle between the normal velocity
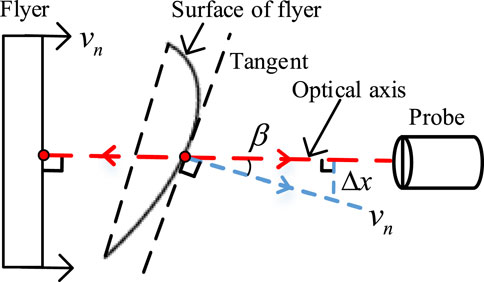
As shown in Figure 3, due to the deformation of the surface of the flyer, there is an instantaneous angle
Therefore, in the presence of an instantaneous angle
The measurable Doppler shift of the interference signal is proportional to the velocity of the detection point along the beam path, and the phase is proportional to the displacement. The time-frequency analysis method is used to obtain the beat frequency curve over time and then solve for the velocity, which is the velocity analysis mode. The phase is solved directly by analyzing the interference signal, and the displacement is calculated and then differentiated to obtain the velocity, which is the displacement analysis mode.
In the current PDV literature, the effect of signal phase changes due to the motion displacement of reflected spots on target surfaces is seldom discussed. However, in our study, when the detection target is a dynamic surface, the displacement of the reflected spot alters the optical phase difference. The displacement solved by the optical phase difference in this paper does not refer to the forward movement of the flyer along the optical axis, but rather to the vector sum of the reflected spot’s displacement both along and perpendicular to the optical axis. The direction of the displacement vector sum follows the normal of the reflected spot. Therefore, the normal velocity in this paper explicitly refers to the instantaneous average velocity of this displacement.
Furthermore, due to the displacement component of the reflected spot on the flyer’s surface perpendicular to the optical axis, we address the limitations of measurable Doppler shifts by relating the velocity obtained from beat frequency and phase to angular information. This aspect of our work represents a significant departure from existing studies, which have not fully considered these displacement components in their models.
2.2 Principle of measuring the trajectory of the flyer
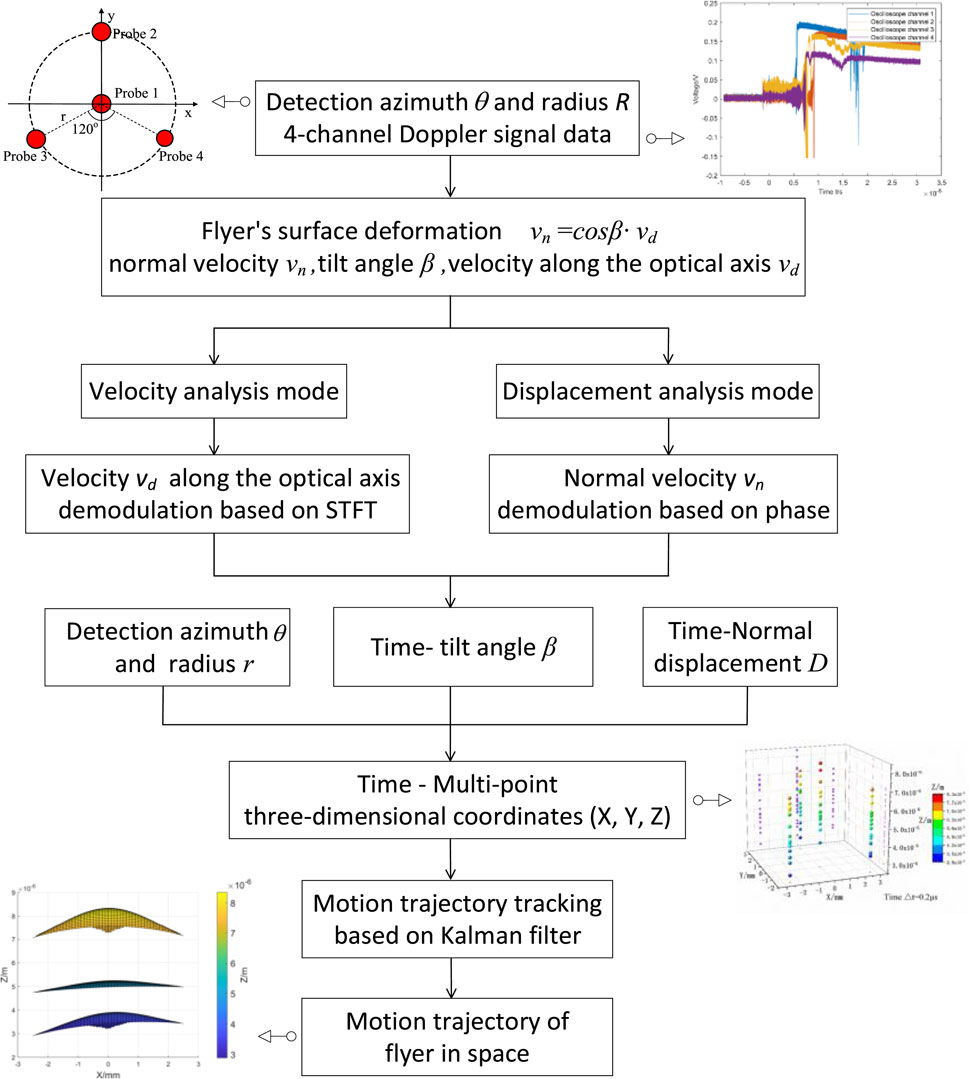
As shown in Figure 4, the multi-point 3D coordinates of the flyer in space, which change with time, can be calculated based on parameters such as detection radius, normal displacement, detection azimuth, and tilt angle using the PDV device.
First, the detection azimuths
Using the data collected by the four probes, a mathematical model is applied to calculate the time-varying 3D coordinates (X, Y, Z) of multiple points on the flyer surface, thereby obtaining the time-varying multi-point 3D positions of the flyer. Finally, Kalman filtering is employed to correct the coordinates affected by noise, and the corrected multi-point 3D coordinates are plotted into a surface to provide a complete representation of the flyer’s motion trajectory over time.
2.2.1 Velocity along the optical axis demodulation based on STFT
The photon Doppler signal after the short-time Fourier transform (STFT) [13], in the absence of high-frequency noise interference, exhibits a single peak spectrum in each window function spectrum. The beat frequency curve of the Doppler signal is obtained by extracting the maximum amplitude spectrum frequency from each window spectrum. Equation 2 is then used to demodulate the velocity
2.2.2 Normal velocity demodulation based on phase
The photon Doppler interference signal [6] can be written as
Among them,
in which
The Fourier transform of
The spectrum is divided into three parts, where
The phase distribution between -π∼π can be obtained by taking its imaginary part, as shown in Equation 10.
By unwrapping
Among them,
Since the digital differentiator is very sensitive to noise, to reduce the effect of noise in practical applications, the displacement can be processed by piecewise averaging first, followed by the differential operation. Digital low-pass differentiators are typically required to have a simple, low-order structure and enable fast differentiation [17]. Based on the analysis of minimum squared error, optimum cut-off frequency, noise amplification factors, and signal-to-noise ratio for digital differentiators in Ref. [18], we selected the Smooth-I DD digital differentiator. Smooth-I DD consists of a moving average filter of length 2M1+1 and a simple digital differentiator of length 2M2+ 1, where M2 = [M/2], M1 = M - M2, and [·] denotes the operator that rounds the nearest integer. When the length of Smooth-I DD is 2M + 1, it is represented as shown in Equation 13.
2.2.3 Motion trajectory tracking based on the Kalman filter
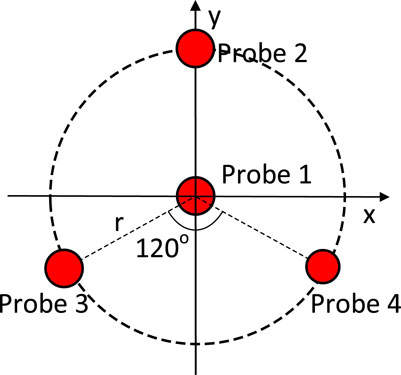
The detection distance and angle between the probes are shown in Figure 5. Probe one is located at the coordinate origin, probes 2, 3, and four are each at a distance r from the origin, and the angle between them is 120°.
Assume that the trajectory coordinates measured by probe 1, probe 2, probe 3, and probe four are (X1, Y1, Z1), (X2, Y2, Z2), (X3, Y3, Z3), and (X4, Y4, Z4), respectively. Then the multi-point 3D coordinate (X, Y, Z) matrix of the flyer motion trajectory is shown in Equation 14.
Among them, D is the normal displacement, and β is the angle between the optical axis and the normal direction of the detection point, also regarded as the tilt angle. The displacement and tilt angle determine the changes in the (Y, Z) coordinates of all detection points, and the X coordinate is completely determined by the orientation matrix P, as shown in Equation 15.
Affected by the vibration of the detection environment, noise and signals are collected together, and the coordinates of each detection point (Y, Z) inevitably produce errors. Therefore, the motion trajectory of the flyer is corrected based on Kalman filtering. The flyer is measured in polar coordinates, with the measurement parameters being the displacement D and the tilt angle β. When the tracking filter is performed directly in the polar coordinate system, even if the target undergoes the simplest uniform linear motion, its form becomes a complex nonlinear equation. Therefore, the Cartesian coordinate system is chosen as the tracking coordinate system to simplify the state equation. After appropriately linearizing the measurement equations, existing tracking filter algorithms can be applied [19]. A commonly used linearization method for measurement equations is the coordinate change method, which converts polar coordinate measurements into equivalent Cartesian coordinate measurements and converts the additive noise in polar coordinate measurements into equivalent additive noise in Cartesian coordinate measurements.
The flyer undergoes variable acceleration motion, with time units on the order of microseconds. The velocity at adjacent moments is close in the case of high-frequency resolution. The acceleration at moment k-1 can be used to estimate the velocity at moment k in the state equation, as shown in Equation 16.
Let the state vector
Among them, Ts is the interval between two adjacent moments, X represents the state, F is the state transition matrix, and
The measurement noises
The measurement matrix of the Jacobian H is shown in Equation 20.
When the measurement error in the polar coordinate system is relatively small, the approximate representation of equivalent measurement cross-covariance matrix in the Cartesian coordinate system is obtained through first-order differentiation, as shown in Equations 21, 22.
To summarize, the (Y, Z) coordinates of the four detecting points are corrected by Kalman filtering, and the orientation matrix P is added to obtain the multi-point 3D coordinates (X, Y, Z). The motion trajectory of the flyer over time is obtained by plotting a surface using multi-point 3D coordinates.
3 Experiment and data analysis
The multi-point PDV device was used to measure the motion trajectory of the flyer explosively driven by the detonator. The laser wavelength is 1550 nm, and there are four test channels with 25 mW per channel. The detector bandwidth is 10 GHz, the oscilloscope bandwidth is 12.5 GHz, and the acquisition frequency is 1011Hz. During the measurement process, it is necessary to monitor the reflected power collected by the probe. Higher reflected power helps improve the signal-to-noise ratio.
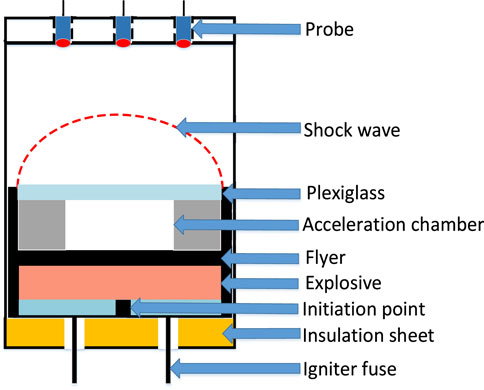
Figure 6 is a schematic sectional view of the detonator detonation experiment using an explosive foil to ignite a micro-charged detonator to generate a shock wave to drive the flyer. Under the action of detonation waves and detonation products, the flyer is sheared and moves at high speed through the acceleration chamber toward the fiber optic probe. It is important to design an appropriate probe fixture to ensure that the probe remains perfectly vertical during the measurement process. Using an optical fiber collimator can help reduce interference from scattered light. In the experiment, the diameter of the optical fiber probe is 1.8 mm, the working distance is 10 mm, and the spot size is 20 μm.
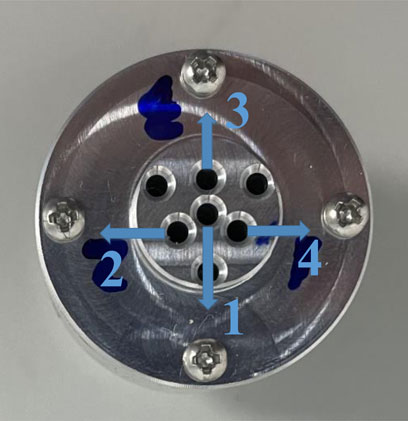
Figure 7 shows the physical configuration of the probe clamp, where 1, 2, 3, and four correspond to the oscilloscope channels connected to the laser probes for later signal processing. Probe one is positioned at the coordinate origin, while probes 2, 3, and four are located 3 mm away from the origin, spaced evenly at an angle of 120° from each other.
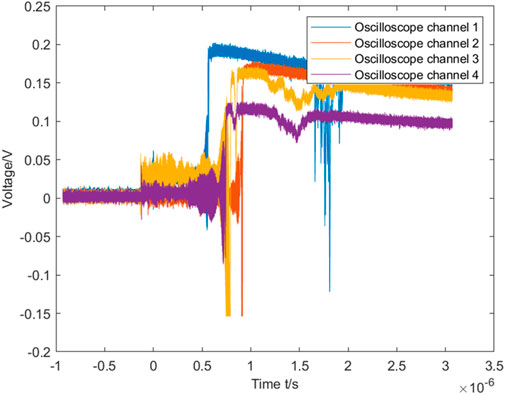
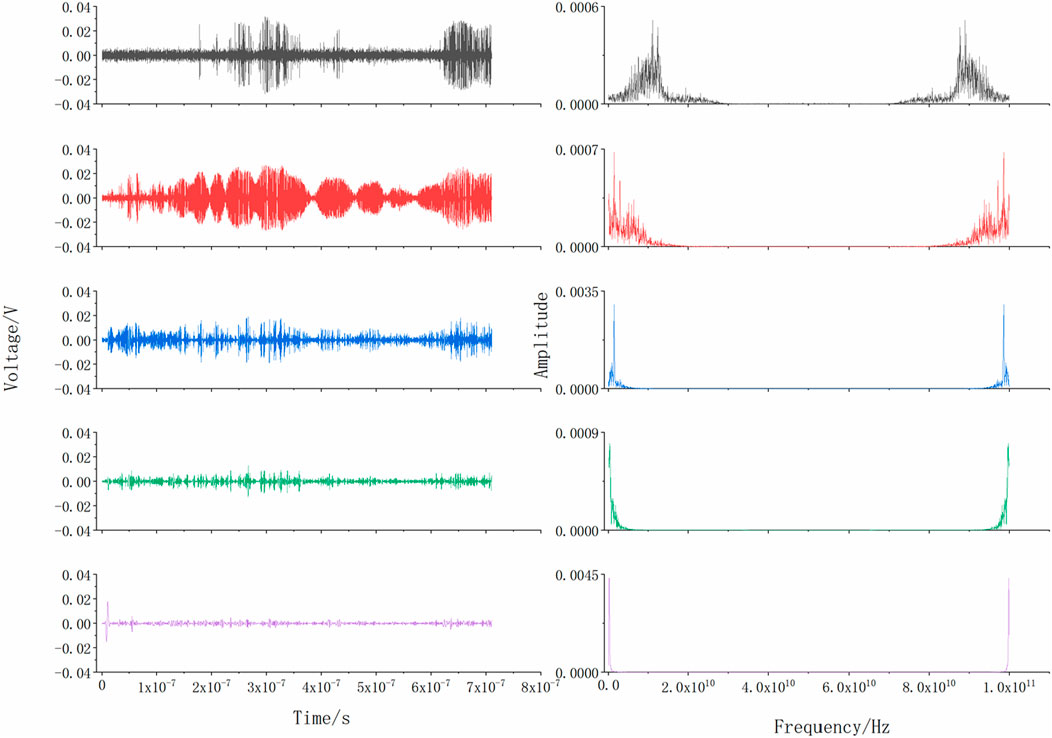
As shown in Figure 8, the photon Doppler signals of the explosively-driven flyer are collected by four oscilloscope channels, with the channel numbers corresponding to the probe positions indicated in Figure 7. The PDV signals can have their DC offset removed through preprocessing methods. First, the normal velocity of the photon Doppler signal is demodulated based on the phase. The signal processing steps are then illustrated in detail using the photon Doppler signal collected by oscilloscope channel 3 as an example. The spectrum of the collected Doppler signal often contains a large amount of high-frequency noise due to the vibration of the detection environment. After Fourier transforms the Doppler signal, the inverse Fourier transform is not applied to the entire spectrum in order to reduce the influence of noise. Instead, empirical mode decomposition (EMD) of the photon Doppler signal is performed first. The left column of Figure 9 shows the first five intrinsic mode functions (IMF) after the EMD, and the right column shows the corresponding spectrum of the IMF after the discrete Fourier transform (DFT). Since the beat frequencies are fully contained in the spectrum of the IMF2, only the spectrum of the IMF2 is further processed.
The amplitude of the Doppler signal changes periodically with time, with the maximum amplitude spectral frequency being the beat frequency. Since displacement differentiation in phase demodulation is highly sensitive to noise, the phase information of the non-beat frequency must be removed. Any amplitude less than
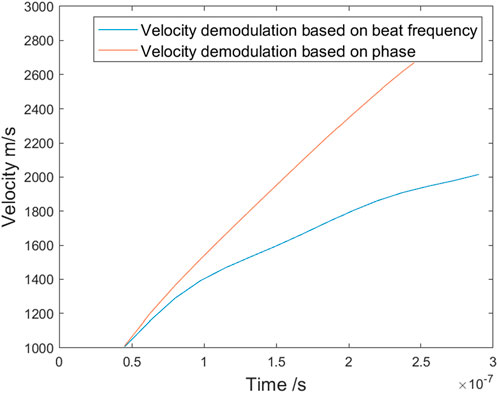
The instantaneous average velocity, representing the normal displacement of the reflected spot, is obtained by differentiating the displacement. The velocity component along the optical axis is then derived through velocity demodulation of the beat frequency. Since the time resolutions of the two velocity demodulation algorithms differ, it is necessary to unify the time axis before calculating the tilt angle by combining the two velocity vectors. The initial velocity growth trend is influenced by the algorithmic difference. Therefore, the velocity value from the phase demodulation, which is slightly larger than that from the beat frequency demodulation, is selected as the starting point. The velocity curves from both algorithms are fitted using polynomial regression, and the time axis is unified. The residual sum of squares (RSS) for the fits is one and 0.9996, respectively, confirming the reliability of the data. Figure 10 shows the velocity comparison between the two algorithms after unifying the time axis, and the angle is then calculated by combining the velocity components. The angle increases rapidly in the initial phase and then gradually levels off.
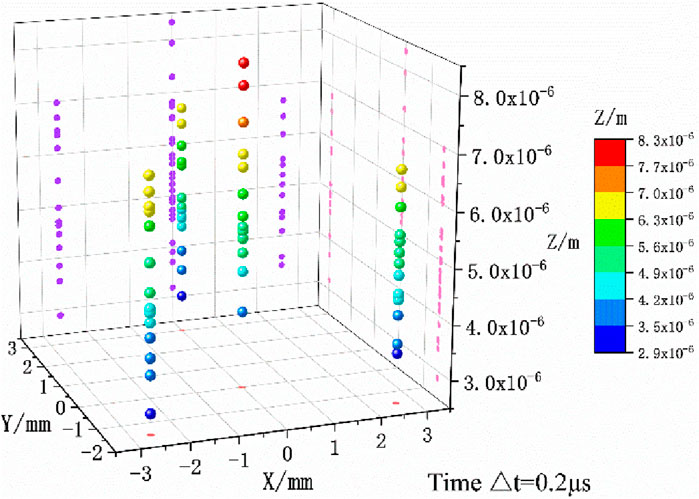
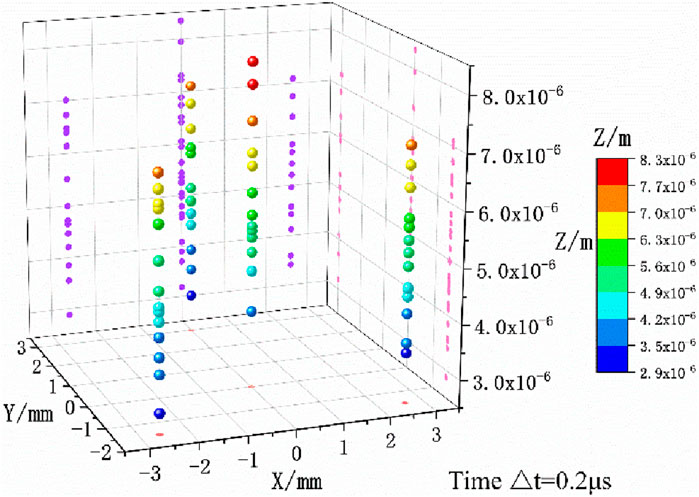
Finally, the corresponding instantaneous displacement value is found according to the velocity of phase demodulation. In summary, the normal displacement and tilt angle under the same time coordinate axis can be obtained by processing the photon Doppler signal from one of the detection points. A total of four sets of normal displacement and tilt angle information are obtained after applying the same data processing to the remaining three channels. The motion trajectory of the (Y, Z) coordinates of each channel can be calculated. The orientation matrix is calculated based on the distance and orientation between the four probes to determine the magnitude of the X-axis coordinate. As shown in Figure 11, the motion trajectory of the multi-point 3D coordinates (X, Y, Z) is obtained. The x-axis and y-axis are primarily determined by the detection positions of the probes, as shown in Figure 7, while the z-axis represents the displacement of the flyer as it moves toward and impacts the probe. The color bars represent displacement and share the same unit as the z-axis.
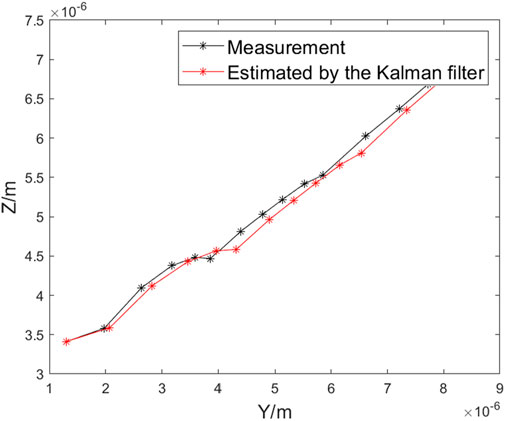
The measurement signal is inevitably affected by noise due to the vibration of the detection environment, resulting in errors in the solution of the (Y, Z) coordinates. Therefore, Kalman filtering is used to correct each measurement signal’s (Y, Z) coordinates. Kalman filtering may make measured values smoother and more stable, especially in high-noise environments. As shown in Figure 12, the Kalman filter performs optimal estimation based on the measured values, resulting in stable estimated values that align with the growth trend of the measured values.
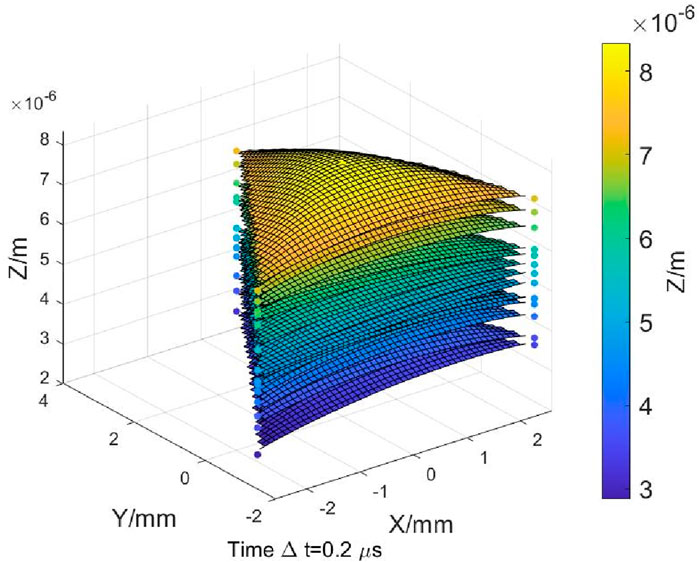
Figure 13 shows the motion trajectory of the corrected multi-point 3D coordinates. Compared with Figure 11, the transition of the corrected 3D coordinates on the same plane is clearer. Surface fitting can present better results.
As shown in Figure 14, curved surfaces are plotted to determine the flight attitude of the flyer based on the motion trajectory of multi-point 3D coordinates (X, Y, Z). The duration of the flyer’s entire motion trajectory change process is 0.2μs. A higher signal acquisition frequency results in higher time resolution, meaning more signal points are collected per unit of time, thus allowing for a more detailed capture of the flyer’s motion trajectory.
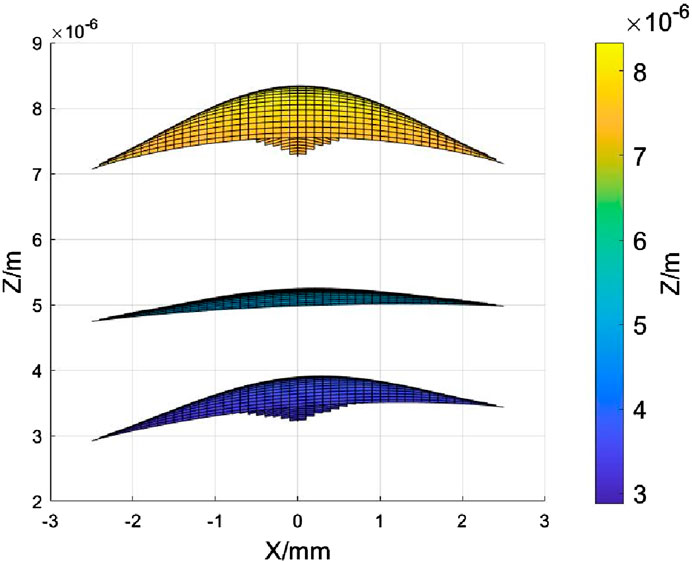
The motion trajectory process of an explosively-driven flyer by a detonator is as follows [3]. In the initial stage, the shock wave reaches the center of the flyer, accelerating it initially. As the flyer shears, some of the shock wave energy is consumed at the edges, causing a decrease in the driving force at the outer parts. This results in the edges lagging behind, exhibiting a hemispherical flight attitude. In the mid-stage, the shock wave impacts the side wall of the acceleration chamber and is reflected, reinforcing the driving force near the side wall. Most regions of the flyer accelerate to approximately the same velocity as the center, with only the edges having slightly lower velocities, resulting in a flattened attitude of the flyer. Finally, after undergoing multiple reflections and stabilizing, the shock wave continues to accelerate the flyer, making its flight attitude increasingly spherical.
Figure 15 illustrates the typical flight attitude of the flyer at different times, providing a clear observation of the trajectory transformation process. During the initial and final stages, the flight attitude exhibits a pronounced spherical shape under the shock wave’s impact. However, in the middle stage, the flight attitude appears relatively flat due to the reflection of the shock wave. The detonator’s impact detonation performance can be assessed by quantifying the degree of surface bending exhibited by the flyer. The flight attitude of the flyer is consistent with observations based on X-ray flash photography [2] and aligns with the shape obtained through numerical simulation of the detonator parameters [3].
The measurement errors of the motion trajectory can be analyzed from the following aspects. Firstly, the wavelength stability of the laser source is considered. The wavelength jitter range of the 1550 nm laser source is
To improve velocity measurement accuracy, lasers with narrow linewidth, stable frequencies, and stable output power should be selected, along with photodetectors that have high responsivity, short response time, and low noise-equivalent power. The oscilloscope’s bandwidth and sampling rate should be appropriately chosen based on the target’s velocity range, and signal processing algorithms should be optimized according to the characteristics of the signal. In experiments, optical fiber collimators with low insertion loss should be used to reduce the interference from scattered light. Additionally, adjusting the probe’s position to be perpendicular to the target surface or enhancing the reflectivity of the target surface can further improve the probe’s ability to collect reflected light power.
However, this motion trajectory measurement method still has certain limitations, primarily depending on the dynamic characteristics of the target surface. During the measurement process, the target surface needs to be in a dynamically changing state, with the change direction typically along the optical axis. Additionally, detection points on the dynamic surface will generate displacement components perpendicular to the optical axis. Targets driven by shock waves typically exhibit these characteristics. In the future, by combining with other advanced measurement technologies, it will be possible to compensate for the limitation of Doppler shift, which can only measure the velocity component along the beam direction, thus achieving higher precision displacement measurements and more comprehensive target trajectory analysis.
4 Conclusion
This paper utilizes a multi-point PDV device to measure the motion trajectory of an explosively driven flyer by a detonator. Initially, the detection orientation is determined based on the distance and angle between the probes, and then the photon Doppler signal of each detection point is obtained. The velocity of each detection point is calculated separately using both the classic velocity analysis mode and the displacement analysis mode. As the flyer’s surface deforms, an instantaneous angle is generated between the optical axis and the normal velocity of each detection point. The velocity obtained by the STFT represents the velocity along the optical axis, while the velocity obtained by the IDFT represents the instantaneous average velocity of the normal displacement of the detection point. The tilt angle can be derived by combining the velocity vector along the optical axis with the normal velocity vector. The multi-point 3D coordinates of the flyer, which change over time, are obtained from the normal displacement, azimuth, and tilt angle of each detection point. After correcting the motion trajectory using Kalman filtering to mitigate noise and errors, curved surfaces are plotted to visualize the motion trajectory. The reconstructed motion trajectory of the flyer accurately reflects the changes driven by the detonation, providing fundamental test data and theoretical support for evaluating the performance of micro-charged columns by analyzing the explosively driven flyer.
Data availability statement
The original contributions presented in the study are included in the article/supplementary material, further inquiries can be directed to the corresponding author.
Author contributions
YNS: Conceptualization, Methodology, Validation, Writing–original draft. SJW: Project administration, Supervision, Writing–review and editing. YKN: Writing review and editing, Data curation, Investigation. KXW: Writing review and editing, Formal Analysis, Resources.
Funding
The author(s) declare that financial support was received for the research, authorship, and/or publication of this article. This work was supported by State Key Laboratory of Transient Chemical Effects and Control, China (Grant No. WDYX23614260206).
Conflict of interest
The authors declare that the research was conducted in the absence of any commercial or financial relationships that could be construed as a potential conflict of interest.
Generative AI statement
The author(s) declare that no Generative AI was used in the creation of this manuscript.
Publisher’s note
All claims expressed in this article are solely those of the authors and do not necessarily represent those of their affiliated organizations, or those of the publisher, the editors and the reviewers. Any product that may be evaluated in this article, or claim that may be made by its manufacturer, is not guaranteed or endorsed by the publisher.
References
1. Yadav HS, Gupta NK. Flyer plate motion and its deformation during flight. Int J Impact Eng (1988) 7(1):71–83. doi:10.1016/0734-743x(88)90013-9
2. Willey TM, Champley K, Hodgin R, Lauderbach L, Bagge-Hansen M, May C, et al. X-ray imaging and 3D reconstruction of in-flight exploding foil initiator flyers. J Appl Phys (2016) 119(23):235901. doi:10.1063/1.4953681
3. Chen QC, Ma T, Li Y. Numerical simulation of velocity and shape of the flyer driven by HNS⁃Ⅳ explosive. Chin J Energetic Mater (2018) 26(10):814–9. doi:10.11943/CJEM2018054
4. Pachman JKM, Nemec O, Majzlik J. A comparison of methods for detonation pressure measurement. Shock Waves (2018) 28(2):217–25. doi:10.1007/s00193-017-0761-5
5. Pei H, Huang W, Zhang X, Zheng X. Measuring detonation wave profiles in plastic-bonded explosives using PDV. AIP Adv (2019) 9(1):015306. doi:10.1063/1.5057879
6. Dolan DH. What does “velocity” interferometry really measure? AIP Conf Proc (2009) 1195(1):589–94. doi:10.1063/1.3295207
7. Briggs ME, Moro EA, Shinas MA, McGrane S, Knierim D. Optical distance measurements to recover the material approach missed by optical velocimetry. J Phys Conf Ser (2014) 500:142005. doi:10.1088/1742-6596/500/14/142005
8. Lim S, Baldovi P. Observation of the velocity variation of an explosively-driven flat flyer depending on the flyer width. Appl Sci (2018) 9(1):97. doi:10.3390/app9010097
9. Rainey K, Gilbertson S, Kalb D, Beery T. Modulation based ranging for direct displacement measurements of a dynamic surface. Opt Express (2021) 29(14):21174–89. doi:10.1364/oe.422055
10. Dolan DH. Extreme measurements with photonic Doppler velocimetry (PDV). Rev Sci Instrum (2020) 91(5):051501. doi:10.1063/5.0004363
11. Chen GH, Wang DT, Liu J, Meng JH, Liu SX, Yang QG. A novel photonic Doppler velocimetry for transverse velocity measurement. Rev Sci Instrum (2013) 84(1):013101. doi:10.1063/1.4776186
12. Mallick DD, Zhao M, Bosworth BT, Schuster BE, Foster MA, Ramesh KT. A simple dual-beam time-multiplexed photon Doppler velocimeter for pressure-shear plate impact experiments. Exp Mech (2019) 59:41–9. doi:10.1007/s11340-018-0435-y
13. Dolan DH, Lemke RW, McBride RD, Martin MR, Harding E, Dalton DG, et al. Tracking an imploding cylinder with photonic Doppler velocimetry. Rev Sci Instrum (2013) 84(5):055102. doi:10.1063/1.4803074
14. Takeda M, Ina H, Kobayashi S. Fourier-transform method of fringe-pattern analysis for computer-based topography and interferometry. J Opt Soc Am (1982) 72(1):156–0. doi:10.1364/josa.72.000156
15. Liu JB, Ronney PD. Modified Fourier transform method for interferogram fringe pattern analysis. Appl Opt (1997) 36(25):6231–421. doi:10.1364/ao.36.006231
16. Karaaliog ̃lu C, Skarlatos Y. Fourier transform method for measurement of thin film thickness by speckle interferometry. Opt Eng (2003) 42(6):1694–8. doi:10.1117/1.1572498
17. Usui S, Amidror I. Digital low-pass differentiation for biological signal processing. IEEE Trans bio-medical Eng (1982) 29(10):686–93. doi:10.1109/tbme.1982.324861
18. Luo J, Bai J, He P, Ying K. Axial strain calculation using a low-pass digital differentiator in ultrasound elastography. IEEE Trans Ultrason Ferroelectrics, Frequency Control (2004) 51(9):1119–27. doi:10.1109/tuffc.2004.1334844
Keywords: micro-charged column, photon Doppler velocimetry, multi-point device, flyer velocity, motion trajectory
Citation: Sun YN, Wu SJ, Ni YK and Wang KX (2025) Motion trajectory measurement of explosively-driven flyer by detonator based on multi-point velocity testing. Front. Phys. 13:1523542. doi: 10.3389/fphy.2025.1523542
Received: 06 November 2024; Accepted: 04 March 2025;
Published: 31 March 2025.
Edited by:
Xinzhong Li, Henan University of Science and Technology, ChinaReviewed by:
Daisuke Ichihara, Nagoya University, JapanSatyendra Kumar Mishra, Centre Tecnologic De Telecomunicacions De Catalunya, Spain
Copyright © 2025 Sun, Wu, Ni and Wang. This is an open-access article distributed under the terms of the Creative Commons Attribution License (CC BY). The use, distribution or reproduction in other forums is permitted, provided the original author(s) and the copyright owner(s) are credited and that the original publication in this journal is cited, in accordance with accepted academic practice. No use, distribution or reproduction is permitted which does not comply with these terms.
*Correspondence: Shen-Jiang Wu, YnhhaXRAeGF0dS5lZHUuY24=
 Ya-Nan Sun
 Shen-Jiang Wu1*