 Chenxi Duan
 Jinping Ni*
 Hui Tian
94% of researchers rate our articles as excellent or good
Learn more about the work of our research integrity team to safeguard the quality of each article we publish.
Find out more
ORIGINAL RESEARCH article
Front. Phys., 13 March 2025
Sec. Optics and Photonics
Volume 13 - 2025 | https://doi.org/10.3389/fphy.2025.1517445
This article is part of the Research TopicNovel Optical Measurement and Imaging Technologies using Broadband Light SourcesView all 5 articles
Introduction: In measuring initial velocity, light screen detectors (LSD) are positioned closer to the muzzle. The light screen of the LSD can be affected by the muzzle blast wave (MBW), resulting in an inaccurate initial velocity.
Methods: A method for analyzing the effect of the MBW as it passes through the light screen is proposed in this article. First, based on the ray tracing method the refraction equation is established. The equation is to explain the transmission of rays from the light screen within the MBW media. Second, the equation is solved numerically using the fourth-order Runge-Kutta method. Then, the dynamical process of the MBW passing through the light screen is analyzed using the discretization method. Finally, the radiation flux on the photosensitive surface at the LSD receiver is analyzed quantitatively. The radiation flux for the MBW passing through the light screen located at different distances from the muzzle is analyzed in simulations and experiments.
Results: The mean absolute error between them and the theoretical calculation does not exceed 0.1.
Discussion: The results have been reasonably explained regarding the effect of the MBW as it passes through the light screen. This investigation not only helps the identification of the projectile signal in the light screen but also assists in identifying the MBW signal through independent measurements.
Damage assessment of small arms [1, 2] requires the measurement of the initial velocity and the ballistic dispersion. The dual-light-screens measurement system [3–6] consisted of two LSDs is commonly used for velocity measurements. The multi-light-screens array measurement system, composed of multiple LSDs, is generally used for dispersion measurements [7, 8]. Both velocity measurements in the dual-light-screen measurement system and dispersion measurements in the multi-light-screens array measurement system rely fundamentally on time extraction [9–11] as the projectile passes through the light screens. Additionally, the distances between the two light screens and the structural parameters [12–14] of the multi-light-screens array are measured in advance. The LSD is consisted of the light source of the transmitter and the photodetectors of the receiver [15], which constitute for the light screen regarding as a mathematical plane with no thickness. When flying projectiles pass through the light screen, they obstruct the light rays and cast shadows on the photodetectors. As a result, the radiation flux from the photosensitive surface decreases due to the shadow caused by the projectiles. The analog signal generated by the projectiles as they pass through the light screen, referred to as the projectile signal, is directly proportional [16] to the radiation flux detected by the shadowed photodetectors. The MBW passing through the light screen, the air density inside the light screen is affected by the MBW and the propagation of light screen rays are affected by it. The radiation flux from the photosensitive surface has also been decreased. The analog signal of the MBW passing through the light screens called the MBW signal. The output from the same LSD contains both a projectile signal and a MBW signal as the light screen detectors located near the muzzle. If a MBW signal is misidentified as a projectile signal, this will result in erroneous time results and incorrect results of the velocity. An investigation on the effect of the MBW on the light screen, as well as a characterization analysis of the MBW signal, is needed.
In sensing and measurement of external ballistic parameters, acoustic pressure sensors from the piezoelectric principle and other optical sensors are often used to sense the MBW. The MBW as a non-interference signal is detected by sensor arrays consisting of acoustic pressure sensors for the acoustic localization [17–19]. The acoustic pressure sensor arrays combined with a projectile shock wave signal can be used for measuring the ballistic dispersion [20–23]. The effect of a MBW on the density of air is an optical effect known as the optical effect of MBW, which is used for directly observing the MBW. The background-oriented schlieren (BOS), which is the method of observing and investigating the physical characteristics of the MBW [24–26], is able to capture the propagation process of the MBW in real time in order to obtain its structural and dynamic characteristics, and this is a qualitative observation method of the MBW. The quantitative analytical investigation of the MBW needs to be combined with other optical measurement techniques [27–29]. The interferometry is able to accurately detect the propagation process of the wavefront of the MBW in order to obtain its shape of the wavefront and the phase information. The deflection of a laser beam is measured by the displacement of the spot formed at the light receiver, and this is an optical measurements method for the refraction index of the MBW [30]. But, the waveform characteristics of the MBW generated as it passes through the laser beam are not reported. In light screen measurements, the anti-interference study of the muzzle flash [31, 32] and the tail flame of tracer rounds [33–36] are a technical reference for the anti-interference investigate of the MBW. The effect of MBW on the light screen is characterized through changes in the refractive index of the medium, similar to other techniques like BOS and interferometry. However, the key difference lies in the sensor used for this analysis, the LSD, which is entirely distinct from those used in previous studies. Additionally, the impact of shockwaves on the light screen remains unclear at present. We wanted to find an optical method to observe and explain the effect of the MBW on the light screen.
In this paper, we present a detailed analysis method of the process for the MBW passing through the light screen. The ray-tracing method is employed to establish the refraction equation for rays of the light screen, accounting for the refraction as the light passing through the MBW medium. The fourth-order Runge-Kutta method is selected for the numerical solution. A discretization method is proposed to analyze the dynamic process of the MBW passing through the light screen. The variation in radiative flux on the photosensitive surface of the LSD receiver is quantitatively calculated for each instance. Specifically, the variation in the radiative flux of the LSD receiver is simulated for the MBW passing through the light screen located at different distances from the muzzle. The MBW signals were collected through experiment and analyzed comparatively. The results demonstrate that the simulation and experiment are consistent with theoretical calculations. The findings of this paper provide a reasonable explanation for the process of the signal generated by the MBW as it passing through the light screen.
The paper is organized as follows. In Section 2 the theoretical model, analytical methods, and experiment setup used in this study are presented. Simulation and experimental results are reported in Section 3 and finally Section 4 provides some conclusive considerations.
Based on the characteristics of the MBW and the measurement model of the LSD, an analysis is conducted on the interaction of the MBW with the LSD. First, MBW alters the refractive index of the air medium within the LSD, causing the propagation of light rays to be deflected. The gradual decrease in the radiant flux on the photosensitive surface of the LSDs generates an analog signal in the backend optoelectronic conversion circuit. In the time domain, the change in radiant flux is approximated by the change in the analog signal waveform. Different peak pressures, positive pressure durations, and decay rates of the MBW lead to varying refractive indices of the medium, which in turn affect the deflection of light rays. The ray tracing method can effectively simulate the changes in the light transmission path of the LSD after the refractive index of the medium is affected by MBWs. Second, when simulating the interaction between light rays and complex media, the fourth-order Runge-Kutta method, as a fourth-order numerical solver, offers higher accuracy compared to the first-order Euler method, yielding more precise results [37–39]. In ray tracing, the fourth-order Runge-Kutta method exhibits good numerical stability, providing stable solutions. Moreover, it achieves an optimal balance between accuracy and computational complexity. Consequently, the ray refraction equations in the ray tracing method are solved using the fourth-order Runge-Kutta method [40]. Then a discretization method is employed to simulate the dynamic process of the muzzle blast wave passing through the light screen detector. A formula is provided to quantitatively describe the change in radiative flux at the receiver due to the refraction of the rays influenced by the MBW. The results are presented in Section 3 and Figure 1 gives a detailed illustration of our analysis.
Figure 1. Schematic of the method.
In the actual trajectory, a MBW is represented as a spherical shock wave traveling at a specified velocity and passing through the indoor trajectory as a longitudinal wave [41]. The far-field propagation law of its peak pressure from the muzzle position in the ballistic trajectory can be expressed as [42, 43], and as shown in Figure 2A.
where γ denotes the distance from the muzzle position in the ballistic trajectory; θM represents the angle between the direction of MBW propagation and the trajectory direction; aM (θM) indicates the attenuation rate of the MBW pressure; and Pm0 represents the initial pressure of the MBW.
At a certain distance, the attenuation of the MBW pressure gradually decreases [44]. Figure 2B displays the normalized MBW pressure curve at the OM as a function of time [45].
Figure 2. (A) Distance decay curve of MBW; (B) Time characteristic curve of MBW.
The distributions of the MBW pressure in Ta and Td [46–48] are, respectively expressed as
where the rate of pressure variation within Ta is denoted by a, P0 represents the environmental pressure, Pm represents the peak overpressure, and T+ represents the positive pressure duration of the MBW. The exponential decay rate is denoted by b.
The pressure variation of the MBW is nonlinear, displaying an “N”-shaped pattern. In an air medium, the density ρ is related to the temperature T and the pressure p via the ideal equation of state
where the Gladstone–Dale constant is denoted as K.
Thus, the relationship between refractive index and pressure can be expressed as [52, 53].
Linear changes in both pressure and refractive index are observed.
During Ta, the corresponding spatial distance is termed the rise distance Xa. During Td, the spatial distance is identified as the recovery distance Xd. The spatial length associated with T+ is referred to as the positive pressure duration distance X+.
Consequently, the gradient refractive index distribution within the spatial range corresponding to the MBW at a given moment is represented as
The rate of refractive index variation within Ta is denoted by α, which is also defined as the rate of pressure variation within Ta. The exponential decay rate is denoted by β.
Assuming the coordinate system for the spatial region of the MBW gradient refractive index is denoted as os - xsyszs, the starting position of the gradient refractive index distribution is at os in the upper right corner of the MBW spatial region. The coordinate origin is located at os. The farthest right end of the MBW gradient refractive index spatial region corresponds to the ys-axis. The xs-axis is positioned above the trajectory line at a distance of lD/2, parallel to the trajectory but oriented in the opposite direction. Rays originating from the uppermost region of the MBW spatial area enter the gradient refractive index space. Given the symmetrical distribution of MBWs on both sides of the trajectory, the distributions of the refractive indices na and nd in the upper half of the gradient are analyzed, as illustrated in Figure 3.
Figure 3. The temporal and spatial gradients of refractive index variation in the MBW.
A Light Screen Detector is a noncontact photoelectric detector that includes a transmitter and a receiver. The transmitter features an ideal line array parallel light source, whereas the receiver is equipped with a line array photoelectric detector. These components are arranged to create a virtual space with a defined thickness, known as the detection light screen. An amplification circuit for signal processing is also present at the rear end of the line array photoelectric detector.
The thickness of the light screen nls is considered to be equivalent to the width dD of the photoelectric detector. The intensity of the parallel light from the line array is constant, and the sensitivity across the photosensitive surface of the line array photoelectric detector is uniform and identical. The propagation of parallel light is restricted by the LSD structure. All parallel light from the transmitter is directed onto the photosensitive surface of the line array photoelectric detector at the receiver. Throughout the transmission of parallel light, the wavefront traverses a uniformly distributed air medium, maintaining its phase and amplitude. The radiation flux φ on the photosensitive surface is
where EL denotes the irradiance on the photosensitive surface of the photoelectric detector, SP indicates the area of this surface, lD refers to the length of the detection light screen, wD represents the width of the detection light screen, and dD is the width of the photosensitive surface of the photoelectric detector, as illustrated in Figure 4A.
Figure 4. (A) Schematic diagram of the structure of the LSD; (B) Schematic diagram of a projectile passing through the LSD; (C) Waveform of the signal of the projectile passing through the LSD.
In a rectangular detection light screen, if no flying projectile traverses it, the radiation flux at the receiver of the LSD is φ. When a flying projectile passes through the LSD, U represents the impact point of the projectile on the detection light screen, causing a portion of the parallel light from the transmitter to be obstructed by the projectile. Consequently, a variation in the radiation flux, Δφ, is observed at the receiver of the LSD.
where ΔS denotes the shadow area of the projectile on the photosensitive surface of the photoelectric detector, and wJQ represents the shadow width of the projectile on this surface, as depicted in Figure 4B.
In general, the amplitude of the output voltage signal of the LSD is linearly related to the variable radiation flux received at the receiver. The detection model of the LSD is assessed.
where V denotes the output voltage of the signal processing circuit, Δφ represents the radiation flux at the receiver of the LSD due to the parallel light from the transmitter being obstructed by the projectile, ε indicates the sensitivity of the LSD, γ0 represents the circuit amplification, R is the current-voltage conversion resistor, and U represents the threshold voltage.
The trajectory of the projectile is considered to follow a straight line, with no external factors influencing the projectile during the measurement of its passage through the LSD. The signal generated when the projectile passes through the LSD is illustrated in Figure 4C.
To accurately express the refraction impact of the detection light screen caused by muzzle blast, a quantitative analysis of the refraction results is necessary. The ray tracing method is employed for this refraction analysis. Among the numerical methods, the fourth-order Runge-Kutta method, which offers higher precision than the Euler method, is utilized for the numerical solution. The analysis results will be presented in Section 3.
A ray tracing technique is proposed to examine the signal sensing mechanism of muzzle blasts passing through a LSD. The scenario where the MBW fully enters the LSD is analyzed using the refracted optical path diagram from geometric optics. The ray traverses the MBW gradient refractive index medium from left to right, as shown in Figure 5. The main optical axis of the beam path within the MBW gradient refractive index medium aligns with the ys-axis. Rays emitted from the os are refracted within each small segment of the MBW gradient refractive index medium. The initial conditions are: the angle of incidence is θ0, the initial position is xs = 0, and the environmental refractive index is n0.
Figure 5. Schematic diagram of refraction of rays through the MBW gradient refractive index medium.
Only deflection in the xs direction is considered. According to Snell’s law, at the interface where refraction takes place within a small path segment
The length of an arc on a ray trajectory can be expressed as
By designing N0 = sinθ0, the above equation can be simplified.
The above equation represents the trajectory of light propagation.
The rays propagate through the gradient refractive index medium of the MBW, and the angle between the refracted rays and the optical axis is termed the deflection angle, dθ.
The width, Δd, of the radiation flux reduced on the photosensitive surface at the receiver corresponds to the distance of the ray deflected in the xs direction. This can be expressed as Δd = xs.
The LSD is affected by MBW, leading to the refraction of parallel rays. Consequently, the area of radiation flux on the photosensitive surface at the receiver is modified. The change in the radiation flux, Δφ′, observed on the photosensitive surface of the photoelectric detection sensor can be expressed as.
where ΔS' is the altered area of the radiation flux on the photosensitive surface and where Δd represents the width of the radiation flux reduced on the photosensitive surface.
The distributions of the gradient refractive indices within Xa and Xd of the MBW are expressed as na and nd, as shown in Equation 5.
In linear gradient refractive index media, na, deriving an analytical solution for ray trajectories is intricate and does not reveal detailed characteristics of light paths. Consequently, the fourth-order Runge–Kutta method, which offers superior accuracy compared to the Eulerian method, is utilized for trajectory analysis to obtain numerical solutions.
The conversion of dys to ys is achieved through numerical integration using the fourth-order Runge–Kutta method. This method involves a four-step piecewise approximation of differentials. By decreasing the step size and increasing the order, the error range can be better managed. Complex curves can be approximated within a specified step length. Consequently, under conditions of convergent computation, results that are relatively satisfactory can frequently be obtained.
In Figure 5, the initial state of the parallel light is
By choosing a specific step length h, the function values over the interval are subjected to iterative solving in a single step. The formula used for these calculations is as follows:
In a fragmentation projectile velocity test, the distance lw between LSD I and IV is 2.092 m, and the distance ln between LSD II and III is 1.902 m. LSD I is placed adjacent to LSD II. LSD III is placed adjacent to LSD IV. The distance s between the midpoint Q of LSD I and IV and the muzzle O is 3 m. The horizontal distance d between LSD I and O is 2 m. The vertical height difference h between O and the ground is 1.2 m. The experimental layout is depicted in Figure 6. LSD I and IV form the outer velocity measurement system, whereas LSD II and III constitute the inner velocity measurement system. The distinguishing feature of these dual systems is their ability to mutually validate and analyze velocity errors. The measurement environment is controlled indoors, with the temperature, humidity, and air pressure maintained at stable levels and free from wind interference. The LSDs used in the experiments have been calibrated and have previously demonstrated compliance with the velocity measurement error requirements in supersonic projectile velocity measurements. The difference charge of ammunitions are used to control the velocity of the transonic projectile.
Figure 6. Schematic diagram of the muzzle velocity measurement test.
The signals output by the LSD are transmitted by signal transmission cables to the signal acquisition and processing terminal. A visual analysis of the signals is subsequently performed. The muzzle velocity of the flying projectile is determined using software algorithms. Threshold values for triggering signals are established based on signal amplitudes, such as 1 V or 2 V. A negative delay time of 5000 sampling points before triggering is set in the signal’s time domain. During the experiment, various propellant loads are used to control the velocity of the flying projectile. The projectile is wrapped in sabots, which can be detected during measurements, and the sabot’s signal is distinguishable from that of the projectile for easy identification. Live-fire tests are considered to be high-consumption experiments; thus, excessive repetitions are avoided while aiming to elucidate physical laws.
Within Xa, three ray propagation trajectories are selected to illustrate light propagation conditions, designated as Ray1 (xs = 0 nm), Ray2 (xs = 4 nm), and Ray3 (xs = 9 nm). The refractive trajectories of these rays in Xa are illustrated in Figure 7A, obtained through a simulation using the fourth-order Runge-Kutta method.
Figure 7. (A) Refractive trajectories of rays in Xa; (B) Refractive trajectories of rays in Xd.
As illustrated in Figure 7A, the light propagation trajectory is predominantly characterized by straight-line movement. However, the deflection angles of different rays reveal more detailed features of light propagation, with the deflection of rays progressively decreasing as they travel.
Within Xd, three ray propagation paths are selected to demonstrate light transmission conditions, identified as Ray4 (xs = 0 nm), Ray5 (xs = 80,000 nm), and Ray6 (xs = 400,000 nm). The refractive trajectories of these rays in Xd are presented in Figure 7B, obtained through a simulation using the fourth-order Runge-Kutta method.
As illustrated in Figure 7B, the trajectory of light propagation is predominantly characterized by curve propagation. The deflection angle of rays reveals finer details of light propagation, with ray deflection initially increasing, then decreasing, and eventually stabilizing as they continue to propagate. Specifically, in Figure 7B, a characteristic line ys = 500 mm is parallel to the xs-axis. Ray4 begins deflection from the initial position xs = 0 mm, intersects the characteristic line at (0.88 mm, 500 mm), and its deflection reaches (1 mm, 561 mm). Ray5 begins deflection from xs = 0.08 mm, intersects the characteristic line at (1 mm, 500 mm), and its deflection reaches (1 mm, 500 mm). Ray6 starts deflection from xs = 0.40 mm and concludes its deflection at (1 mm, 341 mm).
In the gradient refractive index distribution within Xd of the MBW, the peak refractive index (nm), positive pressure duration distance X+, and exponential decay rate β directly influence the distribution of nd. A detailed analysis is required to understand how variations in these three parameters affect nd and their impact on the deflection of parallel rays. In the analysis, if one characteristic variable is altered, the other two are held constant.
The peak refractive coefficients are set at nm1 = 1.0005, nm2 = 1.0010, and nm3 = 1.0020. A simulation analysis is performed for Ray4 and Ray5, and the refractive trajectories of the rays are presented in Figure 8A.

Figure 8. (A) Refractive trajectories of rays under different nm; (B) Refractive trajectories of rays under different X+; (C) Refraction trajectories of Ray5 under different X+; (D) Refractive trajectories of rays under different β; (E) Refraction trajectories of Ray4 under different β; (F) Reflection trajectories of rays under different nd.
As shown in Figure 8A, with only variations in the peak refractive index (nm), the refractive trajectories of Ray41, Ray42, and Ray51 are nearly identical, as are those of Ray51, Ray52, and Ray53. The refraction of rays in the gradient refractive index medium of the MBW is minimally affected. Therefore, variations in the peak refractive index do not significantly impact ray refraction. The intersection of Ray5 with the characteristic line occurs at (1 mm, 500 mm). For rays with xs > 0.08 mm, the intersection points with the characteristic line are all greater than 1 mm. A significant factor preventing rays from reaching the photosensitive surface of the photodetector at the receiver of the LSD is that xs > 0.08 mm for the parallel light from the light source.
The positive pressure duration distance is set at X+1 = Xd/15, X+2 = Xd/5, and X+3 = Xd/25. A simulation analysis is conducted for Ray4 and Ray5. The refractive trajectories of the rays for different X+ values are illustrated in Figure 8B.
As shown in Figure 8B, variations in the positive pressure duration distance X+ significantly impact the refraction of Ray41, Ray42, Ray43, Ray51, Ray52, and Ray53 in the gradient refractive index medium of the MBW. Ray4 and Ray5 exhibit different behaviours. For the same X+, the deflections of Ray42 and Ray52, as well as those of Ray43 and Ray53, are nearly parallel. As X+ increases, the intersection points of Ray42 and Ray52 with the characteristic line shift to the right from their previous positions, with minimal effect on ray deflection. Conversely, as X+ decreases, the intersection points of Ray43 and Ray53 with the characteristic line shift to the left from their previous positions, with a more significant impact on ray deflection. Notably, the refractive trajectories of Ray41 and Ray51 align with those of Ray4 and Ray5 in Figure 7B.
Regardless of variations in X+, the intersection point of Ray4 with the characteristic line remains below 1 mm. However, Ray5 traverses the MBW gradient refractive index medium at X+ = Xd/15, with the intersection point of Ray5 with the characteristic line equaling 1 mm. As X+ increases, Ray5 experiences varying degrees of refraction, designated as Rayα–1, Rayα–2, and Rayα–3. All these intersection points with the characteristic line exceed 1 mm. Conversely, as X+ decreases, the refractions of Ray5, labeled as Rayα+1, Rayα+2, and Rayα+3, increase, with all intersection points with the characteristic line being less than 1 mm. The refraction trajectories are illustrated in Figure 8C.
The exponential decay rates are established as β1 = 0.6, β2 = 0.8, and β3 = 0.98. A simulation analysis is performed for Ray4 and Ray5; the refractive trajectories of these rays for various β values are depicted in Figure 8D.
As illustrated in Figure 8D, varying only the exponential decay rate β resulted in more pronounced effects on ray refraction, with Ray4 and Ray5 demonstrating the following observations: For the same β, the deflections of Ray41 and Ray51, as well as those of Ray43 and Ray53, are nearly parallel. When β increases, the intersection points of Ray43 and Ray53 with the characteristic line move leftward from their initial positions, though the ray deflections remain largely unchanged.
Conversely, a decrease in β causes the intersection points of Ray41 and Ray51 with the characteristic line to shift rightward from their previous positions, with a more significant impact on the ray deflections. Additionally, the refractive paths of Ray42 and Ray52 align with those of Ray4 and Ray5 depicted in Figure 7B.
When β0 = 0.506, the intersection point of Ray4β0 with the characteristic line is 1 mm. When β1 = 0.800 > 0.506, the intersection point of Ray4β1 with the characteristic line is less than 1 mm. When β2 = 0.400 < 0.506, the intersection point of Ray4β2 with the characteristic line is greater than 1 mm. A critical factor preventing rays from parallel light from entering the photosensitive surface of the photodetector at the LSD receiver is β < 0.506. The refraction trajectories described are illustrated in Figure 8E.
Based on the propagation characteristics of the MBW, the distribution nd corresponding to three features is assessed at varying propagation distances of the MBW. The refraction of rays resulting from parallel light passing through the MBW is analyzed.
The gradient refractive index nd, peak refractive index nm, positive pressure duration distance X+, and exponential decay rate β are assumed for the MBW at different propagation distances, as listed in Table 1.
Table 1. The characteristics of the gradient refractive index nd at different propagation distances of the muzzle blast.
Ray4 and Ray5 are selected from within Xd. The analysis of ray refraction is conducted across the gradient refractive index media nd1 ∼ nd4 at different MBW, propagation distances. Ray41 and Ray51 represent the refractions in nd1. Ray42 and Ray52 illustrate the refractions in nd2, Ray43 and Ray53 show the refractions in nd3, and Ray44 and Ray54 indicate the refractions in nd4. This is depicted in Figure 8F.
The intersections of the ray refraction trajectories depicted in Figure 8F with the characteristic line are presented in Table 2.
Table 2. Statistics of the xs coordinates of the intersection points of the rays and the characteristic line.
The discretization method is applied to analyze the process of the muzzle blast wave passing through the light screen detector. This analysis can be categorized into entering and leaving phases.
First, the right edge AB of the gradient refractive index medium of the MBW contacting the left edge
This procedure is designated as process 1, during which an MBW enters the LSD. The termination of process 1 is referred to as another initiation. The distance about denoted as Lsl = 0.89 mm marks this cessation. This subsequent phase is known as process 2, wherein the MBW re-enters the LSD. The end of process 2 is identified as a new beginning. This cycle continues until the MBW fully overlaps with the LSD, known as process 3, where the MBW again enters the LSD. The three phases of the MBW entering the LSD are illustrated in Figure 9, with a total duration of Ts.
Figure 9. (A) Process 1 of the MBW entering the LSD; (B) Process 2 of the MBW entering the LSD (C) Process 3 of the MBW entering the LSD.
Process 1 of the MBW entering the LSD is depicted in Figure 9A. The distance covered by the MBW within the LSD is Lsl = 0.08 mm. This instance is denoted as Te1. The parallel light from the LSD is refracted by the MBW, leading to a reduced width on the photosensitive surface at the receiver. This refraction results in an ineffective reception area, as illustrated. The remaining light reaches the photosensitive surface at the receiver, creating the effective reception area.
The length of the photosensitive surface at the receiver is WD = 330 mm. The area
Process 2 of the entering procedure is illustrated in Figure 9B. The distance covered by the MBW within the LSD is Lsl = 0.89 mm. This instance is denoted as Te2. The reduced width on the photosensitive surface at the receiver is Δd = 0.89 mm. The area
Process 3 of the entering procedure is depicted in Figure 9C. The distance traveled by the MBW within the LSD is Lsl = 1 mm. This instance is denoted as Te3. At this point, the MBW fully overlaps the LSD. The reduced width on the photosensitive surface at the receiver is Δd = 0.89 mm. The area
Initially, the contact of the right edge AB of the MBW gradient refractive index medium with the right edge of the LSD is referred to as the start. When the MBW exits the LSD, the distance is about Lsl = 1.22 mm, which denotes the cessation. This phase is identified as process 1, in which the MBW leaves the LSD. Additionally, the end of process 1 is termed another initiation. The distance about termed Lsl = 1.22 mm marks this cessation. This is represented by process 2, where the MBW continues to leave the LSD. The three phases of the MBW leaving the LSD are illustrated in Figure 10, with a total duration of Ts.
Figure 10. (A) Process 1 of the MBW leaving the LSD; (B) Process 2 of the MBW leaving the LSD.
Process 1 of the MBW leaving the LSD is illustrated in Figure 10A. The distance travelled by the MBW within the LSD is Lsl = 1.08 mm. This instance is denoted as To1. The part of the parallel light from the LSD is refracted by the MBW, resulting in a reduced width Δd = 0.92 mm on the photosensitive surface at the receiver. The area ΔS’o1 where the irradiance is reduced on the photosensitive surface, where
Process 2 of leaving is depicted in Figure 10B. The distance travelled by the MBW within the LSD is Lsl = 2 mm. This instance is denoted as To2. The reduced width on the photosensitive surface at the receiver is Δd = 0 mm. The area ΔS’o2 where the irradiance is reduced on the photosensitive surface, where
The process of MBW entering and exiting the LSD was analyzed using a discrete method. Sampling points selected of the method to fully represent the passage of MBW through the LSD. In future work, we will increase the number of LSDs to facilitate the collection of more MBW signals for analysis, thereby enhancing the precision of our proposed discretization analysis method.
The variation in the radiation flux Δφ′ on the photosensitive surface at the receiver of the photoelectric detection sensor varies with the distance Lsl at which the MBW enters the LSD. However, the area with decreased irradiance on the photosensitive surface has a more immediate effect:
and,
The variation in the radiation flux Δφ′ is linearly related to the width Δd of the reduced radiation flux on the photosensitive surface. Assuming EL = 1, the scatter data of Δφ′ for the five positional states and other instances of Lsl are fitted using a third-degree polynomial method, as shown in Figure 11.
Figure 11. Variation curve of the radiation flux sensing variation Δφ′ at the receiver terminal of the LSD.
As shown in Figure 11, during the MBW passing through the LSD, the variation of the radiation flux Δφ′ on the photosensitive surface at the receiver first increases and then decreases.
Based on the intersections listed in Table 2, the curve of the sensing variation in radiative flux is shown in Figure 12.
Figure 12. Variation curves of radiation flux sensing variation Δφ′ at the receiver terminal for MBWs of different propagation distances passing through the LSD.
A quantitative calculation is conducted for the variation in radiative flux at the light screen detector receiver. During the MBW passing through the LSD, the peak value of the variation in radiative flux Δφ′ on the photosensitive surface at the receiver decreases as the distance of MBW propagation increases. However, the overall trend of the radiative flux variation remains constant.
Based on the propagation characteristics of the MBW, at velocities below 340 m/s, the signals output by the LSD include not only the signal of the projectile passing through the LSD but also a mixed signal of the MBW passing through the LSD earlier. Additionally, following the signal of the projectile passing through the LSD, a sabot signal is present. Due to the large volume of the sabot, its signal peak reaches saturation. The LSD output signals collected during live-fire tests are shown in Figure 13.
Figure 13. Schematic diagram of the signals of the projectile and MBW passing through the LSD.
Due to the varying geometric parameters of the LSD, there is a discrepancy in the peak values of the signal from the projectile passing through the LSD and the signal from the MBW passing through the LSD. Consequently, a consistency transformation is applied to align the peak values of these two signals. The signal peak values of the MBW passing through the LSD II, III, and IV are standardized based on the signal from the projectile passing through the LSD I:
Where,
The signals from multiple firings were standardized on the basis of the waveform data from the live-fire experiments, as shown in Table 3.
Table 3. Signal peak consistency transformation result (V).
The measurement results (V) from the experiments, the variation in radiative flux results (Δφ') from the simulations, and the mentioned experimental results (P [38]) are all normalized. The normalized results are illustrated in Figure 14.
Figure 14. Normalized curves.
From Figure 14, it can be seen that the trends of the normalized results are similar. The experimental measurement results decay more rapidly, while the simulated variation in radiative flux decays more slowly. We have compared the consistency and the mean absolute error pairwise between Δφ′, V, and P [38], with the results shown in Table 4.
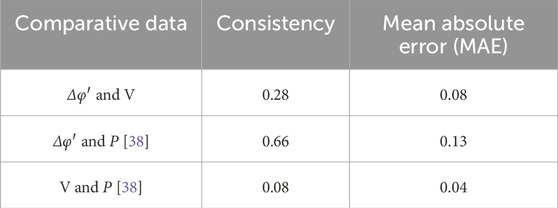
Table 4. Data comparison results.
The measurement data from the LSD show good consistency with previous research in the field, suggesting that the MBW measured by the LSD can reasonably characterize the signal features of MBW.
Based on Figure 14 and Table 4, we only focused on the trend of the curves and normalized the data to eliminate potential errors between data. The inconsistencies in the waveforms arise from several factors. The photosensitive surface at the receiving end of the LSDs detects the reduction in radiant flux, which results in Δφ'. Subsequently, the optoelectronic conversion circuitry converts the optical signal into a voltage signal. The transformation from Δφ′ to V is influenced by capacitors and other components within the circuit. The rapid traversal of MBW through the LSDs results in a signal duration shorter than the projectile signal. Signal acquisition must meet the frequency response requirements of the LSDs’ circuitry, which confers the LSDs with a low-pass filter effect. In the latter half of the curve, as P [38] decreases, the influence of MBW on the LSDs also diminishes. The differences between P [38] and V stem from the fact that these are two entirely distinct types of sensors, with differences in both sensing principles and internal conversion circuits.
On the other hand, in Figure 13 the duration of the muzzle blast wave signal is much shorter than that of the projectile signal. This is the crucial feature that distinguishes the two signals.
The experimental results we have obtained thus far meet the preliminary requirements for explaining the mechanism by how to analyze the interaction between MBW and LSD.
In this paper, we propose a discretisation method to analysis the effects of Muzzle blast wave on Light Screen Detector.
The results show that the trajectories and refraction angles of light propagation within Xd are notably greater compared to those within Xa. Consequently, the effect of the gradient refractive index na within the distance Xa on light propagation can be considered negligible. The positive pressure duration distance (X+) and the exponential decay rate (β) have a significant impact on the refraction of rays. However, the peak refractive index (nm) has a negligible effect on ray refraction. The shorter the propagation distance of the muzzle blast, the greater the impact on the rays at the light screen detector. Consequently, the variation in radiative flux on the photosensitive surface of the light screen detector receiver becomes larger. There is a difference between the simulated waveform and the experiment waveform. The reason is that there is a transfer function between the radiant flux and the LSD output waveform. In experiment, the duration of the muzzle blast wave signal is much shorter than that of the projectile signal. The mean absolute error of the decay curves from experimental and simulation results compared to the theoretical decay curve is within 0.1. This proves that our proposed method of analysis is feasible and effective.
There are some specific recommendations for minimizing the impact of MBW on velocity measurements: 1) Placement of LSDs: In velocity measurements, the location of the LSDs should avoid ranges with high MBW amplitudes. The signal waveforms of MBW and projectiles should be avoided from co-occurring in the channels of the LSDs. 2) Characteristics of MBW Signals: The duration of MBW signals is much shorter than that of projectile signals, with an amplitude ranging from 0.2 to 0.5 times that of the projectile signals. The duration of MBW signals decreases with increasing propagation distance, whereas the duration of projectile signals remains essentially constant. 3) Trigger Voltage of LSDs: The trigger voltage of the LSDs should be set higher than the amplitude of the MBW signals to prevent false triggering by MBW signals. 4) Signal Filtering Processing in LSDs: A filtering module targeting MBW signals should be incorporated into the backend processing circuitry of the LSDs to effectively remove MBW signals. This study has significant implications for excluding muzzle blast wave signals in muzzle velocity measurements and for calibrating the distance of the light screen detector deployment. In addition, this study offers a theoretical basis for understanding how muzzle blast wave from the muzzle may lead to erroneous measurements in external ballistics parameter measurement devices. And it enhances the accuracy of external ballistics measurements.
In future work, we will increase the number of LSDs positioned in velocity measurements to enhance the precision of the analysis results. Additionally, we will explore other analytical methods to assess the effect of MBW on LSDs. Furthermore, the discretisation method proposed in this paper can also be applied to analyse the impact of detached shock waves and shock wave as they pass through the light screen detector. In the fire dispersion measurement of near-sonic projectiles, the influence of MBW on LSDs still exists, which is also the direction we need to explore to improve the accuracy of fire dispersion measurement in the future.
The original contributions presented in the study are included in the article/supplementary material, further inquiries can be directed to the corresponding author.
CD: Writing–original draft, Writing–review and editing, Conceptualization, Formal Analysis, Methodology, Visualization, Data curation, Investigation, Resources, Software. JN: Conceptualization, Data curation, Funding acquisition, Methodology, Project administration, Resources, Supervision, Writing–review and editing. HT: Project administration, Supervision, Writing–review and editing. BH: Formal Analysis, Investigation, Supervision, Writing–review and editing. JL: Investigation, Project administration, Supervision, Writing–review and editing.
The author(s) declare that financial support was received for the research, authorship, and/or publication of this article. This work was supported by the National Natural Science Foundation of China (No. 61471289).
We would like to thank the First Research Institute of the Ministry of Public Security of PRC for providing the experimental site and conditions for this work. The authors would like to thank Guohui Wang, professor at School of Optoelectronic Engineering, Xi’an Technological University and Fan Wang, associate professor at School of Optoelectronic Engineering, Xi’an Technological University for them help and suggestions on this work.
The authors declare that the research was conducted in the absence of any commercial or financial relationships that could be construed as a potential conflict of interest.
The author(s) declare that no Generative AI was used in the creation of this manuscript.
All claims expressed in this article are solely those of the authors and do not necessarily represent those of their affiliated organizations, or those of the publisher, the editors and the reviewers. Any product that may be evaluated in this article, or claim that may be made by its manufacturer, is not guaranteed or endorsed by the publisher.
1. Li P, Zhang X. Numerical research on the imaging effect of sequential muzzle blast waves formed by successive shooting at high frequency. Propellants Explosives Pyrotechnics (2020) 45(9):1416–27. doi:10.1002/prep.202000043
2. Costa E, Lagasco F. Development of a 3D numerical methodology for fast prediction of gun blast induced loading. Shock Waves (2014) 24(3):257–65. doi:10.1007/s00193-013-0461-8
3. Musa E, Demirer M. Laser-based light barrier having a rectangular detection area. Opt Lasers Eng (2010) 48(4):435–40. doi:10.1016/j.optlaseng.2009.09.004
4. Geng D, Chen L, Hou Z, Zhang X, Wei X. The laser screen imaging measurement system based on arrayed fibers. Opt Lasers Eng (2024) 183:108551. doi:10.1016/j.optlaseng.2024.108551
5. Chu W, Zhao D, Liu B, Zhang B, Gui Z. Research on target deviation measurement of projectile based on shadow imaging method in laser screen velocity measuring system. Sensors (2020) 20(2):554. doi:10.3390/s20020554
6. Musayev E. Optoelectronic methods and devices for measuring bullet velocity. Meas Tech (2006) 49(3):270–5. doi:10.1007/s11018-006-0102-z
7. Li H, Zhang X. Flight parameter calculation method of multi-projectiles using temporal and spatial information constraint. Defence Technology (2023) 19:63–75. doi:10.1016/j.dt.2021.11.007
8. Li H, Zhang X. Three-dimensional coordinates test method with uncertain projectile proximity explosion position based on dynamic seven photoelectric detection screen. Defence Technology (2022) 18(9):1643–52. doi:10.1016/j.dt.2021.07.012
9. Chen R, Ni JP. Calibration method of light-screen plane equation of sky screen vertical target. Optik (2018) 155:276–84. doi:10.1016/j.ijleo.2017.11.008
10. Chen R, Ni JP, Liu J. Uncertainty analysis of coordinate measurement of six-light-screen array sky screen vertical target based on engineering model. Acta Armamentarii (2019) 40(3):612. doi:10.3969/j.issn.1000-1093.2019.03.021
11. Jiu Y, Dong T, Chen D, Ni J, Kai B. Measurement method for fragment velocity based on active screen array in static detonation test. Infrared Laser Eng (2020) 49(1):0113003. doi:10.3788/IRLA202049.0113003
12. Tian H, Ni JP. Integrated structure four-combined light curtain array measurement research. J Instrument Instrumentation (2014) 35(2):320–6. doi:10.19650/j.cnki.cjsi.2014.02.012
13. Hu J, Gao F, Ni JP. Engineering modeling and precision analysis of a six-light-curtain precision target based on plane equations. Acta Photonica Sinica (2020) 49(7):101–14. doi:10.3788/gzxb20204907.0712003
14. Gao F, Zeng X, Ni JP, An Y. Engineering model and measurement precision analysis of a four-light-curtain precision target. Acta Photonica Sinica (2015) 44(8):33–9. doi:10.3788/gzxb20154408.0812003
15. Li H, Zhang X, Zhang X, Gao J. Warhead fragments' distribution measurement method by a multiscreen sensors' intersection test mechanism and equivalent target damage probability calculation. IEEE Trans Instrumentation Meas (2021) 70:1–9. doi:10.1109/TIM.2021.3079557
16. Tian H, Wei X. Measuring method for detection sensitivity and response time of light screen target. Tool Eng (2017) 51(9):128–31. doi:10.16567/j.cnki.1000-7008.2017.09.032
17. Akman C, Sonmez T, Ozugur O, Basli A, Lebleicioglu M. Sensor fusion, sensitivity analysis and calibration in shooter localization systems. Sensors Actuators A: Phys (2018) 271:66–75. doi:10.1016/j.sna.2017.12.042
18. Abiri A, Parsayan A. The bullet shockwave-based real-time sniper sound source localization. IEEE Sensors J (2020) 20(13):7253–64. doi:10.1109/JSEN.2020.2978814
19. Damarla T, Kaplan LM, Whipps GT. Sniper localization using acoustic asynchronous sensors. IEEE Sensors J (2010) 10(9):1469–78. doi:10.1109/JSEN.2010.2045496
20. Lo KW, Ferguson BG. Localization of small arms fire using acoustic measurements of muzzle blast and/or ballistic shock wave arrivals. The J Acoust Soc America (2012) 132(5):2997–3017. doi:10.1121/1.4757737
21. Lo K. Flight parameter estimation using instantaneous frequency and time delay measurements from a three-element planar acoustic array. J Acoust Soc America (2016) 139(5):2386–98. doi:10.1121/1.4947424
22. Lo KW. Flight parameter estimation using instantaneous frequency and direction of arrival measurements from a single acoustic sensor node. J Acoust Soc America (2017) 141(3):1332–48. doi:10.1121/1.4976091
23. Lo KW. A ballistic model-based method for ranging small arms fire using a single acoustic sensor node. J Acoust Soc America (2019) 145(4):2409–17. doi:10.1121/1.5098772
24. Venkatakrishnan L, Suriyanarayanan P, Jagadeesh G. Density field visualization of a Micro-explosion using background-oriented schlieren. J Visualization (2013) 16:177–80. doi:10.1007/s12650-013-0164-3
25. Moumen A, Grossen J, Ndindabahizi I, Gallant J, Hendrick P. Visualization and analysis of muzzle flow fields using the Background-Oriented Schlieren technique. J Visualization (2020) 23:409–23. doi:10.1007/s12650-020-00639-w
26. Yadav K, Pandouria AK, Bhagoria P, Bharadwaj MR, Tiwari V. Investigation on the shock response of AA2014-T6 sheets. Int J Mech Sci (2023) 257:108528. doi:10.1016/j.ijmecsci.2023.108528
27. Moumen A, Stirbu B, Grossen J, Laboureur D, Gallant J, Hendrick P. Particle image velocimetry for velocity measurement of muzzle flow: detailed experimental study. Powder Technology (2022) 405:117509. doi:10.1016/j.powtec.2022.117509
28. Zheng X, Huang H, Mao Y, Zhang J, Zhou D. Research on image measurement of explosion shock wave based on high speed schlieren technology. Opt Precision Eng (2022) 30(18):2187–94. doi:10.37188/OPE.20223018.2187
29. Wang Z, Chang L, Huang X, Cai Z. Numerical simulation of protective effects of bulletproof composite structures under combined action of explosive shock wave and fragments. Explosion and Shock Waves (2023) 43(6):108–19. doi:10.11883/bzycj-2022-0515
30. Wang B, Chao H, Shao X, Heng G, Li B. Study on measuring method of refractive index of shock wave in muzzle. Acta Armamentarii (2013) 34(12):1598–3. doi:10.3969/j.issn.1000-1093.2013.12.014
31. Cai R, Ni JP, Tian H. Design and improvement of a light-interference-resistant light curtain target. Opt Tech (2006) 5:790–2. doi:10.3321/j.issn:1002-1582.2006.05.030
32. Tian H, Ni JP, Cai RL, Pang Q. Research on a digitized light screen target method resistant to light interference. J Xi’an Technol Univ (2007) 26(1):6–9. doi:10.3969/j.issn.1673-9965.2007.01.002
33. Moretti JD, Csernica CM, Poret JC, Shaw AP, Carlucci NE, Seiz MG, et al. Evaluation of a sustainable pyrotechnic tracer composition for small caliber ammunition. ACS Sustainable Chem and Eng (2017) 5(11):10657–61. doi:10.1021/acssuschemeng.7b02623
34. Pouretedal HR, Sattar S, Zare A. Improved luminosity of a new tracer pyrotechnic of Mg:BaO2:Ba(NO3)2:Viton using response surface methodology. J Therm Anal Calorim (2023) 148(12):5209–16. doi:10.1007/s10973-023-12070-y
35. Cai R, Ni J, Ma S, Chen X. Velocity measurement system of tracer based on laser screen. J ballistics (2011) 23(2):92–5.
36. Ma S, Ni J, Cai R. Velocity measurement algorithm of light tracers based on the light screens. J Xi’an Technol Univ (2010) 29(5):428–32. doi:10.3969/j.issn.1673-9965.2010.05.005
37. Feng D, Pan S, Wang W, Li H. Simulation and analysis of ray tracing in discretionary gradient refraction index medium. Computer Simulation (2010) 27(2):135–9. doi:10.3969/j.issn.1006-9348.2010.02.033
38. Huang Y, Shi GD, Zhu KY. Runge–Kutta ray tracing technique for solving radiative heat transfer in a two-dimensional graded-index medium. J Quantitative Spectrosc Radiative Transfer (2016) 176:24–33. doi:10.1016/j.jqsrt.2016.02.010
39. Tseng HY, Hong YB, Wu CY, Hong DC, Chen YC. Monte Carlo simulation of radiative transfer in a medium with varying refractive index specified at discrete points. Appl Math Model (2017) 48:870–84. doi:10.1016/j.apm.2017.02.049
40. Wei L, Qi H, Li G, Ruan ST, Li H. Tomographic reconstruction of refractive index fields based on laser beam deflection measurement. Opt Commun (2021) 492:126951. doi:10.1016/j.optcom.2021.126951
42. Li HZ. The propagating laws of muzzle blast wave far away from the gun. J Ballistics (1992) 1:25–9.
44. Qian H, Zong Z, Wu C, Li J, Gan L. Numerical study on the behavior of utility tunnel subjected to ground surface explosion. Thin-Walled Structures (2021) 161:107422. doi:10.1016/j.tws.2020.107422
45. Ridoux J, Lardjane N, Monasse L, Coulouvrat F. Extension of geometrical shock dynamics for blast wave propagation. Shock Waves (2020) 30:563–83. doi:10.1007/s00193-020-00954-z
47. Snow W. Survey of acoustic characteristics of bullet shock waves. IEEE Trans Audio Electroacoustics (1967) 15: 161–76. doi:10.1109/TAU.1967.1161921
49. Gladstone JH, Dale TP. Researches on the refraction, dispersion, and sensitiveness of liquids. Philosophical Trans R Soc Lond (1863)(152) 448–53. doi:10.1098/rspl.1862.0097
52. Zhang X, Li D, Zhang Z, Huang B, Wang R, Pu H, et al. Density field measurement deflectometry for supersonic wind tunnels. Opt Lett (2023) 48:1714–7. doi:10.1364/OL.485063
Keywords: external ballistic measurement, muzzle blast wave, light screen detector, ray tracing method, refraction, radiation flux
Citation: Duan C, Ni J, Tian H, He B and Li J (2025) The effect of muzzle blast wave on light screen in external ballistic measurement. Front. Phys. 13:1517445. doi: 10.3389/fphy.2025.1517445
Received: 26 October 2024; Accepted: 19 February 2025;
Published: 13 March 2025.
Edited by:
Fumin Zhang, Tianjin University, ChinaReviewed by:
Satyendra Kumar Mishra, Centre Tecnologic De Telecomunicacions De Catalunya, SpainCopyright © 2025 Duan, Ni, Tian, He and Li. This is an open-access article distributed under the terms of the Creative Commons Attribution License (CC BY). The use, distribution or reproduction in other forums is permitted, provided the original author(s) and the copyright owner(s) are credited and that the original publication in this journal is cited, in accordance with accepted academic practice. No use, distribution or reproduction is permitted which does not comply with these terms.
*Correspondence: Jinping Ni, bmlqcDY1MDRAMjYzLm5ldA==
Disclaimer: All claims expressed in this article are solely those of the authors and do not necessarily represent those of their affiliated organizations, or those of the publisher, the editors and the reviewers. Any product that may be evaluated in this article or claim that may be made by its manufacturer is not guaranteed or endorsed by the publisher.
Research integrity at Frontiers
Learn more about the work of our research integrity team to safeguard the quality of each article we publish.