 Lena Trapp1
 Gisela Guthausen
- 1Institute of Mechanical Process Engineering and Mechanics, Karlsruhe Institute of Technology, Karlsruhe, Germany
- 2Food Process Development, Fraunhofer Institute for Process Engineering and Packaging IVV, Freising, Germany
- 3Engler-Bunte-Institut, Water Chemistry and Technology, Karlsruhe Institute of Technology, Karlsruhe, Germany
Oleosomes are lipid-containing organelles that store oils and fats in the tissues of seeds such as almonds and hazelnuts. A comprehensive and detailed understanding and measurement of their size and distribution is necessary to capture the physical properties of almond- or hazelnut-containing foods and to improve their quality. During processing, almonds and hazelnuts are blanched or roasted and crushed, leading to structural changes in their tissues. In addition, nut butter contains quasi-free oil. Pulsed-field gradient nuclear magnetic resonance (PFG-NMR) is applied to determine the size distribution of the oleosomes and to monitor the structural changes along the process chain. A model established for droplet size determination in emulsions was applied and extended to the present case.
1 Introduction
Oil bodies, also known as oleosomes, are micrometer-sized (0.3–20 µm [1–3]) natural lipid-storage structures typically found in plants and microorganisms. These structures are present in almonds [4], hazelnuts [5], peanuts [6], and various seeds [7, 8]. In the majority of plant oleosomes, triacylglycerols (TAGs) are stored in small subcellular spherical structures surrounded by a layer of phospholipids and structural proteins [9]. Oleosomes are physically and chemically stable, either intracellularly or in an extracted, isolated form, due to their solid surface membrane [10]. As they have a hydrophilic character toward their outer environment, natural oil-in-water emulsions can be obtained by aqueous extraction from seeds or oil-containing fruits [1]. Due to their use as natural emulsions of unrefined oil, oleosomes have attracted attention in the food industry. For example, the integration of oleosomes in the production of various milk-like drinks, soy milk, and chocolate has resulted in products with significantly increased stability against separation [4, 10–12]. There is also great interest in the conversion of liquid oil emulsions into soft, solid oleogel structures by physical entrapment with water-soluble biopolymers [1]. Oleosomes from hazelnuts, for example, have been used as the main ingredient in the formulation of liquid margarine [13].
The stability of oleosomes is a key factor for their commercialization in terms of product shelf life, as unstable oleosomes lead to a decrease in their functionality. Therefore, it is necessary to investigate the factors that influence the stability and additional protective mechanisms of oleosomes [14]. It is important to assess the structural and morphologic characteristics with a robust and rapid technique.
In situ measurements offer promising applications for the structural characterization of natural materials such as oleosomes. Their importance and impact are evident in two main aspects. First, the state and structure of oleosomes in plant bodies can be monitored in real time and non-destructively, which is beneficial for ensuring the consistency of oleosome products between different batches. Second, it is beneficial to more accurately reflect the structural changes in oleosomes during processing [14].
To study the morphological and dynamic properties of oleosomes, nuclear magnetic resonance (NMR) is a suitable method. Pulsed-field gradient NMR (PFG-NMR) is a well-known technique to study free or restricted diffusion of molecules [15–17]. PFG-NMR has been applied to TAG fractions to characterize the morphology of oleosomes in seeds [9, 18–20]. A complete methodological approach was reported, showing that it is possible to estimate both the average size of the oleosomes and their size distribution in lettuce and tomato using PFG-NMR experiments [9]. Two models were compared for describing the size distribution of oil bodies. In particular, the influence of the gradient duration δ of the PFG-NMR experiment on the determined size of the oil bodies was analyzed. An increasing discrepancy between the simulation curves and the experimental data was observed with increasing δ. For oil bodies in lettuce seeds, the limit value is δ ≈ 3 ms. If the gradient pulse was longer than this limit, the analysis led to a slight underestimation of the size of the oil bodies. The influence of the diffusion time Δ of the PFG-NMR experiment was not analyzed.
An other approach [21–23] is commonly applied for droplet size distribution (DSD) analysis in emulsions [24–26]. It is used here to measure the structure of oleosomes in almonds and hazelnuts. Since almonds and hazelnuts are chemically and structurally multi-component systems with significant natural variability and the structures they contain are very complex, it cannot be assumed a priori that only spherical compartments will be found, as in emulsions. The application of the DSD approach is consequently discussed and modified accordingly. In order to decide whether the model describes the experimental data in a physically meaningful way, PFG-NMR measurements with a variation of Δ were carried out. In addition, the question of what happens to the structures or oleosomes under thermal and mechanical stress was addressed. For example, do oleosomes remain intact when a nut is roasted or crushed?
2 Materials and methods
2.1 Materials
Fresh almonds and hazelnuts with a diameter of 11–13 mm were obtained from Infopoint - Kakao und mehr (Reutlingen, Germany).
2.1.1 Processing of hazelnuts
Hazelnuts were roasted in a pre-heated oven at 180°C with static upper and lower heat for 25 min to investigate the effect of heat on the structure of oleosomes.
Both raw and roasted hazelnuts were crushed using a Thermomix T6 (Vorwerk, Wuppertal, Germany) for 4 min, followed by sieving into three size categories: <0.8 mm, 0.8–1.25 mm, and >1.25 mm.
2.1.2 Characterization of almonds and hazelnuts
2.1.2.1 Total fat content
The total fat content of hazelnuts and almonds was measured using Soxhlet extraction. Approximately 10 g of the finely ground sample was placed in a pre-dried filter paper thimble and extracted with n-hexane in a Soxhlet apparatus (BÜCHI Labortechnik AG, Flawil, Switzerland) for 6 h. After extraction, the solvent was evaporated, and the extracted oil was dried in an oven at 105°C for 1 h to remove residual moisture. The extracted and dried oil was weighed, and the total fat content was calculated as a percentage of the dry weight of the sample. The total fat content was 64% ± 0.2% for unroasted hazelnuts and 62% ± 1.4% for roasted hazelnuts. The total fat content of raw almonds was 57% ± 1.0%. The observed fat contents are in accordance with literature values [27, 28].
2.1.2.2 Fatty acid composition
The fatty acid composition of the extracted oil from almonds and hazelnuts reflects the amount of saturated and unsaturated fatty acids. It was determined by gas chromatography (GC) using a flame ionization detector (FID). A GC System 7890 A (Agilent Technologies, Böblingen, Germany) with a nitroterephthalic acid-modified polyethylene glycol (ZB-FFAP) capillary column (Phenomenex, Aschaffenburg, Germany, dimensions 30 m × 0.32 mm × 0.25 μm) was used. The injector temperature was set to 523 K, with an injection volume of 1 μL and a split ratio of 1:20. The carrier gas (hydrogen) and oven temperatures were maintained at 433 K for 1.5 min, followed by a ramp to 523 K at a rate of 25 K min⁻1, where it was subsequently held for 3 min. The FID detector temperature was kept at 533 K, and the hydrogen flow rate was 11.29 mL min⁻1. Data acquisition was performed using OpenLAB C.01.02 and MAESTRO 1.1 (GERSTEL GmbH & Co. KG, Mülheim an der Ruhr, Germany). Fatty acids were quantified based on peak areas and identified using retention times. Monounsaturated oleic acid (C18:1) was the main fatty acid in both oils, followed by polyunsaturated linoleic acid (C18:2) (Table 1). In total, the amount of saturated fatty acids was approximately 8.7% for almond oil and approximately 8.1% for hazelnut oil.
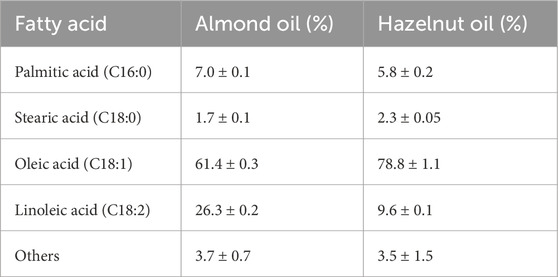
Table 1. Relative amounts of fatty acids based on the total fatty acid content of the oils.
2.2 PFG-NMR: stimulated echo sequence and data processing
All measurements were performed on a 400-MHz WB magnet, equipped with AVANCE NEO electronics. The radiofrequency probe was a DiffBB probe for measurements with pulsed-field gradients up to 15 Tm−1 along z, the direction of the main magnetic field B0. A stimulated echo (STE) sequence (Figure 1) was applied to measure the signal attenuation for a wide range of diffusion times [29–31].
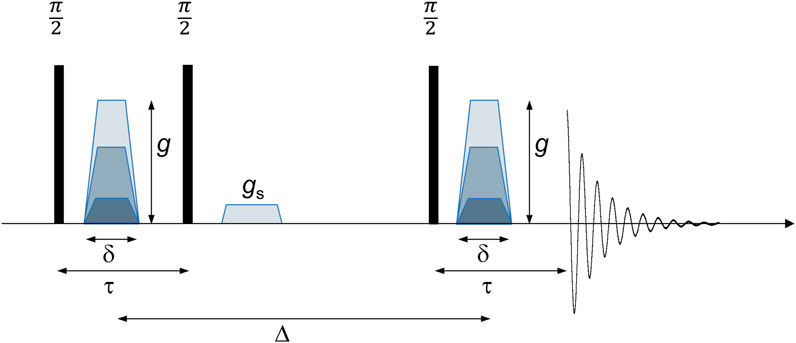
Figure 1. PFG-STE sequence: the encoding of magnetization is achieved through a first gradient pulse with duration δ and amplitude g, applied after the first radiofrequency π/2 pulse. Magnetization is stored along z after the second radiofrequency pulse, and the spoiler gradient gs removes leftover unwanted coherencies. The third radiofrequency pulse reads out the magnetization, and after decoding during the second gradient pulse, the stimulated echo is acquired after the diffusion time Δ. The stimulated echo has its maximum at τ after the third π/2 pulse.
The parameters in the PFG-STE sequence were adjusted for the present case (Table 2).
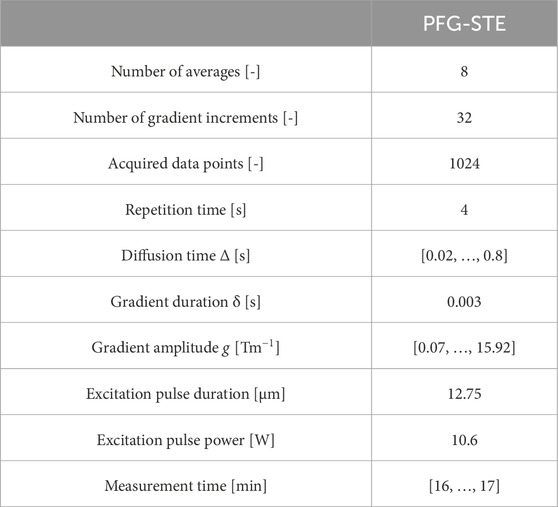
Table 2. Acquisition parameters of the 1H-PFG-STE experiments.
Nuts and almonds are more or less solid, and the NMR spectra (Figure 2A) are broad due to short T2* values, making detailed chemical structure determination impossible. Therefore, the spectra were integrated over the chemical shift range
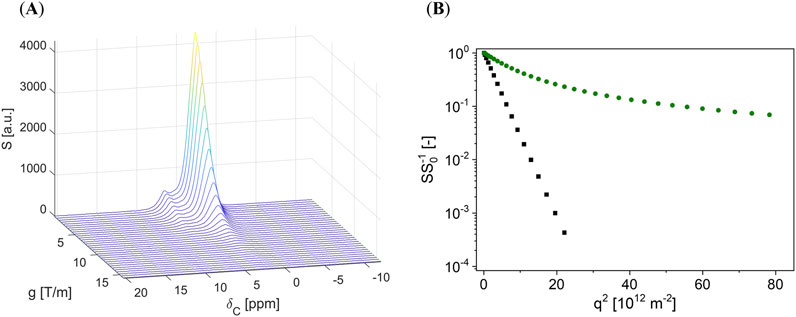
Figure 2. (A) Typical signal decay of a PFG-STE experiment on a hazelnut: the signal decays as a function of the gradient amplitude g due to diffusion. The chemical shift dispersion is hampered by the hazelnut microstructure, but the signatures in the spectra show similar diffusion behavior such that the spectra were integrated over the complete range of chemical shifts. (B) Logarithmic, normalized integral signal amplitude SS0−1 of a hazelnut (


The signal decay shows a strong deviation from a straight line with a slope proportional to the diffusion coefficient D when plotting the logarithm of SS0−1 as a function of q2 = (γδg)2. S0 is the signal amplitude at a gradient g = 0.07 Tm−1. γ is the gyromagnetic ratio, which is specific to the nuclear isotope under investigation (Figure 2B). The curvature indicates restricted or hindered diffusion, which is typical for the diffusion of molecules in droplets or, more generally, in dispersed systems. We specifically refer to the geometric restriction in spherical geometries. Due to the confinement with respect to the outer phase, the molecules of the disperse phase are restricted in their translational diffusion, which relates the mean free path of these molecules to the length scale of the confining geometry and enables the characterization of geometric structures by PFG-NMR. A commonly applied model describes the signal attenuation of molecules diffusing under a spherical geometric restriction (Equation 1) [21, 22].
where r is the radius, d = 2∙r is the diameter of a droplet or oleosome—the quantity searched for, while D is the diffusion coefficient of the almond oil (ALO) or hazelnut oil (HNO). These values were obtained on extracted oils (DALO = 1.01·10−11 m2s−1 and DHNO = 9.28·10−12 m2s−1 at 21°C).
The size of the droplets is usually assumed to follow a logarithmic normal distribution function [23], which is characterized by the mean volume-related droplet, or, in this case, the oleosome size diameter d33,eff and distribution width
These monomodal log-normally distributed sizes can be extended to multimodal distributions and other forms of distribution functions. The normalized integral of
In natural and engineering processes and products, quantities and characterizing parameters are often distributed rather than single-valued. In hazelnuts, for example, the data shown later cannot be satisfactorily modeled by the above-described approach. Additional open structures may exist in which diffusion is hindered, alongside closed pores (oleosomes) with restricted diffusion. An approach considering the contribution of oil diffusion in hindering structures uses the gamma distribution function and models the signal attenuation accordingly [32]:
where
3 Results and discussion
3.1 Oleosomes in almonds
PFG-STE signal decays were measured on a cylindrical piece of an almond (diameter of 4 mm) in a 5-mm NMR tube, with care taken not to disturb its microstructure. The signal decays were measured as a function of diffusion time Δ, which allowed us to determine whether the model, which assumes that almond oil is captured in the spherical geometry of oleosomes, was appropriate (Figure 3A). The DSD approach (Equations 1–3) was used to describe the signal decays. d33,eff and σ were determined as a function of Δ (Figure 3B).
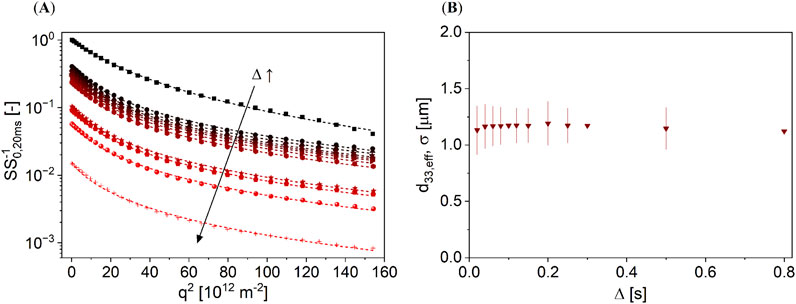
Figure 3. (A) PFG-STE signal decays of an almond as a function of Δ ∈ [0.02, 0.8] s, while the lines represent the DSD model (Equations 1–3). The decays are normalized to the signal amplitude of S0,20 ms at Δ = 0.02 s and g = 0.07 Tm−1. (B) d33,eff and σ (shown as bars) deduced from the data in (A) do not depend on the diffusion time within the experimental error; the parameters are, therefore, indicative of the size of oleosomes in almonds.
d33,eff and σ are constant as a function of Δ in almonds. The model described the data well with R2 > 0.99. This means that the oil in almonds is enclosed in oleosomes with d33,eff = 1.16 µm and σ = 0.18 µm.
3.2 Oleosomes in hazelnuts
3.2.1 Influence of thermal treatment
In the case of hazelnuts, cylindrical pieces of unroasted and roasted hazelnuts (diameter of 4 mm) were investigated to analyze the influence of thermal treatment on structural changes via diffusion. The signal decays of the hazelnuts and hazelnut oil were compared (Figure 4).
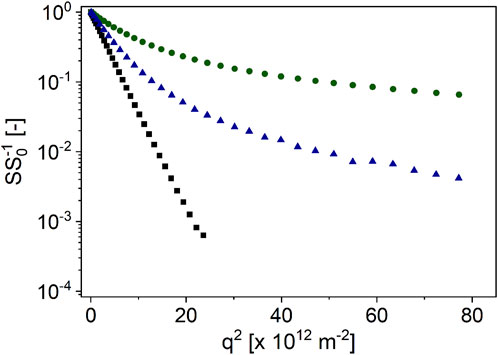
Figure 4. PFG-STE signal decays of hazelnut oil (


Although the signal of hazelnut oil followed an almost straight line in the semi-logarithmic plot, the decays of hazelnut’s signal showed a curvature, as expected. The curvature was found to be larger for unroasted nuts than for roasted nuts. This suggests that the thermal treatment leads to structural changes in the hazelnuts, and the oil is less hindered or restricted in its diffusion. The DSD approach was used to describe the signal decays of the nuts in order to determine the diameter distribution of the oleosomes as a function of Δ in analogy to almonds (Figure 5).
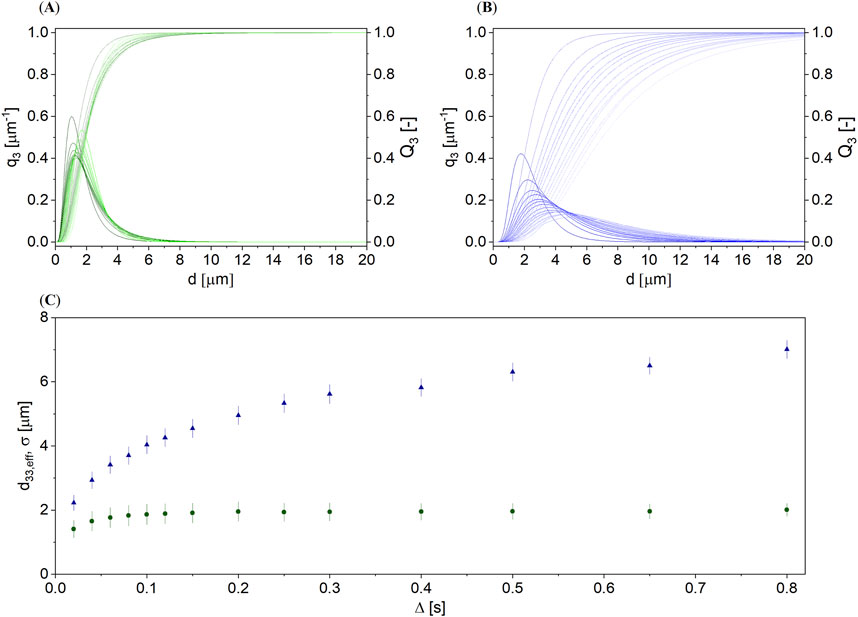
Figure 5. q3 distribution densities and Q3 cumulative distributions of the oleosome diameter in (A) an unroasted and (B) a roasted hazelnut, modeled with the DSD approach (Equations 1–3) for Δ ∈ [0.02, 0.8] s. (C) d33,eff and σ (bars) as a function of Δ for an unroasted (


Density distributions q3 and cumulative distributions Q3 of the unroasted (Figure 5A) and roasted hazelnut (Figure 5B) showed that the diameters from the DSD approach are smaller and the distributions are narrower for the unroasted hazelnut than for the roasted hazelnut. d33,eff and σ as a function of Δ (Figure 5C) also confirmed this statement. However, d33,eff increased with Δ, especially for the roasted hazelnut, which is unphysical. Compared to almonds (Figure 3B), the oleosome size in hazelnuts can, therefore, hardly be deduced from Figure 5C, although the numerical description of the signal decay was found to be good (R2 > 0.99). A more dedicated description is, therefore, particularly needed for roasted hazelnuts. The increase of d33,eff with Δ indicated that it cannot be assumed in hazelnuts, compared to almonds, that there is only one storage structure in which the oil is stored. Another attempt was made to model the data using a bimodal DSD approach (Figure 6).
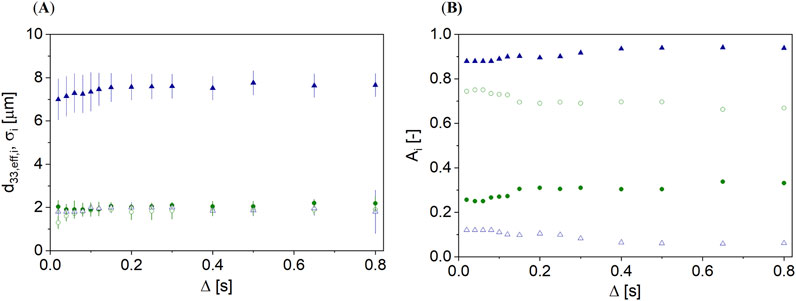
Figure 6. (A) d33,eff,i and σ as a function of Δ for the unroasted (


The description of the data with the bimodal DSD approach showed two values of d33,eff,i (Figure 6A). d33,eff,i was found to have similar values in the unroasted hazelnut. The bimodal DSD approach did not provide a better interpretation of these data than the monomodal approach. For the roasted hazelnut, the fraction of compartments with larger d33,eff,1 was found to be significantly larger than that with smaller d33,eff,2 (Figure 6B). d33,eff,1 of the smaller fraction with 10% was found to be comparable to that in the unroasted hazelnut. The increase of d33,eff,i as a function of Δ was much less pronounced but still present. Thus, the bimodal DSD approach also did not describe the data physically correctly.
The changes in the signal decay (Figure 4) indicate a change in the intrinsic structure of hazelnuts during roasting. Roasting led to increased microporosity and rupture of cell walls, among others, as a result of water loss during heat exposure [33–35]. In addition, roasting destroyed the endoplasmic reticulum and the oleosomes it contains. This in turn led to larger intercellular spaces. The protein bodies may swell or deform depending on the roasting parameters, and the cells may be enlarged and irregularly shaped [36]. These facts highlight the need for an extended concept: oil not only diffuses in the oleosomes or larger compartments of hazelnuts but also in the cell and extracellularly (Figure 7). Therefore, diffusion is hindered by other components such as starch granules and proteins or cell walls. Cells in hazelnuts have a typical diameter of 40 µm with protein bodies of 5 µm [37].
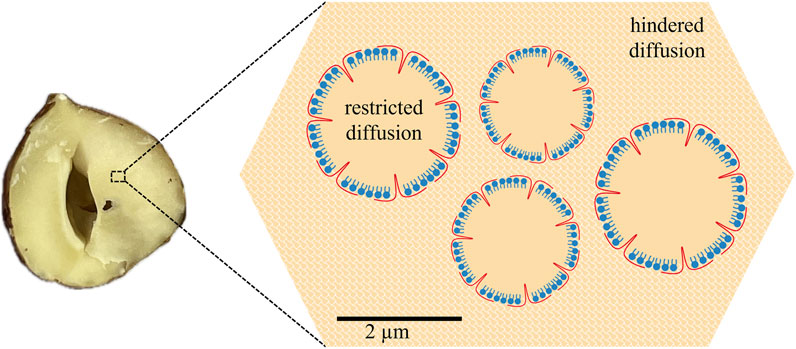
Figure 7. Scheme of a hazelnut for modeling the diffusion data: inside the oleosomes, there is geometrically restricted diffusion in a spherical geometry for the oil. Outside the oleosomes, inside or outside the cell, diffusion is hindered.
The hindrance of the oil diffusion outside the oleosomes in a hazelnut suggested a combined model: the DSD approach combined with a gamma distribution of diffusion coefficients (Figure 8), according to the weighted sum of Equations 1 and 4.
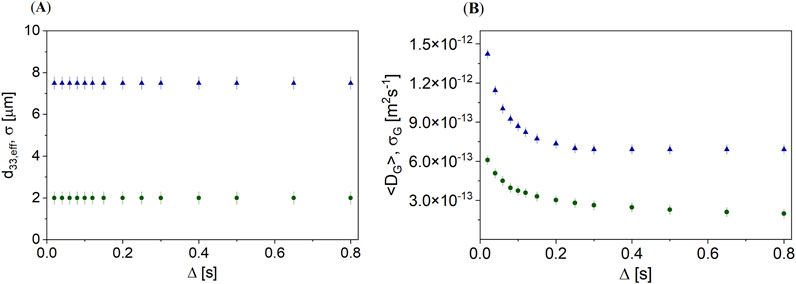
Figure 8. (A) d33,eff and σ and (B) <DG> and σG as a function of Δ for the unroasted (


Within the combined model, d33,eff and σ are constant as a function of Δ in almonds for unroasted and roasted hazelnuts (Figure 8A). With d33,eff = 2 μm, the diameters of the oleosomes in unroasted hazelnuts were observed to be smaller than the compartments in roasted hazelnuts (d33,eff = 7.5 µm). The dependence of <DG> on Δ showed that a hazelnut contains more oil than just that in the oleosomes and that this oil is hindered in its diffusion. Diffusion was found to be slower by a factor of 2 in unroasted hazelnuts than in roasted hazelnuts. The fraction of oil that was not geometrically restricted but hindered for both types of hazelnuts was found to be approximately 11%. Roasting also increases the compartments in which geometrically restricted oil can diffuse, and the structure in which diffusion is hindered becomes less dense and more open. The <DG> of hazelnuts was found to be approximately 10 times smaller than that of extracted hazelnut oil (DHNO = 9.28∙10−12). This was due to the presence of various other structures in the hazelnut, such as starch, proteins, organelles and cell walls, or fibers.
3.2.2 Influence of mechanical treatment
In addition to the effects of thermal treatment, the influence of mechanical treatment was also investigated. Unroasted and roasted hazelnuts were crushed in three crushing stages and compared with the 4 mm pieces. The signal decays were modeled with the combined model of the DSD approach and gamma distribution to determine the oleosome size distributions (Figures 9A, B) and the gamma distributions of the diffusion coefficients in hindered environments (Figures 9C, D).
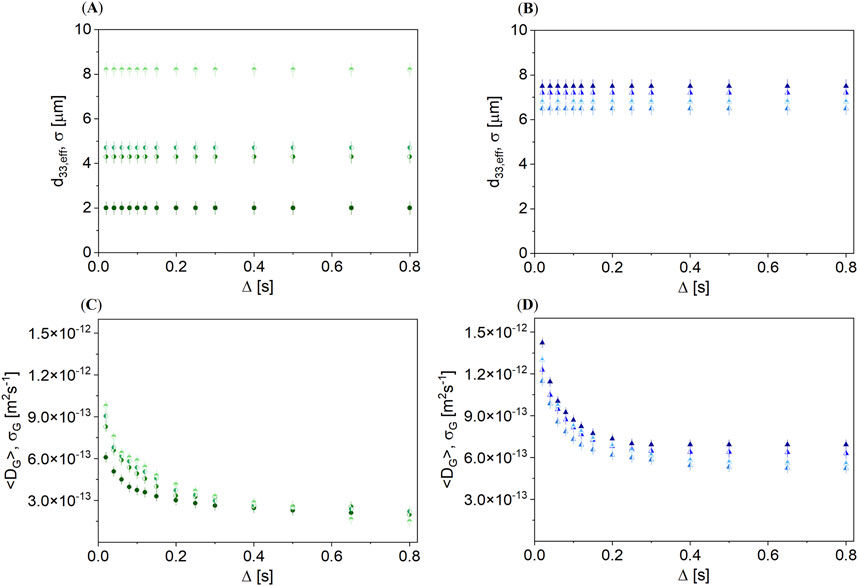
Figure 9. Combined model consisting of the DSD approach (Equations 1–3) and the gamma distribution (Equation 4): d33,eff and σ as a function of Δ for (A) unroasted hazelnut (


The crushing stage had a clear influence on d33,eff in the unroasted hazelnut (Figure 9A). Stronger crushing led to larger d33,eff. In contrast, there was no clear relation between mechanical treatment and diffusion behavior for the roasted hazelnut (Figure 9B). For all crushing stages, d33,eff of roasted hazelnuts was similarly large. <DG> of the unroasted hazelnut was smaller by a factor of 1.5 than in the roasted hazelnut (Figures 9C, D). Roasting led to an enlargement of the restricting geometries [36]. The crushing of roasted nuts, therefore, had no further major effect on oil diffusion at the microscopic level. This is different for the unroasted hazelnuts: the natural structure before the mechanical treatment was intact, and the change in the structure was only a function of the crushing stages. By crushing, oleosomes were partially destroyed, forming larger oil compartments that may potentially coalesce. The diffusion of the oil appeared to be, nevertheless, geometrically restricted. For unroasted hazelnuts, the proportion of the fraction with restricted diffusion was found to be 11%, independent of the crushing stage. The diffusion mechanisms in roasted hazelnuts did not change with size reduction during crushing, but the proportions of the two contributions changed. The proportion of hindered oil, which is described by a gamma distribution, increased from 11% to 16% as a result of crushing. This was obvious for the last crushing stage, which led to nut butter. The extended model allowed all investigated cases in the hazelnut to be modeled in a physically meaningful way and the states of the hazelnuts to be compared directly with each other so that the effects of thermal and mechanical treatment become directly visible. The data showed the potential of the non-destructive measurement of nuts by PFG-STE, which revealed the microscopic structure of the hazelnuts before and after thermal and mechanical treatment. The method could also be used for in situ monitoring during industrial nut processing. The oil content and its distribution in oleosomes or hindering structures become accessible via these measurements, and the quality of nuts can be monitored prospectively with respect to their oil content.
4 Conclusion
In this study, pulsed-field gradient nuclear magnetic resonance was used to investigate the structure of almonds and hazelnuts on the microscale. Oil is usually stored in spherical oleosomes in almonds and hazelnuts. Analysis of diffusion of the oil provided the basis for determining the size of these lipid-containing organelles. The approach commonly used for droplet size analysis in emulsions was directly transferable to almonds. A mean volume-related oleosome size diameter of 1.16 µm with a distribution width of 0.18 µm was measured. In contrast, the model needed an extension with a second contribution described by a gamma distribution to consistently describe the situation in hazelnuts. It is concluded that oil in hazelnuts is present both in the form of oleosomes and of open structures. Therefore, diffusion is hindered by other components of the hazelnut such as cell walls and organelles. Roasting and crushing led to an even more openporous structure in hazelnuts. Mean volume-related oleosome size diameters were measured to be up to four times larger than those of an untreated hazelnut with oleosomes of approximately 2 µm.
Data availability statement
The raw data supporting the conclusions of this article will be made available by the authors, without undue reservation.
Author contributions
LT: conceptualization, data curation, formal analysis, investigation, methodology, visualization, writing–original draft, and writing–review and editing. HS: data curation, visualization, writing–original draft, and writing–review and editing. HN: funding acquisition, resources, supervision, and writing–review and editing. GG: conceptualization, funding acquisition, methodology, resources, supervision, visualization, writing–original draft, and writing–review and editing.
Funding
The author(s) declare that financial support was received for the research, authorship, and/or publication of this article. This research was funded by the German Federal Ministry of Economic Affairs and Climate Action (BMWK) through the program to promote collective industrial research (IGF) with the German Federation of Industrial Research Association (AiF), IGF-Nr. 21785 N, and the German Aerospace Center (DLR), IGF-Nr. 01IF23262N. The responsibility for the content of this publication lies with the author.
Acknowledgments
The authors thank the German Federation of Industrial Research Association (AiF) and the German Aerospace Center (DLR) for financial support of the research project IGF-Nr. 21785 N and IGF-Nr. 01IF23262N. This project was carried out under the auspices of AiF and DLR and financed within the budget of the Federal Ministry of Economic Affairs and Climate Action (BMWK) through the program to promote collective industrial research (IGF). The Deutsche Forschungsgemeinschaft is acknowledged for its substantial financial contribution in the form of NMR instrumentation and within the instrumental facility Pro2NMR. The authors also thank the Bruker BioSpin GmbH µ-imaging application group for their support and Christa Schuster-Salas for providing the almonds and hazelnuts.
Conflict of interest
The authors declare that the research was conducted in the absence of any commercial or financial relationships that could be construed as a potential conflict of interest.
Publisher’s note
All claims expressed in this article are solely those of the authors and do not necessarily represent those of their affiliated organizations, or those of the publisher, the editors and the reviewers. Any product that may be evaluated in this article, or claim that may be made by its manufacturer, is not guaranteed or endorsed by the publisher.
References
1. Mert B, Vilgis TA. Hydrocolloid coated oleosomes for development of oleogels. Food Hydrocolloids (2021) 119:106832. doi:10.1016/j.foodhyd.2021.106832
2. Dave AC, Ye A, Singh H. Structural and interfacial characteristics of oil bodies in coconuts (cocos nucifera L.). Food Chem (2019) 276:129–39. doi:10.1016/j.foodchem.2018.09.125
3. Barre A, Simplicien M, Cassan G, Benoist H, Rougé P. Oil bodies (oleosomes): occurrence, structure, allergenicity. Revue francaise d'allergologie (2018) 58(8):574–80. doi:10.1016/j.reval.2018.10.005
4. Gallier S, Gordon KC, Singh H. Chemical and structural characterisation of almond oil bodies and bovine milk fat globules. Food Chem (2012) 132(4):1996–2006. doi:10.1016/j.foodchem.2011.12.038
5. Lamberti C, Nebbia S, Balestrini R, Marengo E, Manfredi M, Pavese V, et al. Identification of a caleosin associated with hazelnut (corylus avellana L.) oil bodies. Plant Biol (Stuttgart, Germany) (2020) 22(3):404–9. doi:10.1111/plb.13096
6. Zaaboul F, Matabaro E, Raza H, Xin BD, Duhoranimana E, Cao C, et al. Validation of a simple extraction method for oil bodies isolated from peanuts. Eur J Lipid Sci Technol (2018) 120(2):1700363. doi:10.1002/ejlt.201700363
7. Romero-Guzmán MJ, Köllmann N, Zhang L, Boom RM, Nikiforidis CV. Controlled oleosome extraction to produce a plant-based mayonnaise-like emulsion using solely rapeseed seeds. Lwt (2020) 123:109120. doi:10.1016/j.lwt.2020.109120
8. Karefyllakis D, Van Der Goot AJ, Nikiforidis CV. The behaviour of sunflower oleosomes at the interfaces. Soft Matter (2019) 15(23):4639–46. doi:10.1039/c9sm00352e
9. Guillermo A, Bardet M. In situ pulsed-field gradient nmr determination of the size of oil bodies in vegetable seeds. Analysis of the effect of the gradient pulse length. Anal Chem (2007) 79(17):6718–26. doi:10.1021/ac070416w
10. Nikiforidis CV, Matsakidou A, Kiosseoglou V. Composition, properties and potential food applications of natural emulsions and cream materials based on oil bodies. RSC Adv (2014) 4(48):25067–78. doi:10.1039/c4ra00903g
11. Shakerardekani A, Karim R, Vaseli N. The effect of processing variables on the quality and acceptability of pistachio milk. J Food Process Preservation (2013) 37(5):541–5. doi:10.1111/j.1745-4549.2012.00676.x
12. Mantzouridou FT, Naziri E, Kyriakidou A, Paraskevopoulou A, Tsimidou MZ, Kiosseoglou V. Oil bodies from dry maize germ as an effective replacer of cow milk fat globules in yogurt-like product formulation. LWT (2019) 105:48–56. doi:10.1016/j.lwt.2019.01.068
13. Erinç H, Taştanoğlu FB. Utilisation of hazelnut-derived oleosomes in liquid margarine formulation: an investigation into stability and functional enhancement. Acta Alimentaria (2024) 53(1):127–38. doi:10.1556/066.2023.00277
14. Shi Z, Li K, Meng Z. Recent trends in oleosomes: extraction methods, structural characterization, and novel applications. Trends Food Sci and Technology (2024) 151:104621. doi:10.1016/j.tifs.2024.104621
15. Stejskal EO, Tanner JE. Spin diffusion measurements: spin echoes in the presence of a time-dependent field gradient. J Chem Phys (1965) 42(1):288–92. doi:10.1063/1.1695690
16. Tanner JE, Stejskal EO. Restricted self-diffusion of protons in colloidal systems by the pulsed-gradient, spin echo method. J Chem Phys (1968) 49(4):1768–77. doi:10.1063/1.1670306
17. Price WS. Pulsed-field gradient nuclear magnetic resonance as a tool for studying translational diffusion: Part Ii. Experimental aspects. Concepts Magn Reson (1998) 10(4):197–237. doi:10.1002/(sici)1099-0534(1998)10:4<197::aid-cmr1>3.0.co;2-s
18. Fleischer G, Skirda V, Werner A. Nmr-investigation of restricted self-diffusion of oil in rape seeds. Eur Biophys J (1990) 19:25–30. doi:10.1007/bf00223570
19. Zakhartchenko N, Skirda V, Valiullin R. Self-diffusion of water and oil in peanuts investigated by pfg nmr. Magn Reson Imaging (1998) 16(5-6):583–6. doi:10.1016/s0730-725x(98)00049-6
20. Carlton K, Halse M, Maphossa A, Mallett M. Nmr stray-field analysis of oil drop size distribution in peanut cotyledons. Eur Biophys J (2001) 29:574–8. doi:10.1007/s002490000098
21. Murday JS, Cotts RM. Self-diffusion coeffcient of liquid lithium. J Chem Phys (1968) 48(11):4938–45. doi:10.1063/1.1668160
22. Neuman CH. Spin echo of spins diffusing in a bounded medium. J Chem Phys (1974) 60(11):4508–11. doi:10.1063/1.1680931
23. Packer KJ, Rees C. Pulsed nmr studies of restricted diffusion. 1. Droplet size distributions in emulsions. J Colloid Interf Sci (1972) 40(2):206–18. doi:10.1016/0021-9797(72)90010-0
24. Bernewitz R, Guthausen G, Schuchmann HP. Nmr on emulsions: characterisation of liquid dispersed systems. Magn Reson Chem (2011) 49:S93–S104. doi:10.1002/mrc.2825
25. Voda MA, van Duynhoven JPM. Characterization of food emulsions by pfg-nmr. Trends Food Sci and Technology (2009) 20(11-12):533–43. doi:10.1016/j.tifs.2009.07.001
26. Vermeir L, Sabatino P, Balcaen M, Declerck A, Dewettinck K, Martins JC, et al. Effect of molecular exchange on water droplet size analysis as determined by diffusion nmr: the W/O/W double emulsion case. J Colloid Interf Sci (2016) 475:57–65. doi:10.1016/j.jcis.2016.04.029
27. Kornsteiner M, Wagner K-H, Elmadfa I. Tocopherols and total phenolics in 10 different nut types. Food Chem (2006) 98(2):381–7. doi:10.1016/j.foodchem.2005.07.033
28. Yada S, Lapsley K, Huang G. A review of composition studies of cultivated almonds: macronutrients and micronutrients. J Food Compost Anal (2011) 24(4-5):469–80. doi:10.1016/j.jfca.2011.01.007
29. Callaghan PT. Principles of nuclear magnetic resonance microscopy. New York: Oxford University Press (1991).
31. Callaghan PT. Translational dynamics and magnetic resonance: principles of pulsed gradient spin echo nmr. New York, US: Oxford University Press (2011).
32. Röding M, Bernin D, Jonasson J, Sarkka A, Topgaard D, Rudemo M, et al. The gamma distribution model for pulsed-field gradient nmr studies of molecular-weight distributions of polymers. J Magn Reson (2012) 222:105–11. doi:10.1016/j.jmr.2012.07.005
33. Perren R, Handschin S, Escher F. Rösttechnologie von haselnüssen. Teil ii: veränderung der mikrostruktur von haselnüssen während der röstung. Zucker-und Süsswaren-Wirtschaft (1996) 49(2):68–71.
34. Saklar S, Katnas S, Ungan S. Determination of optimum hazelnut roasting conditions. Int J Food Sci and Technology (2001) 36(3):271–81. doi:10.1046/j.1365-2621.2001.00457.x
35. Rieblinger K, Schwingshandl I, Ziegleder G. Bedeutung der oberflächenschicht für die haltbarkeit gerösteter haselnüsse. In: Teil I: nüsse reagieren mit sauerstoff (2000).
36. Saklar S, Ungan S, Katnas S. Microstructural changes in hazelnuts during roasting. Food Res Int (2003) 36(1):19–23. doi:10.1016/s0963-9969(02)00103-5
Keywords: oleosome, pulse-field gradient nuclear magnetic resonance, restricted diffusion, size distribution, processing
Citation: Trapp L, Schacht H, Nirschl H and Guthausen G (2025) Oleosomes in almonds and hazelnuts: structural investigations by NMR. Front. Phys. 13:1494052. doi: 10.3389/fphy.2025.1494052
Received: 10 September 2024; Accepted: 07 January 2025;
Published: 03 March 2025.
Edited by:
Pierluigi Mazzei, University of Salerno, ItalyReviewed by:
Vito Gallo, Politecnico di Bari, ItalyMatthew Augustine, University of California, Davis, United States
Copyright © 2025 Trapp, Schacht, Nirschl and Guthausen. This is an open-access article distributed under the terms of the Creative Commons Attribution License (CC BY). The use, distribution or reproduction in other forums is permitted, provided the original author(s) and the copyright owner(s) are credited and that the original publication in this journal is cited, in accordance with accepted academic practice. No use, distribution or reproduction is permitted which does not comply with these terms.
*Correspondence: Gisela Guthausen, Z2lzZWxhLmd1dGhhdXNlbkBraXQuZWR1