 Kai Liu1
 Junwu Zhu
94% of researchers rate our articles as excellent or good
Learn more about the work of our research integrity team to safeguard the quality of each article we publish.
Find out more
ORIGINAL RESEARCH article
Front. Phys., 04 March 2025
Sec. Complex Physical Systems
Volume 13 - 2025 | https://doi.org/10.3389/fphy.2025.1480749
The operation of the power grid is closely related to meteorological disasters. Changes in meteorological conditions may have an impact on the operation and stability of the power system, leading to economic losses. This paper proposes a Random Forest grid fault prediction model based on Genetic Algorithm optimization (GA-RF) to classify the grid fault types, which improves the distribution network fault prediction accuracy by constructing an optimized random forest model. Specifically, the model’s performance is initially enhanced by calculating the Gini index for each feature. The weather attributes with higher Gini indices are subsequently selected as pivotal features to alleviate the detrimental impact of unnecessary attributes on the model. In addition, a genetic algorithm is used to optimize the parameters of the random forest model for early warning of grid fault occurrence. The experimental results demonstrate that the proposed GA-RF in this paper achieves significantly higher accuracy compared to Random Forest (RF), Support Vector Machine (SVM), and Linear Regression (LR). Specifically, it outperforms them by 14.77%, 23.22%, and 13.77% respectively. This method effectively supports the safe and stable operation of the power system.
The reliability and stability of the grid system are crucial as modern society increasingly relies on electricity, which is closely tied to people’s lives [1, 2]. As our dependence on digital technologies and smart devices continues to grow, even minor disruptions in power supply can have cascading effects on economic activities, public safety, and individual well-being. The power equipment is exposed to the natural environment for an extended duration, inevitably being influenced by factors such as typhoons and other destructive weather phenomena. These environmental factors not only pose a threat to the infrastructure but also complicate the operational dynamics of the power grid, increasing the likelihood of failures. Consequently, this can result in line fractures and equipment impairment, leading to inevitable detriment to the power system. Such failures can contribute to widespread outages, which disrupt essential services including healthcare, transportation, and communication, highlighting the critical need for resilient grid systems capable of withstanding climatic challenges [3–5]. The accurate and timely prediction and diagnosis of power grid faults are crucial for implementing preventive measures and recovering from faults. Furthermore, as the global climate continues to change, power systems may face increasingly unpredictable weather patterns, underscoring the urgency for ongoing research and innovation in fault predictive methodologies. Additionally, Our proposed accurate fault prediction model has significant practical implications. In terms of cost savings, it allows utility companies to avoid costly emergency repairs, including overtime pay, expedited shipping, and outage fines. Based on local grid data analysis, it could potentially cut annual repair costs by 20%–30%. For risk mitigation, it helps prevent major power failures, ensuring reliable power supply to consumers and reducing negative impacts on critical infrastructure and industrial production. In manufacturing-dependent regions, it decreases the likelihood of production disruptions, safeguarding economic stability and minimizing revenue and supply chain risks.
The power system is significantly influenced by meteorological factors, and scholars from various countries have conducted studies on meteorological disasters in power grids to some extent. Huang Can [6] et al. proposed establishing association rules between meteorological factors and transmission and substation equipment faults using the Apriori algorithm. Based on this, they constructed a fault warning process for transmission and substation equipment based on meteorological data mining, which alerted faults according to meteorological forecast information. However, this method analyzes the probability of faults occurring through association rules and has some limitations. Primarily, it does not account for the temporal dynamics of meteorological changes, which can significantly impact the reliability of the established associations over time. Moreover, this approach lacks the flexibility to adapt to sudden and extreme changes in meteorological conditions, which are common in dynamic weather scenarios. As a result, its scalability and adaptability to real-world, complex and variable meteorological environments are severely restricted. Zhou Xiaohua [7] et al. proposed a method to forecast distribution network faults based on the combination of weather forecast data and distribution network abnormal operation cumulative data. It uses the association rule algorithm to explore the correlation between fault occurrence and meteorological data, as well as the correlation between fault numbers and abnormal operation of the network. The Random Forest regression model is then used to forecast fault amounts in the Municipal Power Supply Company’s distribution network, providing early warnings for power supply team. By leveraging machine learning techniques, this approach seeks to enhance the accuracy of fault predictions and enable proactive maintenance strategies. However, this method fails to fully utilize the complexity of data characteristics and nonlinear relationships, resulting in underfitting models with insufficient prediction ability. Its accuracy rate is only 89.9%. Such a performance level raises concerns regarding the adequacy of the model, as missing contextual factors may lead to misinterpretations of fault risk. Furthermore, when facing rapid changes in meteorological data patterns or new types of meteorological events, the model’s adaptability is limited. It struggles to handle the dynamic nature of meteorological conditions, which may lead to inaccurate forecasts and ineffective maintenance planning in the long run. Based on analyzing the relationship between historical failures of electric power equipment and meteorological disasters, Kou Zheng [8] et al. developed a risk model for electric power equipment exposed to single or multiple meteorological disasters based on Lorentz’s theory. This theoretical framework facilitates the quantification of risk, providing valuable insights into the likelihood of equipment failure under various weather scenarios. They also considered the type and severity of the disaster to determine the probability of failure under specific meteorological conditions. Such considerations are crucial, as different types of weather events, such as storms or heatwaves, can have markedly different impacts on power system integrity. However, in practical applications, there are still numerous random factors and uncertainties that may cause deviations from the predicted outcomes. In addition, the model’s scalability is challenged when dealing with large-scale and complex meteorological datasets. It may encounter difficulties in processing and analyzing extensive amounts of data in a timely and accurate manner, which could limit its practical application in large power grid systems with extensive meteorological monitoring.
Compared with the methods of the aforementioned scholars, a Random Forest (RF) grid fault prediction model based on Genetic Algorithm (GA) optimization (GA-RF) is proposed in this paper. The parameters of RF are optimized by GA to improve the accuracy and robustness of the model prediction, and comparative experiments are carried out on the grid fault dataset to verify the effectiveness and superiority of the proposed method. The approach in this paper shows improvements in several aspects. It considers the temporal dynamics of meteorological changes, handles data complexity and nonlinear relationships, and addresses data uncertainty. The GA-RF model continuously optimizes the parameters of the random forest through genetic algorithms, enabling better adaptation to changes in meteorological data over time. Genetic algorithms can automatically search for the optimal parameter combination, enhancing the model’s adaptability to meteorological data in different periods and predicting power grid failures more accurately. Genetic algorithms combined with random forests can also effectively deal with data complexity and nonlinearity. Additionally, features with high Gini index are selected as important weather attributes to reduce the negative impact of unnecessary features on the model and improve its ability to handle complex data and capture the relationship between meteorological factors and power grid failures more accurately. Lastly, the GA-RF model improves the robustness by optimizing random forest parameters through genetic algorithms, enabling better coping with data uncertainties. The genetic algorithm can automatically adjust model parameters so that it can maintain better prediction performance in the face of different random factors. The main contributions are as follows:
• We propose the GA-RF model, which combines GA and RF to extract key features from meteorological data, overcoming the limitations of manual feature selection.
• We screen features with high Gini index as important weather attributes to reduce the negative impact of unnecessary features on the model, and used genetic algorithm to optimize the parameters of the random forest model.
• Through a large number of simulation experiments, results show that the proposed GA-RF model is superior to traditional methods and other advanced prediction models in multiple evaluation metrics.
The remaining sections of this paper are organized as follows: Section 2 introduces the relevant theoretical foundation. Section 3 describes the proposed framework in detail. Section 4 demonstrates the effectiveness of the approach through experiments. Finally, Section 5 concludes the paper.
Random forest (RF) [9, 10] is an integrated learning algorithm [11, 12] based on decision trees, proposed by Leo Breiman and Adele Cutler in 2001, which is schematically shown in Figure 1. The key to the RF algorithm is the decision tree. A decision tree is constructed on each training set based on randomly selected features, which is continuously split using specific splitting criteria, such as information gain and Gini coefficient, until a preset condition is reached to stop splitting. When the random forest algorithm is applied for classification, the prediction or regression results are obtained by applying voting or weighted averaging to the prediction results of each decision tree. In addition, in order to reduce the influence of overfitting and random errors on the prediction results, the original data are generally divided into training and test sets, and then the Bootstra method [13] is utilized to extract the training set. RF are capable of handling high-dimensional data and large-scale datasets with high prediction accuracy.
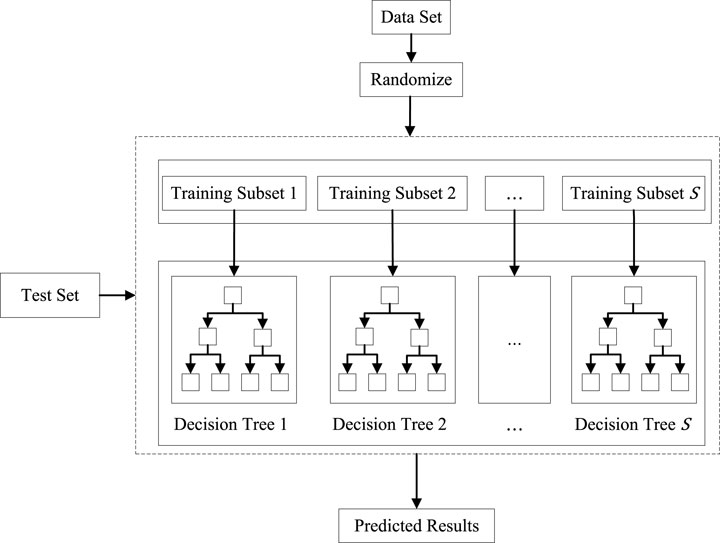
Figure 1. The schematic of RF.
Genetic Algorithm (GA) [14–17] originated from computer simulation studies on biological systems and is a stochastic global search optimization method.It simulates the phenomena of replication, crossover and mutation that occur in natural selection and inheritance. Starting from any initial population, random selection, crossover and mutation operations are performed. Generations of continuous reproduction and evolution, and finally converge to a group of individuals best adapted to the environment, so as to find a high-quality solution to the problem [18]. The key elements to GA are as follows:
(1) Evaluation of individual fitness: the size of individual fitness is used to determine the probability of the individual being inherited into the next-generation of the population. Individuals with higher fitness scores represent better solutions, which are more likely to be selected for reproduction and have traits that will be expressed in the next-generation. As the GA proceeds, the quality of the solution improves, the fitness increases, and the GA is terminated once a solution with a satisfactory fitness value is found [19].
(2) Proportional selection operator: the most commonly used and basic selection operator, it means that the probability of an individual being selected and inherited into the next-generation of the population is directly proportional to the size of that individual’s fitness, and individuals with higher values are more likely to be selected and pass on their genetic material to the next-generation.
(3) Single-point crossover operator: crossover of some chromosomes from the currently selected biparental sample to create two new chromosomes representing the offspring.
(4) Basic positional variation operator: periodic random updates of the population to introduce new patterns into the chromosomes, accomplished by randomly changing one or more chromosome values.
Aiming at the problems of data complexity and lack of accuracy in grid fault prediction, this paper designs a Random Forest (RF) grid fault prediction model based on Genetic Algorithm (GA) optimization (GA-RF), which aims to provide an efficient and accurate fault prediction scheme through the analysis of meteorological factors. The overall method consists of three modules: data pre-processing, GA-RF model building and grid fault prediction. In the data pre-processing module, meteorological and grid fault data are collected and features are selected. In the GA-RF model building module, a training set is used to train the RF, and the parameters in the model are optimized by combining the GA, and the optimized parameters are used to construct the model. In the grid fault prediction module, the test set is used to verify the accuracy of the model, and appropriate preventive measures can be taken based on the prediction results. The method architecture is shown in Figure 2.
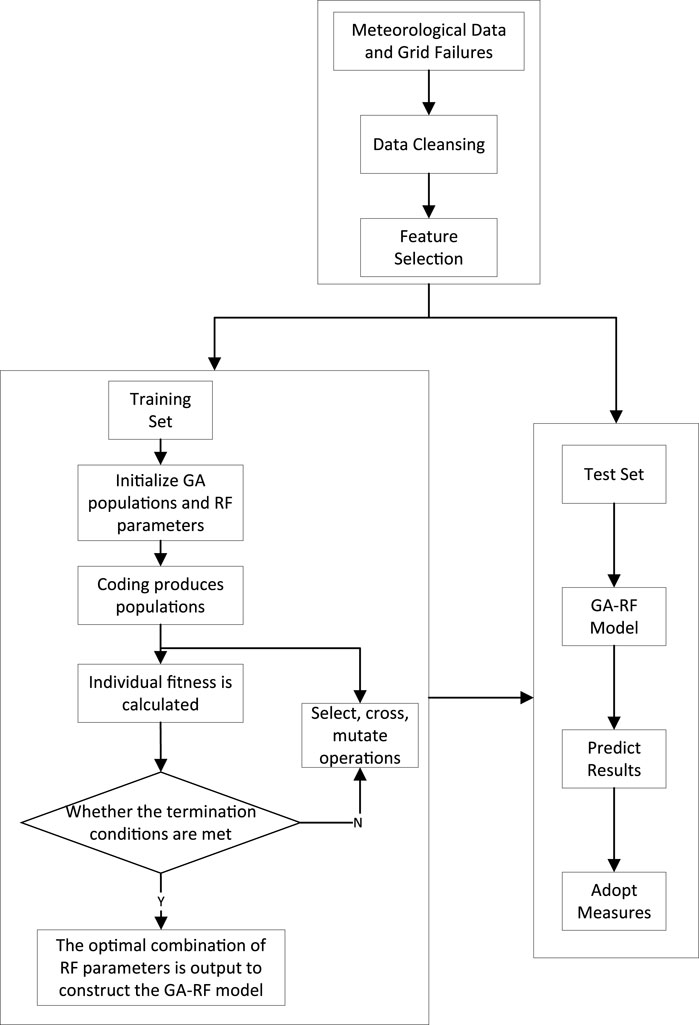
Figure 2. The schematic of random forest fault prediction method based on genetic algorithm optimization.
In the data pre-processing module, the acquired meteorological data are first subjected to data cleaning, followed by feature selection of the cleaned data using the random forest algorithm. During this process, we address the issue of missing values. We use an interpolation method based on the temporal and spatial characteristics of the meteorological data. For example, for a missing value at a specific time and location, we consider the values of adjacent time points and nearby locations with similar meteorological patterns to estimate the missing value. This approach takes into account the inherent continuity and correlation of meteorological variables such as temperature, humidity, and wind speed. After data cleaning, the random forest algorithm [20] is applied for feature selection. Subsequently, a 7:3 ratio is adopted to split the data into training and testing sets. The 70% training set enables the model to capture more complex patterns. Our experiments show that a smaller training set leads to a decline in model accuracy and generalization. The 30% testing set offers an adequate and unbiased evaluation, ensuring validation on unseen data and preventing overfitting. Additionally, this ratio aligns with machine learning norms, facilitating comparisons with related studies.
The Gini index is a metric used to assess the purity of data. In the decision tree model, when we perform node splitting through a certain feature, the Gini index will reflect the effectiveness of the feature in improving the classification accuracy.
A specific variable (feature) can significantly reduce the difference in the Gini index before and after splitting, meaning that this feature plays a key role in better classifying the sample into different categories. Therefore, this suggests that these features play an important role in distinguishing between different categories. Selecting meteorological attributes that have a stronger correlation with grid faults can help the model predict more effectively.
In the feature selection section, with
where
Let the set of nodes in which feature vector
Therefore, the importance score of feature vector
Our meteorological data are taken from Yangzhou Electric Power Company. As shown in Table 1, a total of 21 categories of meteorological factors are used as inputs to the feature vectors of the random forest algorithm, i.e.,
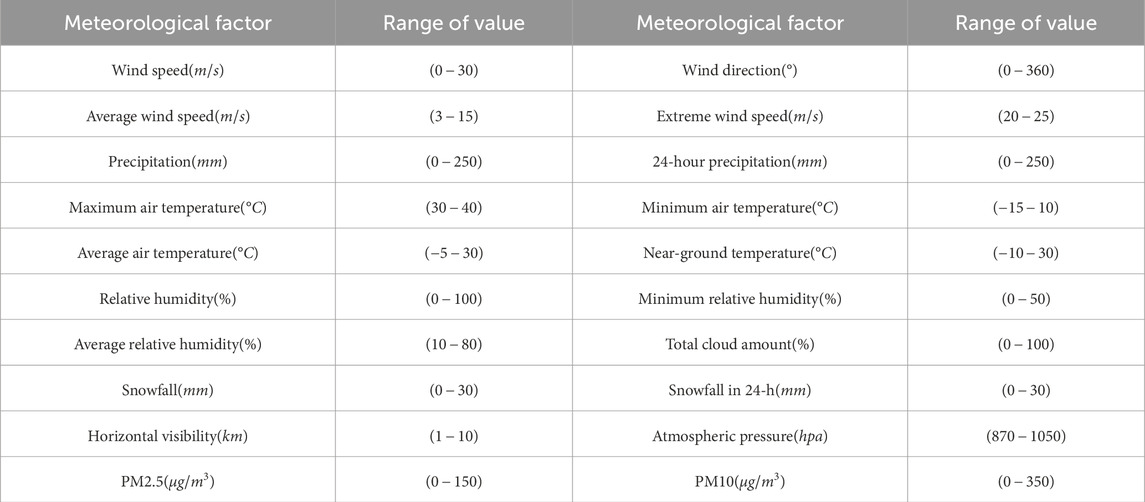
Table 1. Relevant meteorological factors and their range of values.
The training data obtained after data processing is trained using RF and combined with GA to optimize the four hyperparameters in the RF model, which are: the number of decision trees
In the GA-RF model, a
We use the precision rate after macro averaging
where
The fitness function of individual
Firstly, a set of initial parameter codes are randomly generated within the range of values of the hyperparameters to be optimized in the RF, forming an initial population
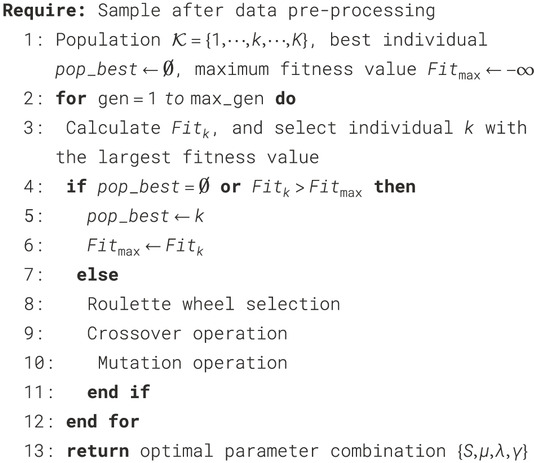
Algorithm 1.GA-RF.
The environment configured for this experiment is as follows: the operating system is Windows 11, the computer processor is 13th Gen Intel (R) Core (TM) i9-13900HX, the RAM is 2.20 GHz and 16 GB RAM, and the Python version is 3.12. In this paper, we simulate 3,000 records of grid fault types, and the samples are indexed in rows by date, containing 21 characteristic variables such as wind speed, precipitation and temperature, as shown in Table 1. The daily fault occurrence type is the dependent variable, which is normal (0), wind fault (1), ice-covered fault (2), pollution fault (3), and rain damage fault (4). The characteristic variables play a key role in our research, Which are closely related to the occurrence of grid faults. For example, strong winds may lead to wind faults (1), and heavy rain may cause rain damage faults (4). By analyzing and incorporating these characteristic variables into the model, we can better understand the causes of grid faults and improve the accuracy of predicting grid fault types. The data is organized and applied to the prediction of grid fault types. The sample sizes of grid fault types in the test set are 617, 584, 566, 620 and 613, respectively.
In order to effectively illustrate the real effect of this model and accurately predict grid faults, the accuracy rate
where
In order to verify the effectiveness of the method proposed in this paper, the traditional Random Forest (RF) [21], Support Vector Machine (SVM) [22], Linear Regression (LR) [23] and the GA-RF proposed are used as the fault prediction models.
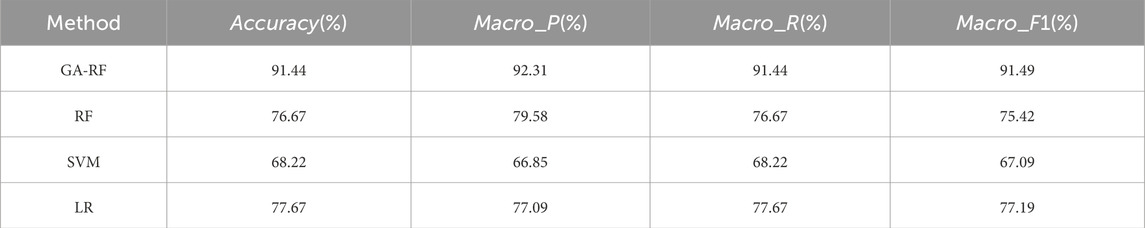
Table 2. Comparison of assessment indicators.
As can be seen from Table 2, the
In this experiment, by optimizing random forest with genetic algorithm, we can not only adjust the parameters of random forest better, but also select the feature subset with the most predictive ability, thus improving the prediction accuracy and stability of the model. These results not only prove the effectiveness of genetic algorithm in optimizing machine learning models, but also highlight the application of this method in electricity Potential and application value in network fault prediction task.
According to the classification results of the model in 3,000 datasets, the predicted power grid fault types are taken as “Normal (0)” and “Wind Fault (1)” respectively, and the ROC curves of GA-RF and RF are made, as shown in Figure 3. The abscissa of the curve shows the proportion of prediction error (FP) in all negative samples, and the ordinate shows the proportion of prediction correctness (TP) in all positive samples. From the figure, it can be seen that the AUC area of the GA-RF is 0.96 and 0.99 for predicting the results of category 0 and category 1, respectively, and the AUC area of the RF is 0.86 and 0.98 for predicting the results of category 0 and category 1, respectively. The AUC area of the GA-RF in predicting the results of category 0 and category 1 is higher than that of the RF, which has a higher degree of accuracy and differentiation.
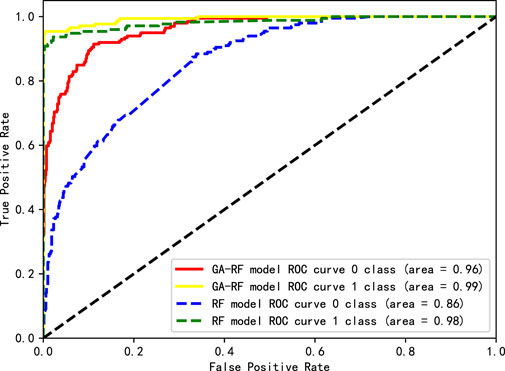
Figure 3. ROC curve on 3,000 datasets.
As shown in Figure 4, 5, the results of GA-RF on 3,000 datasets are compared with the experimental results of RF on 4,000 and 5,000 datasets. The AUC area of GA-RF and RF prediction category 1 reaches 0.99, which shows that GA-RF can achieve the same effect as RF prediction category 1 with less datasets. However, even if more data sets are used, the accuracy of RF in predicting category 0 is still not as good as GA-RF.
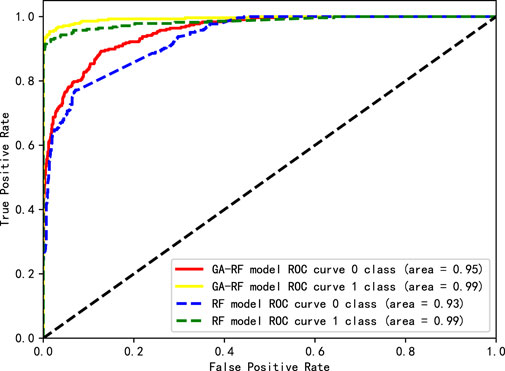
Figure 4. ROC curves of GA-RF on 3,000 datasets and RF on 5,000 datasets.
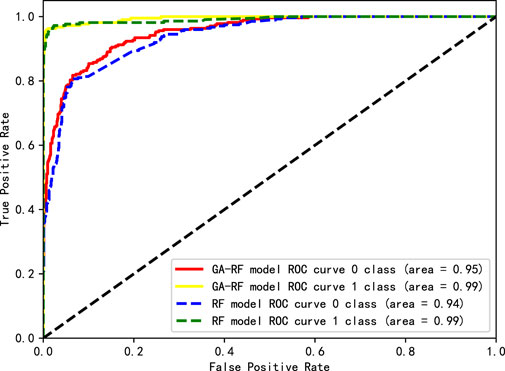
Figure 5. ROC curves of GA-RF on 3,000 datasets and RF on 4,000 datasets.
The GA-RF model performs better than RF model on ROC curve, which is due to the optimization of key aspects of the model by genetic algorithm, including feature selection, hyperparameter adjustment, ensemble learning effect and generalization ability improvement. This analysis result can provide guidance for further improving and optimizing the model, so as to obtain better prediction performance and application effect.
Figure 6 shows the results of the Root Mean Square Error (RMSE) calculation for the four models on the test set. From the figure, it can be seen that the GA-RF has the lowest root mean square error value of 0.1878. The RF has a slightly higher error than the GA-RF in the prediction task. The SVM, as a traditional machine learning model, has the largest root mean square error value. The LR has an average prediction effect with an error value between the RF and the SVM. Therefore, the results based on the root mean square error values show that the GA-RF performs the best in predicting the grid fault types with higher prediction accuracy and smaller error compared to the other models.
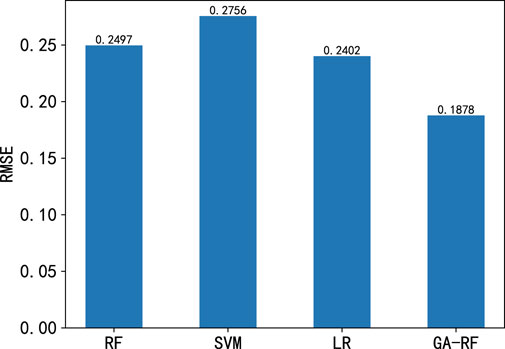
Figure 6. The schematic of RMSE calculations.
Error analysis further shows the effectiveness of this method in power grid fault prediction, proves the practicability of this method in power grid operation safety and reliability, and also provides powerful decision support for power system managers to help them effectively manage and optimize power grid operation.
Using GA to optimize parameters may increase the initial calculation cost, because GA needs to find the optimal superparameter combination through multiple generations of selection, crossover, mutation and other operations. However, this process can effectively reduce the evaluation of invalid parameter combinations, thus reducing unnecessary calculations in the subsequent stage. The overall calculation cost will be lower than RF. The training time of SVM is closely related to the number and dimension of samples. Especially in the case of high dimensions, the computational complexity increases exponentially. Very consuming computing resources and time. LR is usually a relatively lightweight model with the lowest computational cost. However, its high dependence on feature selection means that the performance of the model may be limited in some cases.
This paper collects and analyzes power grid fault types and meteorological data, and establishes a Random Forest (RF) grid fault prediction model based on Genetic Algorithm (GA) optimization (GA-RF).
• The integration of Genetic Algorithm (GA) with Random Forest (RF) for meteorological fault prediction in power grids is a novel approach. GA is used to optimize the hyperparameters of RF, which significantly improves the model’s performance. This combination allows for a more accurate and comprehensive prediction of power grid faults compared to traditional models like RF, SVM, and LR, as demonstrated by the enhanced evaluation metrics such as
• The utilization of meteorological variables along with fault types enriches the dataset, providing a more in-depth understanding of the complex relationships that lead to power grid failures. This multi-faceted dataset approach is an important contribution as it can potentially guide more targeted grid management and preventive measures.
The GA-RF shows good prediction performance in grid fault prediction, which has a broad application prospect and provides an effective tool and method for grid management and operation. However, further research and practice are still needed to verify the reliability and stability of the model. And more optimization strategies and model improvement methods are also explored to meet the ever-changing demands and challenges of the grid system. As the power sector increasingly seeks smart and resilient solutions, the continued evolution of such models will play a critical role in shaping the future of grid management and reliability.
The raw data supporting the conclusions of this article will be made available by the authors, without undue reservation.
KL: Formal Analysis, Investigation, Methodology, Visualization, Writing–original draft. YG: Data curation, Formal Analysis, Resources, Software, Supervision, Writing–review and editing. LT: Project administration, Software, Supervision, Visualization, Writing–review and editing. YD: Methodology, Resources, Software, Validation, Visualization, Writing–review and editing. CZ: Conceptualization, Formal Analysis, Funding acquisition, Methodology, Software, Validation, Writing–original draft. JZ: Conceptualization, Data curation, Investigation, Project administration, Resources, Supervision, Visualization, Writing–original draft, Writing–review and editing.
The author(s) declare that financial support was received for the research, authorship, and/or publication of this article. The authors declare that this study received funding from Science and Technology Project of State Grid Jiangsu Electric Power Co., Ltd. The funder was not involved in the study design, collection, analysis, interpretation of data, the writing of this article, or the decision to submit it for publication.
Authors KL, YG, LT, and YD were employed by The Information and Communication Branch of State Grid Jiangsu Electric Power Co., Ltd. Author CZ was employed by Yangzhou Power Supply Branch of State Grid Jiangsu Electric Power Co., Ltd.
The remaining author declares that the research was conducted in the absence of any commercial or financial relationships that could be construed as a potential conflict of interest.
All claims expressed in this article are solely those of the authors and do not necessarily represent those of their affiliated organizations, or those of the publisher, the editors and the reviewers. Any product that may be evaluated in this article, or claim that may be made by its manufacturer, is not guaranteed or endorsed by the publisher.
1. Kemikem D, Boudour M, Benabid R, Tehrani K. Quantitative and qualitative reliability assessment of reparable electrical power supply systems using fault tree method and importance factors. In: 2018 13th annual conference on system of systems engineering (SoSE), USA, 19-22 June 2018, (2018). p. 452–8. doi:10.1109/SYSOSE.2018.8428729
2. Ardito C, Deldjoo Y, Noia TD, Sciascio ED, Nazary F. Visual inspection of fault type and zone prediction in electrical grids using interpretable spectrogram-based cnn modeling. Expert Syst Appl (2022) 210:118368. doi:10.1016/j.eswa.2022.118368
3. Zhang K. Research on grid fault early warning method Based on meteorological factors. Master’s thesis. Beijing: North China Electric Power University (2024).
4. Li M. Design and implementation of grid disaster risk early warning analysis system. Master’s thesis. China, University of Electronic Science and Technology of China (2021).
5. Xu A. An early warning method for power grid meteorological disasters based on scene classification and recognition. Master’s thesis. Shandong University (2021).
6. Huang C, Wang D, Yin S, Xu M, Tang C. Early warning of transmission and substation equipment failure based on meteorological data mining. The J New Industrialization (2016) 6:33–9. doi:10.19335/j.cnki.2095-6649.2016.05.006
7. Zhou X, Fan M, Yuan X, Shu W. Research on distribution network fault characterization mining and fault forecasting by integrating meteorological information. Power Syst Big Data (2020) 23:72–9. doi:10.19317/j.cnki.1008-083x.2020.12.010
8. Kou Z, Liu T, Liu X, Zhao J, Feng R, He W. Risk early warning model and realization method of key electric power equipment based on meteorological hazards. Inner Mongolia Electric Power (2021) 39:10–4+39. doi:10.19929/j.cnki.nmgdljs.2021.0092
9. Che Z, Lv F. Research on integration algorithm based on random forest. In: Computer programming skills and maintenance (2024). p. 48–50+80. doi:10.16184/j.cnki.comprg.2024.05.009
10. Zhang Y, Kong J, Cui Y, Li X. Research on hard disk failure rate prediction based on random forest. Softw Eng (2024) 27:74–8. doi:10.19644/j.cnki.issn2096-1472.2024.003.015
11. Xu J, Yang Y. A survey of ensemble learning approaches. J Yunnan Univ (Natural Sci Edition) (2018) 40:1082–1092. doi:10.7540/j.ynu.20180455.369
12. Luo C, Wang S, Yin J, Zhu S, Lin B, Cao J. Research status and prospect of ensemble learning. J Command Control (2023) 9:1–8. doi:10.3969/j.issn.2096-0204.2023.01.0001
13. Luo K, Zhang Y, He Y, Huang Z. Bootstrap sample partition data model and distributed ensemble learning. Big Data Res (2024) 10:93–108. doi:10.11959/j.issn.2096-0271.2024002
14. Li Y, Yuan H, Yu J, Zhang G, Liu K. Review on the application of genetic algorithm in optimization problems. Shandong Ind Technol (2019) 242–3+180. doi:10.16640/j.cnki.37-1222/t.2019.12.210
15. Wu C, Chen K, Yao J. Research on logistics distribution path optimization based on improved adaptive genetic algorithm. Computer Meas Control (2018) 26:236–40. doi:10.16526/j.cnki.11-4762/tp.2018.02.058
16. Jin L, Liu X, Li P, Wang Y. Overview of genetic algorithms. China, Scientific China people (2015). p. 230.
17. Ma X, Li Y, Yan L. Comparsion review of traditional multi-objective optimization methods and multi-objective genetic algorithm. Electric drive automation (2010) 32:48–50+53. doi:10.3969/j.issn.1005-7277.2010.03.012
18. Mei H, Zhang D, Wang Z, Xia T, Zhang Y, Fu Y. Analysis of the temperature prediction method of transmission line tension-resistant clamps based on bp neural network optimized by genetic algorithm. Appl IC (2023) 40:268–9. doi:10.19339/j.issn.1674-2583.2023.09.123
19. Rodrigues NM, Batista JE, Cava WL, Vanneschi L, Silva S. Exploring SLUG: feature selection using genetic algorithms and genetic programming. SN Computer Sci (2023). 5:91. doi:10.1007/s42979-023-02106-3
20. Le TT, Fu W, Moore JH. Scaling tree-based automated machine learning to biomedical big data with a feature set selector. Bioinformatics (2019) 36:250–6. doi:10.1093/bioinformatics/btz470
21. Chaudhari A, Khandelwal H, Khan A, Kurade O, Kolekar A. Mineral prediction using random forest classifier. In: 2023 14th international conference on computing communication and networking technologies (ICCCNT), China, 6-8 July 2023, (2023). p. 1–6. doi:10.1109/ICCCNT56998.2023.10306952
22. Baghaee HR, Mlakić D, Nikolovski S, Dragicević T. Support vector machine-based islanding and grid fault detection in active distribution networks. IEEE J Emerging Selected Top Power Electronics (2020) 8:2385–403. doi:10.1109/JESTPE.2019.2916621
23. Cheng J, Guo X, Yang J. Prediction and operation design of elderly care market based on multiple linear regression and regional clustering. In: Proceedings of the 5th international conference on information technologies and electrical engineering, New York, NY, USA, 24-25 Nov. 2021, Association for Computing Machinery (2023). p. 183–8. doi:10.1145/3582935.3582966
Keywords: power grid, random forest, genetic algorithm, fault prediction, gini index
Citation: Liu K, Gu Y, Tang L, Du Y, Zhang C and Zhu J (2025) Random forest grid fault prediction based on genetic algorithm optimization. Front. Phys. 13:1480749. doi: 10.3389/fphy.2025.1480749
Received: 14 August 2024; Accepted: 07 February 2025;
Published: 04 March 2025.
Edited by:
Francisco Rodrigues, University of São Paulo, BrazilReviewed by:
Lefeng Cheng, Guangzhou University, ChinaCopyright © 2025 Liu, Gu, Tang, Du, Zhang and Zhu. This is an open-access article distributed under the terms of the Creative Commons Attribution License (CC BY). The use, distribution or reproduction in other forums is permitted, provided the original author(s) and the copyright owner(s) are credited and that the original publication in this journal is cited, in accordance with accepted academic practice. No use, distribution or reproduction is permitted which does not comply with these terms.
*Correspondence: Chen Zhang, eWdkemNAanMuc2djYy5jb20uY24=; Junwu Zhu, and6aHVAeXp1LmVkdS5jbg==
Disclaimer: All claims expressed in this article are solely those of the authors and do not necessarily represent those of their affiliated organizations, or those of the publisher, the editors and the reviewers. Any product that may be evaluated in this article or claim that may be made by its manufacturer is not guaranteed or endorsed by the publisher.
Research integrity at Frontiers
Learn more about the work of our research integrity team to safeguard the quality of each article we publish.